41
JUNE 6, 2021 State of Louisiana’s Homeowner Assistance Fund Program DRAFT PLAN

JUNE 6, 2021
State of Louisiana’s
Homeowner Assistance Fund Program
DRAFT PLAN

H OME OWNE R ASSISTANCE FUND PLAN - DRAFT I
TABLE OF CONTENTS ACRONYMS 1
PROGRAM OVERVIEW 1
STAKEHOLDER ENGAGEMENT 2
NEEDS ASSESSMENT 3
PROGRAM DESIGN 13
PERFORMANCE GOALS 21
READINESS 22
BUDGET 23
EXHIBITS 24

H OME OWNE R ASSISTANCE FUND PLAN - DRAFT 1
Acronyms ACS – U.S. Census American Community Survey
AMI – Area Median Income
DOA – Division of Administration
FHA – Federal Housing Administration
HAF – Homeowner Assistance Fund
HUD – United State Department of Housing and Urban Development
LHC – Louisiana Housing Corporation
LMI – Low- to Moderate-Income
OCD – Louisiana Office of Community Development
USDA – United States Department of Agriculture
VA – United States Department of Veterans Affairs
Program Overview The Homeowner Assistance Fund (HAF) was established to mitigate financial hardships associated with the coronavirus pandemic by providing funds to eligible entities for the purpose of preventing homeowner mortgage delinquencies, defaults, foreclosures, loss of utilities or home energy services, and displacements of homeowners experiencing financial hardship after January 21, 2020, through qualified expenses related to mortgages and housing.
The State of Louisiana will receive an allocation of $146.7 million in Homeowner Assistance Funds to distribute to homeowners in need across the state. To maximize the impact of this funding the state is planning to serve homeowners with a targeted approach, beginning with those with the most immediate needs. A needs assessment has been conducted to inform program design and target populations throughout the state.

H OME OWNE R ASSISTANCE FUND PLAN - DRAFT 2
The priority Louisiana HAF program will provide mortgage assistance to eligible households, providing reinstatement payments and payments over time for three key populations: mortgage loans in forbearance, delinquent loans not in forbearance, and loans in foreclosure. These populations will have their unpaid balance and associated fees (if applicable) paid to bring the loan current and to reinstate loans in the foreclosure process. To inform this priority program, the Office of Community Development (OCD) will work with the Louisiana Housing Corporation (LHC) to launch a pilot program aimed at serving homeowners who were recipients of bond and government loans as well as Mortgage Credit Certificates.
Additional programs under consideration will be vetted based on need and available funding after the priority program has launched. The state will take a holistic approach to program offerings, with complementary programs intended to assist homeowners in obtaining manageable future monthly mortgage payment amounts, and to provide support for bringing homes up to safe and healthy living condition standards. These wrap around support programs are intended to be offered along with financial case management and counseling to determine the best path for applicants to obtain a sustainable debt/equity ratio. These may include: Loan Modification Assistance (reduce interest rates, pay down principal), Tax or HOA Lien Assistance, and Home Repair and Maintenance Grants.
Stakeholder Engagement The State of Louisiana conducted the following stakeholder engagement activities during the development of its HAF Plan:
• Posted key plan details on the Louisiana Office of Community Development website for public review.
• Held a virtual stakeholder meeting with Housing Louisiana and certified financial counseling agencies and housing advocates on June 28, 2021.
• Held a virtual stakeholder meeting, July 1, 2021, with legal services organizations working with the most vulnerable populations in the state.
• Held a virtual stakeholder meeting with major loan servicers and retail banks operating in the state on June 28, 2021.
• Advertised the draft plan for public comments, per OCD’s community participation plan.
The public may submit written comments regarding the state’s HAF Plan to [email protected]. Public notices will be issued in local papers of general circulation throughout the state with information about the plan and how to submit a public comment. The plan and information about submitting public comment will also be posted on the OCD website as well as a program designated site, www.LaCovidHousing.com. The state will accept public comments through July 20, 2021 to inform the final HAF plan to be submitted to the U.S. Treasury Department, however, the public may submit comments after that date for consideration.

H OME OWNE R ASSISTANCE FUND PLAN - DRAFT 3
Needs Assessment To design a program that effectively targets eligible homeowners and maximizes the use of critical Homeowner Assistance Funds, the state has developed this data-driven assessment of homeowner needs.
Housing Needs Assessment Methodology The state utilized multiple data sets and various samples of mortgage data from authoritative mortgage industry surveys and the Treasury to assess the extent to which various types of homeowners may be at risk of default, eviction, foreclosure, or housing instability. The primary data source for this assessment was data provided by the Treasury to the state on mortgage distress for forward and reverse mortgages including forbearances or deferrals, delinquencies, defaults, and foreclosure activity. However, because the data from the Treasury only represented a two-thirds sample of existing mortgages, this assessment has been supplemented by additional resources which include, but are not limited to, the following:
• Home Mortgage Disclosure Act (HMDA) loan-level Data
• U.S. Census American Community Survey (Census ACS) 5-Year Estimates
• Mortgage Analytics and Performance Dashboard (MAPD) data compiled by Black Knight, Inc., and Federal Reserve Bank of Atlanta
• Mortgage Bankers Association’s (MBA) National Delinquency Survey for the First Quarter of 2021
• HUD Income Limit Data (Area Median Income - AMI)
• U.S. Department of Housing and Urban Development Comprehensive Housing Affordability Strategy Data
Eligible Homeowners Homeowners are eligible to receive amounts allocated under the HAF if they experienced a financial hardship after January 21, 2020 and have incomes equal to or less than 150% of the area median income.1 HUD develops income limits based on Median Family Income estimates and Fair Market Rent area definitions for each metropolitan area, parts of some metropolitan areas, and each non-metropolitan county. As part of this
1 100% of the area median income for a household means two times the income limit for very low income families, for the relevant household size, as published by the Department of Housing and Urban Development (HUD) in accordance with 42 U.S.C. 1437a(b)(2) for purposes of the HAF. 100% of the median income for the United States means the median income of the United States, as published by HUD for purposes of the HAF. 150% of the area median income for a household means three times the income limit for very low-income families, for the relevant household size, as published by HUD in accordance with 42 U.S.C. 1437a(b)(2) for purposes of the HAF.

H OME OWNE R ASSISTANCE FUND PLAN - DRAFT 4
assessment to support effectiveness at serving households with eligible incomes, the state aggregated HUD income limits by household size and by Parish for 100% and 150% area median income utilizing income limits for public housing in accordance with 42 U.S.C. 1437a(b)(2).2 For households of four members or less, only eight of Louisiana’s 64 Parishes (12.5%) exceed HUD's FY 2021 national median family income for the United States, $79,900 (Exhibit 1).
Homeownership in the State of Louisiana The State of Louisiana is home to an estimated 4,648,7943 people, living in approximately 1,739,497 occupied housing units (Table 1). Approximately 65.61% of households in the state own their homes, with homeownership rates varying considerably amongst parishes. To inform program outreach, both homeowner income by parish as well as homeownership rates by parish will be used in support of targeting eligible populations. Homeowner eligibility as it relates to property eligibility and income eligibility are further expanded upon in the Program Design section of this plan.
Table 1. Housing Units for State of Louisiana
Type Total Units Percent
Owner Occupied 1,141,205 65.61%
Renter Occupied 598,292 34.39%
Total 1,739,497 100%
Data from U.S Census Bureau, 2019 5-year Estimate Tables Table B25003
Socially Disadvantaged Individuals Treasury guidance states that any amount of HAF funding not made available to homeowners that meet the income-targeting (100% AMI) requirement must be prioritized for assistance to socially disadvantaged individuals, with funds remaining after such prioritization being made available for other eligible homeowners not to exceed 150% AMI.
Treasury guidance defines socially disadvantaged individuals as “those who have been subjected to racial or ethnic prejudice or cultural bias because of their identity as a member of a group without regard to their
2 For more information on data utilized, see https://www.huduser.gov/portal/datasets/il.html#2021_data. 3 Population estimate accessed 6/24/2020 from: https://www.census.gov/quickfacts/LA
H OME OWNE R ASSISTANCE FUND PLAN - DRAFT 5
individual qualities. The social disadvantage must stem from circumstances beyond their control. There is a rebuttable presumption that the following individuals are socially disadvantaged: Black Americans, Hispanic Americans, Native Americans, and Asian Americans and Pacific Islanders. In addition, an individual may be determined to be a socially disadvantaged individual in accordance with the procedures set forth at 13 CFR 124.103(c) or (d).” For the purposes of this analysis, the state has further defined socially disadvantaged households as those whose household is composed of any racial or ethnic group besides non-Hispanic White as reported to the Census Bureau.
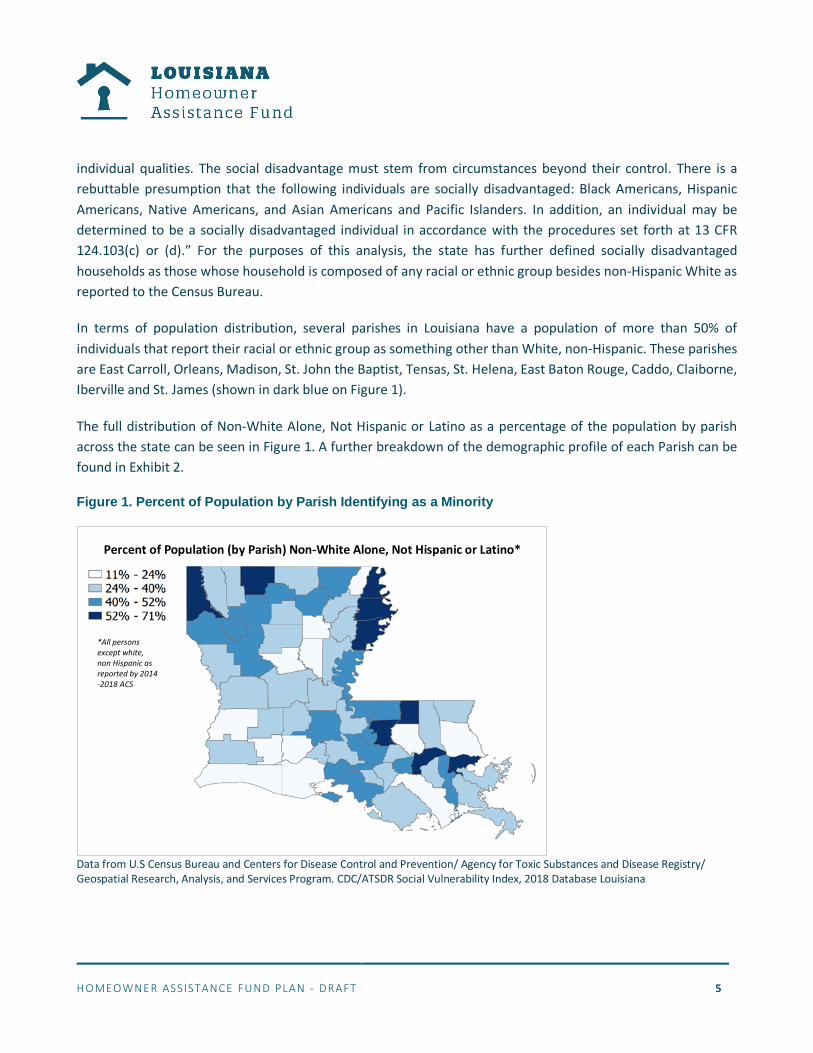
In terms of population distribution, several parishes in Louisiana have a population of more than 50% of individuals that report their racial or ethnic group as something other than White, non-Hispanic. These parishes are East Carroll, Orleans, Madison, St. John the Baptist, Tensas, St. Helena, East Baton Rouge, Caddo, Claiborne, Iberville and St. James (shown in dark blue on Figure 1).
The full distribution of Non-White Alone, Not Hispanic or Latino as a percentage of the population by parish across the state can be seen in Figure 1. A further breakdown of the demographic profile of each Parish can be found in Exhibit 2.
Figure 1. Percent of Population by Parish Identifying as a Minority
Data from U.S Census Bureau and Centers for Disease Control and Prevention/ Agency for Toxic Substances and Disease Registry/ Geospatial Research, Analysis, and Services Program. CDC/ATSDR Social Vulnerability Index, 2018 Database Louisiana
Percent of Population (by Parish) Non-White Alone, Not Hispanic or Latino*
*All persons except white, non Hispanic as reported by 2014 -2018 ACS

H OME OWNE R ASSISTANCE FUND PLAN - DRAFT 6
In terms of homeownership, Socially Disadvantaged Individuals are less likely to own their homes than the general population. The total percentage of all households across the state that are owner-occupied by a householder identifying as Non-White Alone, Not Hispanic or Latino was less than a third at 27.61% (Table 2).
Table 2. Owner Occupied Housing Units by Race and Ethnicity for State of Louisiana
Owner-Occupied Units
% of All Homeowners
Homeownership Rate
White Alone, Not Hispanic or Latino Householder 826,063 72.39% 75.87%
Non-White Alone, Not Hispanic or Latino Householder
315,142 27.61% 48.43%
All Races and Ethnicities 1,141,205 100% 65.61%
Data from U.S Census Bureau, 2019 5-year Estimate Tables B25003, B25003H Despite the fact that Non-White, Not Hispanic or Latino homeowners make up less than a third of the percentage of homeowners statewide, there are several parishes where the percentage is much higher. Orleans Parish, St. John the Baptist Parish and East Carroll Parish all have a percentage of Non-white homeowners greater than 50%. A full breakdown of the total and percentages of owner-occupied units by race/ethnicity for each parish can be found in Exhibit 3. As the state deploys HAF funding, data such as those presented in this section will be used to inform targeting strategies to reach socially disadvantaged populations.
Economic and Housing Distress The COVID-19 pandemic has caused wide-spread economic disruption in Louisiana, including lost income, shuttered businesses, and job loss. For many, this economic shock has had adverse effects on credit health and the ability to make regular mortgage payments.
Economic Distress The economic implications of the COVID-19 pandemic have negatively impacted homeowners throughout the State of Louisiana. Even as the state begins to show signs of recovery, the residual impacts from loss of income can be felt, particularly as it relates to homeowners and their ability to make mortgage payments. As part of the Census Bureau’s most recent Household Pulse Survey, which was designed to collect data on how people’s lives have been impacted by the COVID-19 pandemic, 37,693 Louisiana homeowners reported they had no confidence

H OME OWNE R ASSISTANCE FUND PLAN - DRAFT 7
in their ability to make next month’s mortgage payment and 80,496 reported only slight confidence.4 Of those that reported no confidence, nearly 38% (14,174) reported their household income to be less than $25,000 (Exhibit 4).
As finances are challenged by the impacts of COVID-19, households that were already cost burdened risk falling behind on payments for their home. The U.S. Department of Housing and Urban Development (HUD) receives data from the U.S. Census Bureau’s American Community Survey (ACS) referred to as the Comprehensive Housing Affordability Strategy. These data are used to inform the extent of housing problems and housing needs, particularly for low-income households.5 A household is defined as experiencing housing cost burden when that household pays more than 30% of its gross income towards housing costs including utilities. Even before COVID-19, Louisiana homeowners were experiencing a high level of cost burden, with around 18% of households considered as such (Table 3). The table below shows the breakdown of homeowner households experiencing housing cost burden by available HUD Area Median Family income category information.
Table 3. Percent of Homeowner Households with Housing Cost Burden by Income Category
Income by Cost Burden (Owners only) % of Owners that are Cost Burdened (at least 30%)
Household Income <= 30% HUD Area Median Family Income 63%
Household Income >30% to <=50% HUD Area Median Family Income 40%
Household Income >50% to <=80% HUD Area Median Family Income 29%
Household Income >80% to <=100% HUD Area Median Family Income 20%
Household Income >100% HUD Area Median Family Income 5%
Total 18% Data from HUD CHAS 2013 – 2017, Table 8 for Louisiana
HUD defines cost burden as the ratio of housing costs to household income. For owners, housing cost is "select monthly owner costs", which includes mortgage payment, utilities, association fees, insurance, and real estate
4 U.S Census Bureau Week 31 Household Pulse Survey: May 26 – June 7, Table 2a. Confidence in Ability to Make Next Month's Payment for Owner Occupied Housing Units, by Select Characteristics 5 https://www.huduser.gov/PORTAL/datasets/cp/CHAS/bg_chas.html

H OME OWNE R ASSISTANCE FUND PLAN - DRAFT 8
taxes. The state reserves the right to include other appropriate costs associated with homeownership in determining cost burden for purposes of plan implementation.
Housing Distress The data used to measure housing distress in Louisiana come from several key sources. These sources are: data provided to the state by the Treasury compiled from Black Knight Data & Analytics LLC (provided by the RADAR Group at the Federal Reserve Bank of Philadelphia), Federal Housing Finance Agency Low Income Areas and HUD ZIP-Tract crosswalk (2021Q1), a sample population of 250 Louisiana Housing Corporation (LHC) loans containing Standard Mortgage Delinquency Information, Market Trends Report and Federal Home Loan Bank of Atlanta calculations using Black Knight’s McDash Flash daily mortgage performance data, and MBA’s Quarterly National Delinquency Survey for Q1 2021.
MBA’s Quarterly National Delinquency Survey The Mortgage Bankers Association National Delinquency Survey is a nationally recognized source on residential mortgage delinquency and foreclosure rates. While it does not represent the entire U.S market, it is based on a comprehensive sample of approximately 39 million mortgage loans serviced by mortgage companies, commercial banks, thrifts, credit unions and others. The National Delinquency Survey provides up-to-date delinquency and foreclosure statistics at the national, regional, and state levels for a universe of all loans (government backed and conventional). It further provides a subset of data for conventional loans only (defined as non-government backed loans). This survey was used as an initial assessment for the status of Louisiana’s mortgage market. The data was reviewed to determine the rates of delinquency and foreclosure for all loans and then, specifically, for conventional loans alone. The assessment identifies a universe of 436,972 loans which includes 310,881 conventional loans statewide. The total amount of all loans with installments past due at any stage was 40,595. The total number of loans with installments past due 90 days or more was 25,940. The total number of loans considered seriously delinquent was 31,375 (Table 4). Table 4. National Delinquency Survey Results for State of Louisiana
State of Louisiana
# of Loans Serviced
(From NDS Sample)
Loans with installments Past Due Loans in Foreclosure
Total Percent Total % 30
Days Total
30 Days % 60 Days
Total 60
Days
% 90 Days or More
Total 90 Days or More
% Seriously Delinquent
Total Seriously
Delinquent
All Loans 436,972 9.29% 40,595 2% 8,739 0.91% 3,976 6.39% 25,940 7.18% 31,375
Convention Loans
310,881 6.80% 21,140 1.71% 5,316 0.74% 2,301 4.35% 13,523 5.01% 15,575
Data from MBA’s Quarterly National Delinquency Survey Q1 2021, State of Louisiana Results

H OME OWNE R ASSISTANCE FUND PLAN - DRAFT 9
While the data from MBA’s quarterly survey is useful to understand the universe of loans statewide and the various stages of delinquency and forbearance, these data are not disaggregated by demographic categories and geographic areas per Treasury guidance published on April 14, 2021. In the state’s effort to develop the present needs assessment, no singular authoritative source of total mortgage and delinquency data, either for the U.S housing market or the State of Louisiana, could be located. In addition, according to guidance from the National Council of State Housing Agencies included in the Homeowner Assistance Fund Model Plan published on May 17, 2021, grantees are encouraged to rely on data provided by the Treasury related to mortgage distress for the development of HAF plans. For this reason, and to inform housing need at a more granular level, the state has focused much of the needs assessment on the data provided by the Treasury derived from Black Knight Data & Analytics LLC and the RADARGroup at the Federal Reserve Bank of Philadelphia along with the sample of loans provided by the Louisiana Housing Corporation. These data are analyzed in the section below.
Treasury Data from Black Knight Data & Analytics LLC Data provided to the state from the Treasury included a sample of 141,940 loans statewide captured in a Federal Reserve Bank Mortgage Dashboard which arises from an approximate two-thirds sample of the entire U.S. mortgage market. These data are categorized by both income and demographic based metrics such as rural, urban, low income, non-low income, high minority, and low minority. While the Treasury data did not include definitions for rural and urban, the Census Bureau defines urban areas as those that represent densely developed territory, and encompass residential, commercial, and other non-residential urban land uses. Rural is defined by the Census Bureau as all population, housing, and territory not included within an urban area.6 Low-income individual is one earning less than 50% of the area median income, or a median family income that is less than 50%, in the case of a geographic area.7 Table 5 shows the breakdown of the statewide loan sample by various statistics.
Table 5. Louisiana Mortgage Market Statistics from Treasury Sample
Statewide Rural Urban Low-Income Non-Low-
Income High
Minority Low
Minority
141,940 14,506 127,434 34,805 106,746 47,895 93,656
From this universe of loans, the data also capture the forbearance rate and delinquency rate, respectively. Forbearance rate is the percentage of active loans that the servicer has indicated are in forbearance while the delinquency rate is the percentage of active loans that the servicer has indicated are 30 days past due, but not
6 From U.S Census Bureau: https://www.census.gov/programs-surveys/geography/guidance/geo-areas/urban-rural.html 7 From Federal Reserve, Community Reinvestment Act (CRA) https://www.federalreserve.gov/consumerscommunities/cra_resources.htm

H OME OWNE R ASSISTANCE FUND PLAN - DRAFT 10
in forbearance. From this sample of the market, the forbearance rate was 6.5% for a total of 9,226 loans in forbearance. The delinquency rate was 3.3% with a total of 4,648 loans in delinquency. Combined this represents 13,910 loans that are either in forbearance or delinquent (Table 6) for the State of Louisiana based on the Treasury’s sample size.
Table 6. Louisiana Mortgage Status (From Treasury Sample of U.S Mortgage Market)
Statewide Forbearance Rate
Total in Forbearance
Delinquency Rate
Total in Delinquency
Estimated Total in Forbearance or
Delinquency 141,940 6.5% 9,226 3.3% 4,684 13,910
Data provided to State by the Treasury compiled from Black Knight Data & Analytics LLC (provided by the RADAR Group at the Federal Reserve Bank of Philadelphia), Federal Housing Finance Agency Low Income Areas files and HUD ZIP-Tract crosswalk (2021Q1)
This population of 13,910 loans was used as a basis for determining program maximum award amounts as the state considers how to most effectively administer the funding allocated by the Treasury.
Treasury Data on Government Backed Loans In addition to the sample of loans provided statewide, the Treasury data also includes information on loans in forbearance or delinquent by lender, specifically for federally backed loans from the Federal Housing Administration (FHA), United States Department of Agriculture (USDA) or Veterans Affairs (VA). These data include total number of loans in forbearance and include an additional layer of detail with the race and ethnicity of the borrower. The state used this sample of government backed loans from the Treasury’s data to assess the share of borrowers in forbearance based on race and ethnicity. The state found that Black borrowers represented 43% of all FHA loans that were in forbearance in the sample (Table 7).
Table 7. Louisiana Loans in Forbearance Totals and with Respect to Socially Disadvantaged Individuals (From Treasury Sample of FHA, USDA and VA loans)
Black Borrowers Hispanic
Borrowers Other Minority
Borrowers (Combined)
Loan Type Active Loans Total Loans in Forbearance Total Percent Total Percent Total Percent
Federal Housing Administration
123,166 11,951 5,162 43% 486 4% 1,097 9%

H OME OWNE R ASSISTANCE FUND PLAN - DRAFT 11
United States Department of Agriculture
43,866 2,637 931 35% 34 1% 68 3%
Veterans Affairs 42,455 3,359 1,129 34% 132 4% 60 2%
Data provided to State by the Treasury compiled from Black Knight Data & Analytics LLC (provided by the RADAR Group at the Federal Reserve Bank of Philadelphia), Federal Housing Finance Agency Low Income Areas files and HUD ZIP-Tract crosswalk (2021Q1)
The median annual income for households with loans in forbearance from the Treasury data sample was $51,096 for FHA loans, $56,500 for USDA loans, and the median monthly income was $4,309 for VA loans. This statistic is important for the state to understand with respect to income eligibility and prioritization of funds discussed in the Program Design section of this document.
Using the data provided, the state also reviewed the total delinquent amounts in forbearance for USDA and VA loans. The data provided from the Treasury did not capture total delinquent amount in forbearance for FHA loans. From this sample the state calculated that the average delinquent amount in forbearance per loan was $5,841 for USDA loans and $10,333 for VA loans. The state has used these average amounts as part of informing award maximums for HAF funding (Table 8).
Table 8. Average Delinquent Amount in Forbearance for USDA and VA Loans (From Treasury Sample)
Active Loans Loans in
Forbearance Delinquent Amount
in Forbearance
Average Delinquent Amount in Forbearance per
Loan
United States Department of Agriculture 43,866 2,637 $15,401,634 $5,841
Veterans Affairs 42,455 3,359 $34,708,816 $10,333
Data provided to State by the Treasury compiled from Black Knight Data & Analytics LLC (provided by the RADAR Group at the Federal Reserve Bank of Philadelphia), Federal Housing Finance Agency Low Income Areas files and HUD ZIP-Tract crosswalk (2021Q1)
Loans from Louisiana Housing Corporation Sample To further inform award amounts and program design, the state also reviewed a sample set of 250 loans from the Louisiana Housing Corporation (LHC) portfolio of government backed loans to understand the average months delinquent, and average amount in delinquency payments. The average time for delinquency was seven months with an average delinquent amount due of $7,684 (Table 9).

H OME OWNE R ASSISTANCE FUND PLAN - DRAFT 12
Table 9. Average Delinquent Amount Due for Sample of LHC Loans
Total Louisiana Housing Corporation Loans in Sample
Average Principal, Interest, Taxes, and Insurance (Per Month)
Average Months Delinquent
Average Delinquent
Amount Due 250 $965 7 $7,684
Data from Louisiana Housing Corporation and Louisiana Housing Finance Agency, 2021
The state then took the average delinquent amount due from the LHC loan portfolio sample ($7,684), and the average delinquent amount in forbearance per loan for the sample of USDA ($5,841) and VA ($10,333) loans provided by the Treasury to calculate an average delinquent amount across the three values. The average delinquent amount across the loan sample averages was found to be $7,953 (Table 10).
Table 10. Average Delinquent Amounts Across LHC, USDA and VA Loan Data Samples
Average Delinquent Amount Due from LHC
Sample
Average Delinquent Amount in Forbearance
per USDA Loan from Treasury Sample
Average Delinquent Amount in Forbearance
per VA Loan from Treasury Sample
Average Delinquent Amount Across Loan
Samples
$7,684 $5,841 $10,333 $7,953
While the loan portfolios utilized in the assessment to arrive at average delinquent amounts may not represent the entirety of the market, they demonstrate significant need across the state, especially among low- to middle-income households.
Geographic Distribution of Forbearance and Delinquency The state has also utilized the Federal Reserve Bank of Atlanta’s Mortgage Analysis and Performance Dashboard, which captures mortgage performance data from Black Knight, Inc’s McDash Flash daily reports to identify forbearance on active mortgages (one that is current or in any state of delinquency according to the servicer) geographically. This geographic distribution of delinquency / forbearance data throughout the state is critical to understanding where the various samples of data assessed in this plan may be concentrated. Mortgage performance can also be viewed by parish and zip code to understand areas of the state where targeted outreach for the HAF program may be more effective. A full breakdown of the share of mortgages in forbearance or that are delinquent by parish and zip code can be found in Exhibit 5.
The analysis presented on the dashboard is limited to first mortgages (no second liens) with an owner-occupant. For outstanding first mortgages in forbearance, the highest rates are in St. Bernard Parish (13.4%), Cameron Parish (12.5%) and St. Martin Parish (12.7%). The parishes with the highest share of outstanding first mortgages that were 30 or more days past due but are not in forbearance were Winn Parish (10.8%), St. John the Baptist

H OME OWNE R ASSISTANCE FUND PLAN - DRAFT 13
Parish (8.8%) and St. Martin Parish (8.1%). Areas where the rate of non-forborne delinquent mortgages is higher are important to assess and prioritize for outreach as these may be areas with more instances of borrowers who have not received relief during the pandemic either because they could not obtain forbearance or did not seek it out.
Homeowner Needs Assessment Conclusion Based on the data presented in this assessment, there is a clear need for assistance across the state to support the reduction of mortgage delinquency, especially among income eligible and socially disadvantaged homeowners. Because there is no single authoritative data source that captures the entirety of the U.S mortgage market for primary residential homeowner loans, the state has reviewed various data sources that assess samples of mortgage delinquency and forbearance to arrive at a potential range of need. From the Mortgage Bankers Association National Delinquency Survey for Q1 of 2021, the total amount of loans with installments past due at any stage was 40,595 statewide. Loans with installments past due 90 days or more was 25,940. The total amount of loans considered seriously delinquent was 31,375 (Table 4). From the Treasury data which represents an approximate two-thirds sample of the entire U.S. mortgage market the combined total of loans that are either in forbearance or delinquent was 13,910 (Table 6). Because the Treasury data represents a two-thirds sample of the U.S Market, the assessment assumes that 13,910 loans in forbearance or delinquency is the minimum need. Considering the factors detailed above, the proposed programs in the section below have been designed to provide Louisiana homeowners with critically needed assistance as effectively as possible. Using HAF funds to reduce or eliminate homeowner delinquencies, defaults, foreclosures, and displacement, will assist homeowners across the state with financial recovery and to achieve housing stability.
Program Design General Program Information
Overview The state will take a phased approach to the programs it intends to implement with its HAF allocation. The state recognizes and appreciates the flexibility built into the Treasury guidance to allow for a wide array of impactful program benefits. Providing Louisiana residents with support to remain in their homes after the resulting negative financial consequences of the COVID-19 pandemic is paramount. As such, OCD is proposing a priority mortgage assistance program to prevent housing instability in the form of foreclosure, forbearance and delinquency. This program will provide payments to servicers to bring mortgages current and avoid foreclosures.

H OME OWNE R ASSISTANCE FUND PLAN - DRAFT 14
In addition to the mortgage assistance program, OCD is taking a holistic approach to supporting Louisiana homeowners with additional housing services. Several programs are under consideration and described below. The availability of these programs will be dependent upon available funding and further needs assessment following the launch of the priority mortgage assistance program. Further analysis and stakeholder engagement may reveal the need for programs not currently contemplated, and the plan and budget will be updated accordingly to reflect OCD’s HAF program implementation.
Eligibility Requirements
Homeowner Eligibil ity The following requirements apply to applicants under any and all programs to be funded under Louisiana’s HAF program:
• The applicant must currently own and occupy the property as their primary residence.
• The property must be located in Louisiana.
• Household income cannot exceed 150% of the Area Median Income (AMI) based upon U.S. Department of Housing and Urban Development income data.
• Homeowners must describe and attest to financial hardship after January 21, 2020, such as job loss, a reduction in household income, incurred significant costs for health care or experienced other financial hardship due, directly or indirectly, to the Covid-19 outbreak.
Property Eligibil ity To be eligible for HAF assistance, properties must be located in Louisiana, and must be owner-occupied, or in the case of a land contract or contract for deed, occupied by the documented buyer, and may include:
• Single-family (attached or detached) properties;
• Condominium units;
• 1 to 4-unit properties where the homeowner is living in one of the units as their primary residence;
• Manufactured homes permanently affixed to real property and taxed as real estate; or
• Mobile homes not permanently affixed to real property.
It is the state’s intent to use third party data to verify eligibility requirements. If third party verification is not possible, the state may require the collection of additional documentation from the applicant in addition to applicant self-certifications. In the case of documenting occupancy, should third party verification not be possible, it may be determined based on a self-certification and additional documentation provided by the homebuyer, to include any one of the following: driver’s license or state ID, utility bill, phone or internet bill, bank statement, mortgage statement, property tax bill, tax return, deed, or any government issued document

H OME OWNE R ASSISTANCE FUND PLAN - DRAFT 15
that includes name and address. Additionally, the state will explore the use of fact-specific proxy pending further Treasury guidance.
Priority Program: Louisiana COVID-19 Mortgage Assistance Program
Connection to Needs Assessment The needs assessment provided in this plan, along with guidance from U.S. Treasury, highlights the need for the state to prioritize mortgage assistance with its HAF allocation. The needs assessment found that, at a minimum, 13,910 loans are either in forbearance or delinquent (this number is based on the Treasury data sample). Additionally, survey data found that 37,693 Louisiana homeowners reported they had no confidence in their ability to make next month’s mortgage payment and 80,496 reported only slight confidence. To address the needs of these homeowners, the state proposes the following Mortgage Assistance Program to be funded with the state’s HAF allocation.
Program Overview The Mortgage Assistance Program is targeted for eligible low- and moderate-income residents. Assistance will be prioritized in accordance with the parameters outlined in the “Targeting HAF Funding” Section of this plan.
The program will consider three main populations of need:
• loans in forbearance;
• loans not in forbearance but delinquent; and,
• loans in foreclosure.
These populations will have their unpaid balance and associated fees (if applicable) paid to bring the loan current and for foreclosures to reinstate.
Assistance provided through the program will be applied in the following order of priority:
• Mortgage/housing loan reinstatement (including escrows) or payments to make loan current, with possible advance payments available
• Property taxes and homeowner’s insurances (hazard and mortgage), if escrowed
• Condominium/homeowners’ association fees, if escrowed
• For those in foreclosure, legal services will be provided if legal representation has not been retained

H OME OWNE R ASSISTANCE FUND PLAN - DRAFT 16
Additional Programs Under Consideration
Connection to Needs Assessment Mortgage reinstatement and the prevention of defaults, delinquencies and foreclosure through the mortgage assistance program will be prioritized with the state’s HAF allocation. However, should funding be available, the state knows that taking a comprehensive approach will support Louisiana homeowners long-term. This may include services to support homeowners in obtaining a sustainable monthly mortgage payment, tax lien assistance, or grants for repairs to ensure homeowners remain in safe and healthy living conditions.
To inform the distribution of initial funds, the state relied on data available related to key indicators for housing instability including data on mortgage delinquencies and forbearance with respect to income and demographics. The state will continue to evaluate housing data and to engage with stakeholders to determine the level of interest and need for these types of support services. Further data collection and assessment will be needed to understand additional indicators of housing insecurity such as unemployment, loss of utilities or home energy services, property tax delinquencies, and other related debts. The state will further evaluate data related to these factors in order to determine which additional services would best serve Louisiana homeowners.
Overview Following the successful launch of the Mortgage Assistance Program, additional housing stability support programs will be vetted based on need, and may include the following priority activities:
• Loan Modification Assistance (e.g., principal or interest reduction)
• Lien Assistance (e.g., property tax or HOA lien)
• Housing Repairs and Maintenance
• Homeowner and Flood Insurance Payment Assistance
These programs are intended to maintain housing stability for homeowners impacted by the COVID-19 pandemic. Whereas the priority Mortgage Assistance Program will focus on reinstatement and the prevention of delinquency and foreclosure, the additional support programs under consideration are intended to help homeowners achieve sustainable monthly mortgage payments and maintain safe and healthy living conditions.
In order to substantiate the need for these programs, OCD will conduct additional data analysis and needs assessment to design successful programs. This may result in additional programs not yet contemplated. Additional eligibility criteria and individual program caps for maximum assistance may be determined as the State of Louisiana moves forward with additional programming.

H OME OWNE R ASSISTANCE FUND PLAN - DRAFT 17
Application Process
Online Application The application and intake process will be designed and operated in an accessible manner to avoid barriers to equitable access and to allow for maximum flexibility. Homeowners will be able to apply through a mobile friendly online portal that will allow for the upload of all supporting documents. Language accessible options will also be provided for those who do not use English as their primary language.
Program Assistance Centers OCD will work with local housing and community organizations to establish program assistance centers to serve as in-person sites where homeowners who require additional assistance can receive support with submitting the online application.
Eligibility Review Applications will be reviewed for eligibility (qualified financial hardship after January 21, 2020; own home; occupy home as primary residence; income, delinquency, etc.). As stated previously, it is the state’s intent to use third party data verification to help expedite the application review process. Where third party data verification is not possible or not available, self-certification and document submission by the applicant will be required.
Conditions, Limitations, and Maximum Assistance The Maximum Per Household assistance that can be provided under the mortgage assistance program is currently contemplated to be $10,000. Individual program caps may be established as further data analysis is performed and additional programs are launched. Should additional data analysis provide evidence for additional need, OCD reserves the right to adjust the maximum assistance cap.
Other conditions and limitations will be further defined in program policies and procedures, and exception requests will be reviewed on a case-by-case basis. Any requests for an exception to this policy must be made in writing and include a justification for exceeding the maximum award amount or other policy requirements.
Payment Process OCD will work closely with Loan Servicers and other financial institutions to arrange for direct payments on behalf of program applicants. OCD will utilize the Common Data File (a data file being compiled by the National Council for State Housing Agencies) to help facilitate payment. This common data file will contain data for loan

H OME OWNE R ASSISTANCE FUND PLAN - DRAFT 18
servicers that state agencies will utilize as the primary mechanism for payment. In the event a loan servicer’s information is not captured in the Common Data File, the state will work to establish a similar payment method directly.
For supplemental support services under consideration, as well as in the rare cases that mortgage assistance payments cannot be made directly to the loan servicer, OCD will consider making payments directly to the homeowner. These direct payments will require additional coordination with and documentation from the homeowner applicant.
Other Available Assistance The state, through the Louisiana Housing Corporation, is also available to assist to homeowners who may need additional or different assistance to ensure housing stability, including:
Homebuyer Counselors The Louisiana Housing Corporation understands the value of homeownership in our communities, and the costs and obligations that come with it. That is why it is part of its mission to prepare potential homeowners as they make this investment so they can make the most of it. Homeownership Education Counseling Programs can help homeowners understand the rights, privileges, and responsibilities of homeownership.
Low-Income Home Energy Assistance Program (LIHEAP) In keeping with its mission to ensure that every Louisiana resident is granted an opportunity to obtain safe, affordable, energy-efficient housing, the LHC offers information on the Low-Income Home Energy Assistance Program (LIHEAP). LIHEAP is a federally funded program that helps low-income households with their home energy bills. The LIHEAP program may provide bill payment assistance and/or energy crisis assistance.
Lead Safe Housing & Health Homes Louisiana Housing Corporation (LHC) and the Louisiana Department of Health’s (LDH) Healthy Homes and Childhood Lead Poisoning Prevention Program have partnered in the administration of the Lead-Based Paint Hazard Control Grant. The objective of the grant is to create healthy living conditions for children under the age of six, educating the public on hazards of lead poisoning, identifying children with a Blood-Lead Level (BLL) greater than 5 (five) and leveraging other resources such as Weatherization Assistance funding, when possible, to make additional improvements to the dwelling.

H OME OWNE R ASSISTANCE FUND PLAN - DRAFT 19
Targeting HAF Funding In accordance with Treasury Guidance, not less than 60% of amounts made available to each HAF participant must be used for qualified expenses that assist homeowners having incomes equal to or less than 100% of the area median income or equal to or less than 100% of the median income for the United States, whichever is greater. Any amount not made available to homeowners that meet this income-targeting requirement must be prioritized for assistance to socially disadvantaged individuals, with funds remaining after such prioritization being made available for other eligible homeowners.
To meet these requirements, the following groups will be considered for prioritization.
Government Loan and Affordable Housing Portfolios In accordance with HAF Guidance and recognizing that homeowners earning up to 100% of the area median income are overrepresented in portfolios of government-backed and guaranteed mortgages compared to the market as a whole, OCD and LHC will prioritize assistance to homeowners with FHA, VA, and USDA mortgages and homeowners who have mortgages made with proceeds of mortgage revenue bonds or other mortgage programs that target low- and moderate-income homeowners.
Targeting will include outreach to mortgage programs that serve low- and moderate-income homeowners, including LHC’s own portfolio.
Additional outreach to banks, servicers, CDCs, CDFIs, and other non-profits that offer affordable housing programs to low, very low- and moderate-income homebuyers will be implemented to ensure targeting efforts are robust.
Socially Disadvantaged Applicants Socially disadvantaged individuals are those who have been subjected to racial or ethnic prejudice or cultural bias because of their identity as a member of a group without regard to their individual qualities. The social disadvantage must stem from circumstances beyond their control. There is a rebuttable presumption that the following individuals are socially disadvantaged: Black Americans, Hispanic Americans, Native Americans, and Asian Americans and Pacific Islanders. In addition, an individual may be determined to be a socially disadvantaged individual in accordance with the procedures set forth at 13 CFR 124.103(c) or (d).
Applicants who fit the definition of socially disadvantaged or who have members of their household who are socially disadvantaged will be considered for prioritization. OCD and Treasury, through its program guidance, recognize the important of prioritization of this population, that may not have government-backed loans, but are nonetheless vulnerable.

H OME OWNE R ASSISTANCE FUND PLAN - DRAFT 20
Underserved Areas as defined by Federal Housing Finance Agency (FHFA) In addition to the priority groups identified in the Treasury Guidance, OCD may consider prioritization by census tracts that are considered “underserved areas” by the FHFA.
The Safety and Soundness Act defines these as:
a) census tracts or block numbering areas in which the median income does not exceed 80% of area median income (AMI)
b) families with income not greater than 100% of AMI who reside in minority census tracts (A “minority census tract” is a census tract that has a minority population of at least 30% and a median income of less than 100% of the AMI)
c) families with income not greater than 100% of AMI who reside in designated disaster areas
Applicants with Disabilities Finally, applicants who are disabled or who have members of their household who are disabled may also be considered for prioritization.
Outreach Methods for Targeted Populations The state will leverage its relationships with loan servicers to connect with targeted populations. OCD plans to provide these servicers with resources such as FAQs, logos, and website content that can easily be shared and promoted to their customers in need of assistance.
In addition to coordinating with loan servicers, there will be a user-friendly website for the program that will contain helpful user guides and checklists. The program will leverage media and community partners, including legal aid and the faith-based community, to promote program awareness to target audiences. Press releases and social media channels will also be utilized to ensure the diverse population of Louisiana homeowners are informed about program offerings. OCD will also coordinate with other state agencies that are currently serving LMI household to ensure those populations are educated about program benefits. Outreach will also likely entail in-person outreach events and intake sessions to support applicants who may have more limited access to technology or the internet.

H OME OWNE R ASSISTANCE FUND PLAN - DRAFT 21
Best Practices and Coordination with Other HAF Participants The state is committed to leveraging existing best practices and coordinating with other HAF participants in order to provide the highest level of service and assistance to Louisiana homeowners in need. These efforts include:
• Participation in regular HAF calls with other states
• Membership in National Council of State Housing Agencies (NCSHA)
• Coordination with mortgage servicers (banks and other financial institutions) and related associations
• Coordination with housing agencies and legal services
• Coordination with representatives from federal agency partners including FHA, VA and USDA to insure it is meeting its outreach goals to these mortgage holders
Performance Goals The state will leverage its HAF allocation to reduce mortgage delinquency among targeted populations and socially disadvantaged populations. In order to gauge performance towards this goal, OCD will track performance through the evaluation of the number of households served and the dollar amount of assistance with respect to the following metrics:
• Reduced mortgage delinquency
• Assisted homeowners to exit forbearance plans
• Reinstated previously delinquent mortgage loans
• Number of households served and the dollar amount of assistance for mortgage loans in Government Loans and Affordable Housing portfolios
• Number of households served and the dollar amount of HAF assistance applied to assist homeowners at or below 100% AMI, 80% AMI, and 50% AMI or below
• Timeline for applicant to receive assistance, from initial intake through payment processing.
As necessary and appropriate, and when data is available, performance goals will be disaggregated by mortgage type, racial and ethnic demographics, and geographic area.

H OME OWNE R ASSISTANCE FUND PLAN - DRAFT 22
Readiness Staffing and Systems The state will have the capacity to implement the HAF program and is in the process of procuring via a solicitation for offers a comprehensive program management contract. As of the drafting of this plan, the selection process is underway, and a contract is projected to be in place before submission of the plan to Treasury. After vendor selection, OCD and the selected vendor will work quickly to finalize policies and procedures for the operation of the program. These detailed policies and procedures will include specifics on verifying applicant eligibility, eligible homeowner costs, payment processes, applicant prioritization of funds, quality control review, and required reporting.
Quality Control OCD will design a quality control process to provide reasonable assurance of program integrity that will include a random and/or targeted selection of case reviews after eligibility determination and prior to funding. The number of random and targeted applications selected may be modified over the course of the program as determined necessary based on prior quality control findings and observations.
A quality control team will be dedicated to reviewing applications determined to be eligible, prior to payment. This quality control team may also review applications that are under appeal or that have filed a grievance with the program. OCD will leverage contracts and quality control standard operating procedures already established and successfully utilized on its other federally funded grant programs.
Contracts and Partnerships OCD will leverage contractors and establish partnerships to ensure timely program delivery, compliance, and reporting:
• Contractors - The state is in the process of procuring via a solicitation for offers a comprehensive program management contract. As of the drafting of this plan, the selection process is underway, and a contract is projected to be in place before submission of the plan to Treasury.
• Partners – the state will partner with the follow organizations in order to carry out necessary program delivery activities and outreach:
o Housing and financial counsellors
o Other non-profits and social services agencies

H OME OWNE R ASSISTANCE FUND PLAN - DRAFT 23
o LHC, DOA
o Mortgage Loan Servicers and Retail Banks
o Other state agencies which can supply third party data to facilitate program implementation (e.g., Louisiana Workforce Commission)
Existing and Pilot Programs OCD and LHC intend to launch a pilot program that will be a scaled version of the priority mortgage assistance program detailed in this plan. LHC, the largest state issuer of single-family mortgage revenue bonds, will be able to address the targeted populations efficiently. It will do so in conjunction with other state bond issuers, including but not limited to Capital Area Finance Authority (CAFA), Jefferson Parish and Calcasieu Parish, to target homebuyers who were recipients of bond and government loans as well as Mortgage Credit Certificates. The early phase of the mortgage assistance program will work with local master servicers, including, but not limited to Standard Mortgage Corporation, as well as national HFA servicers, such as, USBank, to identify eligible recipients, in order to reinstate a mortgage or to pay expenses related to the period of forbearance, delinquency or default.
The established guidelines will mirror what is anticipated in the state’s priority mortgage assistance plan, including maximum assistance, threshold eligibility requirements, and repayment terms (if any). During the administration of the program, data will continue to be collected in order to better identify the nature and extent of needs specific to Louisiana residents.
Budget To be determined. At the drafting of this plan, the U.S. Treasury has not yet provided HAF Participants with a budget template.
Total HAF Allocation $146,668,557
Available for Direct Assistance $124,668,273
Administration Budget (15%) $22,000,284

H OME OWNE R ASSISTANCE FUND PLAN – DRAFT 24
Exhibit 1 U.S Department of Housing and Urban Development 100% and 150% Area Median Income (AMI) Limits by Household Size and Parish
Total # of Persons in Household
100% AMI 150% AMI Parish 1 2 3 4 5 6 7 8 1 2 3 4 5 6 7 8
Acadia 39,700 45,300 51,000 56,600 61,200 65,700 70,200 74,800 59,550 67,950 76,500 84,900 91,800 98,550 105,300 112,200 Allen 40,900 46,700 52,500 58,300 63,000 67,700 72,300 77,000 61,350 70,050 78,750 87,450 94,500 101,550 108,450 115,500
Ascension 55,600 63,500 71,400 79,300 85,700 92,000 98,400 104,700 83,400 95,250 107,100 118,950 128,550 138,000 147,600 157,050 Assumption 43,100 49,200 55,400 61,500 66,500 71,400 76,300 81,200 64,650 73,800 83,100 92,250 99,750 107,100 114,450 121,800
Avoyelles 35,800 40,900 46,000 51,100 55,200 59,300 63,400 67,500 53,700 61,350 69,000 76,650 82,800 88,950 95,100 101,250 Beauregard 47,200 54,000 60,700 67,400 72,800 78,200 83,600 89,000 70,800 81,000 91,050 101,100 109,200 117,300 125,400 133,500
Bienville 33,900 38,800 43,600 48,400 52,300 56,200 60,100 63,900 50,850 58,200 65,400 72,600 78,450 84,300 90,150 95,850 Bossier 41,700 47,600 53,600 59,500 64,300 69,100 73,800 78,600 62,550 71,400 80,400 89,250 96,450 103,650 110,700 117,900 Caddo 41,700 47,600 53,600 59,500 64,300 69,100 73,800 78,600 62,550 71,400 80,400 89,250 96,450 103,650 110,700 117,900
Calcasieu 45,300 51,800 58,300 64,700 69,900 75,100 80,300 85,500 67,950 77,700 87,450 97,050 104,850 112,650 120,450 128,250 Caldwell 33,900 38,800 43,600 48,400 52,300 56,200 60,100 63,900 50,850 58,200 65,400 72,600 78,450 84,300 90,150 95,850
Cameron 45,300 51,800 58,300 64,700 69,900 75,100 80,300 85,500 67,950 77,700 87,450 97,050 104,850 112,650 120,450 128,250 Catahoula 41,800 47,700 53,700 59,600 64,400 69,200 74,000 78,700 62,700 71,550 80,550 89,400 96,600 103,800 111,000 118,050 Claiborne 33,900 38,800 43,600 48,400 52,300 56,200 60,100 63,900 50,850 58,200 65,400 72,600 78,450 84,300 90,150 95,850 Concordia 33,900 38,800 43,600 48,400 52,300 56,200 60,100 63,900 50,850 58,200 65,400 72,600 78,450 84,300 90,150 95,850 De Soto 41,700 47,600 53,600 59,500 64,300 69,100 73,800 78,600 62,550 71,400 80,400 89,250 96,450 103,650 110,700 117,900
East Baton Rouge 55,600 63,500 71,400 79,300 85,700 92,000 98,400 104,700 83,400 95,250 107,100 118,950 128,550 138,000 147,600 157,050

H OME OWNE R ASSISTANCE FUND PLAN – DRAFT 25
Total # of Persons in Household
100% AMI 150% AMI Parish 1 2 3 4 5 6 7 8 1 2 3 4 5 6 7 8
East Carroll 33,900 38,800 43,600 48,400 52,300 56,200 60,100 63,900 50,850 58,200 65,400 72,600 78,450 84,300 90,150 95,850 East
Feliciana 55,600 63,500 71,400 79,300 85,700 92,000 98,400 104,700 83,400 95,250 107,100 118,950 128,550 138,000 147,600 157,050
Evangeline 33,900 38,800 43,600 48,400 52,300 56,200 60,100 63,900 50,850 58,200 65,400 72,600 78,450 84,300 90,150 95,850
Franklin 33,900 38,800 43,600 48,400 52,300 56,200 60,100 63,900 50,850 58,200 65,400 72,600 78,450 84,300 90,150 95,850 Grant 42,400 48,400 54,500 60,500 65,400 70,200 75,100 79,900 63,600 72,600 81,750 90,750 98,100 105,300 112,650 119,850 Iberia 39,700 45,300 51,000 56,600 61,200 65,700 70,200 74,800 59,550 67,950 76,500 84,900 91,800 98,550 105,300 112,200
Iberville 42,400 48,400 54,500 60,500 65,400 70,200 75,100 79,900 63,600 72,600 81,750 90,750 98,100 105,300 112,650 119,850 Jackson 36,200 41,400 46,600 51,700 55,900 60,000 64,200 68,300 54,300 62,100 69,900 77,550 83,850 90,000 96,300 102,450
Jefferson 49,100 56,100 63,100 70,100 75,800 81,400 87,000 92,600 73,650 84,150 94,650 105,150 113,700 122,100 130,500 138,900 Jefferson
Davis 39,900 45,600 51,300 56,900 61,500 66,100 70,600 75,200 59,850 68,400 76,950 85,350 92,250 99,150 105,900 112,800
La Salle 47,900 54,800 61,600 68,400 73,900 79,400 84,900 90,300 71,850 82,200 92,400 102,600 110,850 119,100 127,350 135,450 Lafayette 47,400 54,100 60,900 67,600 73,100 78,500 83,900 89,300 71,100 81,150 91,350 101,400 109,650 117,750 125,850 133,950 Lafourche 35,600 40,700 45,800 50,800 54,900 59,000 63,000 67,100 53,400 61,050 68,700 76,200 82,350 88,500 94,500 100,650
Lincoln 40,700 46,500 52,300 58,100 62,800 67,400 72,100 76,700 61,050 69,750 78,450 87,150 94,200 101,100 108,150 115,050 Livingston 55,600 63,500 71,400 79,300 85,700 92,000 98,400 104,700 83,400 95,250 107,100 118,950 128,550 138,000 147,600 157,050
Madison 33,900 38,800 43,600 48,400 52,300 56,200 60,100 63,900 50,850 58,200 65,400 72,600 78,450 84,300 90,150 95,850 Morehouse 33,900 38,800 43,600 48,400 52,300 56,200 60,100 63,900 50,850 58,200 65,400 72,600 78,450 84,300 90,150 95,850
Natchitoches 34,600 39,600 44,500 49,400 53,400 57,400 61,300 65,300 51,900 59,400 66,750 74,100 80,100 86,100 91,950 97,950 Orleans 49,100 56,100 63,100 70,100 75,800 81,400 87,000 92,600 73,650 84,150 94,650 105,150 113,700 122,100 130,500 138,900 Ouachita 40,600 46,400 52,200 57,900 62,600 67,200 71,800 76,500 60,900 69,600 78,300 86,850 93,900 100,800 107,700 114,750
Plaquemines 49,100 56,100 63,100 70,100 75,800 81,400 87,000 92,600 73,650 84,150 94,650 105,150 113,700 122,100 130,500 138,900

H OME OWNE R ASSISTANCE FUND PLAN – DRAFT 26
Total # of Persons in Household
100% AMI 150% AMI Parish 1 2 3 4 5 6 7 8 1 2 3 4 5 6 7 8
Pointe Coupee 55,600 63,500 71,400 79,300 85,700 92,000 98,400 104,700 83,400 95,250 107,100 118,950 128,550 138,000 147,600 157,050
Rapides 42,400 48,400 54,500 60,500 65,400 70,200 75,100 79,900 63,600 72,600 81,750 90,750 98,100 105,300 112,650 119,850 Red River 37,100 42,400 47,700 52,900 57,200 61,400 65,600 69,900 55,650 63,600 71,550 79,350 85,800 92,100 98,400 104,850
Richland 33,900 38,800 43,600 48,400 52,300 56,200 60,100 63,900 50,850 58,200 65,400 72,600 78,450 84,300 90,150 95,850 Sabine 38,400 43,900 49,400 54,800 59,200 63,600 68,000 72,400 57,600 65,850 74,100 82,200 88,800 95,400 102,000 108,600
St. Bernard 49,100 56,100 63,100 70,100 75,800 81,400 87,000 92,600 73,650 84,150 94,650 105,150 113,700 122,100 130,500 138,900 St. Charles 49,100 56,100 63,100 70,100 75,800 81,400 87,000 92,600 73,650 84,150 94,650 105,150 113,700 122,100 130,500 138,900 St. Helena 55,600 63,500 71,400 79,300 85,700 92,000 98,400 104,700 83,400 95,250 107,100 118,950 128,550 138,000 147,600 157,050
St. James 46,400 53,000 59,600 66,200 71,500 76,800 82,100 87,400 69,600 79,500 89,400 99,300 107,250 115,200 123,150 131,100 St. John the
Baptist 49,100 56,100 63,100 70,100 75,800 81,400 87,000 92,600 73,650 84,150 94,650 105,150 113,700 122,100 130,500 138,900
St. Landry 33,900 38,800 43,600 48,400 52,300 56,200 60,100 63,900 50,850 58,200 65,400 72,600 78,450 84,300 90,150 95,850 St. Martin 47,900 54,800 61,600 68,400 73,900 79,400 84,900 90,300 71,850 82,200 92,400 102,600 110,850 119,100 127,350 135,450 St. Mary 37,400 42,700 48,000 53,300 57,600 61,900 66,100 70,400 56,100 64,050 72,000 79,950 86,400 92,850 99,150 105,600
St. Tammany 49,100 56,100 63,100 70,100 75,800 81,400 87,000 92,600 73,650 84,150 94,650 105,150 113,700 122,100 130,500 138,900
Tangipahoa 42,400 48,400 54,500 60,500 65,400 70,200 75,100 79,900 63,600 72,600 81,750 90,750 98,100 105,300 112,650 119,850
Tensas 33,900 38,800 43,600 48,400 52,300 56,200 60,100 63,900 50,850 58,200 65,400 72,600 78,450 84,300 90,150 95,850 Terrebonne 47,400 54,100 60,900 67,600 73,100 78,500 83,900 89,300 71,100 81,150 91,350 101,400 109,650 117,750 125,850 133,950
Union 40,600 46,400 52,200 57,900 62,600 67,200 71,800 76,500 60,900 69,600 78,300 86,850 93,900 100,800 107,700 114,750 Vermilion 45,500 52,000 58,500 65,000 70,200 75,400 80,600 85,800 68,250 78,000 87,750 97,500 105,300 113,100 120,900 128,700 Vernon 42,000 48,000 54,000 59,900 64,700 69,500 74,300 79,100 63,000 72,000 81,000 89,850 97,050 104,250 111,450 118,650
Washington 33,900 38,800 43,600 48,400 52,300 56,200 60,100 63,900 50,850 58,200 65,400 72,600 78,450 84,300 90,150 95,850

H OME OWNE R ASSISTANCE FUND PLAN – DRAFT 27
Total # of Persons in Household
100% AMI 150% AMI Parish 1 2 3 4 5 6 7 8 1 2 3 4 5 6 7 8
Webster 33,900 38,800 43,600 48,400 52,300 56,200 60,100 63,900 50,850 58,200 65,400 72,600 78,450 84,300 90,150 95,850 West Baton
Rouge 55,600 63,500 71,400 79,300 85,700 92,000 98,400 104,700 83,400 95,250 107,100 118,950 128,550 138,000 147,600 157,050
West Carroll 35,000 40,000 45,000 50,000 54,000 58,000 62,000 66,000 52,500 60,000 67,500 75,000 81,000 87,000 93,000 99,000 West
Feliciana 55,600 63,500 71,400 79,300 85,700 92,000 98,400 104,700 83,400 95,250 107,100 118,950 128,550 138,000 147,600 157,050
Winn 33,900 38,800 43,600 48,400 52,300 56,200 60,100 63,900 50,850 58,200 65,400 72,600 78,450 84,300 90,150 95,850 Data from HUD Section 8 Income Limits Effective April 1, 2021, Retrieved from https://www.huduser.gov/portal/datasets/il.html#2021_data.

H OME OWNE R ASSISTANCE FUND PLAN – DRAFT 28
Exhibit 2 Race as Percentage of Population by Parish
Tota
l Pop
ulat
ion
Whi
te A
lone
Blac
k or
Afr
ican
Am
eric
an A
lone
Amer
ican
Indi
an a
nd A
lask
a N
ativ
e Al
one
As
ian
Alon
e
Nat
ive
Haw
aiia
n an
d O
ther
Pa
cific
Isla
nder
Alo
ne
Som
e ot
her r
ace
alon
e
Two
or m
ore
race
s
Two
race
s inc
ludi
ng S
ome
othe
r ra
ce
Two
race
s exc
ludi
ng S
ome
othe
r ra
ce, a
nd th
ree
or m
ore
race
s
State of Louisiana 4664362 62% 32% 1% 2% 0% 1% 2% 0% 2% Acadia Parish 62457 79% 17% 0% 0% 0% 0% 3% 0% 3%
Allen Parish 25618 74% 19% 2% 1% 0% 2% 3% 0% 2%
Ascension Parish 123114 72% 22% 0% 1% 0% 2% 3% 0% 3%
Assumption Parish 22478 67% 30% 0% 0% 0% 1% 1% 0% 1%
Avoyelles Parish 40669 66% 27% 1% 1% 0% 0% 5% 0% 5% Beauregard Parish 37043 83% 12% 0% 0% 0% 0% 3% 0% 3%
Bienville Parish 13564 55% 43% 0% 0% 0% 1% 1% 0% 1%
Bossier Parish 126499 72% 23% 1% 2% 0% 1% 2% 0% 2%
Caddo Parish 245831 46% 49% 0% 1% 0% 1% 2% 0% 2%
Calcasieu Parish 201619 70% 25% 0% 1% 0% 1% 2% 0% 2%
Caldwell Parish 9992 82% 16% 0% 0% 0% 1% 1% 0% 1%
Cameron Parish 6930 93% 3% 1% 1% 0% 1% 1% 0% 1%
Catahoula Parish 9766 67% 32% 0% 0% 0% 1% 0% 0% 0%
Claiborne Parish 15985 46% 52% 0% 0% 0% 1% 1% 0% 1%
Concordia Parish 19778 58% 41% 0% 0% 0% 1% 0% 0% 0%
De Soto Parish 27289 61% 35% 1% 0% 0% 0% 2% 0% 2%
East Baton Rouge Parish 443763 47% 46% 0% 3% 0% 2% 2% 0% 2%
East Carroll Parish 7096 29% 70% 0% 0% 0% 0% 1% 0% 1%
East Feliciana Parish 19371 54% 44% 1% 0% 0% 0% 1% 0% 1%
Evangeline Parish 33589 68% 28% 0% 0% 0% 2% 1% 0% 1%
Franklin Parish 20238 65% 34% 0% 0% 0% 0% 1% 0% 0%
Grant Parish 22340 79% 16% 0% 0% 0% 2% 2% 1% 2%

H OME OWNE R ASSISTANCE FUND PLAN – DRAFT 29
To
tal P
opul
atio
n
Whi
te A
lone
Blac
k or
Afr
ican
Am
eric
an A
lone
Amer
ican
Indi
an a
nd A
lask
a N
ativ
e Al
one
As
ian
Alon
e
Nat
ive
Haw
aiia
n an
d O
ther
Pa
cific
Isla
nder
Alo
ne
Som
e ot
her r
ace
alon
e
Two
or m
ore
race
s
Two
race
s inc
ludi
ng S
ome
othe
r ra
ce
Two
race
s exc
ludi
ng S
ome
othe
r ra
ce, a
nd th
ree
or m
ore
race
s
Iberia Parish 71887 61% 32% 0% 3% 0% 2% 3% 0% 3%
Iberville Parish 32822 50% 48% 0% 0% 0% 1% 2% 0% 2%
Jackson Parish 15879 68% 30% 0% 1% 0% 1% 0% 0% 0%
Jefferson Parish 434850 62% 27% 0% 4% 0% 4% 2% 0% 2%
Jefferson Davis Parish 31441 80% 16% 1% 0% 0% 0% 2% 0% 2%
Lafayette Parish 241973 69% 26% 0% 2% 0% 1% 2% 0% 2%
Lafourche Parish 98108 79% 14% 2% 1% 0% 2% 3% 0% 3%
LaSalle Parish 14936 84% 11% 1% 1% 0% 1% 1% 0% 1%
Lincoln Parish 47246 54% 41% 0% 2% 0% 2% 1% 0% 1%
Livingston Parish 138928 90% 6% 0% 1% 0% 1% 2% 0% 2% Madison Parish 11306 35% 64% 0% 0% 0% 1% 0% 0% 0%
Morehouse Parish 25610 49% 49% 0% 1% 0% 0% 1% 0% 0%
Natchitoches Parish 38769 53% 41% 1% 1% 0% 2% 2% 0% 2%
Orleans Parish 390845 34% 60% 0% 3% 0% 1% 2% 0% 2%
Ouachita Parish 155494 59% 37% 0% 1% 0% 1% 1% 0% 1% Plaquemines Parish 23338 68% 20% 1% 4% 0% 2% 5% 1% 4%
Pointe Coupee Parish 22016 62% 36% 0% 0% 0% 1% 1% 0% 1%
Rapides Parish 130970 63% 32% 1% 1% 0% 1% 2% 0% 2%
Red River Parish 8565 58% 39% 0% 0% 0% 0% 3% 1% 2%
Richland Parish 20350 62% 36% 0% 0% 0% 0% 1% 0% 1% Sabine Parish 23991 69% 16% 7% 0% 0% 1% 7% 0% 7%
St. Bernard Parish 46266 69% 23% 0% 3% 0% 2% 2% 0% 2%
St. Charles Parish 52773 69% 27% 0% 1% 0% 2% 1% 0% 1%
St. Helena Parish 10297 46% 53% 1% 0% 0% 0% 0% 0% 0%
St. James Parish 21308 49% 50% 0% 0% 0% 1% 1% 0% 0%
St. John the Baptist Parish 43242 38% 57% 0% 1% 0% 3% 2% 1% 1%
St. Landry Parish 83172 56% 42% 0% 0% 0% 1% 2% 0% 1%

H OME OWNE R ASSISTANCE FUND PLAN – DRAFT 30
To
tal P
opul
atio
n
Whi
te A
lone
Blac
k or
Afr
ican
Am
eric
an A
lone
Amer
ican
Indi
an a
nd A
lask
a N
ativ
e Al
one
As
ian
Alon
e
Nat
ive
Haw
aiia
n an
d O
ther
Pa
cific
Isla
nder
Alo
ne
Som
e ot
her r
ace
alon
e
Two
or m
ore
race
s
Two
race
s inc
ludi
ng S
ome
othe
r ra
ce
Two
race
s exc
ludi
ng S
ome
othe
r ra
ce, a
nd th
ree
or m
ore
race
s
St. Martin Parish 53732 67% 29% 1% 1% 0% 0% 2% 0% 2%
St. Mary Parish 50968 59% 30% 2% 1% 0% 3% 4% 0% 4%
St. Tammany Parish 255155 83% 12% 1% 2% 0% 1% 2% 0% 2%
Tangipahoa Parish 132057 67% 29% 0% 1% 0% 0% 2% 0% 2%
Tensas Parish 4561 43% 55% 0% 0% 0% 1% 0% 0% 0%
Terrebonne Parish 112054 70% 19% 6% 1% 0% 1% 3% 0% 3%
Union Parish 22353 72% 25% 0% 0% 0% 2% 2% 0% 1%
Vermilion Parish 59865 81% 15% 0% 2% 0% 0% 1% 0% 1%
Vernon Parish 49646 76% 15% 1% 2% 0% 2% 3% 0% 3%
Washington Parish 46435 67% 30% 0% 0% 0% 1% 2% 0% 2% Webster Parish 39242 64% 34% 0% 0% 0% 0% 1% 0% 1%
West Baton Rouge Parish 26101 58% 40% 0% 0% 0% 0% 1% 0% 1%
West Carroll Parish 11041 80% 16% 0% 0% 0% 2% 1% 0% 1%
West Feliciana Parish 15428 53% 44% 0% 1% 0% 0% 1% 0% 1%
Winn Parish 14313 66% 32% 1% 0% 0% 1% 1% 0% 1%
Data from U.S. Census Bureau (2015-2019). Race American Community Survey 5-year estimates.

H OME OWNE R ASSISTANCE FUND PLAN – DRAFT 31
Exhibit 3 Owner Occupied Units by Race/Ethnicity for Each Louisiana Parish
White Alone, Not Hispanic/Latino
Householder Non-White Alone & Not His/Latino
Householder
Total Housing
Units:
Owner occupied
% of All Homeowners
Total Housing
Units:
Owner occupied
% of All Homeowners
Louisiana 1,088,755 826,063 72.39% 650,742 315,142 27.61% Acadia Parish, LA 17,819 13,781 87.19% 4,417 2,025 12.81%
Allen Parish, LA 6,426 4,994 84.56% 1,499 912 15.44%
Ascension Parish, LA 31,299 27,446 78.24% 11,733 7,633 21.76% Assumption Parish, LA 6,017 4,995 74.74% 2,535 1,688 25.26%
Avoyelles Parish, LA 10,591 8,355 79.29% 4,572 2,182 20.71%
Beauregard Parish, LA 11,196 9,038 86.29% 2,324 1,436 13.71% Bienville Parish, LA 3,183 2,725 64.15% 2,629 1,523 35.85%
Bossier Parish, LA 34,751 24,954 79.69% 14,626 6,361 20.31%
Caddo Parish, LA 46,886 35,126 61.24% 48,978 22,232 38.76% Calcasieu Parish, LA 54,292 41,753 79.58% 23,488 10,715 20.42%
Caldwell Parish, LA 3,029 2,468 88.02% 636 336 11.98%
Cameron Parish, LA 2,408 2,119 91.81% 326 189 8.19% Catahoula Parish, LA 2,451 2,162 80.10% 913 537 19.90%
Claiborne Parish, LA 3,023 2,409 61.75% 2,894 1,492 38.25%
Concordia Parish, LA 4,318 3,297 69.60% 2,844 1,440 30.40% De Soto Parish, LA 6,415 5,166 66.95% 4,406 2,550 33.05%
East Baton Rouge Parish, LA 83,083 60,100 61.18% 81,263 38,134 38.82%
East Carroll Parish, LA 696 520 49.48% 1,341 531 50.52% East Feliciana Parish, LA 4,280 3,772 67.30% 2,679 1,833 32.70%
Evangeline Parish, LA 8,581 6,527 81.84% 3,591 1,448 18.16%
Franklin Parish, LA 5,327 4,289 79.43% 2,096 1,111 20.57% Grant Parish, LA 6,088 4,388 91.36% 901 415 8.64%
Iberia Parish, LA 16,428 12,611 70.95% 9,756 5,164 29.05%
Iberville Parish, LA 6,026 5,085 63.51% 4,877 2,922 36.49% Jackson Parish, LA 4,074 3,205 75.63% 1,897 1,033 24.37%

H OME OWNE R ASSISTANCE FUND PLAN – DRAFT 32
White Alone, Not Hispanic/Latino
Householder Non-White Alone & Not His/Latino
Householder
Total Housing
Units:
Owner occupied
% of All Homeowners
Total Housing
Units:
Owner occupied
% of All Homeowners
Jefferson Parish, LA 98,431 72,282 69.70% 71,021 31,420 30.30%
Jefferson Davis Parish, LA 9,188 7,275 85.09% 2,538 1,275 14.91%
Lafayette Parish, LA 64,647 47,185 79.49% 26,896 12,177 20.51% Lafourche Parish, LA 29,818 24,543 86.97% 7,077 3,676 13.03%
LaSalle Parish, LA 4,279 3,435 93.17% 535 252 6.83%
Lincoln Parish, LA 9,832 6,452 70.75% 7,880 2,668 29.25% Livingston Parish, LA 43,525 36,318 91.67% 4,885 3,300 8.33%
Madison Parish, LA 1,517 1,130 55.45% 2,315 908 44.55%
Morehouse Parish, LA 5,178 4,255 65.48% 4,554 2,243 34.52% Natchitoches Parish, LA 7,984 4,628 72.04% 6,675 1,796 27.96%
Orleans Parish, LA 54,620 31,081 41.87% 99,199 43,159 58.13%
Ouachita Parish, LA 34,210 25,108 76.03% 22,346 7,915 23.97% Plaquemines Parish, LA 6,071 4,369 71.21% 2,848 1,766 28.79%
Pointe Coupee Parish, LA 5,563 4,809 70.34% 3,397 2,028 29.66%
Rapides Parish, LA 31,338 22,500 75.20% 17,150 7,422 24.80% Red River Parish, LA 2,060 1,708 68.79% 1,312 775 31.21%
Richland Parish, LA 4,763 3,718 74.70% 2,696 1,259 25.30%
Sabine Parish, LA 6,596 4,766 76.35% 2,562 1,476 23.65% St. Bernard Parish, LA 9,980 7,458 73.41% 5,025 2,702 26.59%
St. Charles Parish, LA 12,997 11,291 72.80% 6,215 4,219 27.20%
St. Helena Parish, LA 1,795 1,604 52.68% 2,062 1,441 47.32% St. James Parish, LA 3,725 3,486 57.17% 3,994 2,612 42.83%
St. John the Baptist Parish, LA 5,977 5,180 43.20% 9,293 6,810 56.80%
St. Landry Parish, LA 17,961 14,213 68.31% 12,524 6,595 31.69%
St. Martin Parish, LA 13,599 11,364 72.99% 6,150 4,205 27.01% St. Mary Parish, LA 12,111 8,123 67.38% 7,745 3,933 32.62%
St. Tammany Parish, LA 76,307 61,747 84.76% 16,655 11,106 15.24%
Tangipahoa Parish, LA 32,617 24,726 75.29% 14,980 8,114 24.71% Tensas Parish, LA 823 675 55.79% 969 535 44.21%
Terrebonne Parish, LA 28,353 22,460 78.57% 11,619 6,126 21.43%
Union Parish, LA 5,548 5,095 82.23% 2,034 1,101 17.77% Vermilion Parish, LA 18,026 14,625 85.80% 4,060 2,420 14.20%

H OME OWNE R ASSISTANCE FUND PLAN – DRAFT 33
White Alone, Not Hispanic/Latino
Householder Non-White Alone & Not His/Latino
Householder
Total Housing
Units:
Owner occupied
% of All Homeowners
Total Housing
Units:
Owner occupied
% of All Homeowners
Vernon Parish, LA 12,708 7,772 82.83% 4,988 1,611 17.17%
Washington Parish, LA 12,017 8,902 74.96% 5,596 2,973 25.04%
Webster Parish, LA 10,390 8,061 72.79% 6,161 3,013 27.21% West Baton Rouge Parish, LA 5,621 4,666 66.23% 4,022 2,379 33.77%
West Carroll Parish, LA 3,324 2,615 83.28% 760 525 16.72%
West Feliciana Parish, LA 2,663 2,175 76.80% 1,206 657 23.20% Winn Parish, LA 3,906 2,978 80.79% 1,577 708 19.21%
Data from U.S Census Bureau, Tables B25003, B25003H
Exhibit 4 Confidence in Ability to Make Next Month’s Payment for Owner-Occupied Housing Units, by Select Characteristics: Louisiana
Select characteristics Total*
Owned free and
clear
Confidence in ability to pay next month's mortgage
Did not report to
tenure
No
conf
iden
ce
Slig
ht c
onfid
ence
Mod
erat
e co
nfid
ence
Hig
h co
nfid
ence
Paym
ent i
s/w
ill b
e de
ferr
ed
Did
not
repo
rt
Hispanic origin and Race
Hispanic or Latino (may be of any race)
69,490 31,868 - 1,054 8,755 18,043 5,682 4,087 54,943
White alone, not Hispanic 1,042,842 419,181 17,293 39,727 103,269 455,003 7,338 1,031 640,269
Black alone, not Hispanic 335,680 159,242 20,400 32,903 22,340 98,785 - 2,011 390,516
Asian alone, not Hispanic 16,900 4,782 - 6,812 1,387 3,919 - - 21,787

H OME OWNE R ASSISTANCE FUND PLAN – DRAFT 34
Select characteristics Total*
Owned free and
clear
Confidence in ability to pay next month's mortgage
Did not report to
tenure
No
conf
iden
ce
Slig
ht c
onfid
ence
Mod
erat
e co
nfid
ence
Hig
h co
nfid
ence
Paym
ent i
s/w
ill b
e de
ferr
ed
Did
not
repo
rt
Two or more races + Other races, not Hispanic
85,283 20,837 - - 13,593 39,751 11,102 - 63,156
Total 1,550,195 635,910 37,693 80,496 149,344 615,501 24,122 7,129 1,170,671 Household Size 1 person in the household 102,417 58,024 3,090 1,054 5,256 34,254 738 - 67,018
2 people in the household 490,016 245,795 2,961 6,592 59,508 161,158 7,904 6,098 297,421
3 people in the household 366,050 131,669 12,363 48,329 29,805 131,752 11,102 1,031 246,056
4 people in the household 306,302 61,586 2,330 18,571 34,544 189,271 - - 306,966
5 people in the household 222,978 115,890 16,949 - 5,108 80,653 4,378 - 114,212
6 people in the household 46,128 6,642 - 5,949 15,124 18,413 - - 47,558
7 or more people in the household
16,304 16,304 - - - - - - 91,440
Household income
Less than $25,000 155,527 114,916 14,174 8,938 3,294 8,524 5,682 - 1,034
$25,000 - $34,999 179,575 114,605 2,223 25,036 7,399 30,312 - - -
$35,000 - $49,999 151,143 75,913 5,551 15,963 15,171 36,322 2,223 - -
$50,000 - $74,999 304,427 125,573 2,330 7,678 44,693 123,415 738 - -
$75,000 - $99,999 193,632 56,493 13,415 - 24,922 98,803 - - -
$100,000 - $149,999 252,371 71,535 - 10,447 31,480 134,530 4,378 - -

H OME OWNE R ASSISTANCE FUND PLAN – DRAFT 35
Select characteristics Total*
Owned free and
clear
Confidence in ability to pay next month's mortgage
Did not report to
tenure
No
conf
iden
ce
Slig
ht c
onfid
ence
Mod
erat
e co
nfid
ence
Hig
h co
nfid
ence
Paym
ent i
s/w
ill b
e de
ferr
ed
Did
not
repo
rt
$150,000 - $199,999 84,344 16,688 - - - 56,554 11,102 - -
$200,000 and above 146,273 32,423 - 2,421 - 111,430 - - -
Did not report 82,903 27,764 - 10,012 22,385 15,613 - 7,129 1,169,637 Source: U.S. Census Bureau Household Pulse Survey, Week 31. *Total includes only individuals who reported living in owner-occupied housing units and excludes those living in different types of housing units, and also those who did not report their housing situation. ** The Census Bureau considers estimated coefficients of variation (standard error divided by the estimate times 100) over 30% to indicate potentially serious data quality issues related to sampling error.

H OME OWNE R ASSISTANCE FUND PLAN – DRAFT 36
Exhibit 5 Mortgage Nonpayments by Parish from Federal Reserve Bank of Atlanta Mortgage Analytics and Performance Dashboard (Map)
Forbearance outstanding
Forb
eara
nce
outs
tand
ing
(est
.)
Non-forborne mortgages 30+ days past due N
on-fo
rbor
ne m
ortg
ages
30+
day
s pa
st d
ue (e
st.)
Forbearance and delinquency for user-selected geographies
Source: Atlanta Fed calculations using Black Knight’s McDash Flash daily mortgage performance data (available also with a two-day lag), U.S. Census Bureau 2017 FIPS Codes
Updated 5/27/2021.

H OME OWNE R ASSISTANCE FUND PLAN – DRAFT 37
Mortgage Nonpayments by Parish from Federal Reserve Bank of Atlanta Mortgage Analytics and Performance Dashboard
Forbearance outstanding
Forb
eara
nce
outs
tand
ing
(est
.)
Non-forborne mortgages 30+ days past due
Non
-forb
orne
mor
tgag
es 3
0+ d
ays
past
due
(est
.)
Forbearance and delinquency for user-selected geographies
Source: Atlanta Fed calculations using Black Knight’s McDash Flash daily mortgage performance data (available also with a two-day lag), U.S. Census Bureau 2017 FIPS Codes
Updated 5/27/2021.

H OME OWNE R ASSISTANCE FUND PLAN – DRAFT 38
Mortgage Nonpayments by Parish from Federal Reserve Bank of Atlanta Mortgage Analytics and Performance Dashboard (Table)
Parish % Forbearance Outstanding % Loans 30+ days past due, not in forbearance
Acadia 8.5 5.2 Allen 9.5 4.4 Ascension 8 3.9 Assumption 6.9 4 Avoyelles 6.2 5 Beauregard 8.8 6.1 Bienville 7.2 4.9 Bossier 6 4.6 Caddo 7.6 6.4 Calcasieu 10.5 4.7 Caldwell 4.3 3.3 Cameron 12.5 7.8 Catahoula 4.7 6.6 Claiborne 5.2 3.4 Concordia 7.5 6.3 De Soto 7.2 5.9 East Baton Rouge 7.7 4.3 East Carroll No Data No Data East Feliciana 7.5 3.7 Evangeline 5.2 4.1 Franklin 7.6 6.8 Grant 4.4 5.1 Iberia 9.7 4.8 Iberville 8.7 6.5 Jackson 3.3 3.7 Jefferson 8.9 4.6 Jefferson Davis 6.1 4.6 La Salle 8.7 4 Lafayette 7.3 4.1 Lafourche 9 5.5 Lincoln 5.4 3.1 Livingston 8 4.2 Madison 6.3 7.3 Morehouse 6.6 6.6

H OME OWNE R ASSISTANCE FUND PLAN – DRAFT 39
Parish % Forbearance Outstanding % Loans 30+ days past due, not in forbearance
Natchitoches 8.3 5.1 Orleans 10.4 4.4 Ouachita 5.8 4.4 Plaquemines 4.6 4.4 Pointe Coupee 7.2 5.5 Rapides 7.1 5.2 Red River No Data No Data Richland 5.4 5.1 Sabine 8.9 7.2 St. Bernard 13.4 5.4 St. Charles 9.7 6 St. Helena 8.3 5.6 St. James 7.4 4.4 St. John the Baptist 9.7 8.8 St. Landry 9.3 6.5 St. Martin 12.7 8.1 St. Mary 6 6 St. Tammany 7 3.3 Tangipahoa 7.8 4.5 Tensas No Data No Data Terrebonne 8.4 5.1 Union 5.7 5.7 Vermilion 9.3 3.5 Vernon 5.4 4.8 Washington 8 3.4 Webster No Data No Data
West Baton Rouge 8.9 5.1 West Carroll 9.9 4.6 West Feliciana 4.8 1.8 Winn 6.5 10.8
Source: Atlanta Fed calculations using Black Knight's McDash Flash daily mortgage performance data (available as a two-day lag), U.S Census Bureau 2017 FIPS Codes. Data as of 5/27/2021 Accessed on 6/27/2021 from: https://www.atlantafed.org/center-for-housing-and-policy/data-and-tools/mortgage-analytics-and-performance-dashboard


