64


State of Texas Plan for Disaster Recovery Amendment No. 1
U.S. Department of Housing and Urban Development (HUD) Section 145 of the Continuing Appropriations Act, 2017
(Pub. L. 114-223, approved September 29, 2016) & Section 101 of the Furthering Continuing and Security Assistance Appropriations Act, 2017 (division A of Pub. L. 114-254,
approved December 10, 2016) & (Pub. L. 115-31, approved May 5, 2017) October 10, 2017
Prepared by Texas General Land Office
Community Development and Revitalization Program 1700 Congress Avenue
Austin, Texas 844.422.2692
Flood Damage in the Houston Region on June 3, 2016 – Photo Courtesy of Twitter.com/GregAbbott_TX

2 | P a g e
Amendment No. 1 This document constitutes the First Amendment to the State of Texas Plan for Disaster Recovery (Action Plan) dated March 10, 2017, for CDBG disaster recovery funds related to the 2016 flood events (DR-4266, DR-4269, and DR-4272). Changes contained in Action Plan Amendment No. 1 are highlighted. This Amendment will:
• Increase the grant amount based on additional funding appropriated. • Establish the objective scoring criteria for the State Competition. • Describe the Method of Distribution Guidelines for the most impacted counties. • Add public schools as eligible applicants. • Replace the term “non-housing” with “infrastructure.”
Changes have been made to the Needs Assessment and State Administered Disaster Recovery Program Sections of the Action Plan. Further, Appendix D – Public Assistance Amounts and Appendix E – Social Vulnerability Index Scores have been added. All other information, requirements, and certifications contained in the Action Plan remain in force unless addressed in this amendment. Action Plan Amendment No. 1 will be posted for the required 14-day comment period. Recipients of the public comment period notice will include but are not limited to, low-income housing advocates and community organizations representing homeless and special needs populations, all mayors, county judges, and tribal leaders in the declared areas.
II. Needs Assessment
The state of Texas needs assessment for the 2016 allocation takes into account a comprehensive set of data sources that cover multiple geographies and sectors. The state will be focusing on the variety of data that help provide a comprehensive understanding of the unmet need across Texas in the housing and infrastructure sectors. Given the extent of counties impacted by the disasters, a part of the unmet need calculations was determined using data provided by the Texas Division of Emergency Management (TDEM) for all applicants. These data come from the Emergency Management Mission Integrated Environment (EMMIE) database. The total projected cost for damages tied to the 2016 disasters is $201,341,450. This results in the state’s unmet need from public assistance totaling $57,885,667 with a resiliency multiplier of 15 percent.

3 | P a g e
Table 1: TOTAL Unmet Need From Public Assistance (PA)
Source: TDEM - Emergency Management Mission Integrated Environment (EMMIE) Database Report CMF Projections as of 1/9/17 The data for housing unmet needs comes from the Federal Emergency Management Agency (FEMA) and the National Emergency Management Information System (NEMIS) database. For the three disaster declarations in 2016, the total FEMA Verified Loss (FVL) is $186,361,160. The state’s unmet need relating to FEMA Individual Assistance (IA) is $88,131,592 with a resilience multiplier of 15 percent. The figure for unmet need was calculated by FEMA as being FVL minus all assistance provided through the National Flood Insurance Program (NFIP), FEMA housing assistance, and Small Business Administration (SBA) assistance, as well as other assistance that could be accounted for. Table 2: TOTAL Unmet Need Relating to Individual Assistance (IA)
Disaster FEMA Verified Loss (FVL)
Unmet Need Resilience Multiplier (15%)
Total Unmet Need
DR-4266 $28,610,533 $7,044,306 $1,056,646 $8,100,952 DR-4269 $93,125,863 $43,544,220 $6,531,633 $50,075,853 DR-4272 $64,624,764 $26,047,641 $3,907,146 $29,954,787 TOTAL $186,361,160 $76,636,167 $11,495,425 $88,131,592
Source: FEMA Report - FIDA_27843_FSA_TX_GLO as of 1/11/17 The unmet need, as identified by the SBA using the total verified loss of households and businesses, is $309,254,300 for housing and $104,720,409 for businesses. These figures also take into consideration a resilience multiplier of 15 percent totaling $40,337,517 for housing data and $13,659,184 for business data.
Disaster Projected Cost 25% Local Match (Unmet Need)
Resilience Multiplier (15%)
Total Unmet Need
DR-4266 $29,331,951 $7,332,988 $1,099,948 $8,432,936 DR-4269 $37,806,554 $9,451,638 $1,417,746 $10,869,384 DR-4272 $134,202,945 $33,550,736 $5,032,610 $38,583,347 TOTAL $201,341,450 $50,335,363 $7,550,304 $57,885,667

4 | P a g e
Table 3: TOTAL Unmet Need Relating to SBA Home Data Disaster SBA Total Verified
Loss (Home Data) Resilience Multiplier (15%)
Total Unmet Need (Home Data)
DR-4266 $41,999,811 $6,299,972 $48,299,783 DR-4269 $129,504,744 $19,425,712 $148,930,456 DR-4272 $97,412,228 $14,611,834 $112,024,062 TOTAL $268,916,783 $40,337,517 $309,254,300
Source: SBA Home Data as of 10/27/16 Table 4: TOTAL Unmet Need Relating to SBA Business Data
Disaster SBA Total Verified Loss (Business Data)
Resilience Multiplier (15%)
Total Unmet Need (Business Data)
DR-4266 $16,314,312 $2,447,147 $18,761,459 DR-4269 $55,241,648 $8,286,247 $63,527,895 DR-4272 $19,505,265 $2,925,790 $22,431,055 TOTAL $91,061,225 $13,659,184 $104,720,409
Source: SBA Business Data as of 10/27/16 FEMA and SBA data alone yield an unmet need for the state of Texas totaling $559,991,968. This estimate only considers FEMA IA and PA estimates, and SBA estimates, and does not take into consideration lost property valuation, sales tax revenue, business interruption costs, unemployment, agricultural losses, and loss of tourism revenue. When considering the impacts of the early 2016 disaster, DR-4255, and the additional unmet need tied to the 2015 disasters, Texas has a quantifiable unmet need of approximately $1 billion. This figure increases to approximately $2 billion when factoring in the above-mentioned components of disaster loss and recovery needs for both 2015 and 2016. Table 5: State's Total Unmet Need (2016)
Sector Unmet Need Amount FEMA IA Unmet Need $88,131,592 FEMA PA Unmet Need $57,885,667 SBA Home Unmet Need $309,254,300 SBA Business Unmet Need $104,720,409 TOTAL Unmet Need $559,991,968
The below information provides an unmet needs foundation and basis, as well as a concise breakdown of how funds should be allocated to the five most impacted counties and the additional 66 counties impacted by these disasters.

5 | P a g e
The state of Texas has been allocated a total of $238,895,000 for the 2016 flooding disasters. A total of five percent ($11,944,750) of these funds will be used for the state’s administration of these funds. Additionally, 10 percent ($23,889,500) of the total allocation will be used for planning activities. After subtracting 15 percent for state administration and planning costs, the remaining funds are to be split between HUD’s most impacted counties of Brazoria, Fort Bend, Harris, Montgomery, and Newton. After the 15 percent deduction, and the one percent deduction for project delivery, these most impacted counties will receive a total of $160,824,122. This leaves the remaining 66 county allocation at $40,206,023, after the reduction of one percent for project delivery, which is explained below. The allocation and method of distribution of the CDBG-DR funds associated with the rest of the state’s 66 counties will be determined in a future Action Plan amendment. A one percent project delivery amount is taken from the total allocation for the most impacted counties; this amount is a total of $1,624,485 for most impacted project delivery. There is also a one percent amount taken from the remaining 66 county allocation; this amount is $406,120 for the state project delivery. The below table provides a breakdown of these funds.1 Table 6: Allocation Breakdown
5 HUD Most Impacted (MI) Counties 5 Most Impacted Counties’ Allocation 160,824,122
State Allocation
Remaining County Allocation (66 Counties) $40,206,023 MI Project Delivery (1% of MI Counties’ Allocation) $1,624,485 State Project Delivery (1% of State’s Allocation) $406,120 State Planning (10%) $23,889,500 State Administration (5%) $11,944,750 Total for MI and State Allocation 238,895,000
1 $8.00 has been removed from the state allocation for the 66 counties so that funds could be distributed amongst the five most impacted counties in order to make the dollar figures whole numbers. Two dollars and fifty cents were also transferred from project delivery to the rest of county allocation to make the project delivery funds whole numbers as well.

6 | P a g e
The CDBG-DR allocations for the 2016 Floods came in three separate allocations from Federal Register, Vol. 81, No. 224, Monday, November 21, 2016, Vol. 82, No.11, Wednesday, January 18, 2017, and Vol. 82, No. 150, Monday, August 7, 2017. Table 6a: Allocation by Appropriation
2016 Floods Breakdown 1st and 2nd Allocation 3rd Allocation TOTAL Allocation
Most Impacted Co Allocation $ 149,628,127 $ 11,195,995 $ 160,824,122 Rest of State Allocation $ 37,407,030 $ 2,798,993 $ 40,206,023 MI Project Delivery (1% of MI Allocation) $ 1,511,395 $ 113,090 $ 1,624,485 State Project Delivery (1% of State Allocation) $ 377,848 $ 28,272 $ 406,120 State Planning (10%) $ 22,226,400 $ 1,663,100 $ 23,889,500 State Administration (5%) $ 11,113,200 $ 831,550 $ 11,944,750
TOTAL $ 222,264,000 $ 16,631,000 $ 238,895,000
A. Pre-Disaster Baseline Data Conditions Before the Disaster Economy: One of the important components of Texas is the way in which its economy functions. Historically, the state has fared rather well in multiple sectors. According to Texas A&M Real Estate Center’s Monthly Review of the Texas Economy for December 2016, “The Texas economy advanced from November as the number of jobs increased by over 6,100 (seasonally adjusted). The service-providing sector carried December's employment growth, mainly in the health, education, and leisure industries, as well as the government sector. The energy sector continued to improve as crude oil and natural gas prices reached their highest levels since 2014. A recovering energy industry may result in more goods-producing jobs in early 2017. The manufacturing industry in Texas performed well for the month; manufacturers reported increased factory activity and employment demands despite a strong U.S. dollar. Additionally, the strong dollar held inflation to a monthly increase of about 2 percent. Housing sales in Texas and its major metros were modest. Housing supply remained constricted, but an increase in statewide building permits hints at supply increases. Overall, the economy appears solid, and expectations are optimistic for 2017.” It is also noted that “Texas' pace of job creation exceeded the nation's in December 2016. Texas gained 213,500 nonagricultural jobs from December 2015 to December 2016, an annual growth rate of 1.8 percent, higher than the

7 | P a g e
nation's employment growth rate of 1.4 percent. The nongovernment sector added 173,400 jobs, an annual growth rate of 1.7 percent, higher the nation's employment growth rate of 1.5 percent in the private sector.” 2
Figure 3: Texas Drought Monitor Environment: While the economic sector is demonstrating strong metrics for the year, the environmental components of the state have still been volatile. Prior to May 2015, Texas experienced a historic drought that began in October 2010 (U.S. Drought Monitor). According to the Office of the State Climatologist, the driest 12-month period on record for Texas was October 2010 to September 2011, with a statewide average of only 11.18 inches of rain.3 From November 15, 2010 through October 31, 2011, a total of 3.9 million acres and approximately 5,900 structures were damaged and/or destroyed during the 2011 wildfire
2 Texas A&M Real Estate Center - https://www.recenter.tamu.edu/articles/technical-report/outlook-for-the-texas-economy
3 The Office of the State Climatologist, Texas A&M University - http://climatexas.tamu.edu/files/osc_pubs/2011_drought.pdf

8 | P a g e
season. Many factors contributed to the record-breaking season, including the La Niña weather pattern that caused extreme drought conditions, high winds from Tropical Storm Lee, and unprecendented high temperatures. These weather conditions, combined with the availability of large amounts of dry fuels, led to the intensity of these wildfires. Bastrop County specifically experienced the most destructive fire, with a final count of 34,457 acres burned and 3,017 homes destroyed and/or severely damaged. The extended drought that Texas experienced made the state susceptible to wildfires and flash flooding. These drought factors contributed to the inability of soils to effectively absorb water runoff. The wildfires also engendered severe flooding by removing vegetation that usually works to slow down and trap rainfall. When the state received record amounts of rain not once but twice in 2016, it created the perfect environment for widespread and severe flooding.
As stated previously, over the past two years Texas has experienced major disaster events including numerous flooding, tornado, and wildfire events; this resulted in six disaster declarations spread over 160 of the state’s 254 counties. The compounding effects seen from the 2015 floods greatly enhanced the damages experienced by counties during the 2016 floods. Following a historic drought across the state, these multiple events in 2015 and 2016 killed multiple people and caused severe damage across nearly half the state, or 134,000 square miles.
Housing: When looking at the housing market in Texas, there remains strong housing demand and a tight supply. As stated by Texas A&M’s Real Estate Center “Months of Inventory of Texas houses settled at 3.6 months (seasonally adjusted); further indicating strong housing demand and tight supply. The nation rested at 4.3 months (around 6.5 months of inventory is considered a balanced housing market). Seasonally adjusted months of inventory in San Antonio (3.4) and Houston (3.6) remained near the state level; but Austin (2.5), Dallas (2.1), and Fort Worth (2.1) exhibited even tighter supply.”4 In an already tight market, the loss of housing associated with the 2016 events only compounded affordability issues in the state.
B. Pre-Disaster Baseline in Common Planning Tools
The State of Texas Consolidated Plan 2015-2019, prepared by the Texas Department of Housing and Community Affairs (TDHCA), contains the housing needs assessment for the state (http://www.tdhca.state.tx.us/board/docs/books/141218-Item1h-2015-2019-
4 Texas A&M Real Estate Center - https://www.recenter.tamu.edu/articles/technical-report/outlook-for-the-texas-economy
9 | P a g e
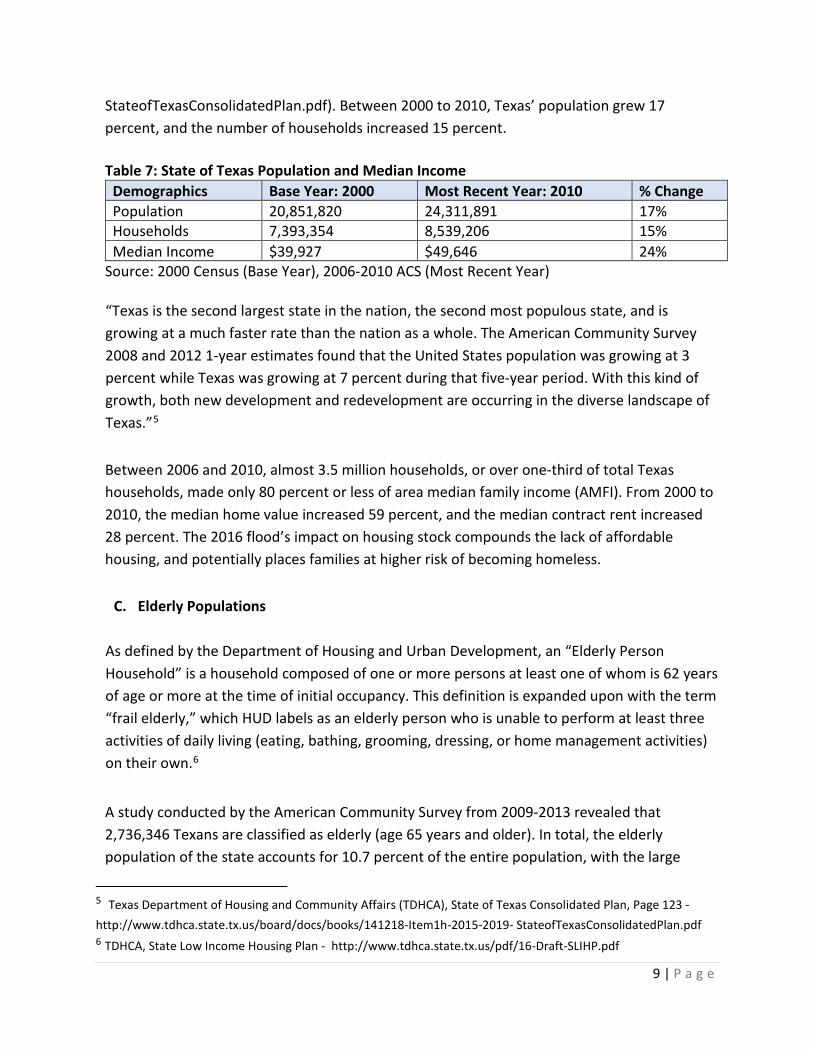
StateofTexasConsolidatedPlan.pdf). Between 2000 to 2010, Texas’ population grew 17 percent, and the number of households increased 15 percent.
Table 7: State of Texas Population and Median Income
Demographics Base Year: 2000 Most Recent Year: 2010 % Change Population 20,851,820 24,311,891 17% Households 7,393,354 8,539,206 15% Median Income $39,927 $49,646 24%
Source: 2000 Census (Base Year), 2006-2010 ACS (Most Recent Year)
“Texas is the second largest state in the nation, the second most populous state, and is growing at a much faster rate than the nation as a whole. The American Community Survey 2008 and 2012 1-year estimates found that the United States population was growing at 3 percent while Texas was growing at 7 percent during that five-year period. With this kind of growth, both new development and redevelopment are occurring in the diverse landscape of Texas.”5 Between 2006 and 2010, almost 3.5 million households, or over one-third of total Texas households, made only 80 percent or less of area median family income (AMFI). From 2000 to 2010, the median home value increased 59 percent, and the median contract rent increased 28 percent. The 2016 flood’s impact on housing stock compounds the lack of affordable housing, and potentially places families at higher risk of becoming homeless.
C. Elderly Populations As defined by the Department of Housing and Urban Development, an “Elderly Person Household” is a household composed of one or more persons at least one of whom is 62 years of age or more at the time of initial occupancy. This definition is expanded upon with the term “frail elderly,” which HUD labels as an elderly person who is unable to perform at least three activities of daily living (eating, bathing, grooming, dressing, or home management activities) on their own.6 A study conducted by the American Community Survey from 2009-2013 revealed that 2,736,346 Texans are classified as elderly (age 65 years and older). In total, the elderly population of the state accounts for 10.7 percent of the entire population, with the large
5 Texas Department of Housing and Community Affairs (TDHCA), State of Texas Consolidated Plan, Page 123 - http://www.tdhca.state.tx.us/board/docs/books/141218-Item1h-2015-2019- StateofTexasConsolidatedPlan.pdf 6 TDHCA, State Low Income Housing Plan - http://www.tdhca.state.tx.us/pdf/16-Draft-SLIHP.pdf

10 | P a g e
majority residing in urban areas. Despite the majority, the rural elderly face unique challenges, as their physical proximity to urban areas makes access to health facilities, community centers, and other amenities more difficult.7
D. Pre-Disaster Homelessness
In 2014, Texas accounted for six percent of the nation’s total chronically homeless population. Although Texas has seen one of the largest decreases (38 percent decline) in homelessness from 2007 to 2014, a study conducted by the Texas Homeless Network revealed that 23,678 persons in the state were physically counted as homeless in 2015.8 While overall homelessness, chronic homelessness, and homelessness among veterans has been on the decline, the number of homeless children has increased. According to the National Center on Family and Homelessness, 190,018 Texas children experienced homelessness in 2013. Continuum of Care data, as published by HUD, further bolsters this statistic in revealing that 30.97 percent of the total homeless population in the State is comprised of households with one adult and at least one child under the age of eighteen years.
Figure 4: Texas Homelessness by Household Type
7 TDHCA, State Low Income Housing Plan - http://www.tdhca.state.tx.us/pdf/16-Draft-SLIHP.pdf 8 TDHCA, State Low Income Housing Plan - http://www.tdhca.state.tx.us/pdf/16-Draft-SLIHP.pdf
6933
1062
103
2198
1154
16
6295
81 640
1000
2000
3000
4000
5000
6000
7000
Households without children Households with at least one adultand one child
Households with only children
Texas Homelessness by Household TypeEmergency Shelter Transitional Housing Unsheltered

11 | P a g e
State Homeless Support Services: Texas has a fairly widespread and robust homeless support services program (without the limitation in the service area of the CDBG-DR program). The state is actively coordinating and collaborating with localities and non-profits to comprehensively address pre-disaster homelessness separately from CDBG-DR funding. Therefore, funds will not be set aside to specifically address disaster homelessness. Our competitive application process will focus on CDBG-DR eligible projects so that communities have as much local control as possible to most effectively and efficiently meet their recovery and resiliency needs. Each applicant will detail any homeless issues suffered, and local solutions being undertaken to address those issues. The Texas Homeless Network is a statewide non-profit organization, partly funded by the Texas Department of Housing and Community Affairs (TDHCA) and the Texas Department of State Health Service (DSHS), that provides training and technical assistance around the state to help service providers and communities better serve the homeless population with the end goal of preventing and ending homelessness.9 TDHCA’s Homeless Housing and Services Program (HHSP) provides funding to the eight largest cities in support of services to homeless individuals and families. The cities currently served through HHSP are Arlington, Austin, Corpus Christi, Dallas, El Paso, Fort Worth, Houston, and San Antonio. The Texas Legislature has, through the enactment of Senate Bill 1 and Senate Bill 2 (83rd Legislature, 1st called session), provided General Revenue funds of $10 million over the biennium. Allowable activities include construction, development, or procurement of housing for homeless persons; rehabilitation of structures targeted to serving homeless persons or persons at-risk of homelessness; provision of direct services and case management to homeless persons or persons at-risk of homelessness; or other homelessness-related activity as approved by TDHCA.
Program Highlights:
• Homeless population in the eight cities in 2014: 18,291 (down from 22,603 in 2012). • Unduplicated numbers served from 2009–2014: 33,080 people, 26,734 households. • Targets for 2015 (unduplicated): 5,846 persons, 4,062 households. • Number of people that transitioned to permanent housing in the 2013–2014 program
years: 3,052. • Number of people that achieved specific quality of life outcomes due to construction
and rehabilitation projects in 2013–2014: 2,376. • Duplicated numbers served from 2009–2014: 68,827 people; 49,854 households.
9 Texas Homeless Network - http://www.thn.org/

12 | P a g e
Additionally, The Texas Interagency Council for the Homeless (TICH) was established in 1995 and coordinates the state’s resources and services to address homelessness. TICH serves as an advisory committee to TDHCA. Representatives from 11 state agencies sit on the council, along with members appointed by the governor, lieutenant governor, and speaker of the house of representatives.10 The council’s duties include:
• Survey current resources for services for the homeless in the state; • Assist in coordinating and providing statewide services for all homeless individuals; • Increase the flow of information among separate providers and appropriate authorities; • Provide technical assistance to TDHCA in assessing the need for housing for individuals
with special needs in different localities; and • Maintain a centralized resource and information center for homeless services.
To better understand how the state’s infrastructure is positioned to address the complexities of housing instability, TICH initiated a study in January 2011. The council convened work groups composed of representatives from nonprofit organizations and 11 state agencies, analyzed state data, reviewed national research, and gathered public input through 10 hearings. Pathways Home presents findings from this study, which indicates that greater coordination of employment and health service resources with local housing programs would expand the state’s capacity to prevent and end episodes of homelessness. In response to the study’s findings, Pathways Home proposes a framework to help more of Texas’ most vulnerable citizens enter and remain in safe housing.11 The Department of State Health Services’ (DSHS’s) Projects for Assistance in Transition from Homelessness (PATH) program provides outreach in the form of (1) screening, diagnostic assessment, and treatment; (2) habitation and rehabilitation; (3) community mental health services; (4) outpatient alcohol or drug treatment (for clients with serious mental illness); (5) staff training and case management; (6) referrals for primary health services, job training, educational services (including HIV prevention activities), and relevant housing services; (7) assistance in obtaining income support services including Social Security Income and representative payee per appropriate regulations; (8) housing services including planning for housing; (9) technical assistance in applying for housing assistance; and (10) improving coordination of housing and services and the costs of matching individuals with appropriate housing and services. The service areas are Amarillo, Austin, Beaumont, Conroe, Corpus Christi, Dallas, El Paso, Fort Worth, Galveston, Harlingen, Houston, Laredo, Lubbock, San Antonio, and
10 Texas Interagency Council for the Homeless (TICH) - http://www.tdhca.state.tx.us/tich/ 11 TICH, Pathways Home - http://www.tdhca.state.tx.us/tich/pathways-home.htm

13 | P a g e
Waco. The state will also share HUD’s homeless information web page with all eligible communities in order to substantiate their homeless prevention efforts.12
E. Housing Disaster Impacts
In reviewing the FEMA Information and Data Analysis (FIDA) database provided by FEMA, there were 43,761 applicants for housing assistance through the Individual Assistance (IA) program tied to disasters DR-4266, DR-4269, and DR-4272. The April 2016 event (DR-4269) had the highest number of applicants with 26,428. Furthermore, the period of the three disasters is reflected in the total claims made in the National Flood Insurance Program (NFIP) for Texas, where a total of 13,282 claims were made over the period of the 2016 disasters.
Figure 5: FEMA NFIP Data as of 11/30/16 In total, 71 counties were impacted by these three disasters. The FIDA dataset signifies the number of applicants (individuals and households) for IA from FEMA. This dataset tracks the sequence of delivery for these applications, with FEMA Housing Assistance as the first source of funds, then the Small Business Administration (SBA), and then FEMA-State Other Needs Assistance (ONA).
12 HUD Homeless Information - http://portal.hud.gov/hudportal/HUD?src=/states/texas/homeless
14 | P a g e
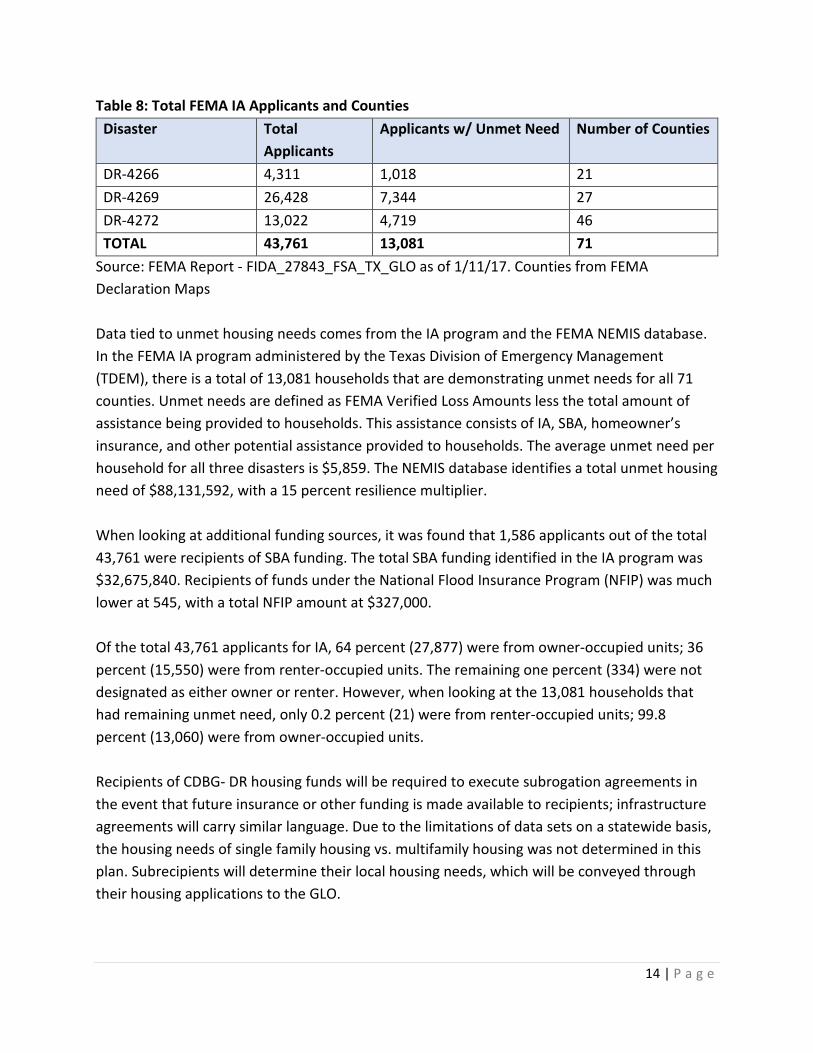
Table 8: Total FEMA IA Applicants and Counties Disaster Total
Applicants Applicants w/ Unmet Need Number of Counties
DR-4266 4,311 1,018 21 DR-4269 26,428 7,344 27 DR-4272 13,022 4,719 46 TOTAL 43,761 13,081 71
Source: FEMA Report - FIDA_27843_FSA_TX_GLO as of 1/11/17. Counties from FEMA Declaration Maps Data tied to unmet housing needs comes from the IA program and the FEMA NEMIS database. In the FEMA IA program administered by the Texas Division of Emergency Management (TDEM), there is a total of 13,081 households that are demonstrating unmet needs for all 71 counties. Unmet needs are defined as FEMA Verified Loss Amounts less the total amount of assistance being provided to households. This assistance consists of IA, SBA, homeowner’s insurance, and other potential assistance provided to households. The average unmet need per household for all three disasters is $5,859. The NEMIS database identifies a total unmet housing need of $88,131,592, with a 15 percent resilience multiplier. When looking at additional funding sources, it was found that 1,586 applicants out of the total 43,761 were recipients of SBA funding. The total SBA funding identified in the IA program was $32,675,840. Recipients of funds under the National Flood Insurance Program (NFIP) was much lower at 545, with a total NFIP amount at $327,000. Of the total 43,761 applicants for IA, 64 percent (27,877) were from owner-occupied units; 36 percent (15,550) were from renter-occupied units. The remaining one percent (334) were not designated as either owner or renter. However, when looking at the 13,081 households that had remaining unmet need, only 0.2 percent (21) were from renter-occupied units; 99.8 percent (13,060) were from owner-occupied units. Recipients of CDBG- DR housing funds will be required to execute subrogation agreements in the event that future insurance or other funding is made available to recipients; infrastructure agreements will carry similar language. Due to the limitations of data sets on a statewide basis, the housing needs of single family housing vs. multifamily housing was not determined in this plan. Subrecipients will determine their local housing needs, which will be conveyed through their housing applications to the GLO.

15 | P a g e
F. Most Impacted Counties – Individual Assistance (Housing) The total FEMA Verified Loss (FVL) for the five most impacted counties totaled more than $148.8 million, with Harris County demonstrating the most FVL at just under $75 million. Total unmet need for all five of these counties totals $64.2 million, with Harris County having a total of $37.7 million. Brazoria County had the lowest level of FVL with $11.4 million, and a total unmet need of $3.8 million. Table 9: FVL and Unmet Need by MI County
County Total FEMA Verified Loss (FVL) Total Unmet Need Brazoria $11,448,734 $3,848,839 Fort Bend $15,866,703 $6,581,746 Harris $74,999,440 $37,700,367 Montgomery $26,934,416 $11,785,774 Newton $19,577,056 $4,275,505
TOTAL $148,826,348 $64,192,230 Source: FEMA Report - FIDA_27843_FSA_TX_GLO as of 1/11/17. When comparing the IA unmet need per capita for the five counties, we find that there is a stark contrast between Newton and the other four counties — this is due to the disparate populations between Newton and the other counties. Given Newton County’s low population of 13,986, the unmet need per capita is $305.70, as compared to Harris County’s unmet need of $8.31 per capita. In other words, Newton County’s unmet need is 36 times greater than the next highest tabulation of an affected county’s need. Table 10: Unmet Need Per Capita
County Unmet Need Population (2015) Unmet Need Per Capita
Brazoria $3,848,839 346,312 $11.11 Fort Bend $6,581,746 716,087 $9.19 Harris $37,700,367 4,538,028 $8.31 Montgomery $11,785,774 537,559 $21.92 Newton $4,275,505 13,986 $305.70
Source: FEMA Report - FIDA_27843_FSA_TX_GLO as of 1/11/17.Census Bureau: American Community Survey Quick Facts This same scenario is conveyed for the FVL per capita, with Newton showing FVL of $1,399.76, and Montgomery and Harris Counties showing $50.11 and $16.53, respectively. This fact shows

16 | P a g e
that Newton would need to spend $1,399.76 per person to alleviate the disaster impacts to households. Table 11: FEMA Verified Loss Per Capita
County FEMA Verified Loss Population (2015) FVL Per Capita Brazoria $11,448,734 346,312 $33.06 Fort Bend $15,866,703 716,087 $22.16 Harris $74,999,440 4,538,028 $16.53 Montgomery $26,934,416 537,559 $50.11 Newton $19,577,056 13,986 $1,399.76
Source: FEMA Report - FIDA_27843_FSA_TX_GLO as of 1/11/17.Census Bureau: American Community Survey Quick Facts The table below shows that Harris County had 21,781 applicants — the most of any county. Newton had the least amount of applicants, with a total of 1,463. However, when compared to population size (Table 12), this means that 0.5 percent of Harris County’s population applied for assistance, whereas in Newton County, over 10 percent of the population applied. Table 12: FEMA IA Applicant Percent of County Population
County Applicants Population (2015) App % of Co Population
Brazoria 1,589 346,312 0.5% Fort Bend 1,979 716,087 0.3% Harris 21,781 4,538,028 0.5% Montgomery 4,622 537,559 0.9% Newton 1,463 13,986 10.5%
Source: FEMA Report - FIDA_27843_FSA_TX_GLO as of 1/11/17.Census Bureau: American Community Survey Quick Facts Additionally, because households apply for assistance (rather than individuals), it is important to identify how many applicants per household there are for each individual county. The contrast between Newton and the other counties is seen even more starkly here when the figures show that more than 30 percent of Newton County’s households applied for assistance. The next closest county is Montgomery, showing 2.67 percent of households applying (Table 13).

17 | P a g e
Table 13: FEMA IA Applicant Percent of County Households County Applicants Households (2015) App % of Co
Population Brazoria 1,589 112,510 1.41% Fort Bend 1,979 206,188 0.96% Harris 21,781 1,499,528 1.45% Montgomery 4,622 173,238 2.67% Newton 1,463 4,825 30.32%
Source: FEMA Report - FIDA_27843_FSA_TX_GLO as of 1/11/17.Census Bureau: American Community Survey Quick Facts For the most impacted counties identified by HUD, there is a wide variance in the above numbers. The figures show that total unmet need in dollars does not tell the whole story of what these counties face when it comes to recovery; this will be discussed in the below section that scrutinizes both the total unmet need for the state and the methodology for breaking out funds per most impacted county.
G. Infrastructure Disaster Unmet Needs As stated in the introduction to the Needs Assessment, the state of Texas, through coordination with TDEM, compiled a list of Public Assistance (PA) applicants for all three disasters in 2016. These figures come from the FEMA EMMIE database (as of January 9, 2017). The projected cost amount is what FEMA and localities determine to be the total of what will eventually be written for total project costs. The total eligible amount is what has been written to date, and the federal share eligible is the 75 percent of federal matching funds correlated to the total eligible amount. For disaster-related projects, it is reasonable to expect that the total eligible amount will reach the projected cost amount; however, the two will not balance until the application is closed. It is the projected cost amount that provides the total amount of damages for each locality and county. Due to there being a 75 percent federal share tied to the projected cost amount, it is the remaining 25 percent of the projected cost amount, plus 15 percent as a resiliency multiplier, that signifies the total infrastructure unmet need for these localities. For all impacted counties in Texas, there is a projected cost amount of $201,341,450. The 25 percent local match total is $50,335,363 for the state. When accounting for a resilience multiplier of 15 percent ($7,550,304), the total unmet need for the state (tied to Public Assistance) is $57,885,667.

18 | P a g e
Table 14: TDEM/FEMA Infrastructure Unmet Need by Disaster
Source: TDEM - Emergency Management Mission Integrated Environment (EMMIE) Database Report as of 1/9/2017 Because so much of the state was impacted by these 2016 events, and property valuations occur locally by county on differing schedules, the impact on property values, though impossible to determine, should be regarded as a factor of the long-term impact that communities will face as they struggle to recover using their own resources. Additionally, it must be noted here that while unmet housing need will be addressed, there still remains significant unmet need in the infrastructure sector. When combining the need from Public Assistance ($57,885,667) and SBA Business Unmet Need ($104,720,409), there yields a grand total of infrastructure disaster unmet needs of $162,606,076. Projects affiliated with economic revitalization or infrastructure activities will contribute to the long-term recovery and restoration of housing in the most impacted and distressed areas.
H. Resiliency Solutions and Unmet Need for the State
Recognizing the state’s long and well-documented history of flooding, as well as its ongoing efforts to mitigate future flooding in our most vulnerable areas, the state is committed to rebuilding resiliently. In assessing unmet needs, it is important to consider the additional costs of safeguarding housing and community investments from future disasters. As such, Texas will not only be assessing applications and considering state-run programs that replace or repair lost property, but will also be seeking to invest resources in efforts that promise to mitigate damage from future disasters. Although initially more costly, these mitigating efforts greatly reduce the cost of future damages. Single family home resiliency solutions are expected to add 10 percent to 15 percent to the total cost per home; multifamily resiliency solutions add 15 percent to 20 percent to the total cost per project; and infrastructure solutions add 15 percent to 20 percent to the total cost per project. Resiliency solutions are varied and dependent on the respective area’s Threat and
Disaster Projected Cost 25% Local Match (Unmet Need)
Resilience Multiplier (15%)
Total Unmet Need
DR-4266 $29,331,951 $7,332,988 $1,099,948 $8,432,936 DR-4269 $37,806,554 $9,451,638 $1,417,746 $10,869,384 DR-4272 $134,202,945 $33,550,736 $5,032,610 $38,583,347 TOTAL $201,341,450 $50,335,363 $7,550,304 $57,885,667

19 | P a g e
Hazard Identification and Risk Assessment (THIRA). The THIRA utilizes an all-hazards approach; however, for this grant funding, the focus will be on flood resiliency solutions. Home resiliency solutions include elevating the first floor of habitable area; breakaway ground floor walls; reinforced roofs; storm shutters; and mold and mildew resistant products. Multifamily resiliency solutions include elevation; retention basins; fire-safe landscaping; firewalls; landscaped floodwalls; and a combination of both single family and infrastructure solutions. In the case of infrastructure resiliency solutions, improvements will include:
• Raising facilities above base flood elevation; • Having backup power generators for critical systems (water, sewer, etc.); • Elevating critical systems, retention basins, larger culverts, culvert debris guards, erosion
control solutions, raising roadways, and redundant communication systems. Once the state considers the amount of resiliency solutions that will be tied to housing and infrastructure projects, the amount of unmet need increases significantly. The resiliency multiplier used here will be a standard 15 percent for both housing and infrastructure activities.
I. Total Unmet Need for the State of Texas
Total Unmet Need: It is important to determine how to best allocate the CDBG-DR funds effectively across the state to counties that demonstrate the most need. The counties that are deemed most impacted by HUD are Brazoria, Fort Bend, Harris, Montgomery, and Newton. Total unmet need for these five counties is seen in Table 15. Table 15: Total Unmet Need for Most Impacted Counties
County Unmet Need Brazoria $31,991,709 Fort Bend $51,685,074 Harris $222,284,271 Montgomery $65,203,818 Newton $47,757,485 TOTAL $418,922,357
Note: TOTAL Unmet Need consists of IA, PA, SBA TVL, SBA, Business TVL, and Resilience Multiplier

20 | P a g e
Unmet Need Per Capita: The amount of unmet need per capita is an important factor when considering the ability for a county to absorb the fiscal impacts of a disaster. Localities may be able work to recover from disasters by increasing their revenue through tax increases. When looking at the per capita impacts that this will have on communities, the five most impacted counties vary greatly, given their population size. The below table breaks down the total unmet need per capita for each of the five most impacted counties (Table 16). Table 16: GRAND TOTAL Unmet Need (UN) Per Capita (USED AS DISTRIBUTION FACTOR)
County TOTAL Unmet Need Population (2015) TOT UN % of Co Population
Brazoria $31,991,708.92 346,312 $92.38 Fort Bend $51,685,073.99 716,087 $72.18 Harris $222,284,270.59 4,538,028 $48.98 Montgomery $65,203,817.90 537,559 $121.30 Newton $47,757,485.19 13,986 $3,414.66
Note: TOTAL Unmet Need consists of IA, PA, SBA TVL, SBA, Business TVL, and Resilience Multiplier, Source: Population (2015) - https://www.census.gov/quickfacts/ As can be seen in the above table, Newton County experienced a much higher unmet need per capita at $3,414.66, while Harris County shows the lowest unmet need per capita at $48.98. This can be explained by Harris County’s population exceeding 4.5 million, while Newton County has a population of 13,986. Social Vulnerability Index (SoVI) 2010-2014: An additional component to consider when looking at unmet needs of these five counties is what level of social vulnerability to natural hazards are they experiencing. The Social Vulnerability Index (SoVI) 2010-2014 measures the social vulnerability of counties across the United States — in particular, their vulnerability to environmental hazards. This index, developed by the University of South Carolina’s Hazards & Vulnerability Research Institute, synthesizes 29 socioeconomic variables which contribute to reduction in a community’s ability to prepare for, respond to, and recover from hazards. SoVI is a comparative metric that facilitates the examination of the differences in vulnerability among counties. It is a valuable tool because it graphically illustrates the geographic variation in social vulnerability, which in turn contributes greatly to response and recovery capabilities. SoVI shows where there is uneven capacity for disaster preparedness and response, and where resources might be used most effectively to reduce pre-existing vulnerability. The data sources for the development of SoVI come primarily from the United State Census Bureau.

21 | P a g e
The 2010-2014 SoVI data combines the best available data from both the 2010 U.S. Decennial Census and five-year estimates from the 2010-2014 American Community Survey (ACS). The below table provides the breakdown for the five most impacted counties with relation to their quintile ranking when being ranked within Texas alone, as well as their SoVI raw score and SoVI score modified to account for the range to be above 0, which was critical in using this factor in the weighting methodology (Table 17). Table 67: SoVI Score by Most Impacted (MI) County (2010-2014)
County Texas Compare-Q
SoVI Score (raw) Score (Range)
Brazoria Medium – Low -3.769999981 5.96 Fort Bend Low -5.71999979 4.01 Harris Medium 0.140000001 9.87 Montgomery Low -4.170000076 5.56 Newton Medium – Low -0.620000005 9.11
Source: Social Vulnerability Index: http://artsandsciences.sc.edu/geog/hvri/sovi-data Distribution of Funds: In determining the distribution of funds to these counties, the first step was determining the allocation for the most impacted (MI) counties and the rest of the state. As deemed by the Federal Register, 80 percent of the total $238,895,000 would be allocated to the five most impacted counties. This 80 percent amount totals $191,116,000, leaving a remaining $44,779,000 for the rest of the State. The State will designate 15 percent of these fund for administration (5 percent), planning (10 percent). Table 6 provides a breakdown of these amounts once accounting for administration, planning. The amounts for the MI counties and the rest of the state also consider the amount of funds used for project delivery. The total amount that will be utilized for project delivery is 1 percent for the MI counties and one percent for the rest of the state. The total amount to be allocated to the five most impacted counties is allocated according to a weighted scoring system that took into account three distribution factors. These are total unmet need per county, SoVI score, and total unmet need per capita. Out of a total weighting system of 100 points, the total unmet need was given the highest weight with 50, as it is the most important factor in determining the allocation amount. The Social Vulnerability Index (SoVI) was given the score of 40, being that vulnerability contributes greatly to response capabilities and recovery. Total unmet need per capita was given a weight of 10 in that while there is a great importance tied to the communities’ ability to absorb the impact of a disaster, there is not as much weight as total unmet need and community vulnerability to hazards.

22 | P a g e
In order to make the raw SoVI scores usable as a distribution factor, the scores were shifted up by 9.73 points (the lowest score in the country was 9.73) to get them all at over 0 and into a positive ranking for use in weighting and factoring in averages. Maximums were determined for each of the three distribution factors. If a factor were to reach its maximum factor, they would receive the full points for that factor weight. See the below table for distribution factors and their respective weights. Table 78: Distribution Factors
Distribution Factor Maximum Factor Factor Weight Total Unmet Need $222,284,270.59 50 SoVI Score 2010-2014 25.37 40 Total Unmet Need Per Capita $3,414.66 10
The factor weight for each distribution factor was multiplied by the ratio between the county’s factor measure and the maximum factor measure. Scores were then provided for each county’s distribution factor and the factor scores were then summed. The total score for each county was then divided by the total score of all counties to get the ratio of the weighted factors, or to get the proportional weighted factor. The below table provides the county scores and their respective ratios with the final column showing the proportional distribution. Through this method, the state was able to effectively distribute funds according to unmet need while also taking into account social and environmental vulnerability as well as a county’s capacity to absorb the costs of long-term recovery. Table 19: Most Impacted County Proportional Distribution
County Weighted Factor Total Proportional Weighted Factor
Proportional Distribution
Brazoria 16.86 10.5646676579% $16,990,534 Fort Bend 18.16 11.3766565460% $18,296,408 Harris 65.71 41.1628126264% $66,199,732 Montgomery 23.79 14.9028184946% $23,967,327 Newton 35.11 21.9930446751% $35,370,121
TOTAL $160,824,122 All funds being allocated directly to the most impacted counties and the rest of Texas will address an unmet housing need or will consist of economic revitalization or infrastructure activities that will contribute to the long-term recovery and restoration of housing in the most impacted and distressed areas. This will be accomplished through communities determining their local needs through consultation with community members, leaders, and elected officials.

23 | P a g e
Methods of Distribution (MODs) will be developed locally for those in the HUD most impacted counties. The allocation of the CDBG-DR funds associated with the rest of the state will be determined in a future Action Plan amendment.
J. Statewide Flood Management Study
The Texas General Land Office is allocating $23,889,500 for phase 1 of a statewide flood management study (Study) from this appropriation. Approximately $2,000,000 in planning funds will be utilized from the state's CDBG-DR 2015 flood allocation. There are also several possible state sources that are being considered for participation through multiple partner agencies at this time. The Study, at a minimum, will consider the impacted areas of both the 2015 and 2016 CDBG-DR allocations with applicable drainage basins in phase 1. As other agency funding is committed, those funds will be utilized to consider CDBG-DR ineligible areas. This effort may occur with phase 1, or in future phases of the Study. It is expected that less than half of the funds allocated here will be spent in direct planning activities. At the conclusion of the Study, the remaining funds will be used to implement Study-prioritized activities in the five most impacted counties for the 2016 allocation. An Action Plan Amendment will be necessary to transfer planning funds to specific project uses at a later date. As required with any Action Plan Amendment, the GLO citizen participation plan will be fully implemented to notify the public of the results of the Study and the specific projects being funded.

24 | P a g e
IV. State Administered Disaster Recovery Program
A. Action Plan
The Action Plan describes the following activities related to disaster relief, long-term recovery, and restoration of housing, replacing affected public school, infrastructure, and economic revitalization in the most impacted and distressed areas affected by the severe storms, tornadoes, straight-line winds, and flooding disasters occurring during 2016:
• Citizen participation process used to develop the Action Plan; • Eligible affected areas and applicants, and the methodology used to distribute funds
to those applicants; • Activities for which funding may be used; and • Grant procedures that will be applicable to ensure program requirements, including
non-duplication of benefits.
As required by the Federal Register, Vol. 81, No. 224, Monday, November 21, 2016, the Action Plan allows the GLO “to allocate funds to address unmet economic revitalization and infrastructure needs, but in doing so, the grantee must identify how unmet housing needs will be addressed or how its economic revitalization or infrastructure activities will contribute to the long-term recovery and restoration of housing in the most impacted and distressed areas.” As additional information becomes available through the grant administration process, amendments to this Action Plan are expected. Prior to adopting any substantial amendment to this Action Plan, the GLO will publish the proposed plan or amendment on the GLO’s official website and will afford citizens, affected local governments, and other interested parties a reasonable opportunity to examine the plan or amendment’s contents. At a minimum, the following modifications will constitute a substantial amendment:
• A change in program benefit or eligibility criteria; • The allocation or reallocation of more than $1 million; or • The addition or deletion of an activity.
B. Program Budget
1. Grant Allocations
Funds will be used solely for necessary expenses related to disaster relief, long-term recovery, restoration of housing, replacing affected public school, infrastructure, and economic

25 | P a g e
revitalization in the impacted and distressed Texas counties as declared in DR-4266, DR-4269, and DR-4272. As required by the Federal Registers, Vol. 81, No. 224, Monday, November 21, 2016, and Vol. 82, No.11, Wednesday, January 18, 2017, and Vol. 82, No. 150, Monday, August 7, 2017, the GLO will allocate 80 percent of both allocations to address unmet needs within the HUD-identified ‘most impacted and distressed’ areas.
The GLO will ensure, as is required and identified in the Federal Register, that at least 70 percent of the entire CDBG Disaster Recovery grant award will be used for activities that benefit low- and moderate-income projects.
2. Administrative Funds State administrative costs will not exceed five percent. Planning and administrative costs combined will not exceed 20 percent. The provisions outlined under 42 U.S.C. 5306(d) and 24 CFR §570.489(a)(1)(i) and (iii) will not apply to the extent that they cap state administration expenditures and require a dollar-for-dollar match of state funds for administrative costs exceeding $100,000. Pursuant to 24 CFR §58.34(a)(3), except for applicable requirements of 24 CFR §58.6, administrative and management activities are exempt activities under this Action Plan. Once contracted, the GLO will allow the drawdown of pre-agreement costs associated with eligible disaster recovery activities dating back to the date of the disaster(s) for subrecipients and the GLO with appropriate documentation.
3. Thresholds Factors and Grant Size There must be a specific disaster-related need directly attributable to the major natural disaster declaration for severe storms, tornadoes, straight-line winds, and flooding disaster relief, long-term recovery and/or restoration of housing and infrastructure (DR-4266, DR-4269, and DR-4272). No disaster recovery assistance will be considered with respect to any part of a disaster loss that is reimbursable by the Federal Emergency Management Agency (FEMA), the Army Corps of Engineers (USACE), insurance, or another source due in part to the restrictions against duplication of benefits outlined in this Action Plan. An activity underway prior to the Presidential Disaster Declaration will not qualify unless the disaster directly impacted said project.
• HUD Most Impacted Area Counties
The grant size established for this Action Plan for the most impacted counties is a $100,000 minimum-allocation size; the maximum allocation size is the total allocated to the county.
The proposed contract start dates for subrecipients is August/September 2017, and the proposed contract end dates for subrecipients is August/September 2019.

26 | P a g e
C. Eligibility and Award Method According to HUD, only those that were within the disaster-declared counties of DR-4266, DR-4269, and DR-4272 are eligible to receive assistance under this grant. The GLO will potentially utilize all three national objectives to carry out all programs under this allocation. Only mitigation measures related to repairing damage caused by severe storms, tornadoes, straight-line winds, and flooding will be considered for funding.
1. Eligible Applicants Counties, cities, and housing authorities located in the 71 impacted counties are eligible applicants. For the most impacted county of Newton, Deweyville Independent School District shall be an eligible applicant as named as a direct recipient under the Newton County Method of Distribution.
2. Eligible Activities Housing Activities: Housing activities allowed under CDBG-DR include, but are not limited to:
• Single family and multifamily repair, rehabilitation, and/or new construction; • Repair and replacement of manufactured housing units; • Hazard mitigation; • Elevation; • Buyouts and Acquisition of single family residences; • Demolition only of single family residences; • Planning activities related to housing; and • Other activities associated with the recovery of housing stock impacted.
Infrastructure Activities: All activities that can be shown to be supportive of housing are allowed under CDBG-DR, including but not limited to:
• Restoration of infrastructure (such as water and sewer facilities, streets, provision of
generators, removal of debris, drainage, bridges, etc.); • Demolition, rehabilitation of publicly or privately owned commercial or industrial
buildings, and code enforcement; • Economic development (such as microenterprise and small business assistance,
commercial rehabilitation, and special economic development activities); • Public service (such as job training and employment services, healthcare, child care,
and crime prevention within the 15 percent cap); and • Eligible planning, urban environmental design, and policy-planning-management-
capacity building activities as listed in §570.205 within the 15 percent cap).

27 | P a g e
3. Ineligible Activities
Ineligible activities identified in the Federal Register, Vol. 81, No. 224, Monday, November 21, 2016, are the use of CDBG-DR for forced mortgage payoff, construction of dam/levee beyond original footprint, incentive payments to households that move to disaster-impacted floodplains, assistance to privately owned utilities, not prioritizing assistance to businesses that meet the definition of a small business, or assistance for second homes and activities identified in 24 CFR 570.207. All activities and uses authorized under Title I of the Housing and Community Development Act of 1974, allowed by waiver, or published in the Federal Register, Vol. 81, No. 224, Monday, November 21, 2016, are eligible.
D. Method of Distribution As required by the Federal Register, Vol. 81, No. 224, Monday, November 21, 2016, Federal Register, Vol. 82, No. 11, Wednesday, January 18, 2017, and Federal Register, Vol. 82, No. 150, Monday, August 7, 2017, the GLO will allocate 80 percent of both allocations to the HUD-identified “most impacted and distressed” areas. The HUD-identified “most impacted and distressed” areas consist of Brazoria, Fort Bend, Harris, Montgomery, and Newton County. The GLO will require each “most impacted and distressed” area to submit to the GLO a county Method of Distribution (MOD).
The amount each “most impacted and distressed” area is allocated is based on the formula allocation detailed in the Need Assessment section of this Action Plan.
1. HUD Most Impacted County Method of Distribution (MOD) The specific distribution of funds will be determined by the five locally adopted county MODs. The five HUD-identified “most impacted and distressed” areas of Brazoria, Fort Bend, Harris, Montgomery, and Newton County will develop MODs for their county’s allocation.
Each most impacted county, including eligible cities and public housing authorities within those counties, are eligible to be allocated funds with the MOD. For the most impacted county of Newton, Deweyville Independent School District shall be an eligible applicant. Cities, and housing authorities, and impacted school districts located within these counties are encouraged to participate in the development of the MOD. County Methods of Distribution were locally driven processes that utilized data, public planning meetings, public hearings, public comment, citizen advisory committees, surveys, mailout out programs, and local expertise to define the use of the monies allocated to each County. The GLO provided datasets utilized to allocate the funds from a State perspective but did not require the Counties use the same allocation to account for local needs. The GLO participated in and reviewed the MODs submitted by the most impacted counties and found the

28 | P a g e
methodologies to be objective and in line with data locally determined to be representative of the recovery needs of each County. Each “most impacted” county MOD criteria will include the following:
• Established objective criteria for allocation of funds to eligible entities or projects; • Any project-type priorities; • A plan to meet the 70 percent low-to-moderate income benefit requirement; • How unmet housing needs will be addressed or how economic revitalization or
infrastructure activities will contribute to long-term recovery and restoration of housing in the most impacted and distressed areas;
• Minimum grant size of $100,000 and maximum grant size of the total amount allocated to the county;
• Identify the process of reallocation of funds from de-obligated funds and/or cost-savings from completed projects; and
• Must conduct at least one public planning meeting and two public hearings. • Description of efforts to notify and accommodate those with modified
communication needs, such as posting information and providing interpretive services for other languages.
• Explanation of how the region’s method of distribution fosters long-term community recovery that is forward-looking and focused on permanent restoration of infrastructure, housing and the local economy.
• Plan of how unmet housing needs will be addressed or how economic revitalization or infrastructure activities will contribute to long-term recovery and restoration of housing in the most impacted and distressed areas.
• The County is required to prepare a method of distribution between the eligible entities or projects. The GLO has directed the County to use a direct allocation technique based on objective, verifiable data. The Method of Distribution will identify how it meets benefiting 70% low-to-moderate persons requirement, supports minimum allocation amounts that help ensure project feasibility, and provides an explanation of the distribution factors selected.
• All subrecipients will certify that they will affirmatively further fair housing (“AFFH”) in their grant agreements, and will receive GLO technical assistance in meeting their AFFH obligations. Additionally, all project applications will undergo AFFH review by GLO before approval. Such review will include assessment of a proposed project’s area demography, socioeconomic characteristics, housing configuration and needs, educational, transportation, and health care opportunities, environmental hazards or concerns, and all other factors material to the AFFH determination. Applications should show that projects are likely to lessen area racial, ethnic, and low-income concentrations, and/or promote affordable housing in low-poverty, non-minority areas in response to natural hazard related impacts.

29 | P a g e
Table 20: MOD Distribution of Most Impacted13 County Housing Infrastructure Total
Allocation Brazoria $1,580,771 $14,226,943 $15,807,714 Fort Bend TBD TBD $17,022,677 Harris TBD TBD $61,597,147 Montgomery $8,919,523.20 $13,379,284.80 $22,298,808 Newton $23,035,447 $9,872,334 $32,907,781
The Most Impacted are in the process of adding the newer allocations to their MODs, Table 21 reflects only the first and second allocations. The Most Impacted were required to include a description of how additional funds would be distributed. At time of Amendment submission, MODs for Fort Bend and Harris Counties have not been finalized. Brazoria County MOD Brazoria County developed a MOD that allocated 10% of the funding directly to housing specific elevation, rehabilitation, and buyout activities and 90% to drainage projects that reduce flooding in LMI areas to reduce impacts of flooding on housing, personal property and public infrastructure. Brazoria County targeted these needs to foster long-term recovery for residential areas that were most impacted by high water and failure of targeted drainage. Per State data the estimated housing need $3.8 million (Table 9), of the overall $32 million (Table 15) need for Brazoria County would yield a 12% direct housing need. When considering the overall population of the County 38% is LMI. The County will focus housing activities on LMI populations, so they will fund $1,580,771 to direct housing activities and related project expenses. This amount addresses the remaining unmet housing need for the LMI population. The remaining $14,226,943 will make improvements to targeted drainage systems impacted by highwater and failures in the 2016 flood event. http://texasrebuilds.org/Documents/Approved%20Brazoria%20County%202016%20Flood%20MOD.pdf Montgomery County MOD Montgomery County developed a MOD based on a County wide survey that allocated 40% to direct housing related activities and 60% to drainage, sewer and road repair, and FEMA match specifically related to low income neighborhoods. The intent being to remediate systems that failed and leverage additional funds to the County. Many smaller communities had indicated the cost share requirement was likely to prohibit them from being able to accept Public Assistance funds. Montgomery then identified a total of 976 LMI homeowners that currently have remaining unmet housing need through FEMA data and property assessments performed
13 The Most Impacted Counties are adjusting their MOD totals based on recently announced funds.

30 | P a g e
by County staff. The County will manage the housing program and one drainage project. Eight communities were allocated funds for infrastructure projects based on their Public Assistance values and poverty amounts. All infrastructure projects will be supportive of housing. http://texasrebuilds.org/Documents/Approved%20Montgomery%20County%20MOD.pdf Newton County MOD Newton County developed a MOD that allocated 70% of their funding to housing to include replacement of an elementary school lost in the flooding and 30% to infrastructure based on the results of a county wide survey. The survey identified housing to be the highest most urgent unmet need followed by infrastructure to alleviate future flooding. The MOD also calls for a comprehensive master plan for the County that will focus on construction standards with an eye toward mitigation, resiliency, and permanent restoration. http://texasrebuilds.org/Documents/2016%20Approved%20Newton%20County%20MOD.pdf
2. State Competition The remaining 20 percent of allocations will be detailed in an amendment to this Action Plan. The GLO will conduct a State competition for entities located in the remaining 66 impacted counties that were not identified by HUD as a most-impacted area county. Eligible applicants will include counties, cities, and housing authorities located in the 66 impacted counties that received DR-4266, DR-4269, or DR-4272 Presidential disaster declarations are eligible to apply. Entities located in the 2016 most-impacted counties (Brazoria, Fort Bend, Harris, Montgomery, and Newton) are not eligible to apply. The State Competition will include the following:
• Established objective scoring criteria. • All CDBG-DR activities will be eligible. • The State must meet the 70% low-to-moderate income benefit requirement. • The minimum application amount is $100,000 and the maximum application amount
is $2 million. • Each application may contain only one project. • Any de-obligated funds and/or cost-savings from completed projects will be
allocated to partially funded applications and/or awarded to the next highest scoring unfunded application.
• Each applicant may submit a total of 2 applications. Depending on demand, no applicant will be awarded a second application, until all eligible applicants have been awarded at least once.

31 | P a g e
• Each project must identify how unmet housing needs will be addressed or how economic revitalization or infrastructure activities will contribute to long-term recovery and restoration of housing in the most impacted and distressed areas.
• Infrastructure and housing project applications will be accepted. Applications for housing activities will receive first priority over infrastructure applications until at least 60% of the funds set aside for this competition have been expended on direct housing activities.
• If there is an under subscription in the competition, the GLO may request a waiver from HUD and amend the Action Plan to utilize funds based on the response.
1. What is the applicant’s rate of FEMA Public Assistance (PA) per capita?
10 points
2. Does the project meet the low-to-moderate income (LMI) HUD National Objective?
35 points
3. Was the applicant included in one or more of the DR-4266, DR-4269 and DR-4272 Presidential Disaster Declarations?
20 points
4. What is the applicant’s county Social Vulnerability Index (SoVI) Score?
15 points
5. What is the change in employment from the 1st Quarter 2016 to the 1st Quarter 2017 for the applicant’s county?
10 points
6. Is the applicant leveraging funds from other source(s)? (2015 CDBG-DR funds are ineligible to be used as leverage for scoring purposes.)
5 points
7. Is the applicant a public housing authority? 5 points
Total 100 points
(Tie-Breaker) What is the poverty rate of the Census geographic area?
1. Per capita damage (What is the applicant's rate of FEMA Public Assistance (PA) per capita?)
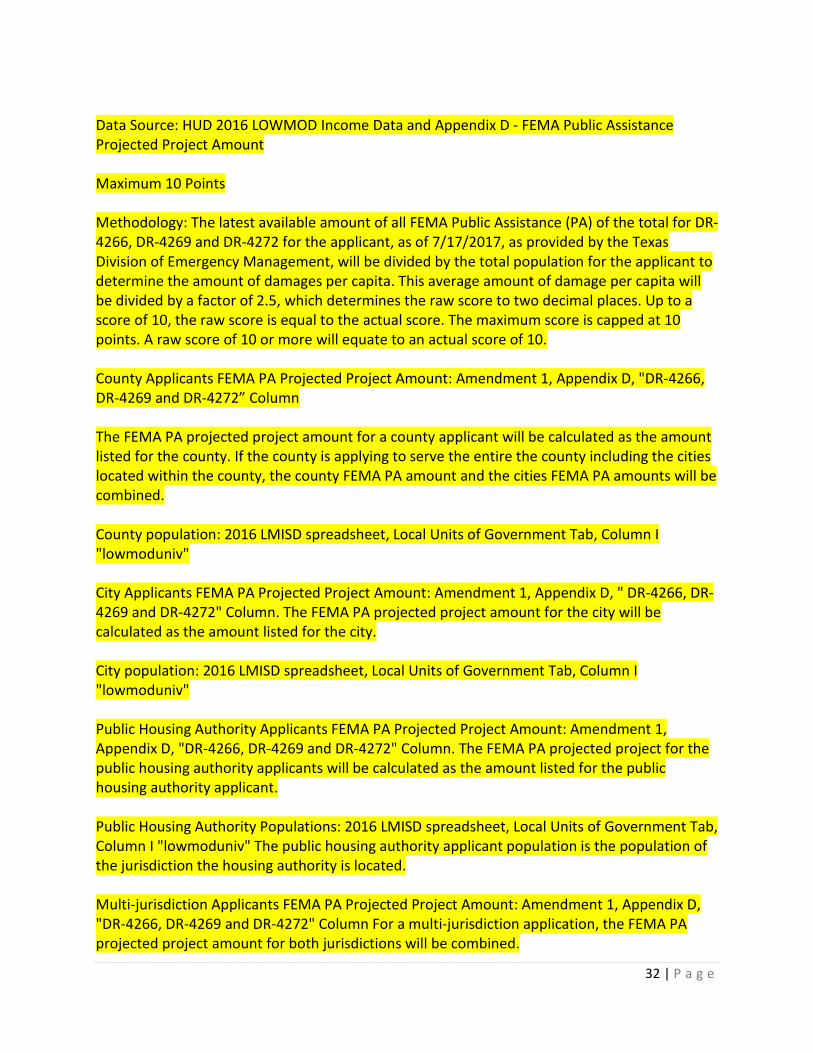
32 | P a g e
Data Source: HUD 2016 LOWMOD Income Data and Appendix D - FEMA Public Assistance Projected Project Amount Maximum 10 Points Methodology: The latest available amount of all FEMA Public Assistance (PA) of the total for DR-4266, DR-4269 and DR-4272 for the applicant, as of 7/17/2017, as provided by the Texas Division of Emergency Management, will be divided by the total population for the applicant to determine the amount of damages per capita. This average amount of damage per capita will be divided by a factor of 2.5, which determines the raw score to two decimal places. Up to a score of 10, the raw score is equal to the actual score. The maximum score is capped at 10 points. A raw score of 10 or more will equate to an actual score of 10. County Applicants FEMA PA Projected Project Amount: Amendment 1, Appendix D, "DR-4266, DR-4269 and DR-4272” Column The FEMA PA projected project amount for a county applicant will be calculated as the amount listed for the county. If the county is applying to serve the entire the county including the cities located within the county, the county FEMA PA amount and the cities FEMA PA amounts will be combined. County population: 2016 LMISD spreadsheet, Local Units of Government Tab, Column I "lowmoduniv" City Applicants FEMA PA Projected Project Amount: Amendment 1, Appendix D, " DR-4266, DR-4269 and DR-4272" Column. The FEMA PA projected project amount for the city will be calculated as the amount listed for the city. City population: 2016 LMISD spreadsheet, Local Units of Government Tab, Column I "lowmoduniv" Public Housing Authority Applicants FEMA PA Projected Project Amount: Amendment 1, Appendix D, "DR-4266, DR-4269 and DR-4272" Column. The FEMA PA projected project for the public housing authority applicants will be calculated as the amount listed for the public housing authority applicant. Public Housing Authority Populations: 2016 LMISD spreadsheet, Local Units of Government Tab, Column I "lowmoduniv" The public housing authority applicant population is the population of the jurisdiction the housing authority is located. Multi-jurisdiction Applicants FEMA PA Projected Project Amount: Amendment 1, Appendix D, "DR-4266, DR-4269 and DR-4272" Column For a multi-jurisdiction application, the FEMA PA projected project amount for both jurisdictions will be combined.

33 | P a g e
Multi-jurisdiction Applicants Populations: 2016 LMISD spreadsheet, Local Units of Government Tab, Column I “lowmoduniv” For a multi-jurisdiction application, the jurisdictions populations will be combined, unless the jurisdictions are a county and a city located within the county, then the county population will be used.
2. Does the project meet the low-to-moderate income (LMI) HUD National Objective? Data Source: 2016 Infrastructure or Housing Application Table 1 Maximum 35 Points Methodology: The project meets the low-to-moderate income (LMI) HUD National Objective. Project beneficiary information will be reviewed to determine the HUD National Objective.
3. Was the applicant included in one or more of the DR-4266, DR-4269 and DR-4272 Presidential Disaster Declarations?
Data Source: FEMA Disaster Declarations Maps and Lists Maximum 20 Points Methodology: Applicant is located within a county that received Presidential Disaster Declarations DR-4266, DR-4269 and/or DR-4272. DR-4266 Only = 5 Points DR-4269 Only = 5 Points DR-4272 Only = 5 Points 2 Only = 15 Points DR-4266, DR-4269 and DR-4272 = 20 Points
4. What is the applicant’s county Social Vulnerability Index (SoVI) Score? Data Source: Social Vulnerability Index (SoVI) Score by County, Appendix E Maximum 15 Points Methodology: Score will be based on SoVI score from most recent year data provided. The county SoVI score will be divided by the maximum Texas County SoVI score and then multiplied by the maximum points (15) to get the final score for that county.
• (County Score/Maximum Texas County SoVI Score) x 15 = County Score

34 | P a g e
• Note: SoVI Scores presented in Appendix E have been shifted to represent a positive number for scoring purposes.
5. What is the change in employment from the 1st Quarter 2016 to the 1st Quarter 2017 for
the applicant's county? Data Source: Texas Workforce Commission's (TWC) Quarterly Census of Employment and Wages (QCEW) for the 1st Quarter of 2016 and the 1st Quarter of 2017 Change in Employment Data Worksheet. Maximum 10 Points Methodology: Employment figures for all industries, both public and private, for the 1st Quarter of 2016 and the 1st Quarter of 2017 are obtained from the Texas Workforce Commission's (TWC) Quarterly Census of Employment and Wages (QCEW) for each county in the region. Cities are scored on the rates for the county in which they are located. The percent of change in each county (increase/decrease) from the 1st Quarter 2016 to the 1st Quarter of 2017 is then calculated. [(Q1 2017 - Q1 2016)/(Q1 2016)] x 100 = % Increase or Decrease Points are then awarded based upon the following scale: • No decrease = 0 points • Decrease up to 1.99% = 2 points • Decrease 2.00% to 2.99% = 4 points • Decrease 3.00% to 3.99% = 6 points • Decrease 4.00% to 5.99% = 8 points • Decrease 6.00% and over = 10 points
6. Is the applicant leveraging funds from other source(s)? (2015 CDBG-DR funds are ineligible to be used as leverage for scoring purposes.) Data Source: Letter of Commitment from State, Federal, or other sources Maximum 5 Points Methodology: The commitment letters from a State source, Federal Source or other outside sources will be reviewed to determine the amount of leveraged funds injected into the project. In order to receive points under this criterion, the leveraging must have a minimum value of 1% of the CDBG-DR funds requested. For purposes of this criterion, leveraged funds include equipment, materials, and cash from the applicant and sources from other than the requesting entity. The 2015 CDBG-DR funds are ineligible to be used as leverage for scoring purposes.

35 | P a g e
To calculate the leverage minimum, the following formula will be used: Leveraged Funds/CDBG-DR Funds Requested = Percent Leveraged
7. Is the applicant a public housing authority? Data Source: Application, 424 Form Maximum 5 Points Yes = 5 points No = 0 points
(Tie-Breaker) What is the poverty rate of the census geographic area? Data Source: 2015 ACS 5-year Table B17001 Methodology: Poverty rate is determined by reviewing the U.S. Census 2015 American Communities Survey (ACS) 5- year estimate, table B17001 for the census geographic area. Once this information is obtained for each applicant and the target area identified on the census map, the poverty rate for each applicant is calculated by dividing the total number of persons at or below the designated poverty level by the population from which poverty persons was determined. The poverty rate is calculated up to two decimal points. If the target area(s) encompasses more than one census geographic area (such as two or more Census Tracts) the poverty rate shall be calculated as follows: the sum of the total number of persons at or below the designated poverty level of all census geographic areas in the target area divided by the sum of the total population from which poverty persons were determined from all Census geographic areas in the target area. If needed in the ranking of applications based on available funds remaining, a tie between multiple applications shall be broken based poverty rate ranking with the highest poverty rate ranking higher.
E. Location All CDBG-DR funded activities under this Action Plan will occur within the disaster-declared counties of FEMA DR-4266, DR-4269, and DR-4272.
F. Mitigation Measures The GLO will encourage subrecipients to incorporate preparedness and mitigation measures into rebuilding activities; this helps to ensure that post-recovery communities are safer and stronger than prior to the disaster. Incorporation of these measures also reduces costs in recovering from future disasters. Mitigation measures that are not incorporated into those

36 | P a g e
rebuilding activities must be a necessary expense related to disaster relief, long-term recovery, and restoration of infrastructure, replacing affected public school, housing, or economic revitalization that responds to declared disaster FEMA DR-4266, DR-4269, and DR-4272.
G. Use of Urgent Need Each subrecipient receiving 2016 Floods CDBG-DR funds will document how all activities or projects funded under the urgent need national objective respond to a disaster-related impact identified by the subrecipients. The CDBG certification requirements for documentation of urgent need, located at 24 CFR 570.208(c) and 24 CFR 570.483(d), are waived for the grants under this notice until 24 months after HUD first obligates funds to the grantee. It is anticipated that the use of the urgent need national objective will be limited. At least 70 percent of the entire CDBG-DR grant award must be used for activities that benefit low- and moderate-income persons.
H. Citizen Participation The citizen participation plan for the 2016 Floods allocation as required by the Federal Register, Vol. 81, No. 224, Monday, November 21, 2016, will provide a reasonable opportunity o f at least fourteen (14) days for citizen comment and ongoing citizen access to information about the use of grant funds.
• Before the GLO adopts the Action Plan for this grant or any substantial amendment to this grant, the GLO will publish the proposed plan or amendment on TexasRebuilds.org — the official website for the GLO’s Community Development and Revitalization program which administers CDBG-DR grant funds for the state.
• The GLO and/or subrecipients will notify affected citizens through electronic mailings, press releases, statements by public officials, media advertisements, public service announcements, and/or contacts with neighborhood organizations.
• The GLO will ensure that all citizens have equal access to information about
the programs, including persons with disabilities (vision and hearing impaired) and limited English proficiency (LEP). A Spanish version of the action plan will be available. The GLO consulted the Final Guidance to Federal Financial Assistance Recipients Regarding Title VI, Prohibition Against National Origin Discrimination Affecting Limited English Proficient Persons, published on January 22, 2007, in the Federal Register (72 FR 2732) in order to comply with citizen participation requirements.
• Upon subsequent publication of the Action Plan or substantial amendments, the
37 | P a g e
GLO will provide a reasonable opportunity of at least fourteen (14) days and have a method for receiving comments.
• The GLO will take comments via USPS mail, fax or email:
Texas General Land Office Community Development and Revitalization Attn: Ellen Kinsey P.O. Box 12873 Austin, TX 78711-2873 Fax: 512-475-5150 Email: [email protected]
1. Public Website The GLO will make the following items available on its website: (1) the Action Plan (including all amendments); each Quarterly Performance Report (QPR) as created using the Disaster Recovery Grant Reporting System (DRGR) system; (2) procurement, policies and procedures; (3) executed CDBG-DR contracts; and (4) status of services or goods currently being procured by the GLO (e.g., phase of the procurement, requirements for proposals, etc.).
2. Consultation The GLO consulted with the five HUD identified “most impacted” area counties and conducted outreach for the other 71 impacted counties. The GLO consultation and outreached included the following:
• 2016: Created a website page for all information related to 2016 Storms and Floods. The web page is accessible from TexasRebuilds.org.
• April 2016: The GLO sent a letter to all eligible cities, counties, and councils of government located in the disaster-declared counties. This included Texas state representatives, Texas state senators, and congressional representatives.
• April 2016: Created a Recovery Needs survey for all impacted entities. The GLO has received 54 completed surveys.
• January 2017: The GLO presented to the Texas Association of Regional Councils regarding the allocation.
• January/March 2017: The GLO consulted with the HUD-identified “most impacted” counties.

38 | P a g e
• February 2017: The GLO presented to the Central Texas Voluntary Organizations Active in Disaster regarding the allocation.
3. Non-substantial Amendment The GLO will notify HUD when it makes any plan amendment that is not substantial. HUD will be notified at least five business days before the amendment becomes effective. HUD will acknowledge receipt of the notification of non-substantial amendments via email within five (5) business days.
4. Consideration of Public Comments The GLO will consider all comments, received orally or in writing, on the Action Plan or any substantial amendment. A summary of these comments or views located and the GLO's response to each located in Appendix C must be submitted to HUD with the Action Plan or substantial amendment.
5. Citizen Complaints The GLO will provide a timely written response to every citizen complaint. The response will be provided within fifteen (15) working days of the receipt of the complaint, if practicable.
6. Waivers The Appropriations Act authorizes the Secretary of HUD to waive, or specify alternative requirements for any provision of any statute or regulation that the Secretary administers in connection with the obligation by the Secretary, or use by the recipient, of these funds and guarantees, except for requirements related to fair housing, nondiscrimination, labor standards, and the environment (including requirements concerning lead-based paint), upon: (1) A request by the grantee explaining why such a waiver is required to facilitate the use of such funds or guarantees; and (2) a finding by the Secretary that such a waiver would not be inconsistent with the overall purpose of the Housing and Community Development (HCD) Act. Regulatory waiver authority is also provided by 24 CFR 5.110, 91.600, and 570.5. At this time, the GLO is not requesting any additional waivers other than those already granted in Federal Registers associated with the funds under this Action Plan.
I. Performance and Expenditure Schedule
The GLO has developed a performance and expenditure schedule that includes projected performance of both expenditures and outcome measures for project, planning, and administration activities shown in the graph below:

39 | P a g e
Figure 6: Projects Expenditures Timeline
-
50.00
100.00
150.00
200.00
250.00
2017 2018 2019 2020 2021 2022 2023
Dolla
rs p
er M
illio
ns
Years
Projected Expeditures
Administration Planning Project Project Delivery

40 | P a g e
VIII. Appendix D – Public Assistance Projected Project Amount
FEMA Public Assistance Projected Amount provided by Texas Division of Emergency Management as of July 17, 2017
APPLICANT NAME
COUNTY DR-4266 DR-4269 DR-4272 TOTAL
ANDERSON (COUNTY)
Anderson N/A $581,251.39 N/A $581,251.39
PALESTINE Anderson N/A $483,645.84 N/A $483,645.84 PALESTINE INDEPENDENT SCHOOL DISTRICT
Anderson N/A $107,566.25 N/A $107,566.25
WESTWOOD SCHOOL DISTRICT
Anderson N/A $298,676.65 N/A $298,676.65
ANGELINA (COUNTY)
Angelina $545,241.34 N/A N/A $545,241.34
AUSTIN (COUNTY)
Austin N/A $890,470.46 $281,847.19 $1,172,317.65
SAN FELIPE Austin N/A $30,446.93 $178,200.00 $208,646.93 SAN FELIPE-FRYDEK VFD
Austin N/A $8,197.50 $20,090.00 $28,287.50
SEALY Austin N/A $127,492.92 $154,577.32 $282,070.24 SEALY FIRE DEPT Austin N/A $8,707.93 N/A $8,707.93 WALLIS Austin N/A $217,027.59 N/A $217,027.59 BANDERA Bandera N/A N/A $92,230.58 $92,230.58 BANDERA (COUNTY)
Bandera N/A N/A $225,209.08 $225,209.08
BANDERA INDEPENDENT SCHOOL DISTRICT
Bandera N/A N/A $20,945.79 $20,945.79
AQUA WATER SUPPLY CORPORATION
Bastrop N/A N/A $117,196.79 $117,196.79
BASTROP Bastrop N/A N/A $81,718.76 $81,718.76 BASTROP (COUNTY)
Bastrop N/A $651,958.11 $1,523,144.01
$2,175,102.12
BASTROP COUNTY MUNICIPAL
Bastrop N/A N/A $178,710.34 $178,710.34

41 | P a g e
APPLICANT NAME
COUNTY DR-4266 DR-4269 DR-4272 TOTAL
UTILITY DISTRICT NUMBER 1 BASTROP COUNTY WATER CONTROL & IMPROVEMENT DIST 2
Bastrop N/A $48,626.61 $374,425.42 $423,052.03
SMITHVILLE Bastrop N/A $23,263.22 $37,719.13 $60,982.35 BOSQUE (COUNTY)
Bosque N/A $56,502.36 $88,534.89 $145,037.25
CLIFTON Bosque N/A N/A $443,982.45 $443,982.45 ANGLETON INDEPENDENT SCHOOL DISTRICT (ISD)
Brazoria N/A N/A N/A N/A
BRAZORIA Brazoria N/A N/A $22,235.77 $22,235.77 BRAZORIA (COUNTY)
Brazoria N/A N/A $2,099,473.36
$2,099,473.36
BRAZORIA COUNTY EMERGENCY SERVICES DISTRICT NO. 3
Brazoria N/A N/A $18,326.88 $18,326.88
FREEPORT Brazoria N/A N/A $58,967.20 $58,967.20 HOLIDAY LAKES Brazoria N/A N/A $344,075.70 $344,075.70 JONES CREEK Brazoria N/A N/A $102,144.34 $102,144.34 LAKE JACKSON Brazoria N/A N/A $410,847.25 $410,847.25 RICHWOOD Brazoria N/A N/A $42,826.48 $42,826.48 VELASCO DRAINAGE DISTRICT
Brazoria N/A N/A $125,744.20 $125,744.20
WEST COLUMBIA Brazoria N/A N/A $133,818.90 $133,818.90 BRAZOS (COUNTY)
Brazos N/A N/A $293,504.06 $293,504.06
BRYAN Brazos N/A N/A $378,785.92 $378,785.92 BROWN (COUNTY)
Brown N/A N/A $186,261.93 $186,261.93
BROWNWOOD Brown N/A N/A $9,839.35 $9,839.35

42 | P a g e
APPLICANT NAME
COUNTY DR-4266 DR-4269 DR-4272 TOTAL
BURLESON (COUNTY)
Burleson N/A N/A $540,466.87 $540,466.87
SOMERVILLE Burleson N/A N/A $161,513.97 $161,513.97 CALDWELL (COUNTY)
Caldwell N/A N/A $497,505.58 $497,505.58
BAIRD Callahan N/A N/A $114,819.99 $114,819.99 CALLAHAN (COUNTY)
Callahan N/A N/A $2,835,242.91
$2,835,242.91
CLYDE Callahan N/A N/A $155,685.17 $155,685.17 CROSS PLAINS Callahan N/A N/A $61,031.07 $61,031.07 CASS (COUNTY) Cass $252,869.13 $126,714.61 N/A $379,583.74 LINDEN Cass $392,702.83 N/A N/A $392,702.83 CHEROKEE (COUNTY)
Cherokee N/A $430,408.20 N/A $430,408.20
COLEMAN Coleman N/A N/A $16,878.12 $16,878.12 COLEMAN (COUNTY)
Coleman N/A N/A $1,627,920.07
$1,627,920.07
COLEMAN COUNTY ELECTRIC
Coleman N/A N/A $59,085.17 $59,085.17
NOVICE Coleman N/A N/A $32,835.00 $32,835.00 COLORADO (COUNTY)
Colorado N/A $1,255,576.03
N/A $1,255,576.03
COLUMBUS Colorado N/A $91,375.00 N/A $91,375.00 CORYELL (COUNTY)
Coryell N/A $820,009.57 N/A $820,009.57
CORYELL CITY WATER SUPPLY DISTRICT
Coryell N/A $20,591.74 N/A $20,591.74
CARBON Eastland N/A N/A $3,567.48 $3,567.48 CISCO Eastland N/A N/A $9,294,783.8
7 $9,294,783.87
EASTLAND (COUNTY)
Eastland N/A N/A $1,276,123.12
$1,276,123.12
RANGER Eastland N/A N/A $402,109.23 $402,109.23 DUBLIN Erath $25,447.71 N/A $161,020.75 $186,468.46 ERATH (COUNTY) Erath N/A N/A $2,075,419.4
3 $2,075,419.43
STEPHENVILLE Erath $60,130.99 N/A $317,073.86 $377,204.85

43 | P a g e
APPLICANT NAME
COUNTY DR-4266 DR-4269 DR-4272 TOTAL
TARLETON STATE UNIVERSITY
Erath $1,085,915.40 N/A $205,859.38 $1,291,774.78
FALLS (COUNTY) Falls N/A N/A $838,665.96 $838,665.96 FAYETTE (COUNTY)
Fayette N/A $207,009.28 $395,429.36 $602,438.64
LA GRANGE Fayette N/A N/A $415,803.00 $415,803.00 ROUND TOP CARMINE INDEPENDENT SCHOOL DISTRICT
Fayette N/A N/A $57,633.09 $57,633.09
FISHER (COUNTY) Fisher N/A N/A $405,916.20 $405,916.20 LIGHTHOUSE ELECTRIC CO-OP INC
Floyd N/A N/A $142,599.64 $142,599.64
FIRST COLONY LEVEE IMPROVEMENT DISTRICT
Fort Bend N/A N/A $4,861.08 $4,861.08
FIRST COLONY LEVEE IMPROVEMENT DISTRICT #2
Fort Bend N/A N/A $61,844.10 $61,844.10
FORT BEND (COUNTY)
Fort Bend N/A $1,798,343.14
$1,071,443.00
$2,869,786.14
FORT BEND COUNTY FRESH WATER SUPPLY DISTRICT NO. 2
Fort Bend N/A N/A $133,248.92 $133,248.92
FORT BEND COUNTY LEVEE IMPROVEMENT DISTRICT #10
Fort Bend N/A $35,789.00 $43,310.00 $79,099.00
FORT BEND COUNTY LEVEE IMPROVEMENT DISTRICT #11
Fort Bend N/A $6,040.00 $24,566.25 $30,606.25
FORT BEND COUNTY LEVEE
Fort Bend N/A N/A $6,632.88 $6,632.88

44 | P a g e
APPLICANT NAME
COUNTY DR-4266 DR-4269 DR-4272 TOTAL
IMPROVEMENT DISTRICT #14 FORT BEND COUNTY LEVEE IMPROVEMENT DISTRICT #15
Fort Bend N/A $29,141.47 $44,297.14 $73,438.61
FORT BEND COUNTY LEVEE IMPROVEMENT DISTRICT #17
Fort Bend N/A $3,653.75 $10,931.25 $14,585.00
FORT BEND COUNTY LEVEE IMPROVEMENT DISTRICT #19
Fort Bend N/A $10,287.63 $17,494.79 $27,782.42
FORT BEND COUNTY LEVEE IMPROVEMENT DISTRICT #2
Fort Bend N/A N/A $43,372.30 $43,372.30
FORT BEND COUNTY LEVEE IMPROVEMENT DISTRICT #20
Fort Bend N/A N/A $34,562.14 $34,562.14
FORT BEND COUNTY LEVEE IMPROVEMENT DISTRICT #6
Fort Bend N/A N/A $5,554.03 $5,554.03
FORT BEND COUNTY LEVEE IMPROVEMENT DISTRICT #7
Fort Bend N/A N/A $34,938.19 $34,938.19
FORT BEND COUNTY MUNICIPAL UTILITY DISTRICT #121
Fort Bend N/A N/A $3,146.75 $3,146.75
FORT BEND COUNTY MUNICIPAL
Fort Bend N/A N/A $14,583.33 $14,583.33

45 | P a g e
APPLICANT NAME
COUNTY DR-4266 DR-4269 DR-4272 TOTAL
UTILITY DISTRICT #46 MISSOURI CITY Fort Bend N/A N/A $135,286.51 $135,286.51 PECAN GROVE MUNICIPAL UTILITY DISTRICT
Fort Bend N/A N/A $725,586.73 $725,586.73
RICHMOND Fort Bend N/A N/A $182,495.96 $182,495.96 ROSENBERG Fort Bend N/A N/A $565,103.12 $565,103.12 SIENNA PLANTATION LEVEE IMPROVEMENT DISTRICT
Fort Bend N/A $95,450.12 $1,882,710.98
$1,978,161.10
SIMONTON Fort Bend N/A $62,710.18 $244,549.41 $307,259.59 SUGAR LAND Fort Bend N/A N/A $361,825.72 $361,825.72 CLARKSVILLE CITY Gregg $8,019.86 N/A N/A $8,019.86 GREGG (COUNTY) Gregg $395,208.85 N/A N/A $395,208.85 KILGORE Gregg $544,487.70 N/A N/A $544,487.70 LONGVIEW Gregg $582,568.78 N/A N/A $582,568.78 GRIMES (COUNTY)
Grimes N/A $205,226.60 $281,320.09 $486,546.69
NAVASOTA Grimes N/A N/A $109,302.90 $109,302.90 ESTELLINE Hall N/A N/A $148,550.48 $148,550.48 HALL (COUNTY) Hall N/A N/A $560,229.23 $560,229.23 LAKEVIEW Hall N/A N/A $13,361.10 $13,361.10 MEMPHIS Hall N/A N/A $280,708.92 $280,708.92 HARDIN (COUNTY)
Hardin N/A N/A $79,816.74 $79,816.74
ALDINE INDEPENDENT SCHOOL DIST
Harris N/A $3,123.31 N/A $3,123.31
CY-FAIR VOLUNTEER FIRE DEPT
Harris N/A $116,537.58 N/A $116,537.58
CYPRESS FAIRBANKS INDEPENDENT SCHOOL DIST.
Harris N/A $1,971,755.47
N/A $1,971,755.47

46 | P a g e
APPLICANT NAME
COUNTY DR-4266 DR-4269 DR-4272 TOTAL
CYPRESS FOREST PUBLIC UTILITY DISTRICT
Harris N/A $407,432.22 N/A $407,432.22
GRANTWOODS WATER SUPPLY CORP
Harris N/A $115,011.21 N/A $115,011.21
HARRIS (COUNTY) Harris N/A $6,292,885.62
N/A $6,292,885.62
HARRIS COUNTY EMERGENCY CORPS
Harris N/A $15,261.85 N/A $15,261.85
HARRIS COUNTY EMERGENCY SERVICES DISTRICT #13
Harris N/A $47,410.92 N/A $47,410.92
HARRIS COUNTY ESD #24
Harris N/A $21,418.89 N/A $21,418.89
HARRIS COUNTY FLOOD CONTROL
Harris N/A $88,009.59 N/A $88,009.59
HARRIS COUNTY MUNICIPAL UTILITY DISTRICT # 26
Harris N/A $71,000.00 N/A $71,000.00
HARRIS COUNTY MUNICIPAL UTILITY DISTRICT #102
Harris N/A $333,379.44 N/A $333,379.44
HOUSTON Harris N/A $3,257,310.19
N/A $3,257,310.19
HOUSTON INDEPENDENT SCHOOL DISTRICT
Harris N/A $366,036.33 N/A $366,036.33
JERSEY VILLAGE Harris N/A $207,247.46 N/A $207,247.46 KATY Harris N/A $292,722.31 N/A $292,722.31 KLEIN INDEPENDENT SCHOOL DISTRICT
Harris N/A $326,446.53 N/A $326,446.53

47 | P a g e
APPLICANT NAME
COUNTY DR-4266 DR-4269 DR-4272 TOTAL
METROPOLITAN TRANSIT AUTH. OF HARRIS CO
Harris N/A $284,392.75 N/A $284,392.75
PONDEROSA VOLUNTEER FIRE ASSOC., INC. (HQ)
Harris N/A $23,102.41 N/A $23,102.41
TIMBER LANE UTILITY DISTRICT
Harris N/A $121,392.60 N/A $121,392.60
HARRISON (COUNTY)
Harrison $559,026.60 $338,645.42 N/A $897,672.02
UNCERTAIN Harrison $4,525.00 N/A N/A $4,525.00 HENDERSON (COUNTY)
Henderson $145,349.49 N/A N/A $145,349.49
POYNOR Henderson $25,354.93 N/A N/A $25,354.93 HIDALGO Hidalgo N/A N/A N/A N/A HIDALGO (COUNTY)
Hidalgo N/A N/A $60,637.43 $60,637.43
HIDALGO INDEPENDENT SCHL DIST
Hidalgo N/A N/A $28,232.69 $28,232.69
LA JOYA INDEPENDENT SCHL DIST
Hidalgo N/A N/A $29,699.33 $29,699.33
MCALLEN Hidalgo N/A N/A $4,584.40 $4,584.40 MISSION Hidalgo N/A N/A $38,753.53 $38,753.53 PALMVIEW Hidalgo N/A N/A $8,675.84 $8,675.84 PHARR Hidalgo N/A N/A $3,898.55 $3,898.55 DECORDOVA Hood N/A N/A $85,284.39 $85,284.39 GRANBURY Hood N/A N/A $198,787.96 $198,787.96 HOOD (COUNTY) Hood N/A N/A $47,785.42 $47,785.42 LIPAN Hood N/A N/A N/A N/A ROLLING HILLS WATER SERVICE, INC.
Hood N/A N/A $21,096.95 $21,096.95
CONSOLIDATED WATER SUPPLY CORP
Houston N/A N/A $83,755.08 $83,755.08
CROCKETT Houston N/A N/A $154,269.39 $154,269.39

48 | P a g e
APPLICANT NAME
COUNTY DR-4266 DR-4269 DR-4272 TOTAL
HOUSTON (COUNTY)
Houston N/A N/A $2,056,925.74
$2,056,925.74
JASPER Jasper $137,540.82 N/A N/A $137,540.82 JASPER (COUNTY) Jasper $400,342.48 N/A $620,071.55 $1,020,414.03 JONES (COUNTY) Jones N/A $1,681,750.7
0 N/A $1,681,750.70
KINGSVILLE Kleberg N/A N/A $699,753.06 $699,753.06 KINGSVILLE INDEPENDENT SCHOOL DISTRICT
Kleberg N/A N/A $100,000.00 $100,000.00
KLEBERG (COUNTY)
Kleberg N/A N/A $59,757.68 $59,757.68
RICARDO SCHOOL DISTRICT
Kleberg N/A N/A $50,000.00 $50,000.00
CITY OF BLOSSOM
Lamar $51,585.48 N/A N/A $51,585.48
LAMAR (COUNTY) Lamar $597,059.75 N/A N/A $597,059.75 GIDDINGS Lee N/A N/A $21,776.34 $21,776.34 LEE (COUNTY) Lee N/A N/A $128,369.06 $128,369.06 LEON (COUNTY) Leon N/A N/A $139,918.42 $139,918.42 DAYTON LAKES Liberty N/A N/A $25,635.75 $25,635.75 LIBERTY Liberty N/A $1,308,751.5
8 $153,868.75 $1,462,620.33
LIBERTY (COUNTY)
Liberty N/A $57,467.33 $531,822.27 $589,289.60
LIBERTY COUNTY WATER CONTROL IMP DISTRICT #5
Liberty N/A N/A $121,872.99 $121,872.99
MADISON (COUNTY)
Madison $350,818.02 N/A $126,481.14 $477,299.16
MADISONVILLE Madison N/A N/A $33,787.95 $33,787.95 JEFFERSON Marion $48,738.45 N/A N/A $48,738.45 MARION (COUNTY)
Marion $147,457.84 N/A N/A $147,457.84
BUCKHOLTS Milam N/A $30,000.00 N/A $30,000.00 MILAM (COUNTY) Milam N/A $583,286.86 N/A $583,286.86 CONROE Montgomery N/A $192,351.16 $1,033,492.6
5 $1,225,843.81
MAGNOLIA Montgomery N/A $195,370.65 $242,707.94 $438,078.59

49 | P a g e
APPLICANT NAME
COUNTY DR-4266 DR-4269 DR-4272 TOTAL
MAGNOLIA VOLUNTEER FIRE DEPT
Montgomery N/A $19,944.12 $31,925.06 $51,869.18
MONTGOMERY Montgomery N/A $7,449.97 $1,459,411.88
$1,466,861.85
MONTGOMERY (COUNTY)
Montgomery N/A $654,291.87 $1,324,761.89
$1,979,053.76
MONTGOMERY CO WATER CONTROL & IMPROVEMENT DIST #1
Montgomery N/A $115,529.37 N/A $115,529.37
MONTGOMERY COUNTY DRAINAGE DISTRICT #6
Montgomery N/A N/A $405,029.24 $405,029.24
MONTGOMERY COUNTY EMERGENCY SERVICE DISTRICT #9
Montgomery N/A N/A $15,186.33 $15,186.33
MONTGOMERY COUNTY ESD # 1
Montgomery N/A N/A $29,799.61 $29,799.61
MONTGOMERY COUNTY ESD # 4
Montgomery N/A $10,511.41 $9,216.88 $19,728.29
MONTGOMERY COUNTY ESD # 6
Montgomery N/A $26,212.42 $10,477.81 $36,690.23
MONTGOMERY COUNTY ESD #2
Montgomery N/A N/A $57,259.01 $57,259.01
MONTGOMERY COUNTY WCID
Montgomery N/A N/A $130,582.37 $130,582.37
OAK RIDGE NORTH
Montgomery N/A $35,385.14 N/A $35,385.14
PANORAMA VILLAGE
Montgomery N/A N/A $96,887.21 $96,887.21
PATTON VILLAGE Montgomery N/A $33,796.71 $813,621.50 $847,418.21 ROMAN FOREST Montgomery N/A $1,260,343.4
1 $582,342.20 $1,842,685.61

50 | P a g e
APPLICANT NAME
COUNTY DR-4266 DR-4269 DR-4272 TOTAL
SPRING CREEK UTILITY DISTRICT
Montgomery N/A $321,141.57 N/A $321,141.57
STAGECOACH Montgomery N/A N/A $99,114.25 $99,114.25 TEXAS NATIONAL MUNICIPAL UTILITY DISTRICT
Montgomery N/A $46,091.63 $292,724.97 $338,816.60
WILLIS Montgomery N/A $57,428.87 $6,945.45 $64,374.32 WOODBRANCH Montgomery N/A $91,249.41 N/A $91,249.41 WOODLOCH Montgomery N/A N/A $23,691.00 $23,691.00 FROST Navarro N/A N/A $73,990.55 $73,990.55 NAVARRO (COUNTY)
Navarro N/A N/A $230,108.86 $230,108.86
DEWEYVILLE ISD Newton $14,576,180.45
N/A N/A $14,576,180.45
NEWTON Newton $42,507.08 N/A N/A $42,507.08 NEWTON (COUNTY)
Newton $3,219,762.55 N/A N/A $3,219,762.55
NEWTON COUNTY ESD #2
Newton $41,098.06 N/A N/A $41,098.06
SOUTH NEWTON WATER SUPPLY CORP
Newton $192,440.77 N/A N/A $192,440.77
ORANGE Orange $322,594.24 N/A N/A $322,594.24 ORANGE (COUNTY)
Orange $860,255.37 N/A N/A $860,255.37
ORANGE COUNTY EMERGENCY SERVICES DISTRICT #3
Orange $6,078.04 N/A N/A $6,078.04
ORANGE COUNTY NAVIGATION & PORT DISTRICT
Orange $755,649.30 N/A N/A $755,649.30
WEST ORANGE Orange $9,341.20 N/A N/A $9,341.20 WEST ORANGE-COVE CONSOLIDATED ISD
Orange $61,016.33 N/A N/A $61,016.33
GORDON Palo Pinto N/A N/A $70,505.35 $70,505.35 MINGUS Palo Pinto N/A N/A $591,376.57 $591,376.57

51 | P a g e
APPLICANT NAME
COUNTY DR-4266 DR-4269 DR-4272 TOTAL
PALO PINTO (COUNTY)
Palo Pinto N/A N/A $188,875.40 $188,875.40
STRAWN Palo Pinto N/A N/A $262,138.91 $262,138.91 ALEDO INDEPENDENT SCHOOL DIST
Parker $47,014.00 N/A N/A $47,014.00
PARKER (COUNTY)
Parker $6,166.04 N/A N/A $6,166.04
PARKER COUNTY EMERGENCY SERVICE DISTRICCT #6
Parker $4,091.59 N/A N/A $4,091.59
PARKER COUNTY ESD #7
Parker $3,576.52 N/A N/A $3,576.52
CORRIGAN Polk N/A N/A $72,144.60 $72,144.60 POLK (COUNTY) Polk N/A N/A $472,181.35 $472,181.35 CLARKSVILLE Red River $9,046.60 N/A N/A $9,046.60 RED RIVER (COUNTY)
Red River $101,806.00 N/A N/A $101,806.00
BEECHWOOD WATER SUPPLY CORPORATION
Sabine $59,266.51 N/A N/A $59,266.51
SABINE (COUNTY) Sabine $298,488.18 N/A N/A $298,488.18 SAN AUGUSTINE (COUNTY)
San Augustine
$168,448.53 N/A N/A $168,448.53
COLDSPRING San Jacinto N/A $40,270.99 N/A $40,270.99 POINT BLANK (CORPORATE NAME FOR POINTBLANK)
San Jacinto N/A $28,310.00 N/A $28,310.00
SAN JACINTO (COUNTY)
San Jacinto N/A $1,467,094.11
$990,334.01 $2,457,428.12
SAN JACINTO COUNTY EMERGENCY SERVICES DISTRICT
San Jacinto N/A N/A $13,760.79 $13,760.79
JOAQUIN Shelby $15,260.33 N/A N/A $15,260.33

52 | P a g e
APPLICANT NAME
COUNTY DR-4266 DR-4269 DR-4272 TOTAL
PAXTON WATER SUPPLY CORPORTATION
Shelby $16,054.00 N/A N/A $16,054.00
SHELBY (COUNTY) Shelby $806,645.43 N/A N/A $806,645.43 ARP Smith N/A $102,665.82 N/A $102,665.82 LINDALE Smith N/A $77,624.84 N/A $77,624.84 SMITH (COUNTY) Smith N/A $198,287.44 N/A $198,287.44 WHITEHOUSE Smith N/A $92,862.90 N/A $92,862.90 GLEN ROSE Somervell N/A N/A $95,834.00 $95,834.00 SOMERVELL (COUNTY)
Somervell N/A N/A N/A N/A
SOMERVELL COUNTY WATER DIST
Somervell N/A N/A $145,878.54 $145,878.54
BLUEBONNET ELECTRIC COOPERATIVE, INC.
Statewide N/A $511,568.90 $1,642,953.76
$2,154,522.66
CHEROKEE COUNTY ELECTRIC COOPERATIVE
Statewide N/A $294,106.05 N/A $294,106.05
HOUSTON CNTY ELECTRIC COOP ASSN, INC
Statewide N/A N/A $103,186.65 $103,186.65
JASPER-NEWTON ELECTRIC COOP, INC
Statewide $194,700.80 N/A $65,633.31 $260,334.11
LAMAR COUNTY ELECTRIC COOPERATIVE
Statewide $333,684.70 N/A N/A $333,684.70
LOWER COLORADO RIVER AUTHORITY
Statewide N/A $1,000,000.00
$218,769.86 $1,218,769.86
MID-SOUTH ELECTRIC CO-OP DBA MID-SOUTH SYNERGY
Statewide N/A N/A $416,205.23 $416,205.23

53 | P a g e
APPLICANT NAME
COUNTY DR-4266 DR-4269 DR-4272 TOTAL
PANOLA-HARRISON ELECTRIC COOPERATIVE
Statewide $29,756.14 $67,729.05 N/A $97,485.19
PORT OF HOUSTON AUTHORITY
Statewide N/A $1,119,370.00
N/A $1,119,370.00
SABINE RIVER AUTHORITY OF TEXAS
Statewide $1,463,977.67 N/A N/A $1,463,977.67
SAN JACINTO RIVER AUTHORITY
Statewide N/A N/A $269,053.96 $269,053.96
TEXAS A&M UNIVERSITY - KINGSVILLE
Statewide N/A N/A $126,485.46 $126,485.46
TEXAS A&M VETERINARY EMERGENCY TEAM
Statewide N/A N/A $77,645.32 $77,645.32
TEX-LA ELECTRIC COOP OF TEXAS, INC
Statewide $55,580.00 N/A N/A $55,580.00
TX A&M FOREST SERVICE
Statewide $140,606.03 N/A $187,429.54 $328,035.57
TX A&M ENGINEERING EXTENSION SERVICE
Statewide $668,323.14 $818,299.85 $1,943,820.12
$3,430,443.11
TX DEPARTMENT OF CRIMINAL JUSTICE
Statewide N/A N/A $1,209,027.75
$1,209,027.75
TX DEPARTMENT OF PUBLIC SAFETY
Statewide $379,280.56 $10,694.00 $773,423.23 $1,163,397.79
TX DEPARTMENT OF STATE HEALTH SERVICES
Statewide $426,340.33 $115,656.51 $206,256.48 $748,253.32

54 | P a g e
APPLICANT NAME
COUNTY DR-4266 DR-4269 DR-4272 TOTAL
TX DEPARTMENT OF TRANSPORTATION
Statewide $474,422.63 $535,330.00 $1,281,996.65
$2,291,749.28
TX DIVISION OF EMERGENCY MANAGEMENT
Statewide $447,674.99 $423,109.00 $568,799.03 $1,439,583.02
TX GENERAL LAND OFFICE
Statewide $12,889.20 N/A $447,607.87 $460,497.07
TX MILITARY DEPARTMENT
Statewide $308,861.28 $163,743.49 $481,742.16 $954,346.93
TX PARKS AND WILDLIFE DEPARTMENT
Statewide $393,707.42 $36,193.41 $1,681,969.28
$2,111,870.11
UNIVERSITY OF TEXAS - CENTER FOR SPACE RESEARCH
Statewide $52,220.08 $20,213.53 $56,228.86 $128,662.47
WOOD COUNTY ELECTRIC COOPERATIVE
Statewide N/A $550,000.00 N/A $550,000.00
BRECKENRIDGE Stephens N/A N/A $88,760.68 $88,760.68 STEPHENS (COUNTY)
Stephens N/A N/A $1,387,802.51
$1,387,802.51
THROCKMORTON (COUNTY)
Throckmorton
N/A N/A N/A N/A
TRAVIS (COUNTY) Travis N/A N/A $15,000.00 $15,000.00 TRINITY Trinity N/A N/A $8,461.13 $8,461.13 TRINITY (COUNTY)
Trinity N/A N/A $1,134,562.67
$1,134,562.67
COLMESNEIL Tyler $27,710.92 N/A $79,841.56 $107,552.48 COLMESNEIL ISD Tyler N/A N/A $12,171.83 $12,171.83 TYLER (COUNTY) Tyler $427,982.89 N/A $251,885.33 $679,868.22 WOODVILLE Tyler $46,305.00 N/A $37,736.36 $84,041.36 GLADEWATER Upshur N/A $135,995.57 N/A $135,995.57 UPSHUR RURAL ELECTRIC CO-OP
Upshur N/A $819,624.32 N/A $819,624.32
VAN ZANDT (COUNTY)
Van Zandt N/A $1,023,459.43
N/A $1,023,459.43

55 | P a g e
APPLICANT NAME
COUNTY DR-4266 DR-4269 DR-4272 TOTAL
WALKER (COUNTY)
Walker $401,839.91 N/A $692,957.20 $1,094,797.11
WALKER COUNTY SPECIAL UTILITY DISTRICT
Walker N/A N/A $85,696.06 $85,696.06
BROOKSHIRE Waller N/A $150,196.04 N/A $150,196.04 BROOKSHIRE KATY-DRAINAGE DISTRICT
Waller N/A $1,839,530.40
N/A $1,839,530.40
HEMPSTEAD Waller N/A N/A $298,593.46 $298,593.46 MONAVILLE VOLUNTEER FIRE DEPT
Waller N/A N/A $6,825.55 $6,825.55
PRAIRIE VIEW Waller N/A $33,061.44 $3,445.18 $36,506.62 WALLER Waller N/A $7,733.13 $12,639.68 $20,372.81 WALLER (COUNTY)
Waller N/A $364,740.31 $385,017.03 $749,757.34
BRENHAM Washington N/A $91,804.37 $3,221,776.98
$3,313,581.35
BRENHAM INDEPENDENT SCHOOL DISTRICT
Washington N/A N/A $51,756.46 $51,756.46
FAITH MISSION & HELP CTR
Washington N/A N/A $134,487.45 $134,487.45
WASHINGTON (COUNTY)
Washington N/A $185,843.97 $3,921,894.78
$4,107,738.75
JUST DO IT NOW, INC.
Wharton N/A $131,632.25 N/A $131,632.25
WHARTON Wharton N/A $312,247.88 N/A $312,247.88 WHARTON (COUNTY)
Wharton N/A $214,624.25 N/A $214,624.25
WOOD (COUNTY) Wood N/A $13,912.45 N/A $13,912.45
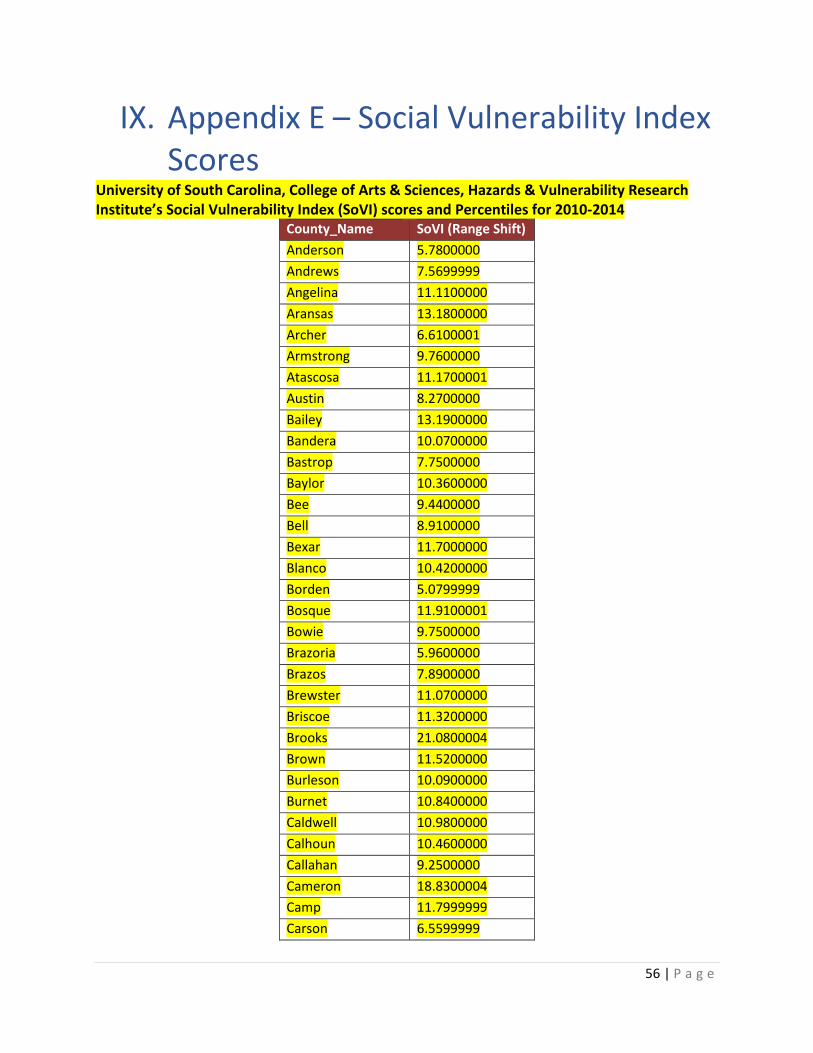
56 | P a g e
IX. Appendix E – Social Vulnerability Index Scores
University of South Carolina, College of Arts & Sciences, Hazards & Vulnerability Research Institute’s Social Vulnerability Index (SoVI) scores and Percentiles for 2010-2014
County_Name SoVI (Range Shift) Anderson 5.7800000 Andrews 7.5699999 Angelina 11.1100000 Aransas 13.1800000 Archer 6.6100001 Armstrong 9.7600000 Atascosa 11.1700001 Austin 8.2700000 Bailey 13.1900000 Bandera 10.0700000 Bastrop 7.7500000 Baylor 10.3600000 Bee 9.4400000 Bell 8.9100000 Bexar 11.7000000 Blanco 10.4200000 Borden 5.0799999 Bosque 11.9100001 Bowie 9.7500000 Brazoria 5.9600000 Brazos 7.8900000 Brewster 11.0700000 Briscoe 11.3200000 Brooks 21.0800004 Brown 11.5200000 Burleson 10.0900000 Burnet 10.8400000 Caldwell 10.9800000 Calhoun 10.4600000 Callahan 9.2500000 Cameron 18.8300004 Camp 11.7999999 Carson 6.5599999
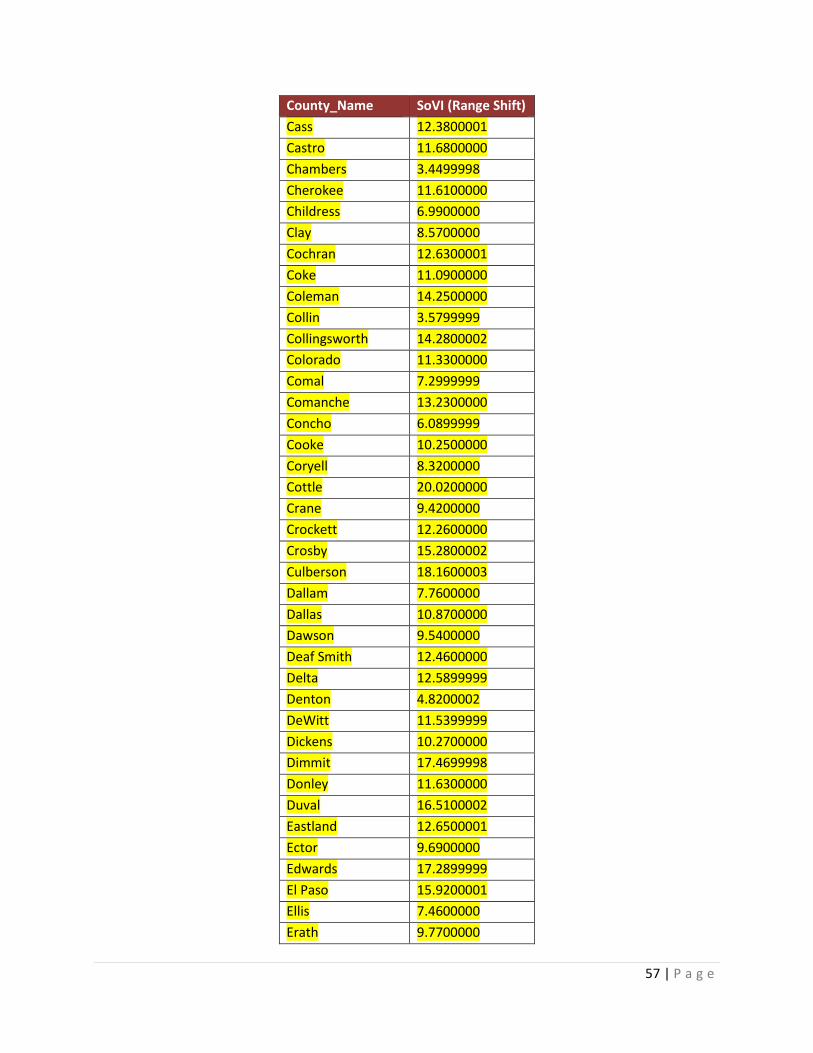
57 | P a g e
County_Name SoVI (Range Shift) Cass 12.3800001 Castro 11.6800000 Chambers 3.4499998 Cherokee 11.6100000 Childress 6.9900000 Clay 8.5700000 Cochran 12.6300001 Coke 11.0900000 Coleman 14.2500000 Collin 3.5799999 Collingsworth 14.2800002 Colorado 11.3300000 Comal 7.2999999 Comanche 13.2300000 Concho 6.0899999 Cooke 10.2500000 Coryell 8.3200000 Cottle 20.0200000 Crane 9.4200000 Crockett 12.2600000 Crosby 15.2800002 Culberson 18.1600003 Dallam 7.7600000 Dallas 10.8700000 Dawson 9.5400000 Deaf Smith 12.4600000 Delta 12.5899999 Denton 4.8200002 DeWitt 11.5399999 Dickens 10.2700000 Dimmit 17.4699998 Donley 11.6300000 Duval 16.5100002 Eastland 12.6500001 Ector 9.6900000 Edwards 17.2899999 El Paso 15.9200001 Ellis 7.4600000 Erath 9.7700000

58 | P a g e
County_Name SoVI (Range Shift) Falls 13.7100000 Fannin 9.1000000 Fayette 10.6500000 Fisher 12.8499999 Floyd 14.0799999 Foard 15.9699998 Fort Bend 4.0100002 Franklin 10.4300000 Freestone 9.7100000 Frio 11.2800000 Gaines 8.2300000 Galveston 7.8700000 Garza 8.9800000 Gillespie 13.6200001 Glasscock 1.6200003 Goliad 9.6300000 Gonzales 13.2899999 Gray 9.3100000 Grayson 10.4000000 Gregg 10.2400000 Grimes 8.3600000 Guadalupe 7.8900000 Hale 11.9600000 Hall 16.0200000 Hamilton 13.3199999 Hansford 9.6000000 Hardeman 14.6599998 Hardin 6.4500000 Harris 9.8700000 Harrison 8.9600000 Hartley 2.3299999 Haskell 10.9400000 Hays 6.9000001 Hemphill 9.9800000 Henderson 10.9900000 Hidalgo 17.6100001 Hill 11.9100001 Hockley 10.4900000 Hood 9.1300000

59 | P a g e
County_Name SoVI (Range Shift) Hopkins 10.2400000 Houston 11.8499999 Howard 9.5800000 Hudspeth 17.2100000 Hunt 9.7700000 Hutchinson 9.7000000 Irion 7.5899999 Jack 5.9400000 Jackson 9.3200000 Jasper 10.3900000 Jeff Davis 13.8499999 Jefferson 10.6000000 Jim Hogg 14.6799998 Jim Wells 14.5000000 Johnson 6.7300000 Jones 7.3399999 Karnes 7.6400001 Kaufman 7.5399999 Kendall 7.0499999 Kenedy 14.8699999 Kent 14.0100002 Kerr 13.8000002 Kimble 15.3800001 King 10.1600000 Kinney 12.4300000 Kleberg 13.1300001 Knox 14.3499999 La Salle 13.3700001 Lamar 12.0699999 Lamb 13.6100001 Lampasas 10.2300000 Lavaca 11.1300000 Lee 9.5000000 Leon 10.9099999 Liberty 7.1700001 Limestone 11.4300000 Lipscomb 5.6399998 Live Oak 10.1900000 Llano 14.5599999

60 | P a g e
County_Name SoVI (Range Shift) Loving 4.7899999 Lubbock 9.9400000 Lynn 12.2100000 Madison 6.5399999 Marion 12.0399999 Martin 9.6000000 Mason 11.9700000 Matagorda 12.6700001 Maverick 19.5300002 McCulloch 11.9700000 McLennan 11.2100000 McMullen 9.8400000 Medina 8.9900000 Menard 15.2600002 Midland 6.9000001 Milam 11.7600000 Mills 11.9800000 Mitchell 6.8700001 Montague 10.0500000 Montgomery 5.5599999 Moore 11.1800000 Morris 12.1800000 Motley 7.2800000 Nacogdoches 10.5400000 Navarro 12.0699999 Newton 9.1100000 Nolan 13.7000000 Nueces 12.8299999 Ochiltree 9.0800000 Oldham 6.2400000 Orange 7.4700000 Palo Pinto 11.2800000 Panola 8.1100000 Parker 5.2700000 Parmer 11.1200000 Pecos 9.1000000 Polk 10.6200000 Potter 12.2000000 Presidio 20.0700002

61 | P a g e
County_Name SoVI (Range Shift) Rains 11.0700000 Randall 7.1200001 Reagan 9.0200000 Real 18.2300000 Red River 13.2000000 Reeves 11.3500000 Refugio 14.7700000 Roberts 4.4800000 Robertson 11.9400000 Rockwall 3.9499998 Runnels 14.0599999 Rusk 7.5399999 Sabine 13.5000000 San Augustine 12.5399999 San Jacinto 9.5500000 San Patricio 11.8700001 San Saba 9.5500000 Schleicher 12.5899999 Scurry 8.6900000 Shackelford 9.1700000 Shelby 10.7500000 Sherman 8.5000000 Smith 10.0700000 Somervell 8.4099999 Starr 23.2500005 Stephens 10.1000000 Sterling 11.0100000 Stonewall 14.3499999 Sutton 9.0500000 Swisher 10.1800000 Tarrant 8.4400000 Taylor 10.9000000 Terrell 13.6700001 Terry 12.2000000 Throckmorton 13.9299998 Titus 11.3300000 Tom Green 11.2200000 Travis 7.0899999 Trinity 14.4800000

62 | P a g e
County_Name SoVI (Range Shift) Tyler 8.4000000 Upshur 8.1700001 Upton 11.5100000 Uvalde 15.8800001 Val Verde 15.3400001 Van Zandt 10.1000000 Victoria 11.2600000 Walker 6.4100001 Waller 7.9200001 Ward 11.3600000 Washington 10.1600000 Webb 18.4199996 Wharton 12.5599999 Wheeler 10.1800000 Wichita 9.8000000 Wilbarger 14.1599998 Willacy 17.0000000 Williamson 5.7899999 Wilson 7.5100000 Winkler 11.2400000 Wise 6.3399999 Wood 11.6599999 Yoakum 10.0400000 Young 11.6300000 Zapata 18.7700000 Zavala 19.6600003


![Disaster Recovery Center (Disaster Assistance … Library/Disaster Recovery Center...Disaster Recovery Center (Disaster Assistance Center) Standard Operating Guide [Appendix to: ]](https://static.documents.pub/doc/80x56/5b0334ba7f8b9a2d518bd9d9/disaster-recovery-center-disaster-assistance-librarydisaster-recovery-centerdisaster.jpg)


