49
STATE-OF-THE-ART METHODOLOGYOF FOREST INVENTORY:A SYMPOSIUM PROCEEDINGS
Syracuse, New YorkJuly 30-August 5, 1989
Technical editors:Vernon J. LaBauProject Leader, Forest Inventory and AnalysisPacific Northwest Research StationAnchorage, Alaska
Tiberius CuniaProfessor of Statistics and Operations ResearchCollege of Environmental Science and ForestryState University of New YorkSyracuse, New York
Sponsored by:State University of New York, College of Environmental Science and ForestryPacific Northwest Research StationSociety of American Foresters - Forest Inventory Working Group
Cosponsors:I.U.F.R.O. S4.02—Subject Group on Forest Resource InventorySociety of American Foresters—Biometrics Working GroupSociety of American Foresters—Remote Sensing and PhotogrammetryWorking Group
Published by:U.S. Department of Agriculture, Forest ServicePacific Northwest Research StationPortland, OregonGeneral Technical Report PNW-GTR-263July 1990


PREFACE
The state-of-the-art of forest inventory methodology, being closely integrated with thefast-moving, high technology computer world, has been changing at a rapid pace over the past decade.Several successful conferences were held during the 1980s with the goal and purpose of staying abreastof such change.
This symposium was conceived, not just with the idea of helping make professional and technicalforest mensurationists and managers aware of these changes, but also to give participants hands-onworkshop experience with mensurational and inventory problems by using these latest techniques andconcepts.
The objective of the symposium was to review the theory and practice of the state-of-the-artmethodology of forest inventory through workshop modules, expository papers, contributed papers,posters, and discussions for those involved in teaching, research, and practice of forest inventory.
The results of the symposium, highlighted and summarized in this compendium, attest to theamount of change, the high level of interest, and the competence of the people working in forestinventory and mensuration. There are 86 contributed papers in these proceedings, many invited by theprogram committee, to provide a framework for the general symposium. The unique factor in thissymposium was the workshops where specialists presented papers or led discussion sessions. Thesewere followed by additional discussion periods and, in some situations, hands-on exposure to the newmethodologies.
The goals and purposes of the symposium were met and, in general, exceeded. The programcommittee hopes that these proceedings will serve to continue to "spread the word" on thestate-of-the-art of forest inventory methodology. It continues to change at an ever increasing rate, sodon't take too long to contemplate this tome. We hope the reader will put some of the new ideas andconcepts into practice and enjoy the thrill of using new information and techniques. Be a part of thenext generation of new ideas and concepts.
PROGRAM COMMITTEE
Toby Atterbury, Atterbury Consultants, Beaverton, ORJames Barrett, University of New Hampshire, Durham, NHTiberius (Mike) Cunia, State University of New York, Syracuse, NYVernon J. (Jim) LaBau, USDA Forest Service, Anchorage, AKCarlton Newton, University of Vermont, Burlington, VT

ACKNOWLEDGMENTS AND DISCLAIMERS
The program committee for this symposium acknowledges the support of the sponsors andcosponsors: the International Union of Forest Research Organizations (IUFRO), the Society ofAmerican Foresters, and State University of New York (SUNY), College of Environmental Scienceand Forestry. Special appreciation must go to SUNY for hosting the symposium. Assistance by theUSDA Forest Service, Pacific Northwest Station, Portland, Oregon, in editing and publishing theseproceedings is also greatly appreciated. The support of the Society of American Foresters' Inventory,Biometrics, and Remote Sensing and Photogrammetry working groups was of great importance, as wasthe support of the IUFRO subject group of Forest Resource Inventory (S 4.02.02).
The responsibility for technical and grammatical review and accuracy in these papers wasassigned to the authors as a condition for contributing their papers. The editorial staff responsibilitywas limited to checks of consistency in manuscript formatting, indexing, titling, and cover preparation,as well as providing format guides and manuscript material to the authors.
The use of trade, firm, or corporation names in these proceedings is for information andconvenience of the reader. Such use does not constitute official endorsement or approval by thesymposium program committee or the publisher, sponsors and cosponsors of any product or service tothe exclusion of others that may be suitable.

Contents First Section: Needs, Objectives and Uses of Forest InventoriesModerator: Charles T. Scott
The Platonic Verses and Inventory Objectives 1H. Gyde Lund
Forest Inventory Purposes and Goals 8Toby Atterbury
Objectives of a National Forest Inventory French NFI Meeting Users Needs 11R.B. Chevrou
Forest Information Needs of Concerned Groups in the State of Maine 17Don D. Tarbet and John H. Cashwell
Using Forest Inventory Data in South Australia 23J.W. Leech
Contracting for Inventory Plot Measurement: the Minnesota Experience 29D. Heinzen and S. Flackey
Second Section: Forest Inventory and Sampling DesignsModerator: Timothy G. Gregoire
Line Intersect Sampling: An Historical Perspective 33William G. Warren
Inventories of U.S. Wetlands 39W.E. Frayer
Precise Tree Frequency Estimates in Horizontal and Vertical Point Sampling 46Thomas W. Beers
A Comprehensive Concept for Future Forest Inventories 52Walter Bitterlich
Efficiency of Two-Phase and Two-Stage Sampling for Tree Heightsin Forest Inventory 56
H. Gary Murchison and Alan R. Ek
Sampling for Logging Residue and Waste in British Columbia 67Stephen A.Y. Omule and David W. Ormerod
Critical Height Sampling: A Workshop on the Current State of the Technique 74Kim lies
Sampling and Modelling Visual Component Dynamics of Forested Areas 84Victor A. Rudis
Model-rBased Sampling 86John C. Rennie
Importance Sampling for Volume With a Portable Computer 88Harry T. Valentine, Timothy G. Gregoire, and George M. Furnival
Third Section: Monitoring Forests Through Succesive InventoriesModerator: James T. Bones
An Overview of Fixed Versus Variable-Radius Plots for Successive Inventories 97Charles T. Scott
Designing a New National Forest Inventory for Switzerland 105Michael Koehl
Developing ATLAS Growth Parameters From Forest Inventory Plots 112John R. Mills
Forest Change - An Assessment of Nationwide Forest Inventory Methods 119Richard Birdsey and Hans Schreuder
Fixed-Versus Variable-Radius Plots for Change Estimation 126Charles T. Scott and James Alegria
Assessing Pine Regeneration for the South Central United States 133William H. McWilliams
A Permanent Plot System Designed for Making Natural ResourcesManagement Decisions in a Rapidly Urbanizing County 141
James M. Hill, Joshua L. Royte, Jil M. Swearingen,Keith Van Ness, William Warncke, and John E. Hcnch
INFOR_1: An Analysis Program for Permanent Forest InventoriesWith Systematic Sampling 149
Piermaria Corona and Agostino Ferrara
Inventory to Support Silvicultural Decisions 158Susan L. Stout
Funding, Pests and Hardwood Log Grades: User-Driven Cooperative Projectsin the North Central States 167
M.R. Carroll

Fourth Section: On the Estimation Process In Forest InventoryModerator: Carl Newton
Forest Inventory: On the Structure of Error of Estimates 169Tiberius Cunia
Use of Regression Techniques in Industrial Forest Inventories 177Michael L. Clutter
A Multivariate Composite Estimator 181Edwin J. Green and William E. Strawderman
The Variances of Some Compatible Estimators for the Componentsof Growth From Remeasured Point Samples 189
Francis A. Roesch, Jr.
The Truncated Law 197R.B. Chevrou
Sampling Mixed Stands Using Product Estimator 204Krishna P. Rustagi
Fifth Section: Tree Volume and BiomassModerator: J. Barrett
Use of Profile in Tree Volume Estimation 213David Bruce and Timothy A. Max
Developing a Simple Stem Taper Equation From Total Stem VolumeEquations or Tables 221
Piermaria Corona and Agostino Ferrara
A Sampling Procedure for Board-Foot Volume of Standing Trees 228Timothy G. Gregoire, George M. Furnival, and
Harry T. Valentine
Estimating the Volume of a Radiata Pine Stand Using Importance Sampling 237Harry V. Wiant, Jr., and Geoffrey B. Wood
Biomass Estimates for Tropical Forests Based on Existing Inventory Data 246Andrew J.R. Gillespie, Sandra Brown, and Ariel E. Lugo
Construction and Application of Biomass Regressions to Size-Classes of Trees 254Xiaoming Yang and Tiberius Cunia
Fractal Geometry and Forest Measurements 260Boris Zeide
Sixth Session: Remote Sensing and Forest InventoriesModerator: Alan R. Ek
A Survey of Remote Sensing Methodology for Forest Inventory 267M.J. Duggin, P.F. Hopkins, and R.H. Brock
The Use of Aerial Photographs and Angle-Gauge Samplingof Tree Crown Diameters for Forest Inventory 286
Lawrence R. Gering, Dennis M. May, and Kurt B. Teuber
Satellite Remote Sensing and Inventory of Minnesota Forest Resources 290M.E. Bauer, T.E. Burk, A.R. Ek, S.C. Ahearn, and L.P. Queen
Inventory of the Jarrah Forest of Western Australia Using Large-ScalePhotography and Ground Sampling 298
Paul Biggs
A Practical Example of Forest Mapping and Timber Volume EstimationUsing Landsat-5 TM Imagery 303
David Chung Liang Lee, Rene Antonio Novaes,Pedro Hernandez Filho, and Flavio Jorge Ponzoni
An Aerial Photographic Key as an Aid to Improving PhotointerpretationAccuracy 310
Rachel Riemann Hershey
Photointerpretation Accuracy Across Two Decades of Forest Inventory 318G. Deegan and W.A. Befort
On Using Non-Imageable Point for Measuring Object Height onVertical Aerial Photograph 324
C.J. Liu
Organizing Statewide 35mm Photography in Support of Forest Inventory 332W.A. Befort and G. Deegan
A Study of Pinus Mugo-Stands in the Karwcndcl Mountain Region(Tyrol, Austria) 336
Josef Hackl and Erwin Knappitsch
Seventh Section: Forest Health and DeclineModerator: T. Cunia
Environmental Health Concerns: A Role for Forest Inventory and Monitoring 341Joseph E. Barnard

Monitoring the Health of White Pine in New Hampshire (1959-1988) 349John P. Jastrzembski and James P. Barrett
National Inventories and Inventories of Endangered Forests in Europe 356Michael Koehl
Indicator Plants in Forest Health Surveys 364Paul C. Van Deusen and Joseph E. Barnard
Eighth Section: Spacial Analysis of Inventory DataModerator: Joseph C. Mawson
Spatial Analysis of Forest Inventory Data 369Carlton M. Newton and Steven T. Bower
Spatial Analysis Using a Systematic Grid of Forest InventoryPlots: Selected Examples for the South Central United States 379
William H. McWilliams and Joanne L. Faulkner
Application of Permutation Techniques in Analyzing Spatial Patterns 384Robin M. Reich, Paul W. Mielke, Jr., and Frank G. Hawksworth
Ninth Section: Forest Inventory and Geographic Information SystemsModerator: Toby Atterbury
Geographic Information Systems: Where Do We Stand? 391Lee Pierce Herrington
Growth Models and Geographic Information Systems 397Sarah Osborne
Building Predictive Models from Geographic Information Systems 403David L. Verbyla
Tenth Section: Mathematical Models and Forest InventoryModerator: John C. Rennie
Status and Future of Growth and Yield Models 409Harold E. Burkhart and Thomas M. Brooks
Interfacing Forest Inventory With Growth and Yield Models 415Alan R. Ek
Modeling With Data of the First Swiss National Forest Inventory 420Edgar Kaufmann
Workshop 1: Updating Methods for Forest InventoriesModerator: Richard A. Birdsey
Updating Methods for Forest Inventories - An Overview 429Richard Birdsey
Remote Sensing Techniques for Updating Forest Inventories 436Kurt B. Teuber
Inventory Updates: Overview of the North Central Experience 442W. Brad Smith
Updating Inventories in Western Oregon and Washington Using TreeGrowth, Mortality and Harvest Models Developed from PermanentPlot Data 449
Colin D. MacLean and Neil McKay
Kalman Filter to Update Forest Cover Estimates 457Raymond L. Czaplewski
Workshop 2: Integrating Multiple Value Forest Surveys Into Timber SurveyModerator: Victor A. Rudis
The Importance of Forest Inventories to the Conservation of Biological Diversity 467Richard E. Rice
The Forest Inventory: Incorporating Fisheries and Wildlife Values 475Frances A. Hunt
Linking Multiple Resources Analyses to Land Use and TimberManagement: Application and Error Considerations 478
Curtis H. Flather, Linda A. Joyce, and Rudy M. King
Using Land Base Inventories to Access Range and Wildlife Resources Nationally 486Linda A. Joyce and Curtis H. Flather
Multiple Value Forest Surveys in the Midsouth States 495Victor A. Rudis
Expanding Conventional Timber Inventories into a Broader, MultiresourceInventory in the Southeastern States 505
Noel D. Cost
Developing Integrated Forest Surveys for the.Rocky Mountain States 512Renee O'Brien
Nonindustrial Wood Resources in the Rocky Mountain States 517J. David Born
Multiresource Inventories in Alaska 522Bert Mead and Vernon J. LaBau
Multiresource Inventories in the Pacific Coast States—Progressand Future Direction 529
Janet L. Ohmann
State-of-the-Art Methodology of Forest Inventory: Wildlife HabitatAssessment in the Northeastern United States 538
Robert T. Brooks
Workshop 3: Accessing USDA Forest Service Forest Inventoryand Analysis (FIA) Data
Moderator: Mark Hanseh
The Eastwide Forest Inventory Database 545Mark H. Hansen
Access to Forest Inventory Data for the Southeast 553Raymond M. Sheffield
Interactive Access to Forest Inventory Data for the South Central United States 556William H. McWilliams
North Central Forest Inventory Data on a Microcomputer 558Jerold T. Hahn and Mark H. Hansen
Workshop 4: Surveying With Partial ReplacementModerator: T. Cunia
Successive Forest Inventories: Basic SPR Approach for Two Measurements 565Tiberius Cunia
Successive Forest Inventories: Extensions of the Basic Approach 572Tiberius Cunia
Successive Forest Inventories: Error of Biomass RegressionsPart I: CFI With Permanent Plots Only 580
Tiberius Cunia
Successive Forest Inventories: Error of Biomass RegressionsPart II: CFI With Partial Replacement of Plots 586
Tiberius Cunia
Author Ahearn, S. C. 290Alcgria, James 126Atterbury, Toby 8Barnard, Joseph E. 341,364Barrett, James P. 349Bauer, M. E. 290Beers, Thomas W. 46Befort,W. A. 318,332Biggs, Paul 298Birdsey, Richard 119,429Bitterlich, Walter 52Bom, David 517Bower, Steven T. 369Brock, R. H. 267Brooks, Robert T. 538Brooks, Thomas M. 409Brown, Sandra 246Bruce, David • 213Burk, T. E. 290Burkhart, Harold E. 409Carroll, M. R. 167Cashwell, John H. 17Chevrou.R. B. 11,197Clutter, Michael L. 177Corona, Piermaria 149, 221Cost, Noel D. 505Cunia, Tiberius 169, 254, 565, 572, 580, 586Czaplewski, Raymond L. 457Deegan, G. 318, 332Duggin, M. J. 267Ek, AlanR. 56,290,415Faulkner, Joanne L. 379Fcrrara, Agostino 149, 221Filho, Pedro Hernandez 303Flackey.S. 29Flathcr, Curtis H. 478,486Prayer, W. E. , 39Furnival George M. 88, 228Gcring, Lawrence R. 286Gillespie, Andrew J. R. 246Green, Edwin J. 181Gregoire, Timothy G. 88, 228Hackl, Josef 336Hahn, Jerold T. 558Hansen, Mark H. 545, 558Hawksworth, Frank G. 384Heinzen, D. 29Hcnch.JohnE. 141Hcrrington, J^ee Pierce 391Hcrshey, Rachel Riemann 310
Hill, James M. 141Hopkins, P. F. 267Hunt, Frances A. 475Jastrzembski, John P. 349Joyce, Linda A. 478, 486lies, Kim 74Kaufmann, Edgar 420King, Rudy M. 478Knappitsch, Erwin 336Koehl, Michael 105, 356LaBau, Vernon J. 522Lee, David Chung Liang 303Leech, J. W. 23Liu, C. J. 324Lugo, Ariel E. 246Lund, H. Gyde 1MacLean, Colin D. 449McKay, Neil 449Max, Timothy A. 213May, Dennis M. 286McWilliams, William H. 133, 379, 556Mead, Bert 522Mielke, Paul W., Jr. 384Mills, John R. 112Murchison, H. Gary 56Newton, Carlton M. . 369Novaes, Ren6 Antonio 303O'Brien, Renee 512Ohmann, Janet L. 529Omule, Stephen A. Y. 67Ormcrod, David W. 67Osborne, Sarah 397Ponzoni, Flavio Jorge 303Queen, L. P. 290Reich, Robin M. 384Rennie, John C. 86Rice, Richard E. 467Roesch, Francis A., Jr. 189Royte, Joshua L. 141Rudis, Victor A. 84,495Rustagi, Krishna P. 204Schreuder, Hans 119Scott, Charles T. 97, 126Sheffield, Raymond M. 553Smith, W. Brad 442Stout, Susan L. 158Strawderman, William E. 181Swearingen, Jil M. 141Tarbet, Don D. 17Teuber, Kurt B. 286,436
Valentine, Harry T. 88, 228Van Deusen, Paul C. 364Van Ness, Keith 141Verbyla, David L. 403Warncke, William 141Warren, William G. 33Wiant, Harry V., Jr. 237Wood, Geoffrey B. . 237Yang, Xiaominng 254Zeide, Boris 260

Needs, Objectives and Uses of Forest InventoriesModerator: Charles T. Scott
H. Gyde Lund, The Platonic Verses and Inventory Objectives
Toby Atterbury, Forest Inventory Purposes and Goals
R.B. Chevrou, Objectives of a National Forest Inventory French NFI Meeting Users Needs
Don D. Tarbet and John H. Cashwell, Forest Information Needs of Concerned Groups inthe State of Maine
J.W. Leech, Using Forest Inventory Data in South Australia
D. Heinzen and S. Flackey, Contracting for Inventory Plot Measurement: the MinnesotaExperience
[•I

The Platonic Verses and Inventory Objectives
H. Gyde LundInventory Forester
USDA Forest Service, Timber Management StaffP.O. Box 96090
Washington, DC 20090-6090
ABSTRACT
Platonic verses are writings that tend toward purely spiritual or ideal situations such as thosefound in the Bible and other sacred writings or in some of our natural resource management laws andnational direction. Inventory objectives are summary statements of the desired end results of surveys ofgoods and materials in stock. The process of converting information requests to inventory objectives isdiscussed and personal thoughts on additional inventory objectives, use of existing information,subjective sampling, moving plot locations, and use of allowable sampling errors are given.
In the Beginning...
An inventory is an accounting of goods and materials in stock. The following steps are usuallyfollowed to implement an inventory:
1) Define the objectives for the inventory;
2) Determine the information needs, standards, and methods to collect the data to meetobjectives;
3) Gather the data; and
4) Compute and report the results.
Of these, step number one is often the most difficult to achieve. This is because objectives forinventory often are not spelled out clearly. Consider the following direction extracted from the Forestand Rangeland Renewable Resource Planning Act of 1974 (USDA Forest Service, 1983):
Sec. 3. Renewable Resource Assessment. The Assessment shall...include but not limited to:...(2) An inventory, based on information developed by the Forest Service and other Federalagencies, of present and potential renewable resources....
Sec. 5. National Forest Systems Resource Inventories. As part of the Assessment, the Secretaryof Agriculture shall develop and maintain on a continuing basis a comprehensive andappropriately detailed inventory of all National Forest Systems lands and renewable resources.This inventory shall be kept current so as to reflect changes in conditions and identify new andemerging resource values.
Sec. 12. Renewable Resources. In carrying out this Act, the Secretary of Agriculture shall utilizeinformation and data available from other Federal, State, and private organizations and shallavoid duplication and overlap of resource assessment and program efforts of other FederalAgencies.

The direction is clear that the USDA Forest Service is to inventory some resources and to avoidduplication of effort, but based on the information contained in the laws, we would be hard-pressed todesign an inventory to ensure that it would meet the needs that Congress had in mind.
How then do we determine inventory objectives from these and other such platonic verses andwhat additional things do we need to consider in designing inventories? These topics are the subjectsof this paper.
The Book of Genesis
And on the eighth day, the LORD God told man to go forth and inventory the trees and herbsof the land, the beasts of the field, the fish of the seas, and the fowl of the air so that their numbersbe knownst (Genesis 2:8(a)).
Given no funding, access, and personnel, Adam and Eve were faced with a very formidable task.They tried to take God's command literally. They failed and were cast out of the Garden of Eden.
Over the next few millenniums man, plants, and animals continued to multiply. In spite ofincreased person-power, God still did not have a suitable inventory, so he sent a great flood to reducethe number of life-forms to "two of every living thing". When the floods receded God knew what hehad.
But life prospered and was fruitful and multiplied. And it came to pass that once again God wasfaced with an inventory problem. Even such acts as turning people into pillars of salt did not bringabout an adequate survey of the earth's resources.
Frustrated, God delegated his inventory needs to the Pharaohs. Soon, Joseph was hired as anadvisor to the rulers. Capitalizing on a clause in Joseph's contract under "other duties as assigned", thePharaohs soon got on his case to get an inventory done. Joseph realized that he needed moreinformation from the powers that be in order to do a suitable job. So he asked the Pharaohs:
1. What decisions are going to be made on the basis of the inventory?
2. What information is really needed to make these decisions?
3. What is the area for which the estimates are to apply?
4. When are the results needed and in what form?
5. What are the constraints on funding and people power to get an inventory done?
Joseph also realized that man could not inventory the resources by complete enumeration inevery instance. In a dream, the theory of sampling came to him. And it came to pass, that toimplement the sampling theory, Joseph developed some additional questions to be asked of thePharaohs. These included:
1. What impact will information errors have on the decisions being made.
2. What impact will incorrect decisions have on the resources?
3. What impact will incorrect decisions have on the decision-maker?
4. And most importantly, what impact will incorrect decisions have on the inventory designer?

To properly design an inventory, the inventory designer must have an understanding of theimportance of the results, how they will be used, and act accordingly. In order to have thisunderstanding, the designer must communicate with the person requesting the information. Answers tothe questions given above and some knowledge about the requestor will help develop the inventoryobjectives. Atterbury (1987) goes into considerable detail about the types of questions to be asked forspecific uses.
The effort devoted to questioning will pay off in the long run but the amount of effort expendeddepends on the source of the request. If a request comes from Miss Sarah Jane in Ms Bixby's fourthgrade class in Tulsa, Oklahoma for a science project she was working on, we would provide theinformation requested as best we can. We would not necessarily launch a multi-million dollar project toanswer her question if the data were not available.
If, on the other hand, requests come from Congressional or White House aides, we work withthem to define their needs in terms of the kinds of data we have available. From this we can judge ifwe can provide the information or not. If we can't, then we may have to lay out some options forgathering the data; balancing the time when the information is needed against the person-power andfunding available.
The Book of Numbers
Take ye the sum of all the trees of the forest, by the nation in which they stand with thy namesand uses from two-tenths cubits at breast height and upwards (Numbers l:2(a)).
By the time Moses floated into the scene, the Pharoahs were speaking in terms that the inventorydesigner could understand. Moses realized that one could have different inventories to meet differentneeds or multiple objectives from the same inventory. For example, in the USDA Forest Service, wehave information needs for policy and program development, land use planning, and activity planning.Each of these needs could be served by one or several data collection efforts.
Even though one has clearly defined the objective statement, one must also be aware of theadditional or hidden needs.
As I prepared this paper, I queried our Forest Service Regions and Forest Inventory and Analysis(FIA) Staffs to find out what the field units saw as the objectives for their inventories. Nearly all unitsthat responded, quoted or referred to the platonic statements found in our laws and national direction.Yet, while these may be the primary reasons for the inventory, there are reasons, that could lead one toquestion why we use the designs that we do.
For example, the primary objective of the Forest Inventory and Analysis units is to provide datafor National Assessments and State Survey Reports. A secondary objective is to maintain a net-work ofpermanent plots for monitoring and research activities. This objective has more influence on theinventory design than does the primary objective.
A similar statement may be made of National Forest System (NFS) inventories. The primaryobjective is to provide data for Forest planning and National Assessments. A hidden objective is to usethe inventories for project planning. By recognizing all needs from the start, it will make the designand understanding of inventories much more simpler.
Lund (1986a) outlines some of the inventory needs we have in the federal government that areover and above those stated in the laws.

The Book of Exodus
And it came to pass, that the Pharaohs turned over their inventory duties to the data collectors.The COLLECTORS spake all these words saying,... (Exodus 20:l(a)).
In recent years, four inventory commandments appear to have evolved that merit somediscussion.
1. Thou shalt not use any work other than thine own (Exodus 20:3(e)).
For some reason, we (myself included) often ignore the work done by others. Every time a newinventory specialist is hired, out goes the old survey and in comes a new one. This is indeedunfortunate for several reasons. First the continuity is lost between inventories. Results are not easilycompared because of the differences in designs. Secondly, a great deal of valuable data and knowledgeis ignored creating a loss of a previous investment.
There is a vast amount of existing information available in the United States from a variety ofsources. Yet we often do not take the time to search for it or if we find it we do not use it because wedid not collect it or it was not to our standards.
As I work with National Forests and Forest Inventory and Analysis Units I have come to realizethat there are people out there at least as smart as I am, and that their information is of considerablevalue. Before designing a new inventory, make sure that the information does not exist or that it is notadequate. Guidance on evaluating existing information is provided in Lund (1986b).
There is not only a problem with using other people's data, but there is a problem of sharing datawe collect ourselves. Some of this may be attributed to problems with definitions and standards, butmost is due to three things:
a. Fear of loosing control. Knowledge is power, and power is difficult to share. If we share ourinformation or knowledge, we may no longer be looked upon as the "authority".
b. Fear of someone using the data against us. This is especially true where resourcemanagement decisions are frequently challenged in the courts.
c. Fear of someone scooping our research. We have not as yet published, therefore, if wereleased the data our competitors may beat us to the punch.
While these fears may be valid, at least for most federal employees, we are mandated to shareour information under the Freedom of Information Act when requested.
2. Thou shalt not use subjective sampling (Exodus 20:14(f)).
Not all functions use random sampling in their inventories. In our national direction in theForest Service, we now require or inventories to be "scientifically valid" instead of "statistically valid".Nearly everything we do naturally, from the selection of mates to selection of food, shelter andclothing, jobs, etc. is based on deliberate sampling. Why then when we want to inventory ourresources, do we use random sampling?
The basic arguments are that random sampling eliminates personal biases and creates objectivityso that the reliability of the inventory can be established. The disadvantages are the cost and time increating the sampling frame and in building in the random factor.

Arguments for deliberate sampling (which includes purposive sampling, subjective sampling andI suppose the emerging techniques of model-based sampling and importance sampling) are that it issometimes, if not most often, cheaper and logical in the mind of the user.
Subjective sampling may not as biased as we are lead to believe. Assume for example, wewanted to select a person who represented the average weight of people in this room. All of you wouldagree, that I would should not be selected (in a random draw, I could be chosen). Others in the roommay be eliminated from the sample. Arguments would occur closer to the actual mean rather than atthe extremes. Consequently the margin that a subjective sample would vary would be relativelynarrow. The costs of creating randomness and measuring things that clearly are not representative areavoided and the cruiser can get on with the job sooner.
In the past, I have only recommended subjective sampling when: the person that collects the datawill be the only one that will ever use them; or, when it is used as a means to get an estimate of thevariation for determining sampling intensity for a bona fide statistical sample. I still believe that thesetwo uses are valid. But there are other circumstances where subjective sampling is used and the resultsmay be logically more valid than a statistical sample.
Assume we have a ten-thousand acre forest that has had two inventories. One inventory wasbased on a randomly located grid of 20 plots. In the other inventory, the entire forest was divided andmapped into 200 stands ranging in size from 10 to 100 acres each. Within each stand, two plots wereestablished at locations that the cruiser determined to be representative of the stand itself. In bothinventories the same plot design was used, the same data were collected, and the same statistics weregenerated. Naturally the results differed.
If you had to invest money based on the results of the inventory, which inventory would youaccept as being the most authoritative? I would side with the more intense subjective sample. Thereason for this is simple — there is a much higher intensity of samples distributed across the populationof interest. Certainly the stand-based inventory could be improved from a statistical view point byrandomly selecting plots within each stand and the statistical survey could be strengthened by addingmore plots, but inventories should not be summarily rejected simply because subjective sampling wasinvolved.
The use of deliberate sampling depends again on the objectives of the inventory and the intendedaudience. The more clearly objectives of the survey and the audience are defined, the more clearly onecan design the inventory.
3. Thou shalt not move thy plot location (Exodus 20:12(r».
Biometricians, statisticians, and inventory designers should go the field at least once a year tokeep reminded of what conditions are truly like. It is one thing to write procedures in the office andanother to implement the instructions in the field.
One of the procedures that is particularly bothersome is the location of the sample plot whenstatistical sampling is used. The procedure writers make it emphatic that plots must be established atthe location at which they were chosen. To locate the plot elsewhere, would bias the sample.
Once again I generally agree with this procedure, but there are at least two situations that Ibelieve plots can be moved. The first is when the plot falls in a very uniform stand such as a plantationor lodgepole pine thicket. I have seen a great deal of time and money invested in surveying in the plotto be sure that it is exactly located at the place it should be. I have also seen a plot established by acontractor rejected because it was twenty feet off. Some type of logic must prevail in this type ofsituation.

The second case is when the plot occurs in an area that would endanger the cruiser. I have seeninventory crews risk life and limb to establish plots in some areas of the west. Again some kind oflogic must prevail in this situation. No plot is worth serious injury or death.
A somewhat related problem is that of moving sub-plots when they straddle or cross a givencondition such as an obvious stand boundary. Many of our Forest Service crews will move sub-plots ofa ten-plot cluster, for example, if the subplots will fall out side the condition being sampled. In thiscase, I once again support the commandment providing there is no risk to life or limb. Edges of standsare part of the population, and not to sample them, ignores a portion of the natural world.
4. Thou shall not exceed thy allowable sampling error (Exodus 20:16(b)).
Allowable sampling errors are frequently established by the inventory specialist or statistician todetermine sampling intensity. Beyond this, the allowable and the resulting sampling errors appear tobe seldom used.
I have been in the Washington Office of the USDA Forest Service for over long seven years.During that time, I have provided inventory statistics to the White House, Congress, news media, theChief, and the general public. Never once during that time have I ever been asked about the reliabilityof the data provided. At the same time, I have obtained data from both Regions, FIA units, and otherfederal agencies and never once was I told what the associated sampling errors were (nor did I ask).
This is not to say that sampling errors are not important. It just points out that the only peoplewho use them appear to be the inventory designers.
The Book of Revelation
And I saw an angel come down from heaven, having the key of the bottomless pit and a greatchain in his hand (Revelation 20:1).
In the past few moments we have talked about platonic verses and inventory objectives. Theestablishment of inventory objectives is often relegated from God or the Chief Executive Officer to thePharaohs or Staff Directors to the Data Collectors or Inventory Specialists. During this process, intentsare lost and personal biases creep in.
Designs become customized to the unique perceptions of the individual that has the designresponsibility. Those that establish the objectives, often have little or no experience in evaluating whatis desirable or practical. In the end, the objectives may not be meaningful for the problems at hand.
In fairness to the writers of the scriptures, laws and direction are often purposefully kept generalso that an organization has a wide latitude to maneuver. Without such latitude, there would be no needfor people like me. In addition, if the laws were too explicit, and we didn't exactly follow thelegislation, we would end up in court on a more frequent basis than we do now.
When you get a request for data or a request to launch an inventory program, use the questionslisted above to clarify what it is that you are to do. Watch for hidden objectives. Look at designs andresults of previous inventories for the same area to see if they are of any value. Lastly, examineexisting data to see if they would suffice.
Remember that deliberate sampling does have a place in our inventories. Model-based andimportance sampling will be discussed in depth during this meeting.

Don't be too harsh on crews that don't establish plots in exactly the right location. Examine thesituation first before making them redo. Field crew leaders — take your statistician to the field with youfor a day or so, so that the biometrician can appreciate the real world situation.
As for sampling errors, there is an inconsistent axiom of which you need to be aware. The moreurgent the need for data, the less concern there is about sampling errors; yet the more likely decisionsbased on the provided data will have a major impact on an organization's program.
There is another truth you should know. Allowable sampling errors are usually established by aninventory specialist usually high in the organization. If the inventory cannot meet the allowable error,consider "casting out" the specialist or changing the standards.
Finally — Blessed are they that ask questions, consider the future, evaluate existing data, andplan accordingly: for they may have an inventory that provideth the sought-after answers and shalldwell at the right hand of the decision-makers forever. (Revelation 22:14(g)).
Let Me Give Thanks
I thank the following fellow apostles for their kind reviews and helpful suggestions for preparingthese final scriptures: Jim Bones and Rich Birdsey, Forest Inventory and Analysis Branch; MiloLarson, Timber Sales; Karl Bergsvik, Timber Program and Management Planning Staff; and DennisMurphy, Silviculture Staff. All are employed by the USDA Forest Service.
The Dead Sea Scrolls
Atterbury, Toby. 1987: Tutorial and notes for Effective inventory: asking the right questions.1987 May 13-15; Corvallis, OR. Regional Workshop, Society of American Foresters. Beaverton, OR:Atterbury Consultants, Inc. Misc. Pagination.
Lund, H. Gyde. 1986a. A primer on integrating resource inventories. Gen. Tech. Rept. WO-49.Washington, DC: U.S. Department of Agriculture, Forest Service. 64 p.
Lund, H. Gyde. 1986b. Existing information and the sorcerer's apprentice. In: Oderwald,Richard G.; Burkhart, Harold E.; Burk, Thomas E.; eds. Use of auxiliary information in naturalresource inventories. Proceedings: 1985 October 1-2; Blacksburg, VA. SAP 86-01. Blacksburg, VA:Virginia Polytechnic Institute and State University; School of Forestry and Wildlife Resources: 1-8.
USDA Forest Service. 1983. The principal laws relating to Forest Service activities. USDAAgriculture Handbook No. 453. Washington, DC: U.S. Department of Agriculture, Forest Service.591 p.

Forest Inventory Purposes and Goals
Toby Atterbury - PresidentAtterbury Consultants, Inc.
3800 S.W. Cedar Hills Boulevard, Suite 225Beaverton, Oregon 97005
ABSTRACT
Purpose and goals must be clearly defined to insure that a forest inventory will fully satisfy theneeds of an organization. A written purpose defines the intent. Goals specify the tuning, costs, uses,users, accuracy and other targets of the inventory. Each user must have input into the purposes andgoals. Written purposes and goals are the most important part of forest inventory for they setstandards for us to achieve.
INTRODUCTION
Forest inventory is one of the fundamental activities in the profession of forestry. Organizationscan make forest inventory a part of the daily activities, with the information provided being used forappraisal, strategic planning, and operational planning. This creates happy, satisfied users. This can beachieved by using a process to insure success.
The most important and first step in the process of forest inventory is writing and agreeing on thepurposes and goals. Written purposes and goals makes us into professionals and leaders by settingspecific objectives to achieve.
DEFINITIONS
To help visualize these concepts Webster's New World Dictionary, Second College Editiondefines the key words in this paper as:
Professional:1. of, engaged in, or worthy of the high standards of a profession.
Leadership:1. the position of guidance of a leader.2. the ability to lead.3. the leaders of a group.
Purpose:1. something one intends to get or do; intention, aim.2. resolution; determination.3. the object for which something exists or is done; end in view.
Goal:1. the line or place at which a race, trip, etc. is ended.2. an object or end that one strives to attain; aim.
PROCESS
Successful forest inventories are accomplished by using a process which may be outlined as:
1. Define the purposes and goals.2. Define the users and uses.3. Define the products.4. Choose the systems and methods.5. Document the systems and methods.6. Choose and train the people.7. Collect the Data.8. Process the data into useful information.9. Analyze the information.10. Report the information to the decision makers.
By far the most important step in this process is defining and writing the purposes and goals.
PURPOSE
The purpose of an inventory should be to produce results that can be used by the organization,specifically the users involved.
An example a forest inventory purpose statement may be: To provide (organization, client, owner,etc.) with forest inventory information in a way that timely accurate information is available for(appraisal, strategic planning, operational planning, etc.) so that better decisions can be made toenhance the organizations (profits, net present value, position).
Notice the purpose is only one sentence. It should be short and to the point.
The purpose statement must be agreed upon by all of the major users in the organization.
Purpose statements begin to create a vision of success for the individuals in an organization. Infact, this shared vision is the major ingredient for success.
GOALS
The goals must determine specific targets. They define specific dates, names, budgets, etc. Goalsare measurable.
Example goals may be:
1. To have accurate inventory information ( + or -) of various items, such as volume,acres, etc.
2. To have the users believe the information is accurate and useful.3. To finish the data collection and processing by December 31,19xx, and have the
information ready for the users.4. To accomplish the inventory within the budget, $xxx,xxx.5. To train the users to understand the information and use the computer programs.6. To train the data collectors to a high degree of professionalism so that accurate
information is collected.7. To have the data and information available for use on miro-computers at the users
desk.

8. To have the ability to add annual growth each year.9. To maintain the maps and data for all changes due to management and natural
causes.
Goals need to be specific, but should not contain procedures. Procedures should be done by theprofessional inventory forester. They should be changed as better equipment, knowledge, andinformation is available. Procedures should not become purpose, goals, or policy.
Procedures can become policy. Written purposes and goals should overcome this tendency andallow the inventory foresters to use various methods, techniques and procedures as needed. Themethods, systems, procedures and people should be chosen that will accomplish the purposes andgoals.
SUMMARY
Written purposes and goals make us professionals and leaders. They set standards for us toachieve. They give us drive, a reason to get up in the morning and work until late at night. They give usa way to measure our performance. They give us targets to aim at and hit. They give us reasons tocome to these conferences, quest for more knowledge, improve our skills and inventory methods.
Written purposes and goals give us the ability to convince others we can accomplish somethingworthwhile. Accomplishment of the purposes and goals should bring us the most important reward,satisfaction of a job well done.
REFERENCES
Webster's New World Dictionary, Second College Edition, 1986.
10

OBJECTIVES OF A NATIONAL FOREST INVENTORY
FRENCH NFI MEETING USERS NEEDS
R.B. ChevrouStatistician
National Forest Inventory Service34970 LATTES - FRANCE
ABSTRACT
In the last years, French NFI service has made NFI data more accessible to all users through a hugedatabase, queries and computer programs, easy to use from any place in the country.
This experience has shown what data, results and tools the NFI service should give to meet usersneeds. In short, they are:
Data, results and tools for estimating future probable crop, with general and detailed models forstands evolution;
Wood qualities including stem form functions and computing tools ;
Various inexpensive volume tables from stem form functions ;
Height curves ; bark thickness ; with corresponding tools ;
Forest maps on computer files for location of data and results.
New theories are necessary for regression as most models and functions do not fit the usualassumptions for validity.
BACKGROUND
French NFI data are collected and results are published since the 60s. They are very interesting anduseful to know the actual state of the forests, stand types areas, volumes and growths, per regions, .species, age classes, and so on.
Little by little, a question has arisen : How to use these data and results for policy making atgovernmental level as well as at industrial one ? Many have tried to estimate forest resources, but theyhad neither an easy access to NFI data, nor efficient methods and tools for computational work, notablybecause, in France, almost half of the total crop comes from thinnings.
11

In the last years, we have built a system to meet users needs and two special tools have beendeveloped which are of great importance: A database, including special computer programs in additionto usual queries, to make easy an access to NFI data from any place in the country through publicnetwork Transpac, and even in the world through existing networks ; and forest map files for locatingNFI results.
So, it has been made possible to answer users questions, but not all of them yet, and NFI objectivescan be changed to better meet users needs which are better known from the questions asked to the NFIdatabase.
MEETING USERS NEEDS
The NFI database is located in a big computer Center (CNUSC in south of France) on an IBM 3090-400 mainframe, using DB2, PL1 and SAS. Its size is about 600 megabytes. For details, see GUERO M.C.and HOULLIER F. (1989).
From the actual state of the forests, easily obtained from usual queries, users try to meet their owngoals.
Forest policy makers and industrials need estimates for forest resources in the next 20 years to come.It is of a great interest to get them in relation with stand types, species, qualities, accessibility, andlocation of the forests from a map.
Forest managers need rough data, volume tables, models for height and other variables, and standtypes maps.
Forest Resources
Several different computer programs, included in the NFI database, give forest resources. In all cases,users have to interfere in the computational work by entering their own hypothesis for future managementrules (thinning ratios, exploitable age or some other values related to it). These hypothesis are entered asanswers to program questions.
Let notice that NFI data include data for past sylvicultural practices that help users choices.
From the NFI database, these computer programs give results with a classification for forest regions,stand types, species, diameter classes, qualities and accessibility.
Two computer programs are in use at the moment.
On a broad point of view: The user has to define an homogenous domain from NFI data; It may bedifficult to get simultaneously the homogeneity of the domain and a convenient ground plot number toget accurate estimates. Then the user gives 4 values ; The first of which, a mean diameter, is for classingstands or trees in two groups, the first group containing stands or trees with small diameters to be thinned,and the second for stands or trees with large diameters to be clear cut or regenerated; The second value is
12

a thinning ratio related to the above first group of stands or trees; This thinning ratio includes naturalmortality and it is expressed as a percentage of the annual yield ; For stands or trees to be clear cut, theuser gives the maximum value of the annual cut and the minimum length of the period on whichregeneration will last.
This method is called "Calcul des disponibilit6s forestieres brutes" (DFB) that is "computation ofcrude forest resources". It is based on forest management methods used in France and it gives interestingresults easily, but not the future state of the forests.
On an age class basis : the user has to define an homogenous domain for regular stands where ageshave been measured ; then he gives, for each age class, the area to be clear cut and the thinning ratio forthe rest of the age class area.
This method leads to entering many hypothesis (2 for each age class). With volume growth/ha in anage class seen as a constant through time, it leads to the state of the domain (areas and volumes in everyage classes) at the end of a period of time equal to the age class width, so that computation can be donefor another period of time.
Several other methods are in development and they already work on desk computer : A methoddealing with diameter classes, either globally in irregular stands, or per age classes in regular stands inrelation with thinning type ratio ; a method which modelizes NF1 ground plot evolution, from which it iscomputed appropriate annual crop and the final state of the stands.
In relation with wood qualities, we have had to build special tools to estimate appropriate volumetables from NFI data as described below.
Overlaping an appropriate map file to the NFI map file permits to locate ground plots in watershedsor other territorial divisions, and then, from NFI database, to locate NFI results as well as resourcesestimates.
It has not often been done yet because most users do not see the power of such a tool to locateresources accurately and because the existing maps do not cover the whole country.
When the forest map is in a database (CIS), we can expect an easier access to this tool; more-over, itwill show which forests and stands types are of greater interest, so that the survey work may be increasedfor them and reduced outside.
Forest Management Purposes
When NFI started in France, good volume tables did not exist for all species all over the country. Ithas been decided to estimate volume on standing trees, measuring several diameters along the stem frombottom to top as shown in IFN (1985).
Bouchon, Delord and Rousseau (1986) have shown that measuring 4 diameters at convenient heightsgives a very good tree volume estimate, with a relative bias less than 1 % and a relative residual error lessthan 3%.
13
Delord (1984) showed that these 4 diameters give a good taper function modelizing tree stem formand leading to diameter estimate at any height with a good accuracy.
So, it is possible to estimate the volume of any part of the stem for given length and top diameter atany height
Almost 2 000 000 trees have been so measured in the past on almost 200 000 ground plots and, since1985, NFI uses its own volume tables from these trees. NFI results and forest resources can be computedwith many different reference volumes using appropriate volume tables build from these trees.
A volume table computer program has been included in the NFI database, which can be modified onrequest to add new possibilities.
A similar program have been added to the NFI database for dbh bark thickness, which was measuredon all trees and to day estimated using an appropriate function.
Forest managers and industrials can compute their own volume tables from these NFI trees whenuseful for a few dollars.
Each tree of the NFI ground plots is measured for radial growth in the last five years, and, when it ispossible, height growth for the same period.
From these data, Chevrou (1986) has developed models for height and basal area, based on growth dxexpressed as a function of the variable x (height, basal area) and of age a, with the following differentialformula:
dx = f(x,a,ci)
where cj are parameters to be fitted to real data dx, x and a.
The computer programs work on desk computer and will be included later on in the NFI database.
Forest Map Files
In 1985, French NFI has changed its methods to get better area estimates by mapping stand types. Itwas seen that map files would be of very great interest for many purposes. They would make possible touse standard satellite data to make the forest map up to date every year or when necessary. It would beeasy to add information from other files (with slopes, boundaries of watersheds or other territorialdivisions, forest roads and trails). It would be possible to get from these map files, usual paper mapscontaining useful information and only useful one, that makes the map clearer and easier to read. It wouldmake possible to modelize forest fires and to improve warning. Many other uses are not yet known.
/
Our main prospect is related to getting NFI results and forest resources for any territorial divisionrelated with governmental and industrial problems, or to road access. Using the forest map files givesground plots numbers located inside the concerned area. From the NFI database, these plots lead toexpected results. It will be necessary to build new routine estimates using outside plots as well as insideones as it is done in mine prospecting. Using plots remeasured on several occasions, for instance SPRplots, should lead to very efficient estimates.
14
We plan to add other information to the forest map with density, height, or crown size values so thatit will be possible to get volume estimates for each mapped polygon or each group of neighboring similarpolygons, at least for the most important stand types. Our main purpose is to locate the stands to bethinned where crops will give mainly pulpwood, and to locate stands to be clear cut where crops will givemainly sawwood.
We plan also to put these map files in a huge database to make easier an access to these data and tolink them to the existing ground plots NFI database.
Some Problems To Be Solved
Some problems have arisen in relation with the above methods used by NFI.
French NFI uses ground plots made by 3 concentric circles of radius 6 m for smaller trees, 9 m formiddle size trees, and 15 m for bigger trees, as shown in IFN (1985). Such a plot is quite similar to pointsampling plot with circle radius related to tree dbh. Lappi and Bailey (1987) have shown that such a plotlead to biased estimate for tree mean value on the plot and good estimates have to be found. Up to now,we work with mean values for dominant trees which often are located only on one out of the 3 circles, sothat bias should be smaller.
Nevertheless, this NFI ground plot has some useful properties: It permits to measure appropriateproportions of small, middle size and big trees, excepted for very large trees ; boundary plots bring smallbias as it is easy to use the mirror method or to enter the plot inside the proper stratum along a windingboundary.
Other problems are related to regression methods for fitting models and volume tables. Up to nowthese methods assume the model validity and we all known that we are working with invalid models. Itwould be of great interest to develop practical methods for invalid models and methods taking intoaccount the correlation between volumes of trees located on same plots.
Working with forest map files leads to new concepts and new problems. We need easy routineformula to do what mine prospectors do in their own domain.
Conclusion
The NFI database, with its included computer programs, and the forest map files, permit users towork efficiently with NFI data. When these data and tools do not meet their requirements, new tools arebuilt or new data are collected.
Such an interactive process between NFI and its users seems to be an efficient way to define the bestobjectives. Nevertheless, some special research work has to be done to find out future needs not yetclearly expressed, because some delay is needed before getting the useful ground data.
Though a very important work is done, specially in USA, on improving survey methods and ongetting more accurate estimates, we feel that more efforts should be done to build routine methods andtools necessary to use efficiently survey data and results. Not only it might well be a good way to define
15

better objectives, but also it could change our point of view about the data to be collected. It might wellcome out that objectives as well as data could be quite different according to the country and the priorknowledge that we may have in each case. Here, forest map would be essential, while there stem formwould be of greater interest. In France, it seems that all aspects are of interest and it leads to a quiteexpensive national survey.
REFERENCES
Bouchon, J., Delord, J.M., et Rousseau, P., 1986, Comparaison de deux m6thodes de cubage, RFFXXXVffl.l.p 47-54.
Chevrou, R.B., 1986, Moddlisation de revolution des peuplements & partir des donnSes de 1'IFN.Igeme Congr6s mondial IUFRO. LJUBLJANA, Yougoslavie.
Delord, J.M., 1984, Le profil des tiges, RFF XXXVI, 6, p 505-514.
Gu6ro, M.C., and Houllier, F., 1989, La base de donnees de 1'IFN, Nature et utilisation de sesdonnees dynamiques, IUFRO workshop, S4-02-03/04, Forest Growth Data, Capture, Retrieval andDissemination, GEMBLOUX, Belgique, April, 3-5,1989.
I.F.N., 1985, But et m£thodes de 1'Inventaire Forestier National, Ministere de 1'Agriculture, 65 p.
Lappi, J., and Bailey, R.L., 1987, Estimation of the Diameter Increment Function or Other TreeRelations Using Angle-Count Samples, Forest Science, vol 33, No3, p 725-739.
16
FOREST INFORMATION NEEDS OF CONCERNED GROUPS IN THESTATE OF MAINE
Don D. TarbetForest Biometrician,James W. Sewall Co
Old Town, Maine 04468and
John H. CashwellDirector,
Maine Forest ServiceAugusta, Maine 04333
ABSTRACT
The State of Maine is the most heavily forested state in the US and is more dependent economicallyupon its forests than any other state. A wide variety of information is needed to make meaningfulmanagerial decisions about this vital resource. Traditional inventories of standing timber and of growthdo not completely fill the need, but must be considered as part of an overall structure of needed forestinformation. As culmination of an ongoing evaluation by the Maine Forest Service of forestinformation available in the State, representatives of the forest industry, landowners, governmentofficials, and other interested groups were interviewed in 1988 to determine their needs for informationon the forests of Maine. Differences in information needs appeared across user groups, but the generalconsensus was that information on growth and harvest were the most important components of a forestinformation system. Of these two, harvest or drain was regarded as the most difficult to study. Fromthis study, conclusions were drawn concerning the types of information most needed in themanagement of the State's forests.
INTRODUCTION
Forest comprises about seventeen of Maine's eighteen and one half million acres of land. Rangingfrom predominantly spruce-fir in the north to a central hardwoods intrusion in the extreme south (SAP,1955), this extensive forest cover is the dominant characteristic of the state.
The forest provides Maine and the nation with traditional values; jobs, recreation, air and waterquality enhancement, and general spiritual benefits relating to quality of life. In economic terms,extractive uses of the forest add about four billion dollars to the gross state product. Recreation addsnearly another billion. (Maine Department of Conservation, 1988). This represents nearly 15% of thestate's entire income, making the forest the largest single producer of revenue in the state.
The forest industry of the state is strongly oriented toward spruce and fir and has been affected bythe recent attack of the spruce budworm. Also affecting the state's wood supply is a heavy demand forwood from the using industries, both in the state and in Canada.
The demand is so heavy that the US Forest Service survey of 1970 (Ferguson and Kingsley, 1972),projected that drain would exceed growth by the 1980s. Data from the USFS resurvey in 1980 (Powelland Dickson, 1984) suggests that the earlier prediction may be coming true, at least for some species.
At the very least, the margin where error can be tolerated in estimating supply and demand hasalmost reached zero. Gone are the days when growth and drain estimates could be very broad. Timbercompanies, lawmakers, woods workers, environmentalists, and everyone else concerned with the
17

forests of Maine are aware of the problem. There is growing feeling that steps must be taken toprotect this resource, but no hard evidence exists as to how serious the problem is now. No one knowswhether the annual drain is less than the annual growth, or whether we have crossed the line betweenrenewable resource utilization and mining.
Information on the state of the Maine forest comes from a variety of sources and is used in avariety of ways. Industry maintains some of its own data. The Maine Forest Service provides a seriesof reports on consumption, export, import, etc. The USFS resurveys provide estimates of standingtimber and growth. These are supplemented by additional surveys.
The basic year-to-year drain figures are dependent upon reports from the wood-using industry andare reported by the Maine Forest Service. These figures are reported to the Maine forest service asmandated by law. However, no mechanism for enforcing the law exists, and those most familiar withthe industry believe that the total cut is dramatically underestimated by these figures. The major reasonfor the underestimate is the under-reporting of exports. Various sources of information indicate thatMaine's export figures are quite far below reality. Using the best information available, the authorshave calculated that the total volume of wood cut from the forests of Maine may be underestimated byas much as 15-20%. In 1985 as much as a quarter of a billion board feet of timber may have left thestate without appearing anywhere on drain figures.
The situation is clearly potentially destructive. The State of Maine needs a forest informationsystem adequate to the job of not only defining the growth and drain on the forest but of modeling itinto the future. The importance of adequate forest information systems has been considered by others(Baskerville and Moore, 1988). For Maine and for any other region for which the situation jasbecome critical, two basic elements represent the ultimate expression of the state's information needs;growth and drain.
The inventory data of the US Forest Service are of questionable utility on any but the broadestscale also. As reported by Edson, Young, and Tryon (1985), errors are too high to make much use ofthe data in actual forest management and the time between resurveys is too long for potential users tohave any confidence that the data represent actual conditions.
The question comes down to this: Can the forests of Maine continue to support the demands thatwill be put upon them, both for products and for quality of life enhancement? The responses arevaried. The Ferguson and Kingsley (1972) projections sound a note of warning although the authorsremain optimistic. Seymour et al (1985) listed potential timber shortfalls as did the Sewall Report(1983). Baiter and Veltkamp(1987) also added warnings. Recently, however, Seymour and Lemin(1989) have struck a somewhat more optimistic note based upon modeling efforts.
It must be remembered, however, that all projections, are based upon data known to be flawed. Anold computer expression is 'GIGO, Garbage In, Garbage Out'. The more sophisticated modelingschemes are most vulnerable to the inescapable fact represented by this old saw. The authors'experience indicates that a substantial part of the concerned community in Maine concurs with theabove assessment of the available data and feels a need for information in which they can placeconfidence.
Drain, however, is dynamic. It changes with the economy, with perceptions of supply, with theweather, with the international market, etc. Figures collected every twelve years in a broad brushapproach may not be adequate for dealing with the problem. This type of figure is the one most oftenconsidered sensitive by wood using industries, at least in the past.
Responding to the widely expressed dissatisfaction with current data on the forests, the MaineForest Service contracted with the James W. Sewall Company in 1988 to analyze forest informationneeds in the State of Maine. As part of this effort, users and potential users of forest information were
18

contacted to determine where the primary gaps and weaknesses in currently available information wereperceived to be as a first step in developing a new forest information management scheme. This paperreports the portion of those results that relate most closely to measurement of growth and drain.
METHODS
In order to assess the quality of information now provided by the Maine Forest Service and toidentify information needs of those concerned with the forests of Maine, potential information userswere divided into the following groups: Forest Industry, Non-industrial landowners, Federalgovernment, State and local government, service organizations (industrial support groups, consultants),and other interests (educators, private citizens, Maine Audubon, etc).
An attempt was made to obtain a representative list of individuals or organizations in thesecategories, but the impossibilities of defining actual sizes of groups or of randomizing the sample makeit dangerous to generalize opinions beyond the limits of the sample. In all cases, the better known andmore active representatives of the group were sought for interviews.
Seventy-one phone interviews were conducted with those representatives of the above groupsconsidered key by the Maine Forest Service and by James W. Sewall personnel. In the interview,respondents were presented with a series of open-ended questions designed to elicit evaluations of theforest information now available and to obtain suggestions as to what the major information needswere.
Answers were then grouped in order to examine patterns of response. Most individuals gave morethan one response.
RESULTS AND DISCUSSION
Table 1 lists the five most common answers given by the sample of respondents. It should benoted that numbers will not add up except across because each respondent was allowed multipleresponses. No attempt was made to order the responses of any individual as to importance.
Most notably, four of the five most important perceived needs concerned, at least peripherally, thetwo basic elements described above as being major components of a forest information system, growthand drain. All 16 of those wishing for better information on imports and exports gave as their primaryreason a need to know the magnitude of the drain. It is striking to note that over half of the industryrepresentatives^ 0/19) focussed on this particular item.
The same is true in the case of the second most frequent response, that stronger legislation isneeded in order to assure complete reporting of all data. Those who expressed this view referred tothe need for obtaining drain figures. It should be noted that requests for this action were spread acrossall categories of information user.
More complete and more frequent inventory and better growth data were called for third (tied)most often. The inadequacies of the present inventory conducted by the US Forest Service have beendiscussed above. Here, again, most of the interest in inventory came from the forest industry. It isclear that industry is feeling concern about the state of the Maine forest and lacks confidence in theinformation currently available for making economic and managerial decisions regarding their ownoperations.
19
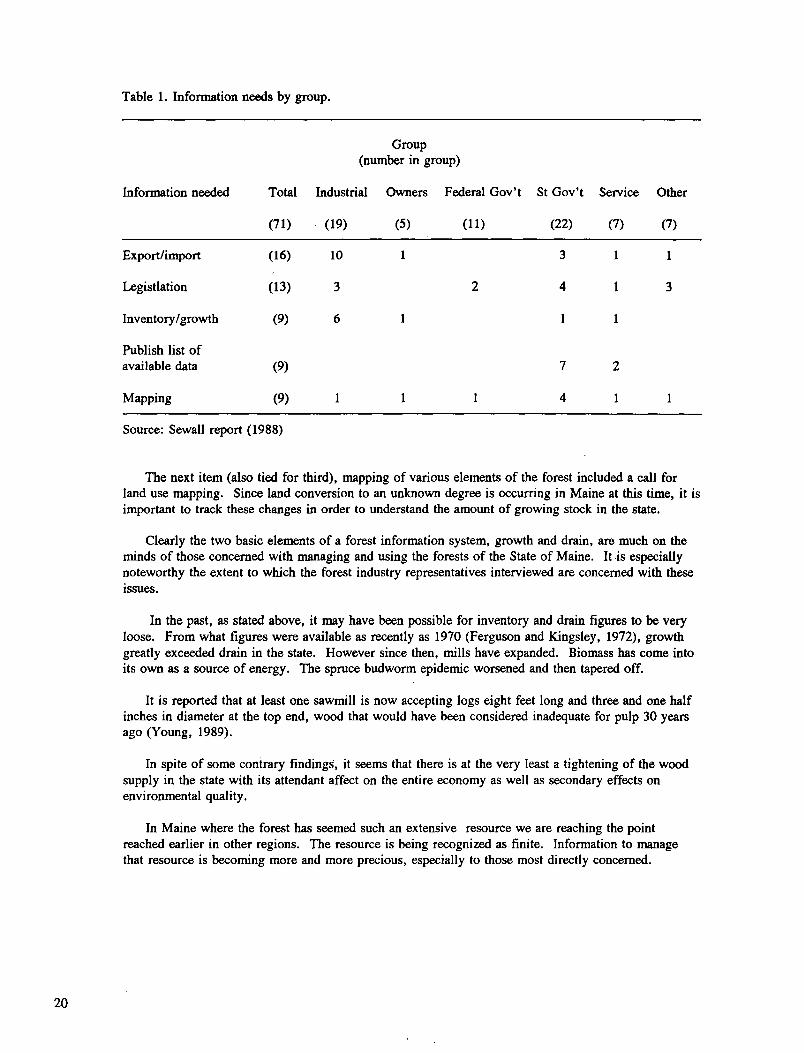
Table 1. Information needs by group.
Group(number in group)
Information needed Total Industrial Owners Federal Gov't St Gov't Service Other
(71) (19) (5) (11) (22) (7) (7)
Export/import
Legislation
Inventory /growth
(16)
(13)
(9)
10 1
3 2
6 1
3
4
1
1 1
1 3
1
Publish list ofavailable data
Mapping
(9)
(9) 1 1 1
7
4
2
1 1
Source: Sewall report (1988)
The next item (also tied for third), mapping of various elements of the forest included a call forland use mapping. Since land conversion to an unknown degree is occurring in Maine at this time, it isimportant to track these changes in order to understand the amount of growing stock in the state.
Clearly the two basic elements of a forest information system, growth and drain, are much on theminds of those concerned with managing and using the forests of the State of Maine. It is especiallynoteworthy the extent to which the forest industry representatives interviewed are concerned with theseissues.
In the past, as stated above, it may have been possible for inventory and drain figures to be veryloose. From what figures were available as recently as 1970 (Ferguson and Kingsley, 1972), growthgreatly exceeded drain in the state. However since then, mills have expanded. Biomass has come intoits own as a source of energy. The spruce budworm epidemic worsened and then tapered off.
It is reported that at least one sawmill is now accepting logs eight feet long and three and one halfinches in diameter at the top end, wood that would have been considered inadequate for pulp 30 yearsago (Young, 1989).
In spite of some contrary findings, it seems that there is at the very least a tightening of the woodsupply in the state with its attendant affect on the entire economy as well as secondary effects onenvironmental quality.
In Maine where the forest has seemed such an extensive resource we are reaching the pointreached earlier in other regions. The resource is being recognized as finite. Information to managethat resource is becoming more and more precious, especially to those most directly concerned.
20

Of the two basic elements, inventory and growth may be the easiest on which to achieve adequateinformation. The techniques of inventory are sufficiently advanced to allow a great improvement incurrent practices. The only difficulty is that inventory on the level that may be needed in the state istremendously expensive. Establishing a large number of growth plots on top of other requirementsmay be prohibitively expensive.
For this reason it is becoming increasingly necessary to seek new inventory procedures, includingthose involving some form of remote sensing. Stripping ground inventories to the bone is anotherhelpful approach. There are indications that under certain circumstances, height measurements addlittle to the accuracy of an inventory (Young, 1989).
Drain, however, is a difficult subject to approach. The growth rate changes slowly based uponknown conditions. Inventory also changes slowly over time and can, if sufficient funds are available,be calculated. Drain is dynamic and changes due to fluctuations in the market place and to otherfactors that are difficult to identify, let along measure. While an interval of several years betweenmeasurements of inventory and growth may be acceptable, harvest levels are so subject to change thatthe intervals acceptable in the other case may not be acceptable here.
\ It is probably that remote sensing techniques will eventually handle questions of harvest, and it ishoped that efforts will be directed toward that end. Only with good data on drain can the equationbecome complete and a forest information system capable of meeting the increasingly critical needs offorest managers be achieved.
CONCLUSION
Most users of forest information in the State of Maine, especially those in the forest industry, feelthat growth and drain data are severely lacking in adequacy for the task of managing the forest lands ofMaine. Of the two, the drain figure is most glaringly weak. Efforts should be directed not only toimproving inventory techniques, but toward perfecting techniques for estimating harvest amounts.
21
REFERENCES
Baiter, K. and Veltkamp, J., 1987: Report on the demand for forest products in Maine. Preparedfor: Maine Dept. Conservation, Forests for the Future Program. 70 pages.
Baskerville, G. and Moore, T., 1988: Forest information systems that really work, The ForestryChronicle, April, 1988, p 136-140.
Edson, D. T., Young, H. E. and Tryon, T. C., 1985: A critique of statewide forest surveys,Unpublished manuscript, James W. Sewall Co. Old Town, ME, 9 pages.
Ferguson,. R. H. and Kingsley, N. P., 1972: The timber resources of Maine, USDA For. Serv.Resource Bull. NE-26, 129 pages.
Maine Department of Conservation, 1988: Forest for the future, Report of Forests for the Futureprogram, Maine Department of Conservation, Augusta, Me.
Powell.k D. S. and Dickson, D. R., 1984: Forest statistics for Maine - 1971 and 1982, USDAFor. Serv. Resource Bull. NE-81, 194 pages.
Sewall Co, J. W., 1983: Spruce-fir wood supply/demand analysis. Report prepared for: MaineDepartment of Conservation, 94 pages.
Seymour, R. S., Mott, D. G. , Kleinschmidt, S. M., Triandafillou, P. H., and Keane, R., 1985:Green WoHr inodel: a forecasting tool for planning timber harvesting and protection of spruce-firforests attacKed by the spruce budworm, USDA For. Serv. Gen. Tech. Rep. NE-91, 38 pages.
Seymour, R. S. and Lemin, R. C , Jr., 1989: Timber supply projections for Maine, 1980-2080,Maine Agricultural Experiment Station Misc. Rep. 337, Orono, Me, 39 pages.
Society of American Foresters, 1955: Natural forest vegetation zones of New England, Committeeon Silviculture, New England Section, Society of American Foresters, map.
Young, H. E., 1989, personal communication, James W. Sewall Co. Old Town, Me.
22

Using Forest Inventory Data in South Australia
J.W.LccchForestry Systems Officer
Woods & Forests Dcpt., PO Box 162, Mount Gambler, S.A. 5290, AUSTRALIA
ABSTRACT
Forest management practice in the state owned radiata pine plantation resource in South Australia isvery intensive. The cut from the forest is set at the level the forest can sustain and there is little scope forexpansion.
To meet the needs for sound planning, forest inventory has evolved considerably and has features notcommon elsewhere. The inventory procedure is described.
The inventory data arc used to prepare short term (3-5 years) cutting plans which arc the basis forscheduling harvesting operations. They arc also used in the preparation of long term (commonly 70 years)predictions of future forest outturn and in the evaluation of alternative silvicultural strategics.
FORESTRY IN SOUTH AUSTRALIA
South Australia has been described as the driest suite in the driest continent with only 1.2% of the landsurface receiving on average more than 600mm (24") of rainfall a year. The native forests were generallypoor and geographically restricted which led to the commencement of a plantation establishment programover 100 years ago.
Over 90% of the plantations arc radiata pine and over 80% of these arc in the south cast of the state.This resource provides an allowable cut of about 700,000 m3 (25 millon cu.ft. true volume) of timber peryear to various government and privately owned utilisation plants including sawmills, a ply mill, pulpmills, particle board and preservation plants.
There is little scope for expansion of the plantation resource because of limited suitable land andcompeting alternative land uses. Estimates of present and future volume availability must be precise andunbiased if the allowable cut levels arc to be set correctly.
PLANTATION SILVICULTURE
The historical development of radiata pine plantation silviculture in South Australia has beensummarised by Boardman (1988) and the development of management planning techniques by Lewis,Kcevcs and Leech (1976).
Plantations arc generally established with an initial stocking of 1600 /ha (650 /ac) using site specificwccdicidc and fertiliser regimes. Establishment is intensive with strenuous efforts being made to realize inpractice the genetic gains from tree breeding programs.
At age 9.5 years all stands arc assessed for site quality, a volume based index of site productivity, andthis provides the primary variable for growth prediction and for defining thinning priorities. This serves asthe first comprehensive inventory in a stand. We have found the use of volume based site quality superiorto height based site index, especially for subsequent use in growth prediction models.
Stands arc commercially thinned starting from ages 11-18 years depending on site quality and thinnedevery 6-8 years to residual stockings defined by Lewis (1963, Lewis, Kcevcs and Leech 1976). Stands aregenerally clear felled at between 45 and 50 years of age, the age being varied to balance wood flows by sizeassortments to the various utilisation plants.
23
, Fertiliser may be applied during the rotation to increase productivity, generally not less than one yearafter commercial thinning if nitrogen is included in the fertiliser mix. Fertiliser may also be applied inanticipation of nutrient deficiencies.
After a 3-4 year fallow period stands are rc-csiablishcd.
Management planning is carried out using a computer based Yield Regulation system (Leech andKeeves 1981, Leech 1985).
Many Permanent Sample Plots have been rcmcasurcd for volume at 3-7 year intervals, and thesemeasurements span over 50 years for a number of plots. They cover a wide range of thinning treatmentsand site qualities, and provide an unparalleled data base for model development.
INVENTORY
Inventory procedures have developed over many years but have changed little over the last 20 years.This has contributed greatly to the stability of the planning process.
Each plantation unit is divided into compartments of about 15-20 ha (37-50 ac) surrounded by an accesstrack. Site variation and variations in past thinning history generally necessitate that each plantation unit istreated as a number of separate logging units. These logging units average 50-75 ha (125-200 ac), with thesize decreasing with age. The logging unit can be considered uniform for the next commercial loggingoperation, be it thinning or clear felling. This unit obviously can vary over time as logging operations arecarried out, but it is relatively stable and is the base unit for planning.
Inventory is by rectangular 0.1 ha (0.25 ac) plots established in each compartment in a stratifiedrandom manner based primarily on species, age and site quality, but also on standing slocking.
Inventory is compartment based rather than logging unit based as the unit cannot be defined withcertainly until after the inventory has been carried out and volumes and stockings reviewed.
Plots are measured at least one year after each commercial thinning to reduce the error in the predictionof increment for stands immediately after thinning.
Plots arc established at a rate of at least one plot per 4 or 6.5 ha (10 or 15 ac), with the greaterintensity being used for areas where the next operation will be clear felling or later aged thinning, when it isimportant to predict the yield of large diameter sawlog more precisely.
Each plot is surveyed. Plot width depends on row width and plot length is adjusted to obtain an area of0.1 ha (0.25 ac). The plot is surveyed in lo compartment corners lo facilitate re-establishment. Each tree ismeasured for diameter at breast height (1.3 m or 4'3"). Upper stand height, mean height of the 75 tallesttrees per hectare (30 /ac), is measured on a small selection of plots where there is some doubt that theheight can be estimated satisfactorily from height age relationships for the mapped site quality. Theadvantages of measuring more plots for diameter at breast height alone outweighs the advantages thatmeasurement of upper stand height gives, particularly in regard lo predicting yields by size assortments.
The invenlory records trees lhat arc expected lo be removed in ihe next commercial ihinning operation(thinnings elect). This is somcwhai unusual in plantation invenlory, but the extra effort has been found tobe well worthwhile because variations in ihinning lype can be quite considerable bclwecn different areas.Thinnings clccl irccs in-the plois arc "marked" lo ihc residual slocking level appropriate for the age and sitequality at expected lime of ihinning, not at age of inventory (Lewis 1963, Lewis, Keeves and Leech 1976).
All data arc keyed in ihc field directly on to hand-held Husky Hunter micro-computers (Leech, Suttonand Archer 1988) and ihc daia down-loaded id a Vax 11/750 for processing. The use of the Husky Huntershas been readily accepted by the technical personnel as they arc as fast or faster than manual recording,enable bcticr manual and computer validation in the field, and hasten the updating of the master file.
24
. There arc some 7000 plots in the current inventory master file. These daia are calculated and stored bythe Inventory subsystem of the Yield Regulation system.
MODELS AND DATA
One of the strengths of the approach adopted has been the use of two different data sets in plantationmanagement.
The Permanent Sample Plot scries provides a pool of accurately measured data covering a wide range ofthinning regimes (age of first thinning, thinning intensity, thinning type, and thinning interval), and of sitequality, that can be used for model development. This may be augmented by other research plot data. Thedata base includes data that cover the complete rotation from before the age of site quality assessment untilpast the current nominal age of clear felling. Another important feature is that volumes have beenestimated from sample tree volume measurements, cither a 3 m (10') sectional method, or by a verysatisfactory four-way tree volume table (Lewis, Mclnlyrc and Leech 1973).
The inventory provides an estimate of the volume standing on each logging unit at present, and alsothe volume of the thinnings elect. Inventory plots arc not rcmcasurcd to provide estimates of increment.Inventory plot data cannot be used to predict increment because they cover only one of many alternativesilvicultural strategics. Increment is estimated using models based on the rcmcasurcd Permanent SamplePlots which cover a wide range of silvicullural alternatives.
YIELD REGULATION SYSTEM
The planning system or Yield Regulation system (Lewis, Kecvcs and Leech 1976, Leech and Keeves1981, Leech 1985) has five main subsystems:
• Inventory: maintains a file of current measurements that provides estimates of standing growingstock and of the trees to be harvested in the next commercial thinning, including volume estimatesby size assortments and estimates of short term increment
• Area: maintains a file of current areas, according to their current usage and their present or futurepotential for wood production.
• Logging Category: enables logging units to be defined as groups of compartments or sub-compartments that arc sufficiently uniform to be, treated as homogeneous units in the future, andaccumulates inventory data for these logging units.
• Culling Plan: the Short Term Yield Regulation subsystem predicts volumes by log sizeassortments available from the next proposed operation and prepares culling plans for the next 5years. This is a tactical plan with only one silvicultural altcrnalive generally being considered.
• RADGAYMII: the Long Term Yield Regulation subsystem (or RADiata Growth And YieldModel) prcdicls the volumes by log size assortments available from commercial operations in thefuture. The planning horizon is generally 70 years, covering at least a complete rotation and thetransition into the next, but it can be extended to longer lime frames for the evaluation ofallcrnalivc silvicullural or economic slralcgics. Many silvicullural allcrnativcs can be evaluated byihis siralcgic planning model.
The system is fully implcmcnicd and opcralional. The-first ihrcc subsystems which store andmanipulate the data bases arc quite siablc.
25

SHORT TERM TACTICAL PLANNING
Culling plans dircci where logging is lo lake place for ihe next 5 years. They are generally reviewedand updalcd every 3 years, lo facilitate coniracl logging, but ihe longer projection period allows betterconlinuily of harvest scheduling.
Inventory plot data arc used wherever possible. However for the first commercial thinning, estimatesare generally based on sile qualily, sianding slocking, expccied stocking after ihinning, exlraction rowfrequency and age. This has been found to be satisfactory as the operation produces small wood used forpulp wood and preservation material.
The system allows for increment between lime of inventory and time of Ihinning to be modelled,especially for ihe ihinnings elccl. This incrcmcni can be quite considerable and the volume to be removedhas been found to double in a five year period between inventory and subsequent thinning for high sitequality stands.
Volume estimates are produced by size assortments including volumes to 7, 15, 20,25, 30, 35,40,45and 50 cm lop diamclcr undcrbark limils (ie 3" and 2" log diameter classes from 6" to 20").
Volumes arc csiimalcd in cubic mclrcs, true volume, underbark. Only one silvicullural regime isgenerally considered in ihis planning phase.
Most stands have been thinned for many years to ihe Optimum Thinning Range (Lewis 1963, Lewis,Keeves and Leech 1976) and ihe age class dislribulion is broadly uniform, so it is generally possible toschedule second and lalcr thinning operations at the time they are silviculturally due. Clear fellings are usedto balance the wood flows by size assortments in order to meel plan objeclives. First thinnings aremanipulated as far as possible lo meet the requirement for small diameter pulp wood and preservalionmaterial. Limited areas of prc- and non-commercial thinning have been carried out to prevent a seriousbacklag of first ihinning from building up, and Ihercby improving slabilily lo wind and increasing Iree size.
The system is stable and has only undergone minor modificaiion over the last 10 years.
LONG TERM PLANNING
The Long Term Planning Model or RADGAYMII (Leech 1985) is continually being modified lo teslvarious silvicullural oplions for ihe future.
The system produces similar oulpuls lo Ihe Culling Plan subsystem, but results are commonlysummarised as five year averages and presented graphically. Given me same inpul me Iwo subsystems areconsislcnl.
The planning horizon usually evaluated is 70 years, covering ihe currenl rolalion for all foresl eilherplanted or planned lo be planted, and also ihe transition inio the ncxi rotation. This was especiallynecessary lo incorporate ihc replanting backlag after the devastating forest fires of 1983 (Keeves andDouglas 1983). For some analyses the horizon can be extended much furlhcr.
The subsystem simulates ihe growih of each individual logging unil over ihe planning period, andaccumulates ihc rcsulls. Fulurc operations arc scheduled according to predetermined rules bul ihese can beoverridden for a particular logging unit.
The subsystem produces a summary of the volumes by log size assortment that are expected and alsoproduces cash flows using a table of current cosls and royalties and calculates net present value at a varietyof real interest rates.
There are two quite different uses for the subsystem. Firstly, present and proposed practices can beevaluated. A combination of stand and forest based analyses in the past indicated the desirable silviculluralslraicgy and ihis has been accepted as ihc base model or proposed praclice model. This implies a largel
26

forest, and the transition from the current state to a near steady state some time in the future. The objectiveis to supply wood to various utilisation plants, as required by log size assortments and quality categories;and that implies profitability, near maximum productivity and non-declining wood flows.
There is limited opportunity to markedly change the silvicultural practices used because the allowablecut is set at the maximum level that the forest can sustain and is completely committed to the existingindustry. There is little likelihood of expanding the area of plantations. Any marked change in silviculturewould have to be implemented carefully over a considerable period of time. There is no legislativerequirement for non-declining wood flows, just the implicit recognition that the Government owned forestsmust be managed to enhance industrial stability and for the benefit of the people of South Australia.
Growing stock will vary considerably during the long planning period as volume production by sizeassortments is balanced to provide smooth levels of wood flows. The variation from the average can be upto 10% for total standing volume, 20% for sawlog, and up to 30% for large diameter sawlog.
The second use of the system is to investigate alternative silvicultural or management strategies, inorder to increase productivity. Leech (1988) presented some 40 alternatives to the proposed practice model.These are a subset of over 200 alternatives evaluated and demonstrate the effect of changing thinningregimes (age of first thinning, thinning interval, thinning type, and thinning intensity) and of changing theobjective rotation length, as well as other alternatives. This forest based analysis implicitly takes intoaccount the transition from current practice to the alternative practice. These alternatives are analysed interms of net present worth and in terms of wood flows by size assortments.
Over the years the proposed practice model has changed only gradually and minimally, and the approachadopted gives forest based control in the planning process. It also allows decisions about options such aschanging rotation length, or fertiliser policy, to be based on analyses of the forest and not simply of singlestands.
It is interesting to note that some alternatives considered desirable when based on stand analyses werefound to be unsatisfactory when the forest based analyses were considered. One example was that standbased analyses show that the optimum time to apply fertiliser is after the second thinning but forest basedanalyses indicated that it was best to apply fertiliser after every thinning for certain age classes and notapply fertiliser to other age classes at all.
,It has been decided not to expand the system to include a mathematical optimisation phase. Instead themodel is run with a wide range of silvicullural and management options and the response surface examinedto determine the desirability of changing these options. This allows a number of objectives to beconsidered. In our view this gives much better control of the planning process.
It also enables alternatives that may have unquantifiablc features to be arbitrarily considered in thedecision making process.
The system is fully operational but changing the alternatives to be evaluated may require changes to theprogram. It would appear desirable to have a fully interactive system that could cope with all possiblealternatives, but this has been considered to be too expensive at this stage.
Great care has been taken in implementing this subsystem, with the objective being to produce asimple, modular and flexible system.
SUMMARY
The Woods and Forests Department in South Australia has developed a soundly based system thatenables it to effectively regulate and control the intensive plantation enterprise now being managed as amature resource.
The system meets the three most important criteria; it is complete, it is operational, and its reliabilityis accepted.
27
REFERENCES
Boardman, R. 1988: Living on the edge - the development of silviculture in South Australian pineplantations. Aust. For. vol.51, no.3, pp!35-156.
Keeves, A. and Douglas, D.R. 1983: Forest Fires in South Australia on 16 February 1983 andConsequent Future Forest Management Aims. Aust. For. vol.46, no.3, pp!48-162.
Leech, J.W. 1985: A management planning model of a large plantation forest. Mathematics andComputers in Simulation vol.27, pp!99-206.
Leech, J.W. 1988: Analyses using the South Australian Long Term Planning Model. Proc. Workshop"Modelling Trees, Stands and Forests", Melbourne Victoria, August 1985, Bulletin 5 University ofMelbourne, pp445-459.
Leech, J.W. and Kecvcs, A. 1981: Strategic and tactical planning in South Australia. Proc.I.U.F.R.O. Project Group P4:02.1, "Economics and Techniques of Thinning Plantations in Australia andNew Zealand." Canberra A.C.T., 4pp.
Leech, J.W., Sutton, M.W. and Archer, G.R. 1988: Implementing field data entry programs on HuskyHunter micro-computers. Proc. Research Working Group No. 2: Mensuration and Management, GympieQld., September 1988, 9pp.
Lewis, N.B. 1963: Optimum Thinning Range of Pinus radiata in South Australia. Aust. For. vol.27,no.2, ppl 13-120.
Lewis, N.B., Kceves, A. and Leech, J.W. 1976: Yield regulation in South Australian Pinus radiataplantations. Woods and Forests Bull. 23, 174pp.
Lewis, N.B., Mclntyre, G.A. and Leech, J.W. 1973: Regional volume table for Pinus radiata in SouthAustralia. Woods and Forests Department Bull. 20, 135pp. (Metric edition of Lewis, N.B. and Mclntyre,G.A. 1963: Woods and Forests Department Bull. 14).
28
Contracting for Inventory Plot Measurement:the Minnesota Experience
D. Heinzen and S. FlackeyResource Assessment Unit
Forestry Division, Minnesota Dept. of Natural Resources2002 Airport Road, Grand Rapids MN 55744
ABSTRACT
Between the 1977 and the current Forest Inventory and Analysis cycles in Minnesota, the Departmentof Natural Resources turned from use of state personnel to employment of outside forestry contractors forprecision measurement of field plots. Results have been highly favorable in terms of worker productivity,survey costs, and data reliability, but the change has required new initiatives and great flexibility on the partof the agency with regard to contractor development, training, plot acceptance sampling and contractadministration. The lessons learned have significant implications in an era of straitened agency budgets andincreased reliance on contracting.
INTRODUCTION
The Minnesota Department of Natural Resources established our Resource Assessment Unit (thencalled Forest Inventory) in 1974. From then until 1986, the unit used permanent and temporary stateemployees to perform the permanent plot measurement tasks entailed by the state's participation in theForest Inventory and Analysis (FIA) program coordinated by the North Central Forest Experiment Station.Since the mid-1980s, worsening budgetary constraints have dictated that our unit find ever more cost-effective means of getting fieldwork done.
An alternative that had been considered at the outset was contracting for plot measurements. The ideahad been greeted with considerable skepticism in various quarters. Contractors, it was felt, would notproduce the consistent, high-quality data that could be expected from state employees. Despite the prevalenceof this attitude, the budgetary situation persuaded us that contracting was an option to be explored.
Through contacts with other agencies we obtained bidder lists and sample contracts, and used these todevelop our own. We awarded our first contract in June 1986, and since that time have carried out most ofour fieldwork in this manner. However, we continued to conduct some fieldwork with permanent andtemporary employees, and thus we have a basis for making direct comparisons. In what follows, wedescribe the methods used and evaluate the alternatives in terms of cost and data quality.
METHODS
Permanent employees were based at five separate locations to avoid per diem costs. Crews consisted oftwo persons, at least one of them trained and experienced in inventory work. Four-wheel-drive trucks, all-terrain vehicles and snowmobiles were supplied. Wages were based on an hourly rate, with actual workschedules left to each crew's discretion.
Temporary employees were based at one location and received per diem allowances in travel status. One-person crews were used, but crewmembers could choose to work in pairs if the nature of the plots warrantedit. Crew supply and equipment was on the same scale as permanent employees'. Two of the temporarieshired were already experienced in inventory; the others attended a one-week training session.
29
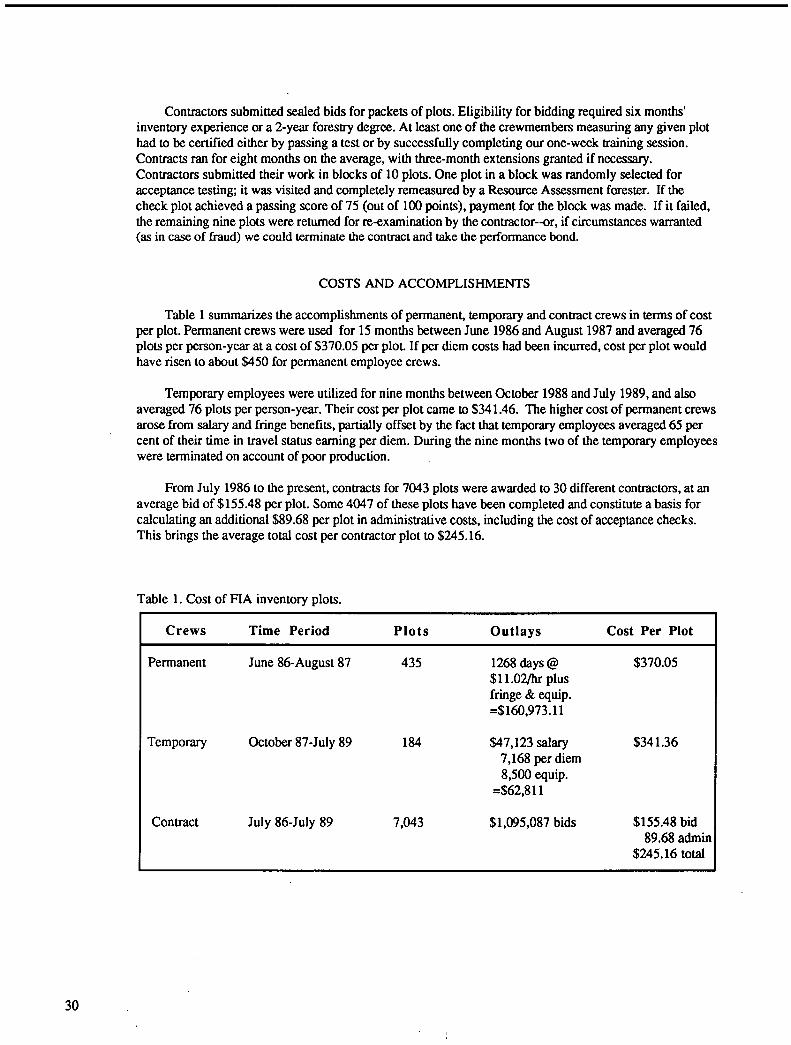
Contractors submitted sealed bids for packets of plots. Eligibility for bidding required six months'inventory experience or a 2-year forestry degree. At least one of the crewmembers measuring any given plothad to be certified either by passing a test or by successfully completing our one-week training session.Contracts ran for eight months on the average, with three-month extensions granted if necessary.Contractors submitted their work in blocks of 10 plots. One plot in a block was randomly selected foracceptance testing; it was visited and completely remeasured by a Resource Assessment forester. If thecheck plot achieved a passing score of 75 (out of 100 points), payment for the block was made. If it failed,the remaining nine plots were returned for re-examination by the contractor--or, if circumstances warranted(as in case of fraud) we could terminate the contract and take the performance bond.
COSTS AND ACCOMPLISHMENTS
Table 1 summarizes the accomplishments of permanent, temporary and contract crews in terms of costper plot. Permanent crews were used for 15 months between June 1986 and August 1987 and averaged 76plots per person-year at a cost of $370.05 per plot. If per diem costs had been incurred, cost per plot wouldhave risen to about $450 for permanent employee crews.
Temporary employees were utilized for nine months between October 1988 and July 1989, and alsoaveraged 76 plots per person-year. Their cost per plot came to $341.46. The higher cost of permanent crewsarose from salary and fringe benefits, partially offset by the fact that temporary employees averaged 65 percent of their time in travel status earning per diem. During the nine months two of the temporary employeeswere terminated on account of poor production.
From July 1986 to the present, contracts for 7043 plots were awarded to 30 different contractors, at anaverage bid of $155.48 per plot. Some 4047 of these plots have been completed and constitute a basis forcalculating an additional $89.68 per plot in administrative costs, including the cost of acceptance checks.This brings the average total cost per contractor plot to $245.16.
Table 1. Cost of FIA inventory plots.
Crews Time Period Plots Outlays Cost Per Plot
Permanent June 86-August 87
Temporary October 87-July 89
435
184
Contract July 86-July 89 7,043
1268 days @$11.02/hrplusfringe & equip.=$160,973.11
$47,123 salary7,168 per diem8,500 equip.
=$62,811
$1,095,087 bids
$370.05
$341.36
$155.48 bid89.68 admin
$245.16 total
30
DATA QUALITY
The assumptions on which the U.S. Forest Service bases the design of FIA inventory require that thecomplex set of navigational and mensurational tasks involved in taking each 10-point permanent plot becarried out with repeatable precision. Deviation from a high standard of accuracy can seriously compromisethe inventory, and the effects of poor execution can persist for decades. Regardless of who performsinventory fieldwork, some form of inspection is clearly necessary. A significant advantage of the contractingapproach is that quality-checking is built into the payment mechanism. We are forced by the contractingsystem to carry out inspections in timely fashion; moreover, our checks must be thorough, quantitative and(if need be) defensible in a court of law. Where state employees crews are used and no one's income isimmediately at stake, other priorities can easily interfere with quality control. So we found it in our ownefforts to compare results. We had intended to inspect permanent, temporary and contract crews on anidentical basis; but "other things came up" and we ended by inspecting only 2.8 per cent of the permanentcrew plots and 3.3 per cent of the temporary crew plots. But we inspected a full 10.4 per cent of thecontract plots--we had to, the contractors' pay depended on it
On our acceptance checklist the inventory crew starts with 100 points and loses points for substandardperformance in any area of plot location and measurement. In FIA design, some plots require more complexmeasurements than others, but regardless of complexity no more than 25 points may be lost Excluding allnon-passing scores, permanent employees averaged 86.9 points, temporary employees averaged 86.0 pointsand contractors averaged 85.3 points. However, including failed inspections in the tally changes the resultsubstantially: permanent employees then average 62.0 points, temporaries 75.7 points, and contractors 82.9points. Permanent crews failed 75 per cent of their inspections, temporaries 33.3 per cent, and contract crewsonly 5.7 per cent. This gross disparity probably arose from the fact that contract crews who failedinspections had their work returned for re-examination, while the same did not hold true for state employees.It is likely that the quality of state employee output would have improved if failed inspections had resultedin returned work, but it is also likely that costs per plot would have risen.
ADMINISTRATION
"Administration" is a vague term, and its content as applied to the costs of running an inventoryprogram is matter for argument. The per-plot cost figures given above include a significant administrativeelement for contract crews only. Table 2 shows the components of this calculated administrative cost. Thetotal outlay incurred to date is divided among the 4047 completed plots to arrive at the per-plot cost of$89.68. This figure is somewhat inflated, as some of the incurred costs pertain to the nearly 3000 plots notyet completed. More important than this is the fact that significant administrative outlays should in fairnessbe added to the cost of plots measured by state employee crews as well. Of course none of the costs peculiarto the contract-issuing process would apply; but approximately $30 of the total administrative cost per plotarises from acceptance checking, and this (as our data show) is at least as important with state crews as withcontract crews. Keypunching and editing cost about $15 per plot regardless of who has gathered the data. Inaddition, state crews must receive inventory training, and also require additional overhead expenses in hiring,supervision, time reporting, performance reviews and the like, which together probably amount at aconservative estimate to $5 per plot. Thus approximately $50 in administration should be added to statecrew costs to place them on a basis of equality with contract costs. This leaves us with a permanentemployee cost of $420.05 per plot, a temporary employee cost of $391.36 per plot, and a contract crew costof $245.16.
31

Table 2. Administrative items and costs.
Tasks Outlays
Write/revise contractsObtain/maintain bidder listMail bid invitationsRespond to inquiries on prospectusCopy contractsMail contractsBid openingsRebidsContact bidders for acceptanceProcess contractsTrainingComplimentary inspectionAcceptance inspectionsProcess paymentsContractor correspondence, inquiriesReprocess seized & forfeited contracts
TOTAL, Labor & Supplies: $236,024
Fiscal year lost opportunity costKeypunchingError checking & editing
TOTAL, Labor & Supplies: $126,906$362,930
$362,930 / 4047 completed plots = $89.68 admin, costs per plot
RESULTS AND DISCUSSION
Our data thus seem to show without much ambiguity that contract inventory crews gather inventorydata at least as well as state crews at lower cost per plot. While this is our chief conclusion, some qualifyingobservations should be made. Managing an inventory program on a contract basis opens an agency to someunaccustomed frustrations and delays in addition to the opportunities. Not all contractors are successful.Some 17 per cent of our contractors were terminated by us for various reasons, and an additional 13 per centforfeited their contracts. These represented about 16 per cent of all contracts issued, and more such problemsmay occur before the present inventory cycle is complete. If this sort of thing is unexpected and unplannedfor, the attrition can cause serious delays in data availability. Its impact can be minimized by the exercise offorethought and by close contact with contractors. Inventory unit staff must be available to contractors inoff hours; they must learn to be flexible yet consistent in their dealings with contractors. The contract itselfmust be written to emphasize quality and timeliness, without imposing unnecessarily restrictive conditions(such as numbers of personnel per crew) on how the contractor accomplishes the job. Before rushing intocontracting, an agency must reorient its thinking towards questions of vendor development, contractingcycles, and the absolute need for competent acceptance checking on a timely basis. Failure to address thesematters will lead to serious trouble.
We cannot conclude without wondering out loud why our generally successful experience withcontracting inventory measurements ran counter to all the expectations--or rather, why the expectations wereso pessimistic in the first place. Did the generally low prestige of inventory work have something to dowith the skepticism, or was it just garden-variety institutional conservatism?
32


