presented at the Weimar Optimization and Stochastic Days 2007 Source: www.dynardo.de/en/library Lectures State-of-the-Art - robustness evaluation in CAE-based virtual prototyping processes of automotive applications Johannes Will
Transcript
presented at the Weimar Optimization and Stochastic Days 2007
Source: www.dynardo.de/en/library
Lectures
State-of-the-Art - robustness
evaluation in CAE-based virtual
prototyping processes of
automotive applications
Johannes Will
State of the Art - robustness evaluation in CAE-based virtual prototyping processes of automotive applications
Johannes Will
Dynardo GmbH, Weimar
1. Introduction
The automotive industry is one of the drivers of CAE-based virtual product development. Due to a highly competitive market, the development cycles of increasingly complex structures have to be constantly reduced while the demand regarding performance, cost and safety is constantly increasing. The development of innovative, high quality products within a short time which are able to succeed in the international car producer competition is only possible by using virtual prototyping. One of the greatest challenges is the increase of numerical simulation of large test and analysis programs including CAE-based optimization and CAE-based stochastic analysis while reducing the number of hardware tests. It is important to note that increased application of virtual prototyping itself increases the necessity to perform robustness evaluation. If the number of hardware tests has to be reduced, it is essential to implement the scatter, which is always present in those tests (such as loads, material, geometry), into the computational model. The increasing application of structural optimization also requires the robustness analysis of “optimized” designs. In many cases, the optimization of cost, performance and weight may lead to highly sensitive designs which can lead to substantial robustness defects especially in nonlinear systems. It is no surprise that the increase of virtual prototyping in conjunction with the reduction of hardware tests and development times combined with a very high innovation speed of new materials or electronic components do have some risks. This can be seen in the statistics of product recall which have increased significantly in the last time [5]. Therefore, the topic of robustness evaluation assuring serviceability, safety and reliability should be taken into account in virtual prototyping as early as possible. Here, robustness characterizes the sensitivity of the system response in respect of unavoidable scatter in the environmental conditions. Consequently, probabilistic methods using CAE-based stochastic analysis have to be utilized in order to quantify robustness, safety and serviceability. Dependent on the robustness evaluation criteria, variance-based robustness evaluation (usually called robustness evaluation) or probability based robustness evaluation (usually called reliability analysis) have to be utilized [3]. In variance-based robustness evaluation procedures, usually a sample set of possible realizations of input variables is generated by stochastic methods. The scatter of the input variables is described by probability distribution functions and correlation structures of scattering inputs. The scatter in the
Weimarer Optimierungs- und Stochastiktage 4.0 – 29./30. November 2007 1
system responses and their significance are investigated by statistical methods with respect to their properties regarding correlation and variation. In probability-based robustness evaluations usually small event probabilities are determined using gradient (FORM) or sampling based (ISPUD, adaptive sampling, and others) stochastic analysis methodology [7]. From our experience the success key at integration of robustness evaluation in the virtual product development cycles is the balance between the properly introduction of physical scatter, between reliability of stochastic analysis methodology and the reliability of the statistical post processing. If we miss the balance of one of the three, the results of the stochastic analysis most likely are useless. For example if we miss the most important input scatter the variation prognosis is useless, if we use the wrong sampling (like 100 Monte Carlo Sample) the reliability of correlation measurements is very low or if we test linear correlation only we may miss the most important correlation between input and output scatter. That is very much in contrast to the introduction of CAE-based optimization. Here, “black box” algorithms can be used and the designer can limit his design space for optimization almost without the risk of producing useless results. In the optimization task, this would “only” result in pure or missing design improvement. That fact is one of the reasons that practical applications of CAE-based robustness evaluation are still rare compared to CAE-bases optimization.
2. Variance-based Robustness Evaluation
Based on a reference simulation with a deterministic set of input variables, which for example corresponds to the mean values of the uncertain variables, a robustness evaluation creates a set of possible realizations of the design regarding the naturally given input scatter. To generate the sample set, stochastic analysis methodology is used. Because in the discussed automotive application it is not necessary to account small event probabilities, robustness evaluations using Latin Hypercube sampling [13] are the methodology of choice. The primary goal of robustness evaluations is the determination of a variation range of significant response variables and their evaluation by using definitions of system robustness. The secondary goal of robustness evaluations is the identification of correlations between input and response scatter as well as a quantification of ”physical” and “numerical” scatter of result variables. The definition of the uncertainties forms the base the stochastic generation of the sampling set. Because robustness evaluation ask for the influence of input scatter the proper definition of them is essential. Furthermore as closer we look to response variation and correlation as more detailed knowledge we need in terms of input distribution information and in terms of correlation between scattering input variables. This simple principles may be obvious but often we are forced to start with rough assumptions about input scatter and
Weimarer Optimierungs- und Stochastiktage 4.0 – 29./30. November 2007 2
we strongly recommend to validate results from robustness evaluation against that principles frequently. In practical applications, the existing knowledge of scatter is translated into a suitable distribution function. Thereby, the bandwidth reaches from detailed data from quality control of material properties to raw estimates of scatter and uncertainties. The software used for the robustness evaluation should be able to consider the available knowledge regarding the input information completely. This requires that suitable distribution functions (normal distribution, truncated normal distribution, log normal distribution, Weibull distribution or uniform distribution) can be used. Beside distribution information of single stochastic variables significant correlation between variables or significant spatial correlated stochastic behavior called stochastic fields has to be taken into account.
Figure 1: Normal versus Lognormal distribution, the figure visualizes that both
distributions may have the same mean and standard variation but very differ probability in the tails
Figure 2: Example of correlations, left: correlation of scattering material parameter right:
random field of initial stresses after forming process
Weimarer Optimierungs- und Stochastiktage 4.0 – 29./30. November 2007 3
Of course the significance of scattering variables or the significance of correlations between variables is often not known before, therefore we like to define 10 scattering variables or correlations more instead of one important missing. We strongly recommend to use as much as available measurement data of uncertainties and to spend sufficient effort for proper translation of all available information into distribution and correlation assumptions. Furthermore ensuring conservative estimations of variation we recommend moderate increase of observed input scatter if the knowledge base of variation is low. At this point, it shall be explicitly stated that the reliability of statistical measures of the result variables depends on the quality of the input information on scattering input variables. Therefore, if only rough assumptions can be made about the input scatter, then the statistical measures should only be evaluated as a trend. The estimation of statistical measures from a sample of possible realizations is naturally afflicted with an error. To keep this error as small as possible, Latin Hypercube Sampling methods are to be preferably used when creating samples. Research, regarding the estimation of linear correlation coefficients [13], shows that for the same expected statistical error optimized Latin Hypercube Samplings are more than ten times more efficient than Monte Carlo samplings.
Figure 3: Histogram for Robustness evaluation, the red part of the histogram violates the
Robustness constraint with violation probability of 34% Statistical measures from the histogram form the base for the estimation of response variability. Other important measures of variation are coefficient of variation, standard deviation, min/max values. In practical applications, the robustness of result values is often determined by examining if certain boundaries are exceeded. The boundary values thereby are often compared with the min/max values. If the scatter of output variables is not tolerable, it is searched for apparent correlations between the variation of individual input variables and the variation of individual output variables. Correlation coefficients, determined from linear and quadratic correlation hypothesis, describe a measure of correlation. The correlation coefficients in return form the base of measures of
Weimarer Optimierungs- und Stochastiktage 4.0 – 29./30. November 2007 4
determination. Measures of coefficients of determination (CoD) are percent wise estimates, which ratio of variation of an output variable to the variation of individual input variables can be explained by using the correlation hypothesis.
Figure 4: Coefficient of Determination of Femur Force, shows that 90 % can be explained
with identified linear correlations, the variation of vertical seat position (H_POINT_Z) result in 42% of total variation of femur force
When doing robustness evaluations of forming or crashworthiness simulations, the necessity may arise to visualize the statistic measures on the FE-structure. For correlation analysis on discretization level a high number of correlation coefficients need to be estimated. The required amount of computations for securing a certain confidence interval on correlation coefficients depends on the total amount of scattering input variables plus the total amount of estimated output variables. In other words, the probability rises that the maximum error of single correlation coefficients increases with an increasing amount of output variables. Than projection methods [10] are used to suppress the “noise” of the statistical errors in the estimations of correlation measurements and help to identify important correlations. Introducing robustness evaluation into regular virtual product development cycles needs an automatic and standardized post processing process. The enormous amount of statistical data has to be reduced to some significant result values which answer the primary questions. Of course the post processing procedure may differ for the different application areas. Here an example from passive safety illustrates the procedure. First the primary result of robustness evaluation the variation is summarized in one graph. The range of scatter is normalized to legal limit values and different colors show exceedance of internal or legal limits. From the base of this summary the engineer can look closer to single result values by evaluation of coefficient of determination and the correlation structure between this response and input scatter. That information forms the base to point out necessary modifications of the system or to point out necessary improvements of numerical modeling or result extraction.
Weimarer Optimierungs- und Stochastiktage 4.0 – 29./30. November 2007 5
3. NVH Applications
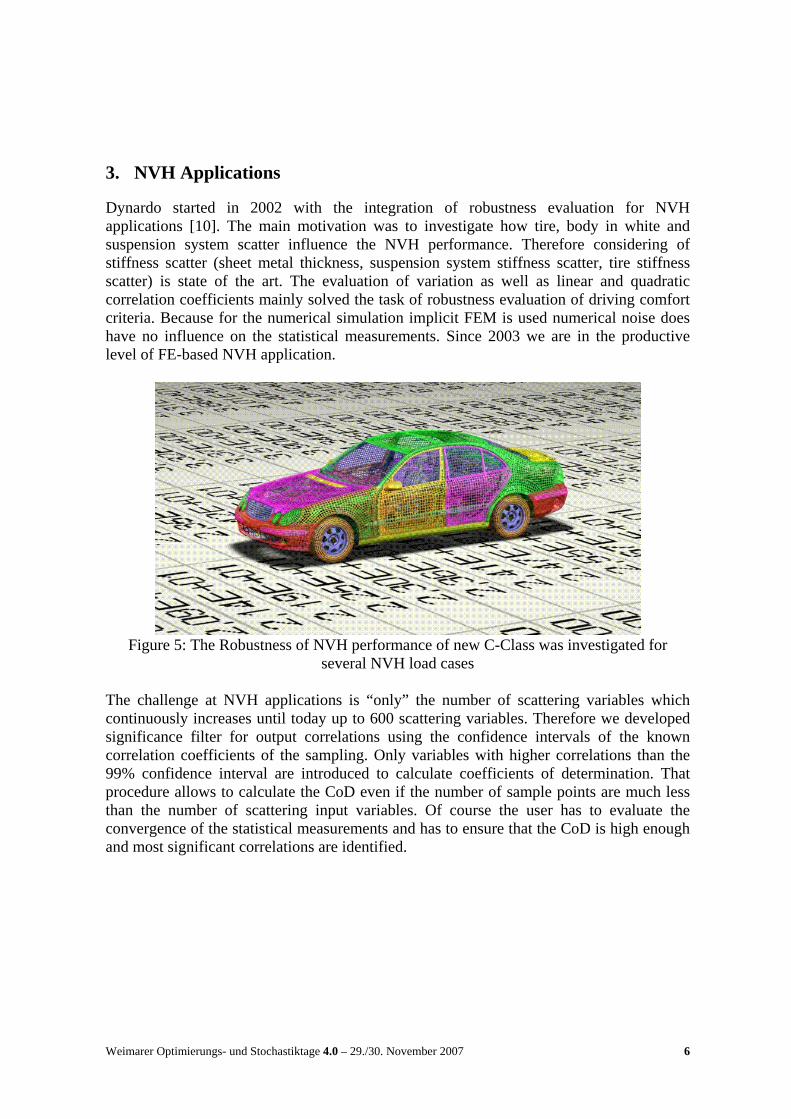
Dynardo started in 2002 with the integration of robustness evaluation for NVH applications [10]. The main motivation was to investigate how tire, body in white and suspension system scatter influence the NVH performance. Therefore considering of stiffness scatter (sheet metal thickness, suspension system stiffness scatter, tire stiffness scatter) is state of the art. The evaluation of variation as well as linear and quadratic correlation coefficients mainly solved the task of robustness evaluation of driving comfort criteria. Because for the numerical simulation implicit FEM is used numerical noise does have no influence on the statistical measurements. Since 2003 we are in the productive level of FE-based NVH application.
Figure 5: The Robustness of NVH performance of new C-Class was investigated for
several NVH load cases The challenge at NVH applications is “only” the number of scattering variables which continuously increases until today up to 600 scattering variables. Therefore we developed significance filter for output correlations using the confidence intervals of the known correlation coefficients of the sampling. Only variables with higher correlations than the 99% confidence interval are introduced to calculate coefficients of determination. That procedure allows to calculate the CoD even if the number of sample points are much less than the number of scattering input variables. Of course the user has to evaluate the convergence of the statistical measurements and has to ensure that the CoD is high enough and most significant correlations are identified.
Weimarer Optimierungs- und Stochastiktage 4.0 – 29./30. November 2007 6
Figure 6: Convergence plot of quadratic correlation coefficients, the convergence show
that after 100 simulations the main three quadratic correlations are identified Beside plots of variation and correlation of single peaks usually extracted from windows in the frequency or time domain important post processing capabilities are plots of the scatter bands in the frequency and time domain. From that plots the user can extract information at which frequencies engineering tasks at suspension or body in white will significantly influence the NVH performance.
Figure 7: Plot of scatter bands in the frequency domain, Blue: reference design; red: scatter
due to sheet metal uncertainties; green: scatter due to suspension system uncertainties
Weimarer Optimierungs- und Stochastiktage 4.0 – 29./30. November 2007 7
4. Crashworthiness and Passive Safety Applications
3.1 Numerical Robustness of Crashworthiness and Passive Safety Applications The inspection of numerical robustness of FE-modeling of crash-test computation results from the experience that the variation of numerical parameters of the approximation method or the variation of demonstrable insignificant physical parameters can lead to large scattering of the result variables or respectively lead to obviously unfeasible results. If n-designs are to be computed and their variation is to be evaluated statistically, the question arises which proportion of the resulting variation results from numerical noise. In the beginning of robustness evaluations at passive safety in 2004 we performed in parallel “physical” robustness evaluations of physically scattering parameters (scattering in reality) and “numerical” robustness evaluations regarding variation of numerical parameters. We stated a model as numerically robust, if the variation caused by the numerical robustness evaluation was small compared to the scatter caused by physical robustness evaluation. But of course, that statement was very much depended on the variation interval of numerical parameters and we could not repeat numerical robustness evaluations at every point in the physical robustness space. Therefore, a process was needed to estimate the quantity of the numerical noised within a physical robustness evaluation. At the end, we quantified the influence of numerical noise on the result variable by using the coefficients of determination [13]. Including linear and quadratic correlation between input and output variation as well as excluding cluster or other identifiable nonlinear correlations the measurement of determination should be high. If the measure of determination of the robustness evaluation is high, only a small proportion of unexplained variation, which could be caused by numerical noise, is left. In order to use the measure of determination of result variables as a quantitative measure for the numerical model robustness, the proportion of determination of the found correlations has to be estimated with sufficient statistical security. This formulates the standards for the sampling method, the number of computations and the statistical algorithms for the evaluation of measures of determination. After positive experience of evaluating the influence of numerical noise via measures of determination from robustness evaluation, this method is used for the serial production of BMW since 2006 [14]). From our experience, we selected the role of thumb that for “numerically” robust models, measures of determination, considering linear and quadratic correlations and after elimination of outliers and clustering of over 80%, should be determined. If the measures of determination in practical applications decreased significantly below 80%, it was usually indicated that the corresponding result variable shows a significant amount of numerical noise. A reason therefore may be insufficiencies in the result extraction or more frequently insufficiencies of the modeling interacting with the approximation methods. After repairing the modeling, the measure of determination usually increased up to over 80%. It shall be stated that in theory it is impossible to determine without a doubt the proportion of numerical noise. This diagnosis of course excludes systematical errors or the inability to
Weimarer Optimierungs- und Stochastiktage 4.0 – 29./30. November 2007 8
actually map significant physical effects in the numerical models. The fundamental prognosis ability of the numerical models has to be verified by using experimental data. Beside numerical noise an important motivation of aiming at high coefficients of determination for robust designs is that the correlations between input variation and output variation should be identifiable. These correlations finally show the possibilities of influencing the result scatter. In order to improve robustness, it is possible for example to move the mean value of important scattering input variables in the linear correlation case or for quadratic correlations to reduce input scatter or alternatively to change the transmission behavior between input and output scatter. The subject of bifurcation points is surely to be discussed separately. For the purpose of robust designs, one would want to vastly avoid systems with bifurcation points which can be traversed in multiple ways within the scatter range of input variables and then lead to significantly different system responses. As a matter of principle, one would have to be able to find correlations between indicators of bifurcation or results heavily influenced by bifurcation and the input scatter. Otherwise the bifurcation occurs randomly which implies that we are dealing with a very sensitive dynamic system.
3.2 Passive Safety Applications In 2004, we started with the integration of robustness evaluation into passive safety applications [11]. The main motivation was to investigate and improve the robustness of the restraint systems of fulfilling consumer ratings and legal regulations at the crash tests. Therefore considering of material, load parameters as well as test condition scatter and evaluation of variation of the main performance criteria is state of the art.
Figure 8: For passive safety applications multi body as well finite element models are used
in robustness evaluations
Weimarer Optimierungs- und Stochastiktage 4.0 – 29./30. November 2007 9
Figure 9: Visualization of improvement of robustness of passive safety performance, upper
diagram shows the scatter at milestone 1, lower diagram shows the scatter at mile stone three of the virtual product development process
In passive safety applications using hybrid MKS/FE-models, the quantification of numerical noise became an important part of robustness evaluation. With other word by checking the quantity of numerical noise we check the model quality. By developing a
Weimarer Optimierungs- und Stochastiktage 4.0 – 29./30. November 2007 10
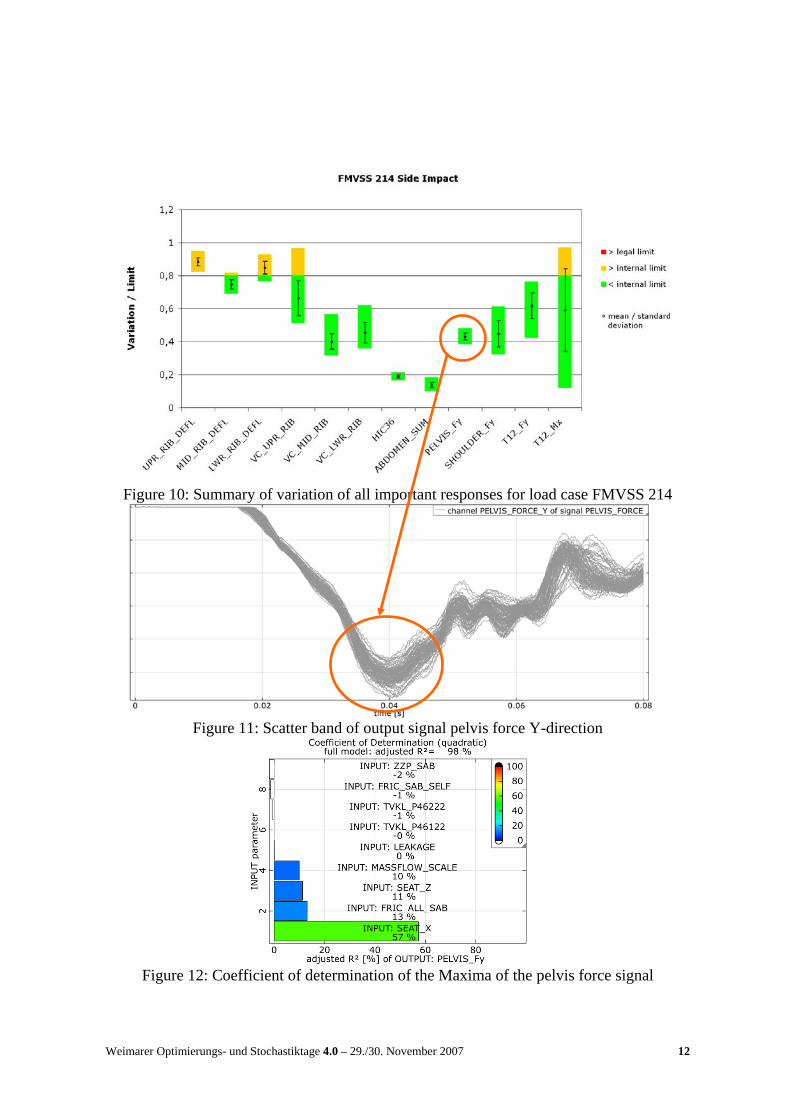
quantitative estimation of numerical noise via coefficients of determination [13], robustness evaluation of passive safety applications became accepted for regular procedures in virtual prototyping [14]. Since the beginning of 2006, computational robustness evaluations using optiSLang [6] are a defined milestone of the serial production at the BMW AG, executed for all relevant load cases for dimensioning of passive safety systems [14]. In 2005, we started robustness evaluations of FE-based crash analysis for passive safety applications. Here, the estimation of the amount of possible numerical scatter became a key feature for the investigation of scatter sources. Today at productive level of FE-based passive safety application (side crash, head impact) we reduce the number of necessary solver runs as much as possible using significance filtering based on coefficient of determination. Consideration of the test setup (dummy positioning, crash puls), airbag (mass flow, venting, permeability), sensors (TTF), belt system, door/interior stiffness and scatter of friction is state of the art in robustness evaluation of passive safety. Beside consideration of the influence of dummy scatter and consideration of the influence of geometric scatter of the body in white will be topics of further improvements. Automation of post processing was a key feature for productive serial use. Starting from one variation overview the engineer can identify the critical response values regarding variation (fig 10). Using plots of scatter bands in the time domain the characteristic of the response scatter is evaluated (fig 11). Using the coefficients of determination of the extracted performance values possible influence of bifurcation, numerical noise or extraction problems is investigated and quantified (fig 12).
Weimarer Optimierungs- und Stochastiktage 4.0 – 29./30. November 2007 11
Figure 10: Summary of variation of all important responses for load case FMVSS 214
Figure 11: Scatter band of output signal pelvis force Y-direction
Figure 12: Coefficient of determination of the Maxima of the pelvis force signal
Weimarer Optimierungs- und Stochastiktage 4.0 – 29./30. November 2007 12
FMH_X ± 5 mm
FMH_Y ± 5 mm H_ANGLE
± 1 °
V_ANGLE ± 1 °
VELOCITY 97 …100.5 %
Figure 13: Uncertainties in head impactor position of test FMVSS 201 Until 2007, more than 100 robustness evaluations were performed at the BMW virtual prototyping for passive safety systems. In the third year of the serial use of stochastic analysis, the following added value could be obtained concerning the dimensioning and increase of the robustness of restraint systems: • Development of a better understanding of the transmission mechanisms of input scatter
on significant performance variables • Identification of the significant scattering input parameters and securing of knowledge
about their scattering • Identification of model weaknesses and reduction of numerical noise of significant
vehicle performance variables. Thereby, increasing the model robustness/stability and of the quality of prognosis of crash-test computations
• Recognizing robustness problems of the restraint systems and in cases of high exceeding, of limits with the consequence of re-design of components.
Weimarer Optimierungs- und Stochastiktage 4.0 – 29./30. November 2007 13
3.3 Crashworthiness Applications The robustness of a crash simulation in deterministic analysis is already a task which has to be investigated while evaluating the crash test results. To limit problems with scatter of performance values resulting from numerical approximations of the crash FE-solvers, often quality regulations of modelling, software versions and hardware platforms exist. From the viewpoint of stochastic analysis, this evaluation of “numerical noise” needs additional quantification in relation to the physical scatter which occurs in reality to the performance values. To illustrate that, an injury criteria is scattering in physical test about 50%, then 5% scatter coming from numerical approximation solution are usually tolerable. Because we assume that the numerical scatter overlays the physical scatter and results in a larger variation between minimum and maximum, the 5% can be handled with a larger safety distance from critical performance values. But of course, if physical scatter and numerical noise have the same quantity, the reliability of deterministic or stochastic simulation results is questionable. In 2005, we started robustness evaluations of FE-based crashworthiness applications. Here, the estimation of the amount of possible numerical scatter became a key feature for the evaluation of numerical robustness. Also, the projection and visualization of statistical measurements on FE-meshes became very important for the investigation of scatter sources. Because of the complexity of the FE-models, the high amount of non-linearity and the high CPU requirements it is still necessary to optimize all components of the robustness evaluation procedure. Consideration of the test setup (barrier position, velocity), stiffness scattering (sheet metal thickness) and plastic behavior (yield stress, failure) and scatter of friction is state of the art in robustness evaluation of crashworthiness. At some load cases it became necessary to integrate the scatter from forming simulation to reproduce test results. Therefore the identification and introduction of spatial correlated scatter of forming parts using random fields is an important research topic. Today, we are in the productive level of FE-based low speed application (insurance crash). High speed front crash loading still remains a challenge. [15]
5. Forming Applications
The robustness of the forming processes is becoming more and more focused on recently. In fact, robustness is an additional demand on optimized forming processes. Typical scattering input variables of forming simulations are for example material parameters like yield strength, tensile strength, R-values, friction values, sheet-thickness or position of blank and tool. As a result, the scatter of important forming results and their correlation to the input scatter can be investigated. The robustness evaluation generates the information how large a safety distance from critical forming results needs to be to generate a robust product. Of course, a robust product can be achieved by deterministic optimization with applying safety factors, but in practice applying “safe” safety factors often leads to very conservative designs and it may contradict the optimization idea. Therefore, introduction of stochastic analysis to quantify robustness will become necessary. In forming simulations, the definition of robust processes is often based on bounds representing 3-
Weimarer Optimierungs- und Stochastiktage 4.0 – 29./30. November 2007 14
sigma values. A so called 3-sigma-value is actually a value with a probability of exceedance of 0.0013. When doing robustness evaluation, sigma-values can generally be estimated from the sample set or under assumption of distribution hypothesis computed from mean value and standard deviation. When doing robustness evaluation, one can assume that for estimations from the sample set to a few existing supporting points, a determination of the fractal values via normalized distribution functions is to be preferred [13]. A visualization of statistical measures on the FE-mesh facilitates considerably the engineering evaluation of robustness evaluation since the result values of a forming simulation, which are to evaluate, are generally spatial correlated values. The statistical measures on the FE structures serve as discussion basis for the identification of critical areas and as a basis for evaluating the robustness. In addition, this type of visualization leads to a high acceptance of the results in the production departments. Therefore, it is important to visualize the statistic measures directly on the component and respectively on the corresponding reference mesh and to communicate them in the design process. Mean value, variation coefficient, standard deviation and min/max values should be determined in the FE discretization and displayed on the FE structure [10]. Beginning with the linear correlation hypotheses and its measures of coefficients of determination as well as measures of variation, represented on the FE-structure, a first evaluation of robustness is performed. The found “hot” spots are then statistically secured on local level. Should small measures of coefficient of determination be found in areas of decisive scatter on the FE-structure, further statistic measures (quadratic correlation hypotheses and anthill-plots for nonlinearities in the transmission behavior) become necessary. If robustness cannot be reached with adjustments in the reliability domain like reducing input scatter or moving mean values for material parameters, a new constraint for the optimization is born. Usually, a larger safety distance against critical results has to be achieved by an optimization step. The following pictures of visualization of variation and correlation of important response values are taken from a robust design optimization of a BMW body part [16].
Figure 14: Maxima per element FLD_crack value
Weimarer Optimierungs- und Stochastiktage 4.0 – 29./30. November 2007 15
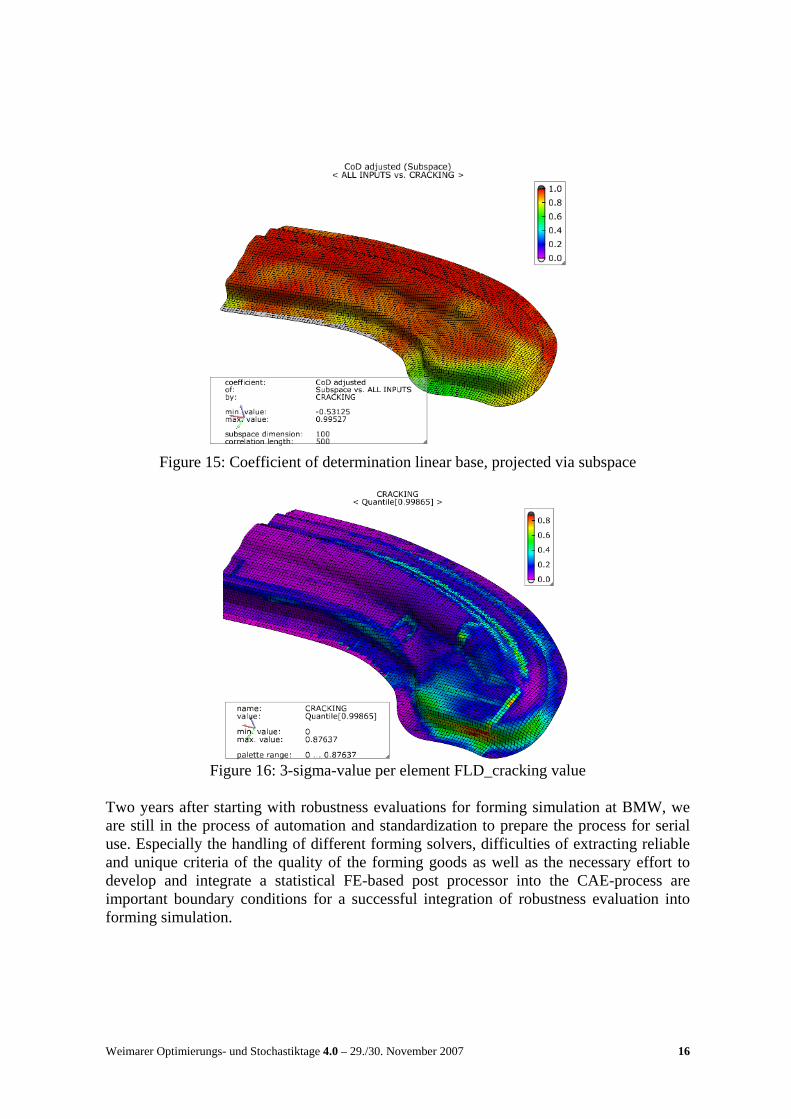
Figure 15: Coefficient of determination linear base, projected via subspace
Figure 16: 3-sigma-value per element FLD_cracking value
Two years after starting with robustness evaluations for forming simulation at BMW, we are still in the process of automation and standardization to prepare the process for serial use. Especially the handling of different forming solvers, difficulties of extracting reliable and unique criteria of the quality of the forming goods as well as the necessary effort to develop and integrate a statistical FE-based post processor into the CAE-process are important boundary conditions for a successful integration of robustness evaluation into forming simulation.
Weimarer Optimierungs- und Stochastiktage 4.0 – 29./30. November 2007 16
6. Requirements for the Successful Integration of Robustness Evaluations into the Virtual Product Development Process
From our experience in the implementation of variance based robustness evaluation in automotive applications, following boundary conditions have to be met: • Numerical model and simulation methods have to posses the fundamental ability of
prognosis and therefore have to be able to show all significant physical phenomena and compare them to experience or experimental data.
• Simulation processes often need to be improved regarding parametric, automatic repeatability and automatic result extraction to be ready for process integration in optiSLang.
• The existing knowledge on input scatter and uncertainties for example in boundary conditions, material values or load characteristics are properly to be transferred to an appropriate statistical description. The know-how about the uncertainties needs to be continuously collected, updated and validated.
• A stochastic sampling method has to be used for robustness evaluations which make sure that the errors within the estimation of the statistical characteristics are small enough and therefore that the results can be used as reliable foundation of a robustness evaluation.
• The statistical post processing needs to be standardized and automated. Standardization of robustness evaluation is very important and needs to be established at a care producer as well as at a component supplier virtual prototyping process.
Furthermore, one can assume that a consequence introduction of stochastic computation methods can be divided into two phases. Phase 1: Scatter and uncertainties of input variables are estimated from a few measurements and empirical values: • Transfer of existing knowledge on input scatter and uncertainties of testing conditions
in distribution functions • Inspection of model robustness/stability using coefficients of determination • Robustness evaluation of most important load cases, estimation of the variance of
important performance variables, inspection if limit values are exceeded by the variation of the performance variables
• Extraction of most significant correlations between scattering input variables and important performance variables as well as the matching of these mechanisms with expectations and knowledge based on the experiments
Within, and respectively as result of, phase 1, the following questions have to be discussed and arranged: • At which point in time in the virtual development process, the robustness evaluations of
components, modules or whole vehicles are performed? • For which input scatter the assumptions about the scatter have to be verified?
Weimarer Optimierungs- und Stochastiktage 4.0 – 29./30. November 2007 17
• How can the scatter of critical performance variables be reduced or relocated? • Which exceeding probabilities are tolerable for the performance variables? Phase 2: sensitive scattering input variables are known and the assumptions about their scatter are verified: • With secured knowledge about the input scatter, robustness evaluations are performed
at predefined milestones of the virtual product process. • Assuming that all important input scatter was considered close to reality and that the
numerical models show acceptable amount of numerical noise, then the estimate of the scatter of important input variables is trustworthy.
7. Summary and Outlook
A systematic approach was developed for determining the robustness of important performance criteria of automotive applications qualitatively and quantitatively. Primary result of the robustness evaluation is the estimation of the scatter of important result variables. Furthermore, sensitive scattering input variables can be identified and the determination of result variables can be examined. Assumptions concerning activated nonlinear correlations (clustering/outliers/bifurcation) caused by input scatter can be verified. By using measures of determination, the quantitative influence of numerical noise on the variation of result variables can be estimated and thereby, an important contribution to the reliability of prognosis and quality of the crash test computations can be given. The breakthrough in practical application and the acceptance of stochastic analysis for robustness evaluations was achieved by using linear/quadratic correlations and the corresponding measures of determination, by using projection of statistical measures on the finite element structure as well as by standardization and automation of robustness evaluation procedure. The quantitative estimation of the measures of determination and the securing of large measures of determination are not only meaningful in robustness evaluations of final designs. If crash tests are an integral part of multi-disciplinary optimization tasks [4], the measures of determination should also be secured for the result values. Here, the measures of determination in the design space of optimization can be used as quality criteria for the applicability of the results in constraints or objective functions [2]. The productive use of stochastic analysis in virtual prototyping is associated with high requirements on CPU, on the parametric of the models and on the automation of CAE-process as well as evaluation processes. From those requirements, an allocation of CPU-power is often the smallest problem. Also the automation of the CAE process is normally not a real problem. The definition and the automatic extraction of appropriate response values for robustness evaluation are usually one of the main work packages of the engineer
Weimarer Optimierungs- und Stochastiktage 4.0 – 29./30. November 2007 18
who is performing the robustness simulation. The automation of post processing of robustness evaluation including the offer of a filter of variable importance is one of the main topics of the current optiSLang software development and will be available to the public soon. Sometimes costly problems occur, if the parametric of the models needs to be improved for stochastic simulation. For example for passive safety applications, it became very important to reposition automatically the dummy after the perturbation of the design and dummy parameters are introduced. Therefore, we developed a multi body dummy positioner [6] and are facing the problem of automatic reposition of FE-dummies. Further research and code development is needed, if spatial correlated phenomena have to be taken into account. For example, geometric scatter or the consideration of scatter from forming parts in crashworthiness applications will need to extend the stochastic model of scatter definition to stochastic fields [1].
References
[1] Bayer, V.; Roos, D.: Non-parametric Structural Reliability Analysis using Random Fields and Robustness Evaluation, Proceedings Weimarer Optimierungs- und Stochastiktage 3.0, 2006, Weimar, Germany (www.dynardo.de)
[2] Blum, S.; Will, J.: Combining Robustness Evaluation with Current Automotive MDO Application, Proceedings Weimarer Optimierungs- und Stochastiktage 3.0, 2006, Weimar, Germany (www.dynardo.de)
[3] Bucher, C.: Basic concepts dor robustness evaluation using stochastic analysis; Proceedings EUROMECH colloquium Efficient Methods of Robust Design and Optimization, September 2007, London (www.dynardo.de)
[4] Duddeck, F.: Multidisziplinäre Optimierung im Produktentwicklungsprozess der Automobilindustrie; Proceedings Weimarer Optimierung- und Stochastiktage 2.0, 2005, Weimar, Germany (www.dynardo.de)
[8] SoS - Statistics_on_Structure, Version 1.0, DYNARDO 2007, Weimar, www.dynardo.de
[9] Will, J.; Möller, J-St.; Bauer, E.: Robustness evaluations of the NVH comfort using full vehicle models by means of stochastic analysis, VDI-Berichte Nr.1846, 2004, S.505-527
[10] Will, J.; Bucher, C.; Ganser, M.; Grossenbacher, K.: Computation and visualization of statistical measures on Finite Element structures for forming simulations; Proceedings Weimarer Optimierung- und Stochastiktage 2.0, 2005, Weimar, Germany (www.dynardo.de)
Weimarer Optimierungs- und Stochastiktage 4.0 – 29./30. November 2007 19
[12] Will, J: Introduction of robustness evaluation in CAE-based virtual prototyping processes of automotive applications; Proceedings EUROMECH colloquium Efficient Methods of Robust Design and Optimization, September 2007, London (www.dynardo.de)
[13] Will, J.: Bucher, C.: Statistical Measures for the CAE-based Robustness Evaluation, Proceedings Weimarer Optimierungs- und Stochastiktage 3.0, 2006, Weimar, Germany (www.dynardo.de)
[14] Will, J.; Baldauf, H.: Integration of Computational Robustness Evaluations in Virtual Dimensioning of Passive Passenger Safety at the BMW AG , VDI-Berichte Nr. 1976, Berechnung und Simulation im Fahrzeugbau, 2006, Seite 851-873
[15] Will, J.; Stelzmann, U.: Robustness Evaluation of Crashworthiness using LS-DYNA and optiSLang; Proceedings 25. ANSYS Conference & 25. CAD-FEM Users Meeting October 2007, Dresden, Chapter 1., Germany (www.dynardo.de)
[16] Will, J; Grossenbacher, K.: Robust Design Optimization of forming process simulation using LS-DYNA and optiSLang; Proceedings 25. ANSYS Conference & 25. CAD-FEM Users Meeting October 2007, Dresden, Chapter 1., Germany (www.dynardo.de)


![Music%20 video%20evaluation[1]](https://static.documents.pub/doc/80x56/546f4098af795980298b59b3/music20-video20evaluation1.jpg)


