48
State of the City Chamber of Commerce November 1, 2007 The city that makes a difference
State of the City
Chamber of Commerce
November 1, 2007
The city that makes a difference
Overview
• Snapshot of the city
• Council’s first year: an update
• Key themes & opportunities for the future
The city that makes a difference

Snapshot of the city
• Population growth• Household income • Unemployment rate• Job rate • Assessment composition• Tax burden comparisons• City reserves & debt
The city that makes a difference

Population growth
The city that makes a difference

Household income
The city that makes a difference

Unemployment rate
Unemployment Rates Guelph vs. Ontario
0
2
4
6
8
2001 2006
6.8%
4.2%
The city that makes a difference
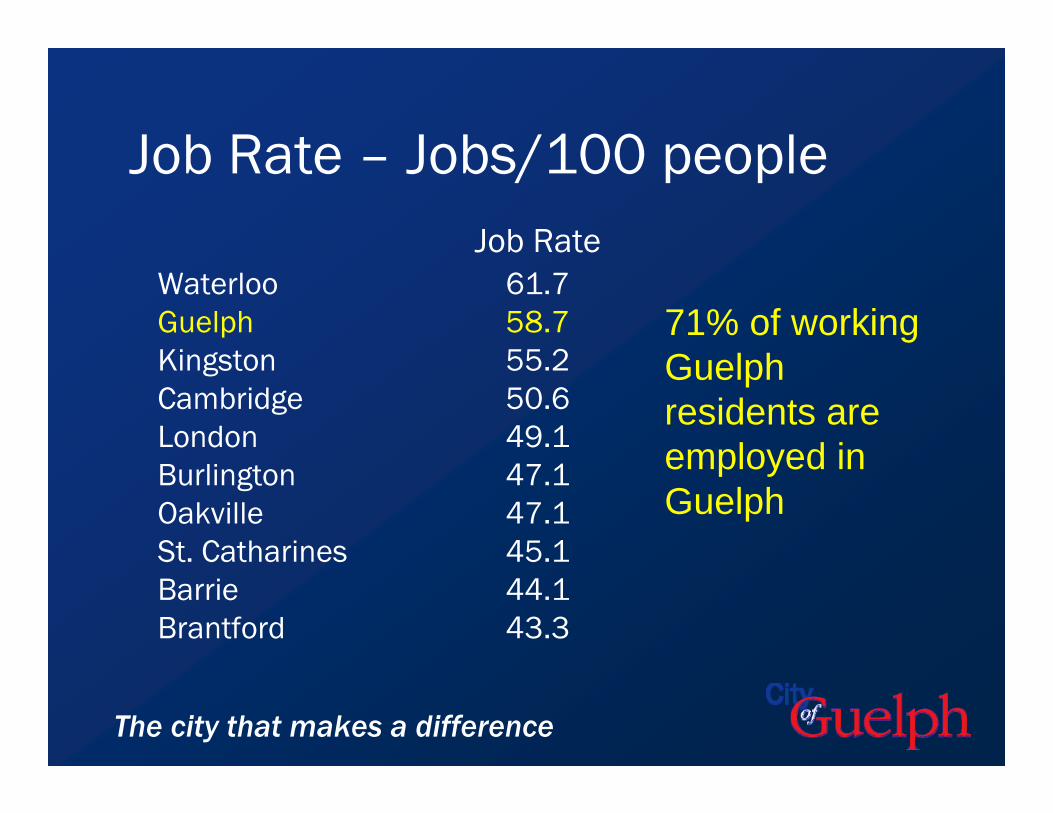
Job Rate – Jobs/100 people
58.7Guelph
44.1Barrie45.1St. Catharines47.1Oakville47.1Burlington49.1London50.6Cambridge55.2Kingston
61.7Waterloo
43.3Brantford
Job Rate
71% of working Guelph residents are employed in Guelph
The city that makes a difference

Employment - successes• Synnex Canada 250 jobs
• Denso Manufacturing 322 jobs($78.2 M expansion)
• Skyjack 360 jobs($24.8 M investment)
• Data Centre 140 jobs(120,000 sq. ft.)
The city that makes a difference
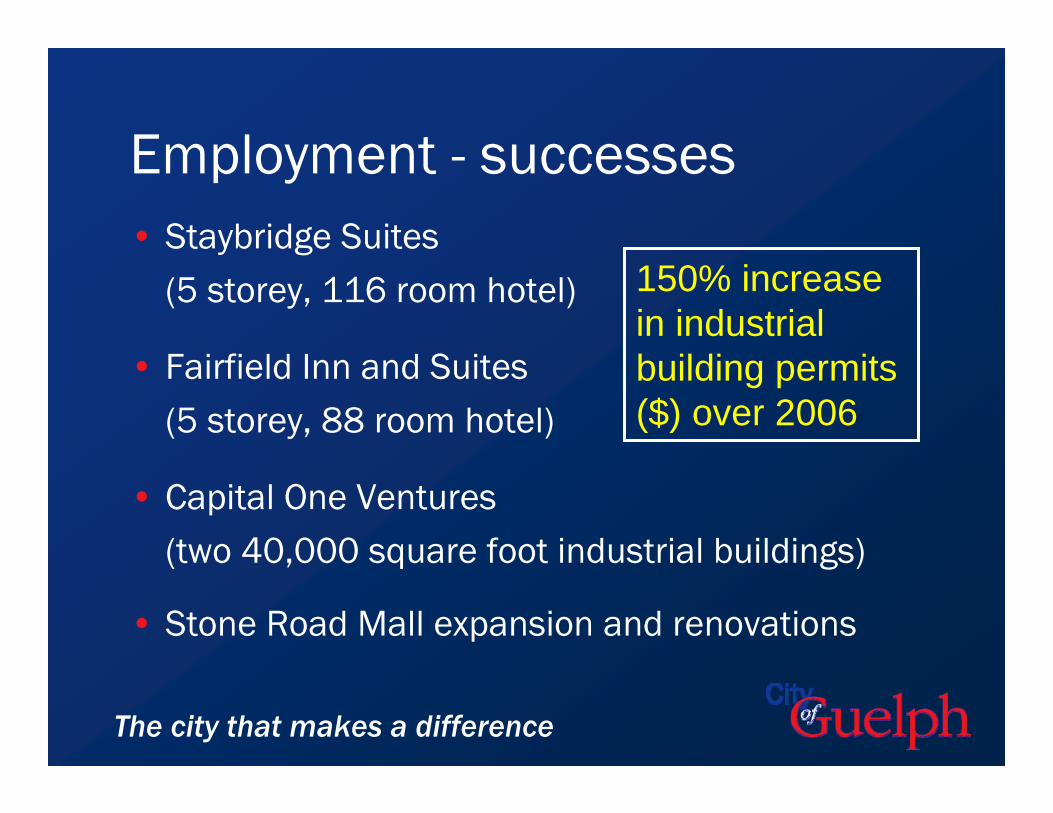
Employment - successes• Staybridge Suites
(5 storey, 116 room hotel)
• Fairfield Inn and Suites(5 storey, 88 room hotel)
• Capital One Ventures (two 40,000 square foot industrial buildings)
• Stone Road Mall expansion and renovations
The city that makes a difference
150% increase in industrial building permits ($) over 2006

Assessment composition (%)
13.8 (3.6)86.2Oakville14.1 (3.5)85.9Waterloo14.6 (1.7)85.4St. Catharines14.7 (1.3)85.3Kingston15.6 (1.8)84.4London16.3 (4.9) 2nd83.7Guelph17.0 (4.5)83.0Burlington17.2 (2.7)82.8Barrie17.8 (4.4)82.2Brantford20.2 (7.2)79.8Cambridge
(Industrial)/ Commercial/ Institutional
Residential
The city that makes a difference

Residential tax burden
The city that makes a difference
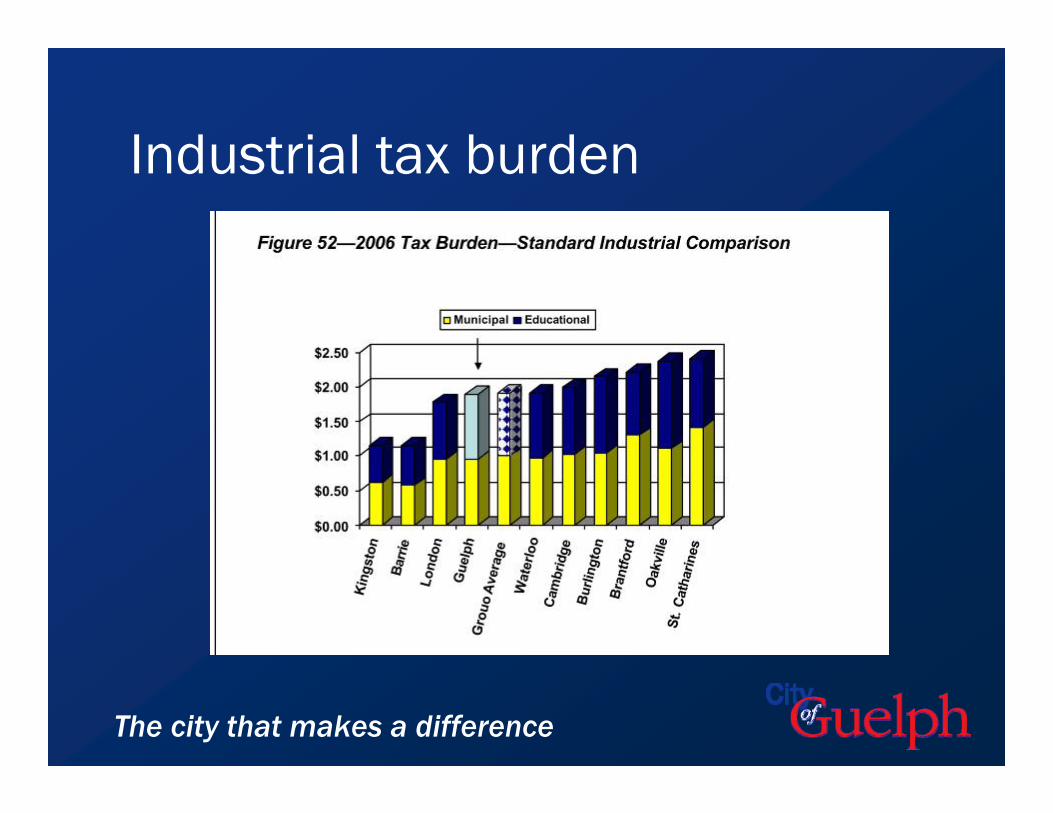
Industrial tax burden
The city that makes a difference

0
2
4
6
8
10
Cambridge
Brantfo
rdBarr
ieOak
ville
Kingsto
nGue
lphBurl
ington
Lond
on
St. Cath
arine
sWater
looAve
rage
Median
Debt
The city that makes a difference
Debt charges as a % of expenditures

Debt ManagementNet Debt Charges vs 25% Net Revenue
$0
$10,000,000
$20,000,000
$30,000,000
$40,000,000
$50,000,000
$60,000,000
2001 2002 2003 2004 2005 2006
Base Year
25% of Net Revenue Fund Revenue Net Debt Charges
The city that makes a difference
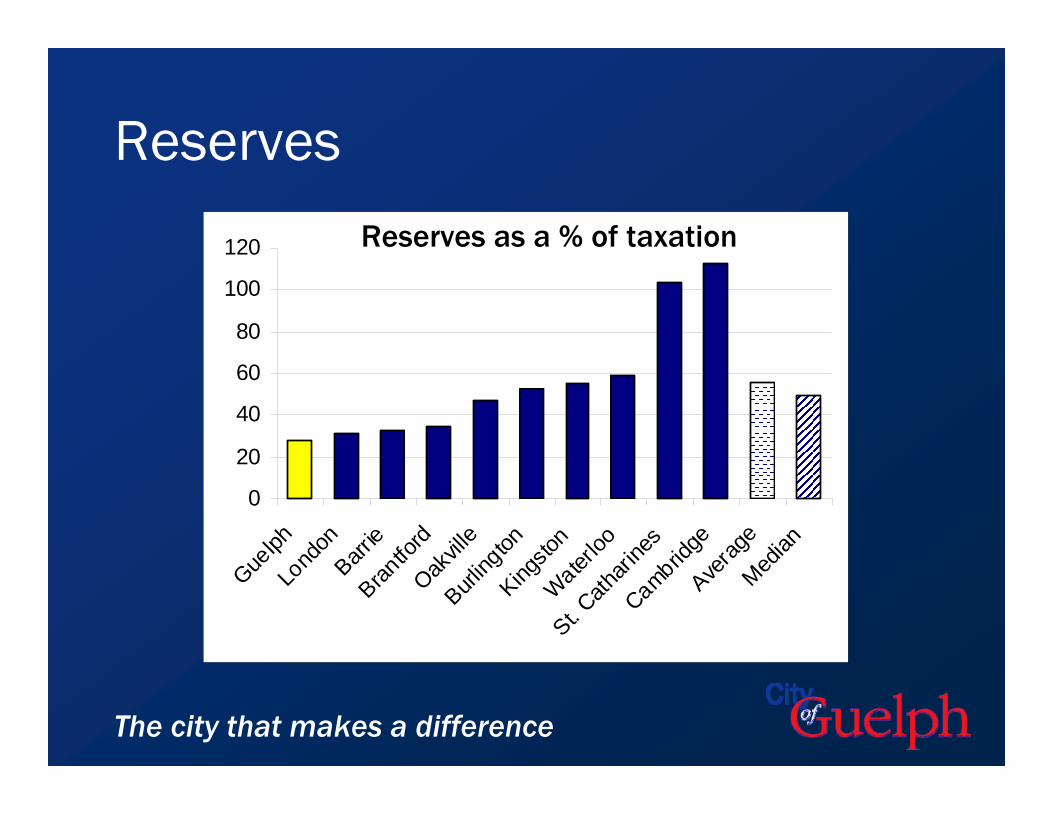
Reserves
The city that makes a difference
Reserves as a % of taxation
0
20
40
60
80
100
120
Guelph
Lond
onBarr
ieBran
tford
Oakvill
eBurl
ington
Kingsto
nWater
loo
St. Cath
arine
sCambrid
geAve
rage
Median
Reserves as a % of taxation

The first year
•Customer service•Asset management•Growth management•Continuous improvement•Global environmental concerns
The city that makes a difference

Customer Service• Community Design and Development
• Client-focused project management
• Building Department• On-line services• Biz Pal
• Finance• Tendering process
• New City Hall• Central customer service desk
The city that makes a difference
Customer feedback
“I am very impressed at how easy Guelph has made accessing tender information and documentation. Your no fee, no hassle online access approach has been a pleasure to navigate! Guelph has the least complicated, most user friendly municipal tender environment I have experienced to date!”
The city that makes a difference

What do we talk about?
Service Delivery Projects 80% to 90% of resources to service delivery & asset management
10% to 20% capacity for projects
The city that makes a difference

“Turning the crank”Budget• Approx. $300 M operating and capital in 2007
Assets• Water $370 M • Wastewater $480 M• Stormwater $300 M• Roads $380 M• Bridges $20 M
$1.55 billion of infrastructure assets
The city that makes a difference

“Turning the crank”• 420 km storm water pipe & 97 ponds• 502 km road• 496 km of water pipe• 457 km of sewer pipe• 522 hectares of park & open spaces• 4 million transit km travelled per year• 46,000 tonnes of solid waste• 19 M cubic metres of pumped & treated water
The city that makes a difference

Growth strategy: Places to Grow
Greater Golden Horseshoe:
• Fastest growing urban area in Canada
• Third fastest growing urban area in North America
• Grow by over 4 million people by 2031
The city that makes a difference

Places to Grow• Good for the economy • 2 million new jobs • Attract innovators, skilled workers and investment
But…• 45% longer commuting times• 42% increase in auto emissions • More than 1,000 square kilometres of farmland
consumed
The city that makes a difference

Implications for Guelph by 2031
• 65,000 new residents
• 45,000 new jobs
• 40% of new growth in the built boundary i.e. not green field
• Substantial change in the form of growth
City boundary
Urban Growth Centre
Greenfield Areas
Built Boundary
City boundary
Urban Growth Centre
Greenfield Areas
Built Boundary
The city that makes a difference

Local Growth Strategy
Guelph Quest• Guelph residents choose their future
Urban Design Guidelines
The city that makes a difference

Hanlon Creek Business Park
Land Strategy
South Guelph Lands
York Road Study
Actions
Short Term Supply Long Term Supply
Employment lands
The city that makes a difference

Hanlon Creek Business Park
South Guelph Employment Lands
TOTAL – 600 acres (243 ha.) by 2008

Downtown• New Downtown Economic Development
Manager hired• Community Improvement Plan for the
downtown • Multi-year plan for attracting investment• New initiatives, e.g. visit Brantford to see
downtown university campus
The city that makes a difference
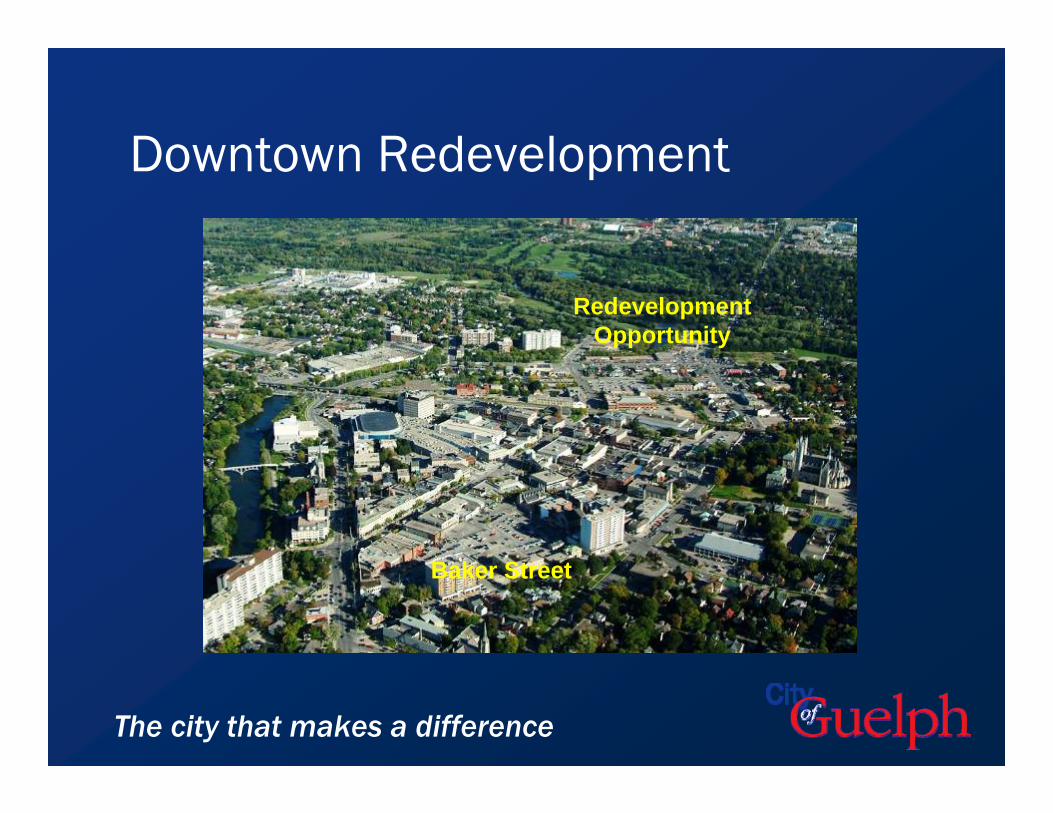
Downtown Redevelopment
Baker Street
Redevelopment Opportunity
The city that makes a difference

Redevelopment opportunity
The city that makes a difference

Downtown: Gummer & Victoria buildings
Photo: Candace Sepulis
The city that makes a difference
Partnership for redevelopment & intensification

Downtown: Parking• 2 hour free on-
street parking pilot
• Short and medium term parking plans developed
• Long-term parking strategy underway
The city that makes a difference

• 50 year Water Management Master Plan approved
• No consideration of a pipeline to Lake Erie
Water
The city that makes a difference
• Perfect score (100%) on Chief Drinking Water Inspector’s Annual Report for 2005-06

Wastewater• Optimization of the
performance of the existing system
• Potential deferral of a $20 million capital expansion from 2010 to 2024
• 50 year Waste Water Master Plan underway
The city that makes a difference

Waste management
• 50 Year Waste Management Master Plan underway
• Short-listing proven technologies to process our organic stream
The city that makes a difference

Waste Management• A 17.9% reduction from 2005 - $824,398 saved
The city that makes a difference
Cost of Residential Waste Collection
3.5
3.7
3.9
4.1
4.3
4.5
4.7
2005 2006 2007
in $million, adjusted for inflation
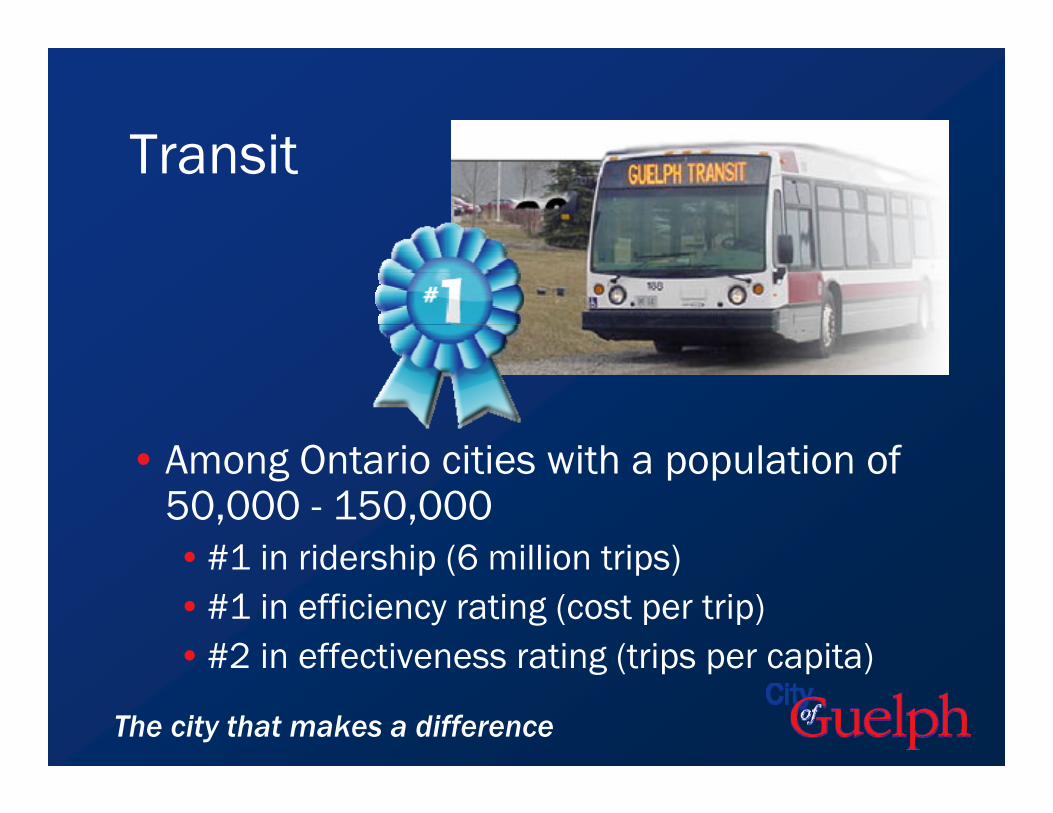
Transit
• Among Ontario cities with a population of 50,000 - 150,000• #1 in ridership (6 million trips) • #1 in efficiency rating (cost per trip) • #2 in effectiveness rating (trips per capita)
The city that makes a difference

Transit
• Service on statutory holidays
• GPS tracking system (NextBus)
• Currently 40-minute service at peak to ensure transfers
• Proposed budget expansion for 20-minute peak service in 2008
The city that makes a difference
On-time performance predictability
has risen from 40% to 85%

Guelph Police Service• Lower crime rate
than Ontario cities of similar size
• Declining overall crime rate
• Corporate Goal # 2 –Illegal Drugs
• New Co-ordinated Enforcement Team
• Substance Abuse Strategy
The city that makes a difference

New main public libraryGuelph Public Library Circulation
2002 2003 2004 2005 2006 2007*(Projected)
32% increase
The city that makes a difference

• Increase in population of 65,000
• Net reduction in energy consumption
• Reduction in GHG from 16 to 7 tonnes
The city that makes a difference
Community Energy Plan

Future themes• Optimize opportunities: Baker Street; Gummer &
Victoria buildings; Loretto Convent
• Plan for growth: community participation; infrastructure sustainability
• Build on strengths: engaged citizens; heritage and culture; vibrant downtown; diverse economy
• Grow a sustainable future: world leader in energy conservation; leading-edge waste management, water, and wastewater systems
The city that makes a difference
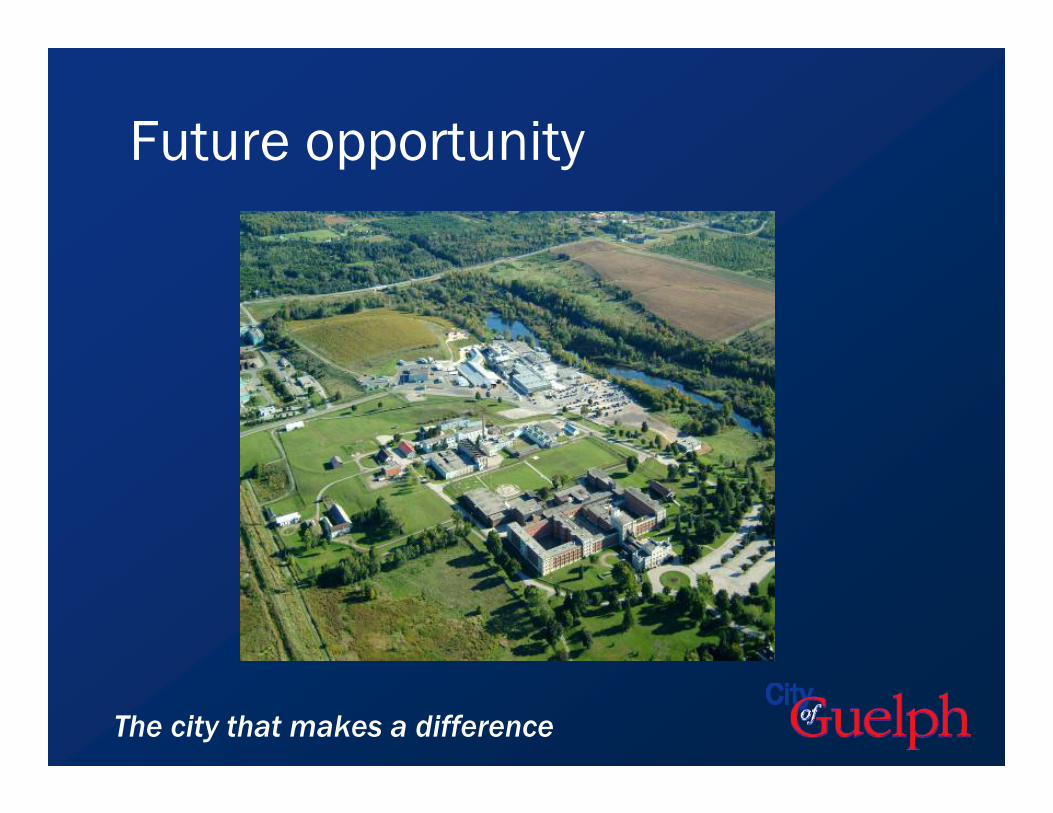
Future opportunity
The city that makes a difference

York Dist
rict
Downtown
The city that makes a difference
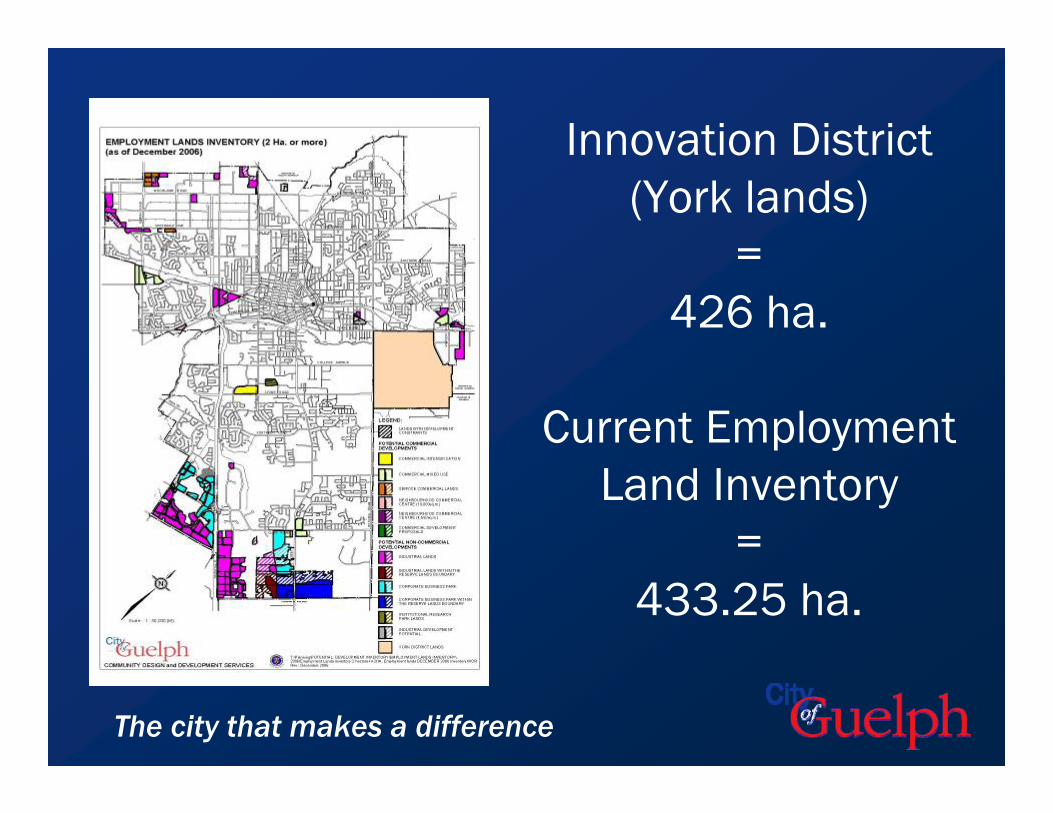
Innovation District (York lands)
= 426 ha.
Current Employment Land Inventory
= 433.25 ha.
The city that makes a difference

• Integrated energy planning
• Research & Innovation
• Waste Resource Innovation Centre
• Reduce waste• Increase diversion • Extract value
Guelph Innovation District
The city that makes a difference

Guelph Innovation District
•Employment•Education•Environment•Energy •Excellence
The city that makes a difference


