Page 1 of 26 VERTEX ® Construction Services, Inc. www.vertexeng.com 2010 STATE OF THE CONSTRUCTION & SURETY INDUSTRY REPORT prepared by: William J. McConnell, PE President contributions from: Devon L. Wisner, LEED AP
Transcript
Page 1 of 26
VERTEX® Construction Services, Inc.
www.vertexeng.com
2010STATE OF THE
CONSTRUCTION & SURETY INDUSTRY REPORT
prepared by:
William J. McConnell, PE President
contributions from:
Devon L. Wisner, LEED AP
Page 2 of 32
Table of Contents
I. Executive Summary……………………………………………………………………….3 II. State of the U.S. Economy…………………………………….…………………………..4
A. Definition of a Recession…………………………………………………….……4
B. Review of Key Economic Indicator…….…………………………………...…….5
C. Likelihood of a “Double Dip” Recession………….………………………………9
D. Political Climate and the Economy…………………........………………………10
III. State of the Construction Industry……………………………………………………….11
A. Contractor Profitability………………………………………………………......12
B. Materials & Labor Escalation………………………………………………..…..13
C. Construction Failure………………………………………………………....…...17
D. Construction Unemployment….………………………………………………….19
E. Construction Legislation……….………………………………………………....19
F. Market Sector Review…………….………..….................................................…20
G. Current Trends in the Construction Industry……..………………………………23
IV. State of the Surety Industry………………………………………….…………………...25
A. Surety Growth……………………………………………………………...……25
B. Surety Losses……………………………………………………………….…...26
C. Loss Cycle Review………………………………………………………...…….27
D. Surety Losses by Region…………………………………………………..….…29
E. Surety Consolidation…………………………………………………….….…...30
Appendix I: CV for William J. McConnell, PE
Page 3 of 32
October - 2010 I. Executive Summary
In mid September of 2010, the National Bureau of Economic Analysis (“NBEA”) reported that the recession which commenced in December of 2007 formally ended in June of 2009.1 This 18 month recession represents the longest economic downturn since World War II. The NBEA noted that the economy has yet to return to normal capacity, but it noted that the recovery started in June of 2009.
The slow recovery is largely a result of the continued credit crisis, state and federal
budget deficits, and lag in global markets. The national unemployment rate continues to hover around 10%; this is historically high, particularly since more than a year has passed since the recession ceased. The fear now is of a double dip recession that might result if unemployment starts to trend upwards.
The state of the construction industry is very poor. Nearly every construction sector was
down in 2009 and this trend continues in 2010. The few sectors that recorded marginal growth through August of 2010 are largely public works sectors and the increases are a result of stimulus funding; once the stimulus funded projects end, growth in these sectors will slow. The largest construction sector, Residential, is flat thus far in 2010. This is positive news considering the massive compression that took place over the past four years – this sector is less than one half of what it was in 2006.
Because more contractors are competing for less work, contractor failure rates are rising
sharply. In addition, contractor balance sheets are languishing. This combination spells trouble for surety industry performance over the next couple of years. Although the surety industry performed well in 2009, losses grew by nearly 50% from the prior year. In 2008, the surety industry recorded record breaking profits. The record low loss ratio in 2008 signifies the end of the third loss cycle in the last three decades and the start of the fourth loss cycle.
The fourth surety loss cycle will result in an upward trend in the loss ratios over the next
several years. Surety losses for this cycle will likely peak in 2012 and then trend downwards through 2016. For the third time in the last four years, the South region suffered the most losses. Between 2008 and 2009, losses in the South and in the Mountain region tripled. On a state by state basis, California, New Jersey, Michigan, Texas, and New York suffered the most losses. On a loss ratio basis, New Jersey and Michigan recorded 86% and 81%, respectively – no other states recorded loss ratios even close to these levels.
Surety consolidation over the past year was minimal, with the agreement between the
Hanover Insurance Group and ICW representing the largest deal. Because of the significant increase in net income for the property/casualty industry over the last two years, and the limited room for organic growth, insurance consolidation will likely continue over the next couple of years.
1 http://www.nber.org/cycles/sept2010.html
Page 4 of 32
II. State of the U.S. Economy A. What is the deal, are we still in a recession or not? Under the “two quarter rule2,” the U.S. economy is not in a recession as there has been four consecutive quarters of GDP growth. Under the two quarter rule, the recent recession ran from July-2008 to September-2009.
In addition, the Fed Reserve Chairman, Ben Bernanke, noted the “recession is very likely over” during a speech he gave on September 15, 2009. Chairman Bernanke did warn that unemployment would come down slowly – this has certainly been the case.
The federal government accepts the National Bureau of Economic Research (“NBER”)
position on the actual duration of a recession. According to the NBER, the U.S. economy fell into a recession in December of 2007, which represents the 23rd recession since 1900.3 In mid September of 2010, NBER reported that this recession formally ended in June of 2009.4 This is consistent with Vertex’s February-2009 projection that this recession would cease during
summer of 2009. This 18 month recession represents the longest economic downturn since World War II.
The NBEA defines a
recession at “a period of falling economic activity spread across the
economy, lasting more than a few months, normally visible in real GDP, real income, employment, industrial production, and wholesale-retail sales.”5 NBEA considers recovery as the start of the rising phase of the business cycle. NBEA further notes that “economic activity is typically below normal in the early stages of an expansion, and it sometimes remains so well into the expansion.”6 The NBEA noted that the economy has yet to return to normal capacity, but it noted that the recovery started in June of 2009.7
B. Review of Key Economic Indicators
1. U.S. Unemployment Rate – Slow Improvement
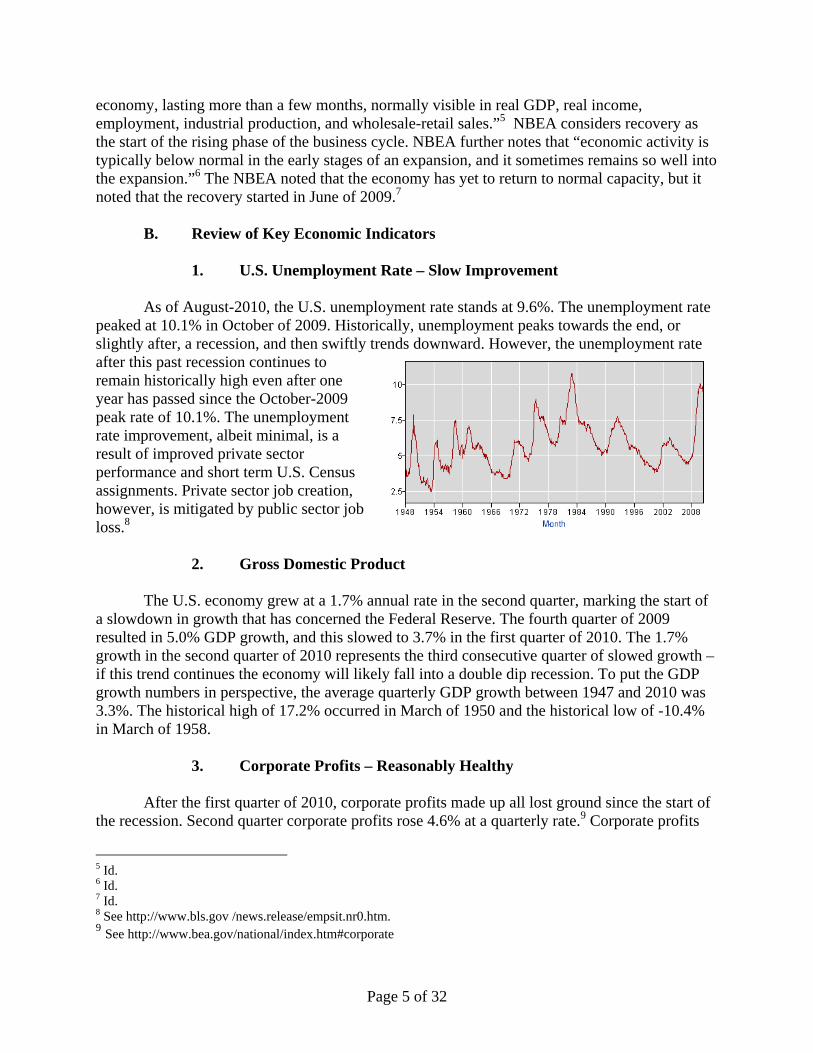
As of August-2010, the U.S. unemployment rate stands at 9.6%. The unemployment rate
peaked at 10.1% in October of 2009. Historically, unemployment peaks towards the end, or slightly after, a recession, and then swiftly trends downward. However, the unemployment rate after this past recession continues to remain historically high even after one year has passed since the October-2009 peak rate of 10.1%. The unemployment rate improvement, albeit minimal, is a result of improved private sector performance and short term U.S. Census assignments. Private sector job creation, however, is mitigated by public sector job loss.8 2. Gross Domestic Product
The U.S. economy grew at a 1.7% annual rate in the second quarter, marking the start of a slowdown in growth that has concerned the Federal Reserve. The fourth quarter of 2009 resulted in 5.0% GDP growth, and this slowed to 3.7% in the first quarter of 2010. The 1.7% growth in the second quarter of 2010 represents the third consecutive quarter of slowed growth – if this trend continues the economy will likely fall into a double dip recession. To put the GDP growth numbers in perspective, the average quarterly GDP growth between 1947 and 2010 was 3.3%. The historical high of 17.2% occurred in March of 1950 and the historical low of -10.4% in March of 1958.
3. Corporate Profits – Reasonably Healthy After the first quarter of 2010, corporate profits made up all lost ground since the start of
the recession. Second quarter corporate profits rose 4.6% at a quarterly rate.9 Corporate profits
5 Id. 6 Id. 7 Id. 8 See http://www.bls.gov /news.release/empsit.nr0.htm. 9 See http://www.bea.gov/national/index.htm#corporate
Page 6 of 32
continue to trend upwards and are 5.7% greater than they were at the start of the recession. An important thing to note is that this increase in corporate profits is largely a result of measures taken to reduce overhead, rather than from top line revenue growth.
4. The Consumer Price Index – Upward Movement The recent trend of the
Consumer Price Index (“CPI”) is upward; this upward movement comes on the heels of the largest CPI reduction in history.10 Over the last 12 months, the index increased 1.2%, mainly due to price increases in the energy sector. The cost of shelter, apparel, used cars and trucks, and tobacco is trending upward as well.
5. Consumer Spending Modest Increase
Consumer spending is trending upwards, which suggests that the U.S. economy might not
slip into a double dip recession. However, the noted reduction in disposable income suggests that individuals might now continue this upward spending trend. As seen stated by the U.S. Census Bureau, disposable personal income is decreasing over time, and spending is increasing over time; this is not a sustainable trend.11
6. Disposable incomes – Slow Decline The money left over after taxes dropped for the first time since January 2010 after
adjusting for inflation, showing how the lack of jobs may prevent spending from strengthening.12 Continued private sector employment improvements might improve real disposable personal income.
7. Stock Market - Flat The Dow Jones Industrial Average
(“DJIA”) started the year at 10,428. In my State of the Industry report for 2009, I predicted minimal to flat returns in 2010 based on historical trends. As of September 3, 2010, the DJIA was at 10,447. Hence, the market performed with a 0% return for the first eight months of the year. However, between
10 See http://www.bls.gov/cpi/home.htm#news and http://www.usinflationcalculator.com/ inflation/current-inflation-rates/ 11 See http://www.bea.gov/newsreleases/national/pi/pi_glance.htm 12 See http://www.bea.gov/briefrm/percapin.htm
Page 7 of 32
1964
1965
1966
1967
1968
1969
1970
1971
1972
1973
1974
1975
1976
1977
1978
1979
1980
1981
1982
1983
1984
1985
1986
1987
1988
1989
1990
1991
1992
1993
1994
1995
1996
1997
1998
1999
2000
2001
2002
2003
2004
2005
2006
2007
2008
2009
2010
2011
2012
2013
2014
2015
Year
$1.0 1,000
$2.0 2,000
$3.0 3,000
$4.0 4,000
$5.0 5,000
$6.0 6,000
$7.0 7,000
$8.0 8,000
$9.0 9,000
$10.0 10,000
Real
Gros
s Dom
estic
Pro
duct
in T
rillio
ns
DJIA
$12.0 12,000
$11.0 11,000
U.S. Gross Domestic Product v. Dow Jones Industrial Average
$13.0 13,000
$14.0 14,000
Real Gross Domestic Product
DJIA
Trend Line that follows the 1980s DJIA growth pattern
September and October, the market jumped 600 points. I anticipate that the market will pull back and will be more or less flat for the next twelve months. Until the U.S. economy records significant growth, investors will not realize substantive returns.
7. Federal Funds Rate – Flat
The federal funds rate is the interest
rate at which banks lend balances (federal funds) from the Federal Reserve to other banks, usually overnight. Simply put, it is the interest rate banks charge each other for loans. The federal funds rate is similar to Europe’s London Interbank Offered Rate, otherwise know as “LIBOR.”
Typically, the federal funds rate
steadily increases after a recession. However, the Federal Open Market Committee (“FOMC”) has yet to raise the rate, which remains at an all time low (0.00% to 0.25%). FOMC’s reluctance signifies their concern relative
Page 8 of 32
to the present state of the economy. In addition, financial institutions continue their reluctance to lend even though the cost of money is at an all time low – this is likely due in part to increased FDIC and SEC oversight and internal balance sheet concerns. An interest rate increase would only bolster this reluctance. Accordingly, the federal funds rate will likely remain at approximately 0.25% through the balance of 2010.
8. Regional Economic Analysis – Weak in Great Lakes, Far West, &
Southeast
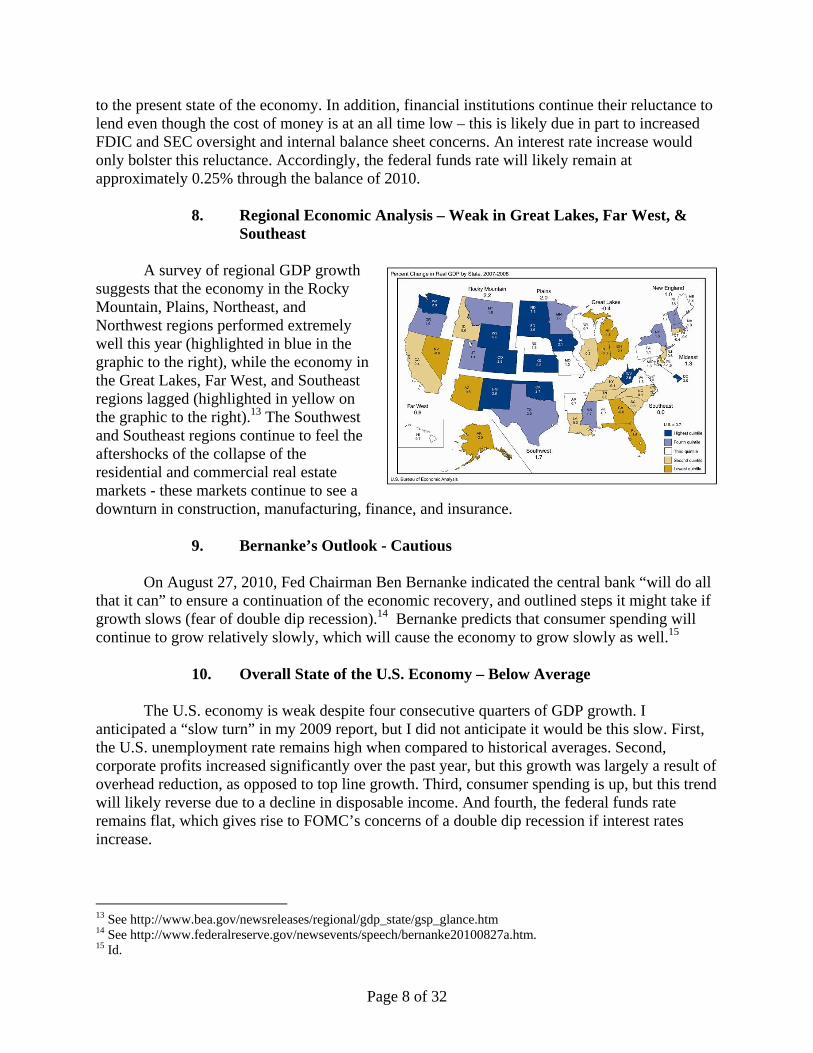
A survey of regional GDP growth suggests that the economy in the Rocky Mountain, Plains, Northeast, and Northwest regions performed extremely well this year (highlighted in blue in the graphic to the right), while the economy in the Great Lakes, Far West, and Southeast regions lagged (highlighted in yellow on the graphic to the right).13 The Southwest and Southeast regions continue to feel the aftershocks of the collapse of the residential and commercial real estate markets - these markets continue to see a downturn in construction, manufacturing, finance, and insurance.
9. Bernanke’s Outlook - Cautious
On August 27, 2010, Fed Chairman Ben Bernanke indicated the central bank “will do all
that it can” to ensure a continuation of the economic recovery, and outlined steps it might take if growth slows (fear of double dip recession).14 Bernanke predicts that consumer spending will continue to grow relatively slowly, which will cause the economy to grow slowly as well.15
10. Overall State of the U.S. Economy – Below Average The U.S. economy is weak despite four consecutive quarters of GDP growth. I anticipated a “slow turn” in my 2009 report, but I did not anticipate it would be this slow. First, the U.S. unemployment rate remains high when compared to historical averages. Second, corporate profits increased significantly over the past year, but this growth was largely a result of overhead reduction, as opposed to top line growth. Third, consumer spending is up, but this trend will likely reverse due to a decline in disposable income. And fourth, the federal funds rate remains flat, which gives rise to FOMC’s concerns of a double dip recession if interest rates increase.
13 See http://www.bea.gov/newsreleases/regional/gdp_state/gsp_glance.htm 14 See http://www.federalreserve.gov/newsevents/speech/bernanke20100827a.htm. 15 Id.
Page 9 of 32
C. What is the Likelihood of a “Double Dip Recession?”
A “double dip recession” occurs when the GDP compresses after a quarter or two of positive growth.16 A double dip recession is otherwise known as a W-shape recession. “A double-dip recession refers to a recession followed by a short-lived recovery, followed by another recession.”17 Although GDP growth occurred over the past four consecutive quarters, the growth slowed from 5%, to 3.7%, to 1.7% during the past three quarters. Economists fear this slowdown in growth might signify that the third quarter will yield GDP reduction.
A double-dip recession is a worst-case
scenario. Fear that the economy will move back into a deeper and longer recession makes recovery even more difficult. Robert Shiller, a professor of economics and finance at Yale University, recently told the New York Times that “The danger (of a double dip recession) stems from the weakness and vulnerability of confidence — whose decline could bring markets down, further stress balance sheets and cause cuts in consumption, investment and local government expenditures.”18
The last double dip recession occurred in the early 1980s. The U.S. economy fell into
recession from January 1980 to July 1980, shrinking at an 8% annual rate from April to June of 1980. The economy then entered a quick period of growth over the first three months of 1981, where it grew at an 8.4% annual rate. As the Federal Reserve (under Paul Volcker) raised interest rates to fight inflation, the economy dipped back into recession from July 1981 to November 1982. The double dip recession of the early 1980s explains why the FOMC is reluctant to increase the federal funds rate.
The following is a list of the recessionary cycles since the Great Depression:
Aug-29 to Mar-33: 43 months Dec-69 to Nov-70: 11 months May-37 to Jun-38: 13 months Nov-73 to Mar-75: 16 months Feb-45 to Oct-45: 8 months Jan-80 to Jul-80: 6 months Nov-48 to Oct-49: 11 months Jul-81 to Nov-82: 16 months Jul-53 to May-54: 10 months Jul-90 to Mar-91: 8 months Aug-57 to Apr-58: 8 months Mar-2001 to Nov-2001: 8 months Apr-60 to Feb-61: 10 months Dec-2007 to Jun-2009: 18 months
In August of 2010, Mark Zandi, chief economist at Moody’s Analytics Inc., noted that the likelihood of the economy slipping back into a recession is now 33%, up from a 20% chance 12 weeks ago.19
16 See http://www.investopedia.com/terms/d/doublediprecession.asp. 17 Id. 18 http://www.nytimes.com/2010/05/16/business/16view.html 19 http://www.nytimes.com/2010/05/16/business/16view.html
Double Dip Recession
Page 10 of 32
One important statistic to keep in mind is that the U.S. economy has never slipped back
into a double dip recession after there has been four consecutive quarters of GDP growth. Typically, once the GDP gains momentum, it generally does not turn back. Accordingly, I don’t believe the economy will slip into another recessionary cycle.20 D. How will the Political Climate Affect the Economy?
The economy continues to be the number one issue for voters. The November congressional elections should be telling of the voter’s opinions of President Barack Obama’s performance. Public approval for the President’s handling of the economy is waning.21 Based on this increased skepticism on President Obama’s performance, he plans to take immediate measures to promote hiring and growth. Specifically, the President unveiled a $50 billion proposal on Labor Day weekend to improve the nation's highways, airports and railways, in an attempt to jump-start the sluggish economy.22
20 Keep in mind I am often accused of being an optimist. 21http://online.wsj.com/article/SB10001424052748703713504575475400690920676.html?mod=WSJ_newsreel_business 22 Id.
Page 11 of 32
III. State of the Construction Industry – Survival Mode for Contractors The state of the construction industry can be summed up in two words…not good. The value of put-in-place construction is down 33% from its peak in 2006, and it continues to decline. In 2006, put-in-place construction amounted to approximately $1.2 trillion; in 2010, put-in-place construction revenue is projected at $810 billion. Nearly every construction sector, with a few exceptions, continues to languish. The few construction sectors that realized growth in 2009 and thus far in 2010 are public works sectors. The growth in these sectors has been fueled by funds included in the $787 billion American Recovery & Reinvestment Act of 2009. As these funds dry up, growth in these public sectors will slow considerably, if not compress.
As noted earlier, the U.S. economy is in slow recovery mode. The construction industry might grow marginally in 2011. This growth should continue at a slow pace for the next 24 months, similar to that of the U.S. economy.
In the early 2000s, the construction industry rebounded swiftly due to massive growth in
the Residential construction sector, which at its peak contributed nearly $600 billion to construction revenue. This recovery, however, was largely a result of loose subprime lending practices, as discussed in my 2009 State of the Industry report. Investment banks and commercial banks are no longer susceptible to such temptations and the FDIC and SEC will closely police lending practices moving forward.
In 2007, the historic construction boom came to a screeching halt. As a result, material
prices dropped significantly due to decreased demand. Wage growth has slowed as well since 2008 particularly as construction unemployment soared. Currently, the construction industry unemployment rate stands at 17% (as of August 2010), which is considerably higher than the overall U.S. unemployment rate.23
In the 1990s, the Residential sector represented approximately 43% of all construction spending. Between 2000 and 2006, this category grew to well over 50% of the construction industry. In 2008, the Residential market share slipped to 32%; this represents its lowest percentage in over two decades. As a result of the drag in the Residential sector, put-in-place construction is down for the second straight year and it is no longer a trillion dollar industry. The U.S. Census Bureau estimates put-in-place construction at $811 billion for 2010, the lowest level since 2000. 23 http://www.bls.gov/news.release/pdf/empsit.pdf
Page 12 of 32
A. Financial Condition of Contractors - Poor The overall financial condition of construction contractors, as a whole, is poor. The following will address the average financial condition of general contractors, heavy contractors, and specialty contractors, respectively. The main source for financial data is Bizminer, which is recommended by the Department of Commerce. The Bizminer financial data I reviewed profiles approximately 182 thousand general contractors, 26 thousand heavy contractors, and 284 thousand specialty contractors. 1. General Contractors – Extremely Poor 2009 construction revenue for general contractors is approximately two-thirds of what it was in 2006. EBITDA for general contractors is approximately one half of what it was in 2006, as is operating income and profit margin. The most alarming statistics are the three-fold increase in accounts payable; the three-fold increase in the average number of days for each payable before payment is made (from 38 to 114); and the six-fold increase in liabilities as a percentage of net worth; and (4) the near 80% reduction in average net worth.
1964
1965
1966
1967
1968
1969
1970
1971
1972
1973
1974
1975
1976
1977
1978
1979
1980
1981
1982
1983
1984
1985
1986
1987
1988
1989
1990
1991
1992
1993
1994
1995
1996
1997
1998
1999
2000
2001
2002
2003
2004
2005
2006
2007
2008
2009
2010
2011
2012
2013
$1.0
$6.0
$5.0
$4.0
$3.0
$2.0
$12.0
$11.0
$10.0
$9.0
$8.0
$7.0
$100
$600
$500
$400
$1,200
$1,100
$1,000
$900
$200
$800
$700
Year
$13.0
U.S. Gross Domestic Product v. Put In Place Construction Growth
$1,300
Real
Gros
s Dom
estic
Pro
duct
in T
rillio
ns
Put I
n Pl
ace C
onst
ruct
ion
in B
illion
s
$300
Real Gross Domestic Product
Put In Place Construction
Takeaways:
*The US Economy and the Construction Industry trend historically proportionally.
*When the Construction Industry outperforms the GDP, the Construction Industry subsequently corrects.
Page 13 of 32
2. Heavy Contractors - Poor With respect to revenue, heavy contractors faired much better than general contractors over the past four years; construction revenue for heavy contractors is only down 7% from peak revenue in 2006. Surprisingly, EBITDA, operating income, and profit margin are actually up from 2006 figures.
While current profit and loss figures are reasonably good, balance sheet figures are alarmingly bad. For instance, like general contractors, there is a three-fold increase in accounts payable, a three-fold increase in the average number of days for each payable before payment is made (from 42 to 119), and a near three-fold increase in liabilities as a percentage of net worth. Lastly, the average net worth of a heavy contractor dropped nearly 35% between 2008 and 2009. 3. Specialty Contractors - Poor Specialty contractors, on average, faired much better than general contractors and slightly better than heavy contractors. Construction revenue for specialty contractors is actually up 5% since 2006, EBITDA, operating income, and profit margin are all up from 2006 figures as well. It should be noted that operating income decreased slightly from 2008 to 2009.
While current profit and loss figures are reasonably good, there is reason for concern upon review of balance sheet figures. For instance, there is a two-and-a-half-fold increase in accounts payable, average number of days for each payable before payment is made (from 31 to 80), and liabilities as a percentage of net worth. Lastly, the average net worth of a specialty contractor dropped nearly 33% between 2008 and 2009.
In sum, contractor balance sheets, on average, are in poor shape. General contractors are fairing the worst, but heavy and specialty contractors are not far behind. While profit and loss performance is reasonably good (with the exception of declining revenue), such significant deterioration in contractor balance sheets has, and will continue to lead to a steady increase in surety claims. Although heavy contractors maintained reasonable revenue levels as of late, they are the most susceptible to failure as total liabilities far exceed those of general contractors and specialty contractors, due to capital equipment needs.
B. Materials & Labor Escalation - Modest Due to the reduction in demand for construction services over the past two years, nearly all construction material prices dropped in 2009. In 2010, material prices are up by 2.3% (as of August). The cost of skilled labor rarely declines, even through a recessionary cycle. Annual labor increases, however, do flatten during economic downturns, as has been the case over the past two years. The construction industry will likely pick up momentum in 2011 which will trigger increased material and labor escalation.
Page 14 of 32
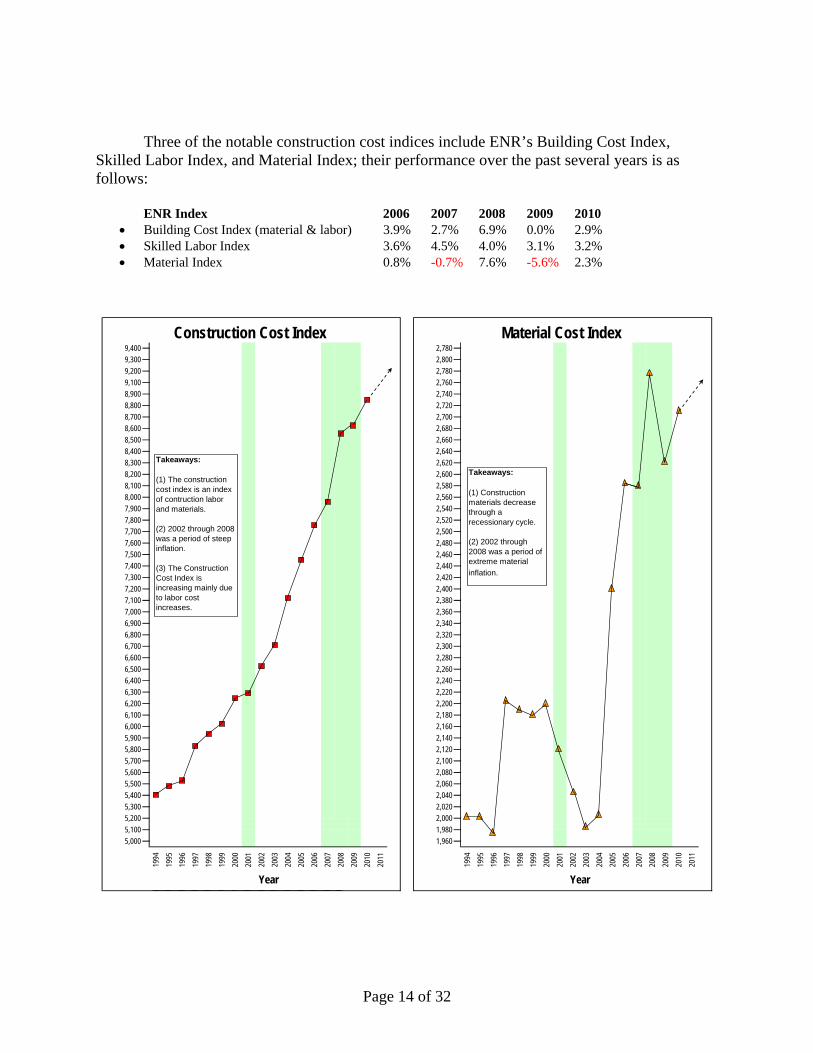
Three of the notable construction cost indices include ENR’s Building Cost Index,
Skilled Labor Index, and Material Index; their performance over the past several years is as follows:
ENR Index 2006 2007 2008 2009 2010
• Building Cost Index (material & labor) 3.9% 2.7% 6.9% 0.0% 2.9% • Skilled Labor Index 3.6% 4.5% 4.0% 3.1% 3.2% • Material Index 0.8% -0.7% 7.6% -5.6% 2.3%
1994
1995
1996
1997
1998
1999
2000
2001
2002
2003
2004
2005
2006
2007
2008
2009
2010
2011
1994
1995
1996
1997
1998
1999
2000
2001
2002
2003
2004
2005
2006
2007
2008
2009
2010
2011
1,960
Year
2,0402,0202,0001,980
2,0802,060
2,2002,1802,1602,1402,1202,100
2,2802,2602,2402,220
2,3602,3402,3202,300
2,4402,4202,4002,380
2,5202,5002,4802,460
2,6002,5802,5602,540
Material Cost Index
2,7402,7202,700
2,7602,7802,8002,780
2,6802,6602,6402,620
5,9005,8005,7005,600
Year
5,5005,4005,3005,2005,1005,000
6,3006,2006,1006,000
6,7006,6006,5006,400
7,1007,0006,9006,800
7,5007,4007,3007,200
7,9007,8007,7007,600
Construction Cost Index
8,900
8,6008,500
8,7008,800
9,1009,2009,3009,400
8,000
8,4008,3008,2008,100
Takeaways:
(1) Construction materials decrease through a recessionary cycle.
(2) 2002 through 2008 was a period of extreme material inflation.
Takeaways:
(1) The construction cost index is an index of contruction labor and materials.
(2) 2002 through 2008 was a period of steep inflation.
(3) The Construction Cost Index is increasing mainly due to labor cost increases.
Page 15 of 32
The following provides specific construction material escalation over the past several years.24
General ContractorsHeavy ContractorsSpecialty Contractors
30%
25%
35% 35%
CONTRACTOR FAILURE RATE
BizMinor Data
15%
10%
20%
(US Census Bureau recommends BizMinor for Failure Rate data)
30%
25%
20%
15%
10%
Forecast
C. Construction Failure Rate - Alarming
The number of contractor failures is skyrocketing. Between 2008 and 2009, the number of contractor failures doubled from approximately 15% to approximately 30%. The source of this failure data is BizMinor.
US Census Bureau Data(stopped keeping contractor failure data in 2002)
Year
14%
13%
16%
17%
12%
11%
12%
11%
Takeaway: Failure Rate Peaks During Recessionary Cycles
1. General Contractors – Alarming In 2007, there were 523 thousand general contractors in the U.S. In 2009, only 351
thousand of these contractors survived. This represents a failure rate of 32.8%. In contrast, the failure rate between 2006 and 2008 was 16.8%.
2. Heavy Contractors – Alarming
In 2007, there were 62 thousand heavy contractors. In 2009, only 45 thousand of these
contractors survived. This represents a failure rate of 27.1%. The failure rate between 2006 and 2008 was 14.8%.
3. Specialty Contractors - Alarming
In 2007, there were 826 thousand specialty contractors. In 2009, only 564 thousand of these contractors survived. This is a failure rate of 31.7%. The failure rate between 2006 and 2008 was 14.7%.
Page 19 of 32
4. Traditional Failure Model after a Recessionary Cycle
• Change in Market Conditions leads to… • A Decline in Construction Spending leads to… • Increased Competition & Lower Profit Margins leads to… • Rising Debt to Equity Ratios leads to… • Cash Flow Problems and Ill-advised Expansion into New Market and/or New Regions
5. Traditional Survival Model after a Recessionary Cycle
(“Right Sizing”)
• Change in Market Conditions leads to… • A Decline in Construction Spending leads to… • Increased Competition leads to… • Budgeting for Lower Revenue and Lower Profits leads to… • Swift Reductions in Manpower and Equipment & Restructuring Debt to Long Term Debt
leads to… • Continued Focus on Core Markets and Core Regions leads to… • Long Term Success
D. Construction Unemployment - Alarming The key indicators for the construction industry are put in place construction revenue and construction unemployment rate. As the construction industry compressed by 33% since 2006, construction unemployment skyrocketed. The construction unemployment rate more than tripled over the past three years, from approximately 6% to approximately 21%. The rate surpassed the 20% mark in early 2010 but dropped back down to 17% in July, before increasing to 18% in August of 2010.25
E. Construction Legislation
The President proposed a second stimulus package on September 7, 2010. This stimulus package covers approximately $50 billion in infrastructure spending plus two sets of business tax incentives.26 Critics argue that this plan would do little to increase employment figures and boost the GDP. However, the White House feels the programs will reduce construction unemployment.
The President proposed the first stimulus package ($825 billion) on January 15, 2008,
which was subsequently modified down to $787 billion before it was passed by Congress. This first stimulus package provided funds to a broad range of construction programs, across many 25 Source Data: Bureau of Labor Statistics 26 http://www.reuters.com/article/idUSTRE68645X20100907
Page 20 of 32
federal departments and agencies. The bill covered transportation, highway, energy, school, water, environmental, housing, defense, and building projects.
This second stimulus package, if passed, will likely focus on shovel ready transportation
and highway projects. The President will likely have trouble getting this bill through Congress as certain Democrats and most Republicans will likely oppose any type of significant funding measure.
F. Market Sector Review
In 2009, nearly all of the 17 construction sectors maintained by the Department of Commerce realized negative growth. Transportation, Power, and Highway & Street were the only growth sectors in 2009, which is largely a result of stimulus funding. In 2010, each of these sectors is back to negative growth. 2010 performance as of August is similar to 2009 performance, as nearly every sector is down. The only growth sectors in 2009 include Sewage & Waste Disposal, Water Supply, and Conservation & Development. The noted growth sectors were largely funded by stimulus dollars in 2010; therefore, revenue in these sectors will likely flatten or drop in 2011.
The following is a brief 2009 performance review and 2010 forecast for key construction
categories.27
• Manufacturing – Not Good (projected 35% decrease in revenue in 2010; 10% increase in 2009; 69% increase in 2008): Manufacturing revenue dropped sharply in 2010 (35% decrease) as the capacity utilization rate for manufacturing remains low. Hence, the reduced demand for additional space has reduced the demand for new construction. Key Indicator(s): The threshold average for Manufacturing is 110 million square feet. (2010 projection: 35 million SF; 2009: 77 million SF; 2008: 85 million SF)
• Power – Not Good (projected 12% decrease in revenue in 2010; 10% increase in 2009; 44% increase in
2008):
The Energy sector was up 10% in 2009 in large part due to the funding provided by the Energy Policy Act of 2005. This funding, in large part, dried up in 2009 so 2010 revenue is down 12%. This sector will likely see moderate growth over the next couple of years due to the revitalization of the nuclear industry (discussed later in this report) and continued alternative energy construction.
Key Indicator(s): Federal/State legislation.
• Water Supply – Good (projected 7% increase in revenue in 2010; 7% decrease in 2009; 13% increase in 2008): The first stimulus package provided key funding for water supply projects. Very few water supply projects were shovel ready in 2009, therefore most of this funding was earned in 2010. Once this funding is exhausted, growth in this sector will slow due to shrinking tax revenue and growing deficits.
27 McGraw Hill Construction Outlook 2010 Report
Page 21 of 32
Key Indicator(s): Federal/State legislation; municipal funding; Growth of the Residential sector. • Lodging – Extremely Bad (projected 52% decrease in revenue in 2010; 29% decrease in 2009; 35%
increase in 2008): The lodging sector is the hardest hit sector of 2010. After five straight years of growth, the Lodging sector was down 29% in 2009 and down 52% in 2010. Due to decreased occupancy rates and decreased revenue per hotel room, hotel construction is down to 18 million square feet per year in 2010. This is a fraction of the 100 million square feet built in 2008. This section will likely increase modestly in 2011 as the economy improves.
Key Indicator(s): The threshold average for hotel construction is 60 million square feet. (2010 projection: 18 million SF; 2009: 28 million SF; 2008: 100 million SF; 2001 recession: ~40 million SF)
• Health Care – Not Good (projected 10% decrease in revenue in 2010; 4% decrease in 2009; 12% increase
in 2008):
The Health Care sector is down for the second straight year. This segment will likely improve modestly in 2011 as the economy slowly improves. Over the next decade, this sector should perform well due to the aging demographics of the U.S.
Key indicator(s): The threshold average for healthcare facility construction is 80 million square feet. (2010 projection: 71 million SF; 2009: 68 million SF; 2008: 104 million SF)
• Office – Extremely Bad (projected 31% decrease in revenue in 2010; 23% decrease in 2009; 16% increase
in 2008):
The office sector continues to decline for a second straight year. Office construction per millions of square feet per year is at its lowest level since 1960 and office vacancy rates are at the highest level since 1993. As of the second quarter of 2010, the national office vacancy rate was up to 17.4%, according to New York-based research firm Reis Inc. Until a good portion of the vacant space is absorbed, the office sector will continue to decline.
Key indicator(s): The threshold average for office construction is 200 million square feet (2010 projection: 55 million SF; 2009: 71 million SF; 2008: 180 million SF; 2001 recession: 155 million SF). The threshold for vacancy rates is approximately 12% - anything below is good, anything above is bad.
• Highway and Street – Good (projected 1% increase in revenue in 2010; 1% increase in 2009; 9% increase
in 2008):
Highway and street construction has been flat for the past two years, which is actually stellar performance when compared with other sectors. The first stimulus package, coupled with the SAFETEA-LU bill, prevented a revenue decrease for the past two years. If a second stimulus package is approved by Congress, this sector should continue to remain flat. If this stimulus bill fails, Highway and Street construction will likely lag in 2011 due to decreased tax revenue and budget deficits.
Key Indicator(s): Federal/State legislation; municipal funding; growth of the Residential sector.
• Sewage & Waste Disposal – Very Good (projected 18% increase in revenue in 2010; 5% decrease in
2009; 6% increase in 2008):
In 2009, the Sewage & Waste Disposal sector decreased in revenue by 5%; this was the first decrease in this sector in seven years. This sector bounced back strong in 2010 and growth is projected at 18%, largely as a result of funding from the first stimulus package. If Congress does not pass the second stimulus package, this sector will likely pull back in 2011. This sector is largely driven by residential construction
Page 22 of 32
growth, which is at a historically low level at this point. Hence, this sector might flatten out for years to come.
Key Indicator(s): Federal/State legislation; municipal funding; growth of the Residential sector.
• Educational – Not Good (projected 14% decrease in revenue in 2010; 2% decrease in 2008; 10% increase
in 2008):
Revenue for the Educational sector pulled back significantly in 2010 as a result of local and state budget deficits. This trend in the educational sector is alteration work rather than new builds. Educational revenue will likely decrease further in 2011.
Key indicator(s): The threshold average for the education sector is 200 million square feet. (2010 projection: 2009: 145 million ; 2008: 210 million SF;); Growth of the Residential sector.
• Amusement & Recreation – Average (projected 4% decrease in revenue in 2010; 13% decrease in 2009;
5% increase in 2008):
This category, which includes sporting areas, theaters, casino portion of hotels, and convention centers, is down for the second straight year. The decline slowed in 2010 due to the construction of several new baseball stadiums and convention centers. This trend will likely decline further in 2011.
Key Indicator(s): The threshold average for Amusement & Recreation 65 million square feet. (2010 projection: 39 million SF; 2009: 42 million SF; 2008: 64 million SF)
• Commercial – Extremely Bad (31% decrease in revenue in 2010; 36% decrease in 2009; 8% decrease in 2008): The retail market cooled off in 2008 after consistent growth over the past four years. Since 2008 commercial construction decreased drastically due to increased vacancies. The Commercial sector will continue to slow until vacancies improve and the financial condition of retail operations improves. Tenant improvement is a reasonably stable subsector as more tenants are renovating existing space rather than relocating.
Key indicator(s): the threshold for an average year is 250 million square feet per year (2010 projection: 79 million SF; 2009: 96 million SF; 2008: 207 million SF).
• Residential – Getting Better (projected 1% decrease in revenue in 2010; 29% decrease in 2009; 28%
decrease in 2008):
In 2008 I wrote that “the good news is the Residential market cannot get much worse (in 2009).” Boy, was I wrong. Although economists forecasted that the Residential segment would bottom out in 2009 with a 5% drop in revenue, the Residential sector decreased 29% in 2009. These projections were a year off as the Residential sector bottomed out in 2010 with a 1% decrease (through August) and revenue will likely start to climb in 2011.
Key indicator(s) – Single Family: The threshold for an average year in the Single Family sector is 1.2 million new units. The number of single-family homes peaked in 2006 with the construction of over 1.7 million units. In 2008, this figure dropped to 549 thousand units and in 2009 this figured dropped even further to 435 thousand units. 2010 estimates show a rebound of 525 thousand units. Key indicator(s) – Multi Family: The threshold for an average year in the Multifamily sector is 350 thousand new units. In 2008, contractors built 307 thousand multifamily units; this figure dropped to 132 thousand in 2009. 2010 estimates show a rebound of 140 thousand units.
Page 23 of 32
Construction Sector PerformanceUS Department of Commerce
In 2009, the American Society of Heating, Refrigeration and Air Conditioning Engineers, Inc. (“ASHRAE”) launched much needed standards for green construction. In 2010, the State of California started to mandate the disclosure of building energy use in all real estate transactions.28 Other states are also contemplating such a mandate. Washington DC currently requires that all commercial buildings that are 200 thousand square feet or more to disclose energy performance using ENERGY STAR software29.
Perhaps the most prevalent green trend of 2010 is to retrofit existing buildings for energy efficiency. Certain energy companies give rebates and the government provides incentives for energy efficiency, which has increased construction in these areas. This trend will likely carry through 2011 as the cost of existing building retrofits should decrease as workers gain more
experience, material suppliers multiply, and new legislature continues to encourage energy efficiency and reduced carbon footprints.
2. Public-Private Partnerships (“PPP”)
PPP popularity modestly continued in 2010 as more states adopted PPP enabling legislation. In addition to transportation projects, some states are moving towards the regulation of PPP usage to facilitate much needed upgrades and improvements in the Education sector. PPPs are perhaps best suited for high speed rail projects, particularly if the proposed new heavy infrastructure bank passes through Congress, which would leverage $50 billion in public and private funds. In sum, PPPs will continue to gain popularity in the U.S. and will steadily become a more practiced form of project funding to address the nation’s infrastructure problems.
3. Building Information Modeling (“BIM”) BIM continues to be a trend and will most likely become less of a “trend” but more commonplace over the next decade. Initially, architects and general contractors promoted the use of BIM, and engineers resisted utilization. However, engineers, as a whole, are now starting to embrace BIM.
4. Green Building Materials
From engineered wood to denim byproducts used for insulation, 2010 brings with it a higher demand for eco-friendly materials. Green building materials were not as prevalent five years ago, but now with today’s demand and technology we are seeing an uptick in green building material usage.
6. Energy Trends
In 2010, the Obama Administration approved an $8 billion loan guarantee for the construction of two nuclear reactors in Georgia. If these two projects move forward, these would be the first plants to start construction in the U.S. in three decades. In addition, nuclear power construction could increase in popularity as more options become available for the storage of Spent Nuclear Fuel.
In addition to nuclear power, hydraulic fracturing or “fracking” has created a natural gas boom that is very relevant. Fracking is a technique that can be used in shale rich areas to produce natural gas. Proponents of fracking cite the ability to tap into an abundant, local, natural resource at minimal cost for natural gas, while its opposers cite the possibility of contaminated drinking water and the release of benzene (a human carcinogen) into the surrounding atmosphere.
In sum, fracking has the potential to continue trending upward if science can dispel said
concerns, and prove that the benefits outweigh the cost.
Page 25 of 32
IV. State of the Surety Industry
A. Surety Premium
The modern U.S. surety industry entered its 123 year in 2010. In 1887, the American Surety Company wrote its first surety bond and this started what is now a $5 billion industry. The Miller Act of 1935 (40 U.S.C. § 3131 to 3134) instantly popularized the contract surety product as this statute mandates that contractors that complete federally funded construction projects over a threshold amount ($100k) for federal owners must provide payment and performance bonds that run in favor of the federal owner. After the passage of the Miller Act, many states adopted “little” Miller Acts to ensure the incorporation of contract surety bonds on state funded construction projects over a threshold amount (varies state by state). Because contract surety bonds are mandated on federal and many state projects, the overall premium makeup for the contract surety industry is largely supported by public construction. Between 2001 and 2008, surety premium grew from approximately $3.4 billion per year to approximately $5.5 billion per year.30 In 2009, the surety industry started to feel the effects of the recent recessionary cycle as premium dropped to just under $5.2 billion and losses started to trend upwards. From 2001 through 2009, surety premium increased by approximately 52%. Similarly, public construction revenue increased from $202 billion to $315 billion per year during this time period; this represents an increase of approximately 55%. Hence, surety premium generally trends with public construction spending. Surety losses historically trend with the state of the U.S. economy, with a two year lag. From 2001 through 2009, private construction revenue decreased from $638 billion to $592 billion, which represents a decrease of 8%.31 Private construction peaked in 2006 at $911 billion.32 The compression of private construction revenue over the past four years is largely the result of compression in the residential industry. Private residential construction amounted to $612 billion in 2006; 2010 revenue for private residential construction is forecasted at $245 billion.33 Typically, the private residential construction sector is larger than all public construction. For the most part, the surety industry does not market its products to the private single family residential construction sector. If the surety industry could somehow penetrate this sector, there would be significant room for premium growth. In 2010, total construction is down by 10% through August of 2010. However, public construction is only down by 1% so surety premium will likely drop in 2010, but not significantly.
30 National Association of Insurance Commissioners Data. 31 http://www.census.gov/const/C30/total.pdf 32 Id. 33 Id.
Page 26 of 32
B. Surety Losses As a rule of thumb, surety providers profit when direct losses are 40% or less of direct written premium. Over the past three decades, the surety industry historically trends with overall economic market conditions, but the trend line lags that of the overall economy by several years. For example:
• The early ‘80s recession ended in 1982; surety losses peaked in 1986; • The early ‘90s recession ended in 1991; surety losses peaked in 1996; • The early 2000s recession ended in 2001; surety losses peaked in 2004; hence, • The late 2000s recession ended in 2009; surety losses should peak in 2012/2013.
This lag in surety losses occurs for several reasons. First, contractor backlogs typically
shrink during a recession. Backlog reduction often causes anxiety for owners of construction contractors. This anxiety is understandable in many instances. For instance, decreasing backlog for heavy contractors leads to drastic increases in debt to equity ratios as past equipment purchases are often made with the assumption that revenue will not decrease. When backlog decreases significantly, insolvency is a true threat. Hence, this anxiety often leads to the assumption of additional risks – such as expanding into new geographic markets and/or adding product lines. The additional risks associated with these types of decisions often leads to surety loss several years after the recessionary cycle ceased.
In addition, a recessionary cycle inevitably leads to more contractors vying for less work.
Where owners might solicit three to four bids from contractors during a booming economy, owners can solicit ten to fifteen bids during a down economy. The increased competition leads to a reduction in profit margins and an associated increase in risk. This additional risk translates into additional surety losses as work is performed. Because the work is obtained during the tail end of a recessionary cycle, the physical work is typically performed after the recession and losses generally result several years after the recessionary cycle.
Moreover, credit is always tightened during an economic downturn. This past recession
caused an unparalleled credit crunch for all industries. When credit is tight, contractors are forced to focus on liquidity, but this focus adjustment often comes too late. The importance of early debt restructuring and effective capital asset management cannot be understated. Refinancing to extend loan amortization and to take advantage of lower interest rates should be a constant focus for contractors. Payments can always be accelerated when the economy is booming if contractors want to reduce overall debt load and this restructuring provides contractors with a safety net during economic downturns. Regarding equipment, the lease to own trend makes a great deal of sense as contractors can turn in unneeded equipment during downturns, if necessary.
Contractors also resist downsizing, or shall I say rightsizing, until it is too late. As an
objective observation, the importance of constant rightsizing cannot be understated in the high risk business of construction. Most contractor problems could be cured with a continual focus on
Page 27 of 32
rightsizing to accommodate market conditions. This philosophy, however, is easier said that done. Construction is very much a team oriented business and personal relationships develop where it makes it difficult for construction executives to render a series of overhead cuts. This resistance to overhead reduction bleeds contractors of valuable cash and liquidity. Ultimately, this reluctance can spell disaster to contractors well after the end of a recession.
In sum, the additional risk taking measures that contractors often employ during
economic downturns causes an increase in surety losses several years after the end of a recession. In addition, refinancing efforts and overhead cuts often come too late. Based on these trends and historical loss patterns, the surety industry will experience increased losses over the next several years.
Since 1980, the surety industry suffered from three distinct loss cycles. During each loss cycle, the industry trends from several years of profitability to several years of loss, and then back to several years of profitability. Currently, the surety industry is in a fourth loss cycle. This fourth cycle started in 2008 when loss ratios hit a record low of 13%.34 In 2009, loss ratios increased significantly to 19% (approximate 50% increase year over year).35
34 Data Source: National Association of Insurance Commissioners 35 Id.
• Cycle 1 (1981 – 1991): This eleven year cycle was the most volatile with loss ratios starting at 34%, trending up to a peak of 103% in 1986, and trending down to 27% in 1991.36
• Cycle 2 (1991 – 1998): The second cycle covered an extremely profitable period with the
loss ratio starting at 27% in 1991 and trending up to a peak of only 43% in 1996, and trending down to a mere 18% in 1998.37
• Cycle 3 (1998 – 2008): The third cycle started in 1998 with a loss ratio of 18% and
trended up to a peak of 73% in 2004, and trending down to a historical low of 13% in 2008.38
• Cycle 4 (2008 – 2016): The fourth cycle started in 2008 with a loss ratio of 13%; the
upward trend started in 2009 with a loss ratio of 19%. This ratio will likely trend up to approximately 50% in 2011/2012/2013. Thereafter, loss ratios should trend back down to approximately 20%.39
36 Id. 37 Id. 38 Id. 39 Id.
Page 29 of 32
D. Surety Losses by Region
The South region turned in the highest surety losses for third time in four years. This comes as no surprise as the premium for the South region is twice that of any other region. In 2009, the Northeast region and the Pacific region both had loss ratios of 23%; the South region had a loss ratio of 18%; the Midwest region had a loss ratio of 15%; and the Mountain region continued its trend with the lowest loss ratio at 8%. 2009 Regional Loss Data:
1. New Jersey 86% 2. Michigan 81% 3. Arkansas 45% 4. Alabama 44% 5. Oregon 37%
Top 5 States with the Highest Loss in 2009
1. California $169M 2. New Jersey $134M 3. Michigan $59M 4. Texas $57M 5. New York $44M 5. Florida $44M
E. Surety Consolidation
For the past six years the market share of the top ten surety providers has hovered
between 65% and at 68% of the total market. This market share is massive when compared to other premium based products that property/casualty carriers offer. Little M&A activity took place in 2009 and thus far in 2010. The only surety related transaction involved the Hanover Insurance Group’s (13th largest surety in 2008) agreement with ICW Group (21st largest surety in 2008) to hire key underwriters and to gain access to ICW’s contract surety book of business.40 With this agreement, the Hanover Insurance Group is now the tenth largest surety provider.
Regarding merger and acquisition activity moving forward, experts predict that “as carriers continue to face a challenging rate environment with limited organic growth opportunities and excess capital, the appetite for growth through M&A will increase. We have seen a heightened interest in acquisitions from the buy-side with only modest interest in selling.”41 Accordingly, as we move into 2010, we would also expect M&A valuations for property casualty carriers to increase.
Over the past decade, the two largest M&A deals involved St. Paul and Travelers in
2004, and Liberty Mutual Group and the Safeco Corporation in 2008. As noted in my previous reports, most of the largest surety providers are property/casualty insurance companies. Surety
premium generally represents a small, albeit profitable (at least since 2004), percentage of overall revenue makeup.
To wit, the surety
industry wrote approximately $5.2 billion in premium in 2009, while the property/casualty industry wrote approximately $422 billion in premium during this same year.42 Because of the small contribution that surety groups makes to the overall property/casualty market (~1%), consolidation decisions are generally driven by property/casualty results. Accordingly, a review of the property/casualty market is important in predicting if consolidation of the surety market will continue.
2008 was a difficult year for property/casualty carriers, as it was for nearly every
industry. The steep decline in investment returns impacted balance sheets of property/casualty companies. In addition, the number of severe weather events increased substantially in 2008 after a two year lull. 2009 was significantly better than 2008 in terms of net income for property/casualty insurers. Property/casualty insurers, collectively, earned $28.3 billion in 2009 versus the $3 billion earned in 2008.43
Net Income for Property/Casualty Carriers:
2008: $3 billion 2009: $28.3 billion 2010: $33 billion (Based on $16.5 billion of net income earned in the first half of 2010.44) Through the first half of 2010, ISO noted that the property/casualty industry earned $16.5
billion of net income, this represents a significant increase from 2008.45 Although 2009 and 2010 results are favorable, low severity perils such as tornadoes, winter storms, hail, and flooding
1990 Top Surety Providers 2009 Top Surety Providers
1 F&D Group (now Zurich) 1 Travelers
2 USF&G Group (now Travelers) 2 Liberty Mutual Insurance Group
3 Reliance Insurance Group (now Travelers) 3 Zurich Insurance Group
4 Aetna Life & Casualty Group (now Travelers) 4 CNA Insurance Group
5 Fireman's Fund (now Kemper) 5 Chubb & Son Inc.
6 Seaboard Surety Co. (now Travelers) 6 Hartford Fire & Casualty Group
7 Continental Corp. (now CNA) 7 HCC Insurance Holdings Group
8 CNA Insurance Group 8 International Fidelity Insurnace Co.
9 Safeco Insurance Group (now Liberty) 9 ACE Ltd Group
10 Hartford Insurance Group 10 The Hanover Insurance Group
11 AIG 11 Great American Insurance Group
12 Chubb Group of Insurance 12 NAS Surety Group
13 St. Paul Group (now Travelers) 13 Lexon/Bondsafeguard Insurance
14 Amwest Group (out of business) 14 Arch Capital Group
15 Cigna Group (now ACE) 15 Chartis Group (AIG)
Only 5 out of the top 15 sureties remain in 2010
CONSOLIDATION OF THE SURETY INDUSTRY
Page 32 of 32
affected underwriting margins over the past two years.46 Regardless of these low severity perils, the industry is profitable and this profitability will likely lead to increased M&A activity.
_________________________________
Vertex is a worldwide provider of construction and environmental services. Vertex
Construction Services, Inc. provides engineering, consulting, construction management, general contracting, and expert services on: surety claims, construction defect claims, property / casualty claims, and construction claims. Vertex Construction Services, Inc. also provides construction management and general contracting services for public and private clients throughout the U.S. In 2010, Vertex was named one of ENR’s Top 100 Construction Management firms in the U.S. Vertex was also named one of ENR’s Top 50 Program Managers in the U.S. in 2010.
The Vertex Companies include: Vertex Construction Services, Vertex Environmental
Services, Vertex Air Quality Services, and Vertex Energy Services. For more information about The Vertex Companies, please refer to www.vertexeng.com. If you have any questions or comments regarding this report, please contact me at 303.623.9116 or [email protected]. VERTEX CONSTRUCTION SERVICES, INC.