“State of the Nation” Data Aggregator Dr. Loredana Radu – Director, Communication Department & Coordinator, “State of the Nation” Project, NUPSPA Dr. Alina Bârgăoanu – Dean, College of Communication and Public Relations & Institutional Development Coordinator, “State of the Nation” Project, NUPSPA Dr. Nicoleta Corbu – Executive Director, Centre for Research in Communication, FCRP-SNSPA, Sociology Communication Expert, “State of the Nation” Project, NUPSPA
Transcript
“State of the Nation” Data Aggregator
Dr. Loredana Radu – Director, Communication Department & Coordinator, “State of the Nation” Project, NUPSPA
Dr. Alina Bârgăoanu – Dean, College of Communication and Public Relations & Institutional Development Coordinator, “State of the Nation” Project, NUPSPA
Dr. Nicoleta Corbu – Executive Director, Centre for Research in Communication, FCRP-SNSPA, Sociology Communication Expert, “State of the Nation” Project, NUPSPA
Background: major challenges in today’s economy (1)
• Post-crash world• Export crisis• Hyper-globalization• Technological changes – triggering more and more inequality• The new protectionism – “new” national selfishness
• in the economic field • big players
Background: major challenges in today’s economy (2)
• How about the medium and small players?• Inter-regional arrangements around one big export-oriented player
(Germany, China)• Reinforcement of the internal premises for development:
demographics, qualification of the labor force, strength of the social fabric, quality of government and of macro-institutions.
Context
• The implementation of the EU-funded project
State of the Nation – Designing an Innovative Instrument for Evidence-Based Policy Making
Project objectives: the creation of a statistical data aggregator covering multidisciplinary areas, to be used by the Romanian
Government in the process of strategic policy-making and implementation
A dashboard to guide the country’s development
Project objectives
1. To develop a system of socio-economic indicators to be used in the process of policy-making and policy implementation (100 – 150 main indicators);
2. To design and implement the “State of the Nation” aggregator – an online statistical data aggregator / organizer (dynamic, user-friendly, data consistency over longer periods of time);
3. To study public opinion on issues related to Romania’s current socio-economic status and its potential for development;
4. To contribute to the strengthening of evidence-based policy making by the Romanian government.
Key DeliverablesKey Deliverables Start End
1. Preparing the system of socio-economic indicators for
evidence-based policy-making & the research
methodology
April 2016 February 2017
2. Designing the ”State of the Nation” online data
aggregator (with available public data only)
September 2016 February 2019
3. Implementing public opinion surveys on relevant topics
(Barometres)
May 2016 March 2019
4. Drafting public policy on evidence-based policy
making
April 2018 August 2018
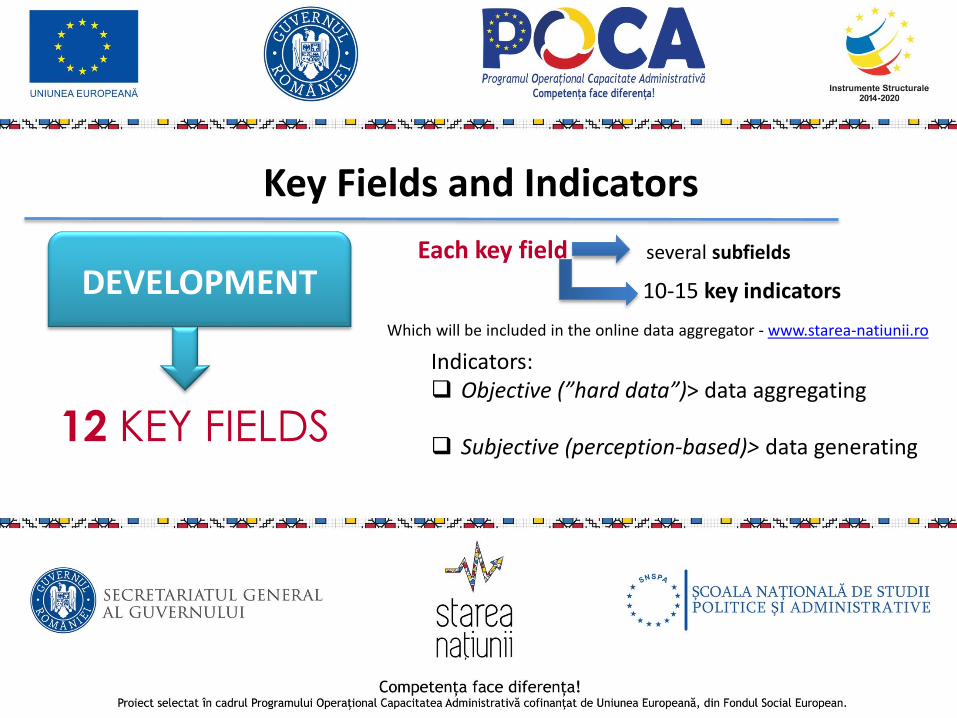
Key Fields and Indicators
Each key field
Which will be included in the online data aggregator - www.starea-natiunii.ro
several subfields
10-15 key indicators
Indicators: Objective (”hard data”)> data aggregating
Subjective (perception-based)> data generating12 KEY FIELDS
The 12 fields have been selected based on relevant research, literature review, aswell as building on the lessons learned from the study visits at Globalstat (EUI),Eurostat, European Comision, Eurofound, GESIS.
The following aspects have been carefully considered:- DEVELOPMENT as a key-concept (economic growth, inequality, cohesion, premisesfor development, the global environment etc.);
- THE ”BIG PICTURE” (overview, possibility to build correlations between key fieldsand indicators).
Important Constraints
Factors influencing the choice of key fields and main indicators:
- data availability and comparability at the national level (data series, time series,methodological coherence);- data availability and comparability at the sub-national level (NUTS 2) and for both ruraland urban areas;- data availability and comparability in Central and Eastern Europe (peer countries:Poland, Hungary, and Bulgaria).
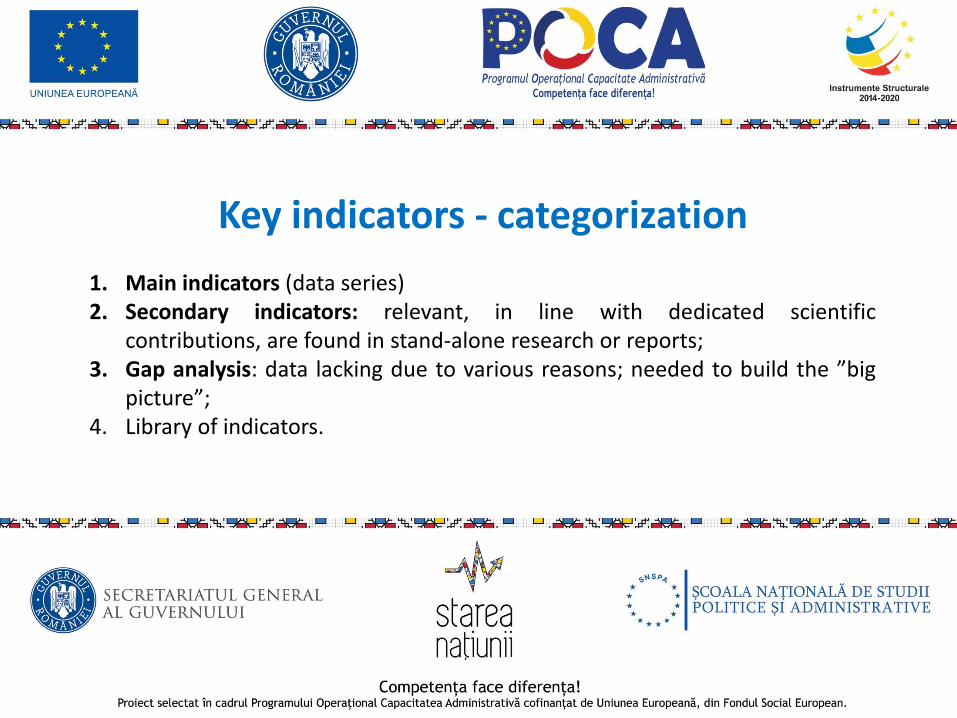
Key indicators - categorization
1. Main indicators (data series)2. Secondary indicators: relevant, in line with dedicated scientific
contributions, are found in stand-alone research or reports;3. Gap analysis: data lacking due to various reasons; needed to build the ”big
picture”;4. Library of indicators.
KEY FIELD
Subfields (2-5)
10-12 key indicators (text + data + charts)
10-15 secondary indicators (hyperlinks)
Gap analysis (missing, yet necessary data)
Barometer (Public opinion survey)
FEEDBACK WORKSHOPSNo. Key field of analysis Stakeholders Data
1 Economic DevelopmentFinancial Capital
Romanian Academy – Research Institute for World Economy
22/06/2017
2 Health Research Institute „Matei Balș” – Professor Adrian Streinu-Cercel
17/07/2017
3 Demography, quality of life Romanian Academy – National Institute for LifeQuality Research
4/10/2017
4 Economic DevelopmentFinancial Capital
Bucharest University for Economic Studies 11/10/2017
5 Education, Research Professor Adrian Curaj - Chair, UNESCO 24/10/2017
6 Health Romanian-American Workshop 26/10/2017
7 Security Ministry of Defence, IGSU, Police Academy 1/11/2017
8 Demography, labour market National Research Institute for Labour and Social Protection
8/11/2017
9 Governance Laurențiu Ștefan, Ioan Alexandru, Claudiu Tufiș 10/11/2017
10 Agriculture Ministry of Agriculture 20/11/2017
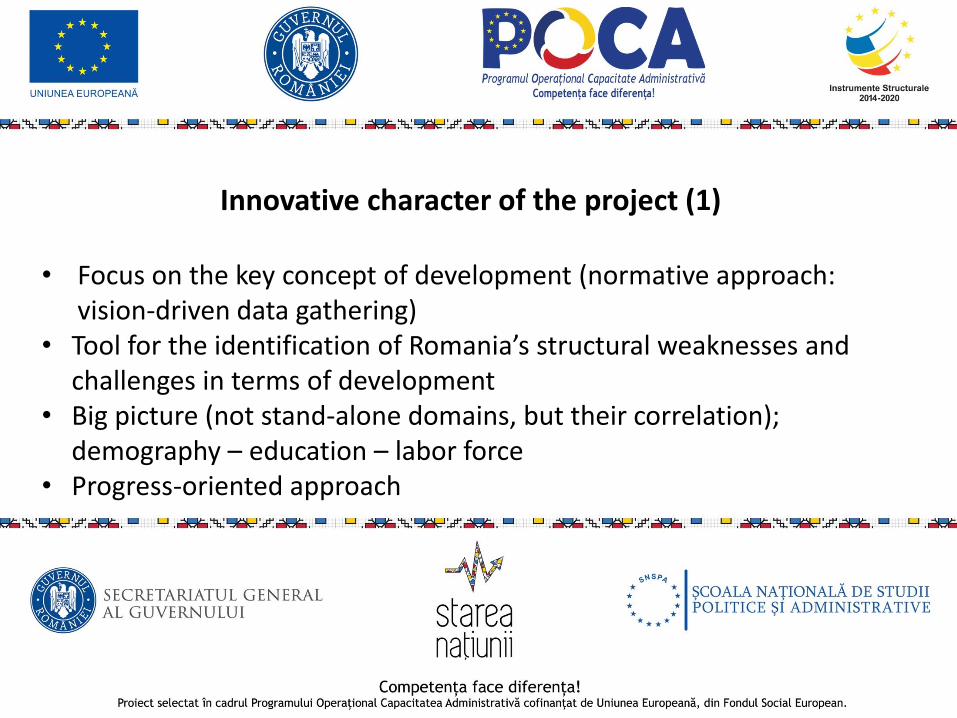
Innovative character of the project (1)
• Focus on the key concept of development (normative approach: vision-driven data gathering)
• Tool for the identification of Romania’s structural weaknesses and challenges in terms of development
• Big picture (not stand-alone domains, but their correlation); demography – education – labor force
• Progress-oriented approach
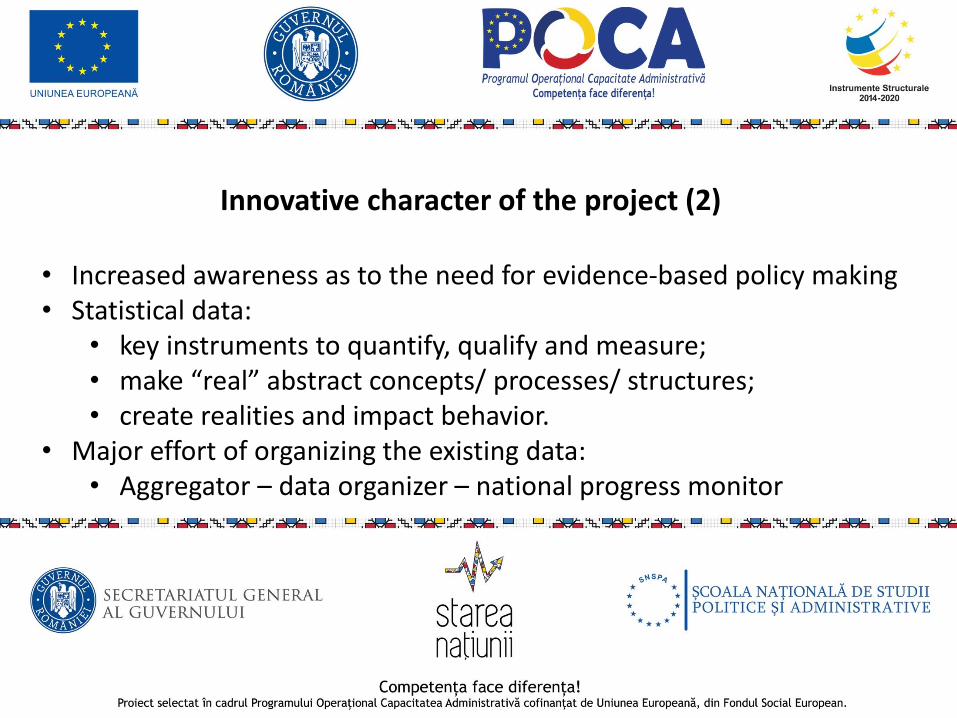
Innovative character of the project (2)
• Increased awareness as to the need for evidence-based policy making • Statistical data:
• key instruments to quantify, qualify and measure;• make “real” abstract concepts/ processes/ structures;• create realities and impact behavior.
• Major effort of organizing the existing data:• Aggregator – data organizer – national progress monitor
Innovative character of the project (3)
• Benchmarking:• EU average;• Peer group: Central and Eastern Europe (Poland, Hungary, Bulgaria);• Subnational level;• Urban/ rural.
• Public communication tool (dialogue, feedback loops, public debate)• Agenda setting function: reinforcing major topics of public debate,
signaling pseudo-topics
ECONOMIC DEVELOPMENT AND PUBLIC DEBT
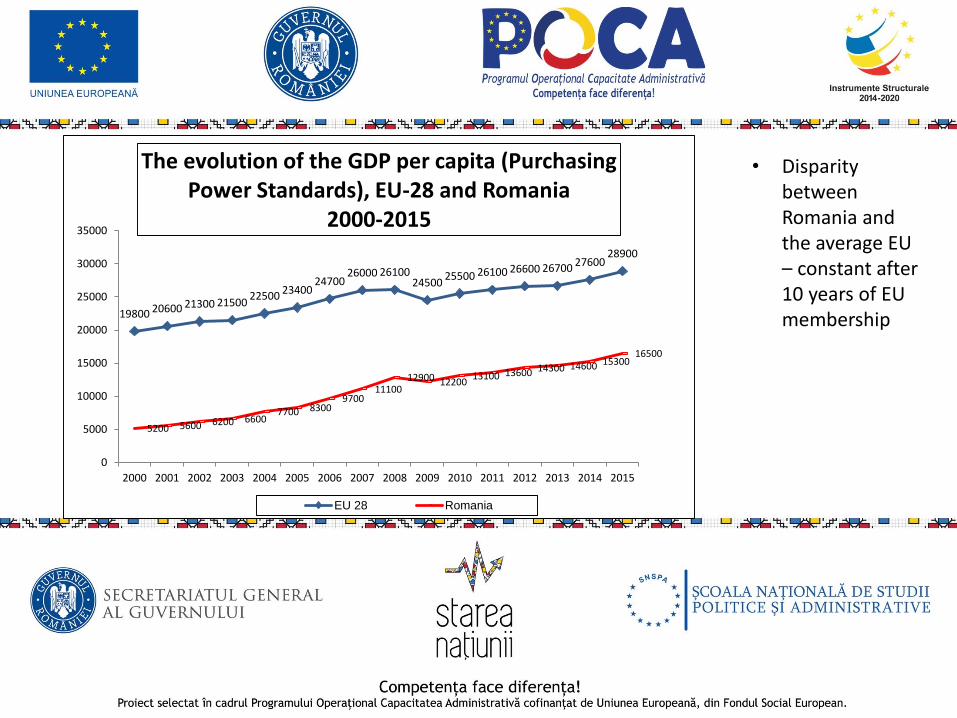
• Disparity between Romania and the average EU – constant after 10 years of EU membership19800 20600 21300 21500
The evolution of the GDP per capita (Purchasing Power Standards), EU-28 and Romania
2000-2015
EU 28 Romania
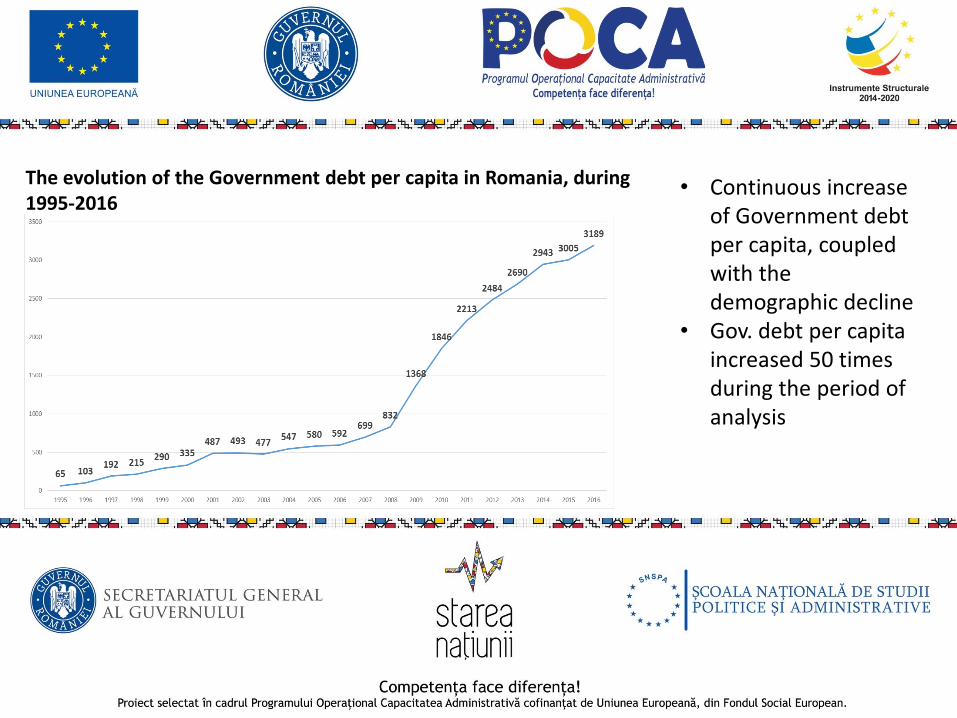
The evolution of the Government debt per capita in Romania, during 1995-2016
• Continuous increase of Government debt per capita, coupled with the demographic decline
• Gov. debt per capitaincreased 50 times during the period of analysis
INEQUALITY AND REGIONAL DISPARITIES
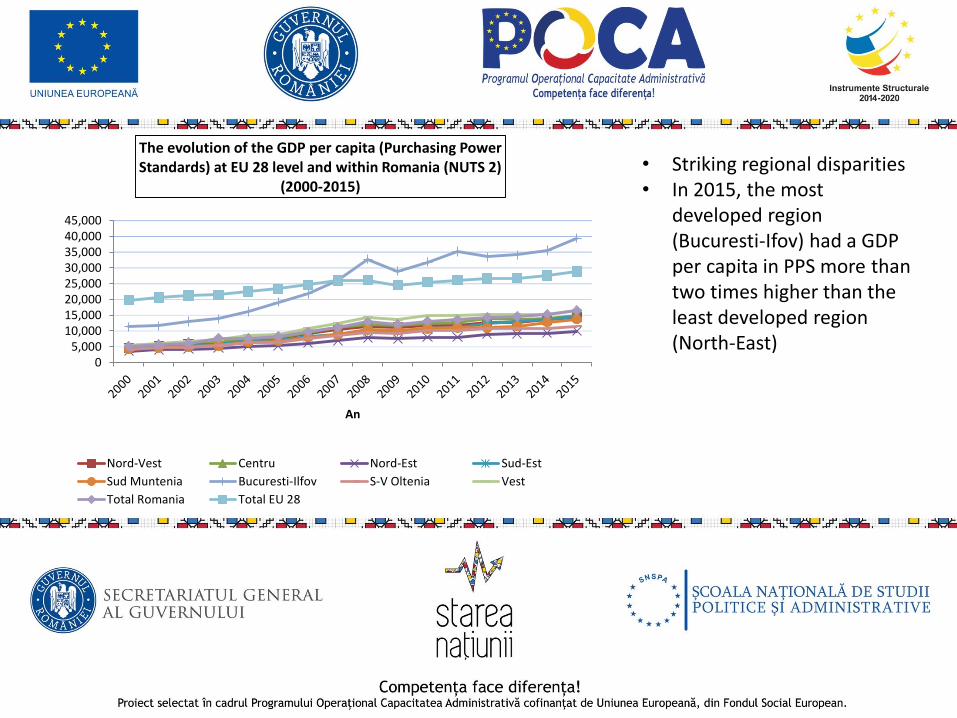
• Striking regional disparities• In 2015, the most
developed region (Bucuresti-Ifov) had a GDP per capita in PPS more than two times higher than the least developed region (North-East)
05,000
10,00015,00020,00025,00030,00035,00040,00045,000
An
The evolution of the GDP per capita (Purchasing Power Standards) at EU 28 level and within Romania (NUTS 2)
(2000-2015)
Nord-Vest Centru Nord-Est Sud-Est
Sud Muntenia Bucuresti-Ilfov S-V Oltenia Vest
Total Romania Total EU 28
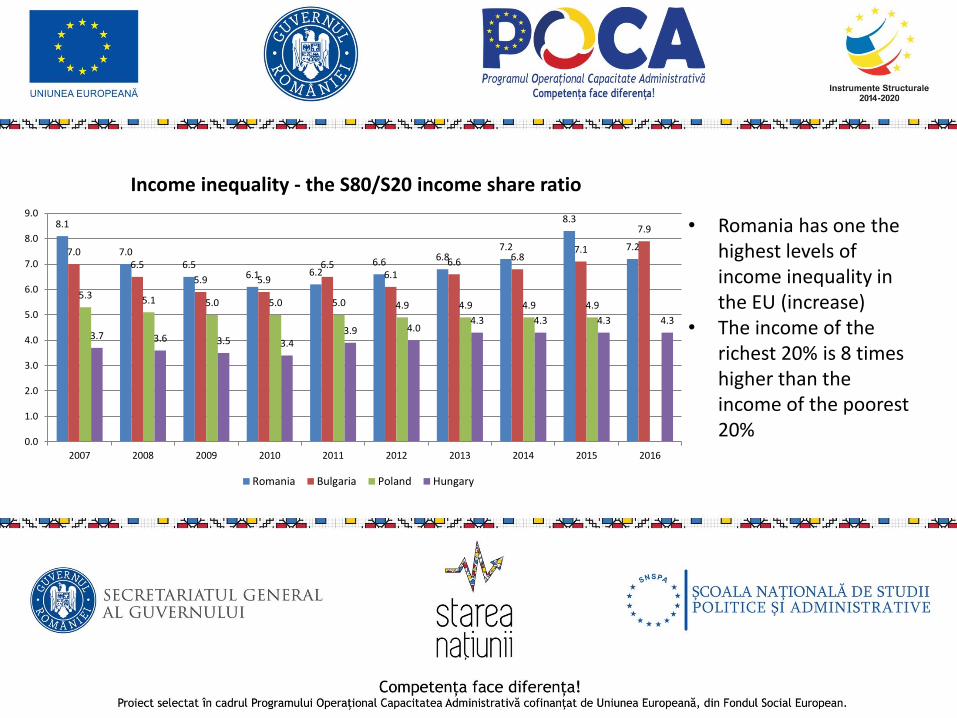
• Romania has one the highest levels of income inequality in the EU (increase)
• The income of the richest 20% is 8 times higher than the income of the poorest 20%
8.1
7.06.5
6.1 6.26.6 6.8
7.2
8.3
7.27.06.5
5.9 5.9
6.56.1
6.6 6.87.1
7.9
5.3 5.1 5.0 5.0 5.0 4.9 4.9 4.9 4.9
3.7 3.6 3.5 3.43.9 4.0
4.3 4.3 4.3 4.3
0.0
1.0
2.0
3.0
4.0
5.0
6.0
7.0
8.0
9.0
2007 2008 2009 2010 2011 2012 2013 2014 2015 2016
Income inequality - the S80/S20 income share ratio
Romania Bulgaria Poland Hungary
DEMOGRAPHY
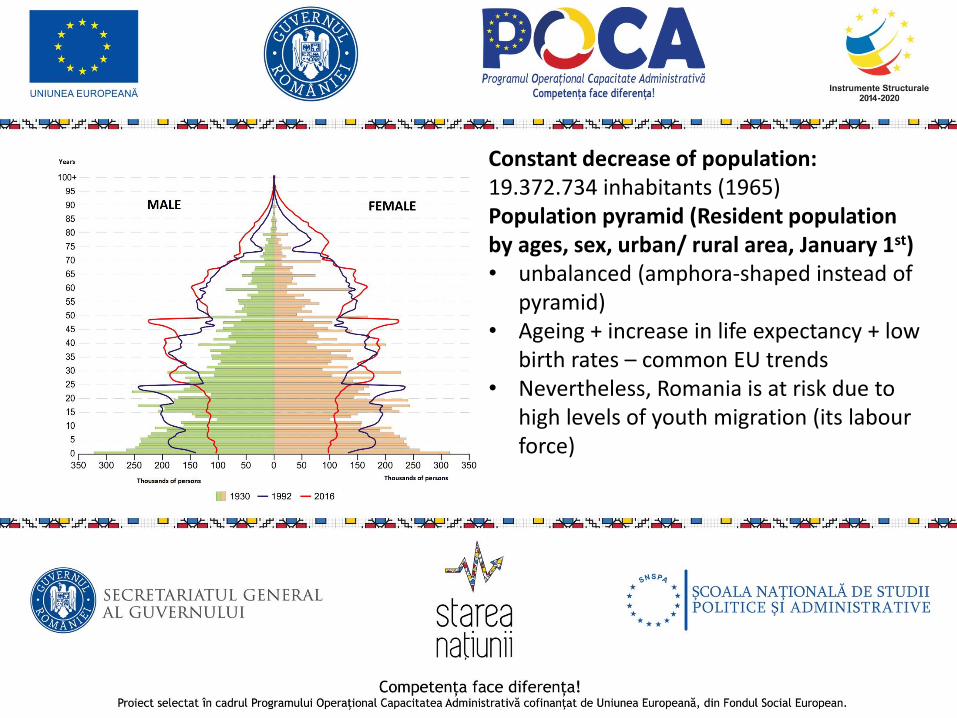
Constant decrease of population: 19.372.734 inhabitants (1965)Population pyramid (Resident population by ages, sex, urban/ rural area, January 1st)• unbalanced (amphora-shaped instead of
pyramid)• Ageing + increase in life expectancy + low
birth rates – common EU trends• Nevertheless, Romania is at risk due to
high levels of youth migration (its labour force)
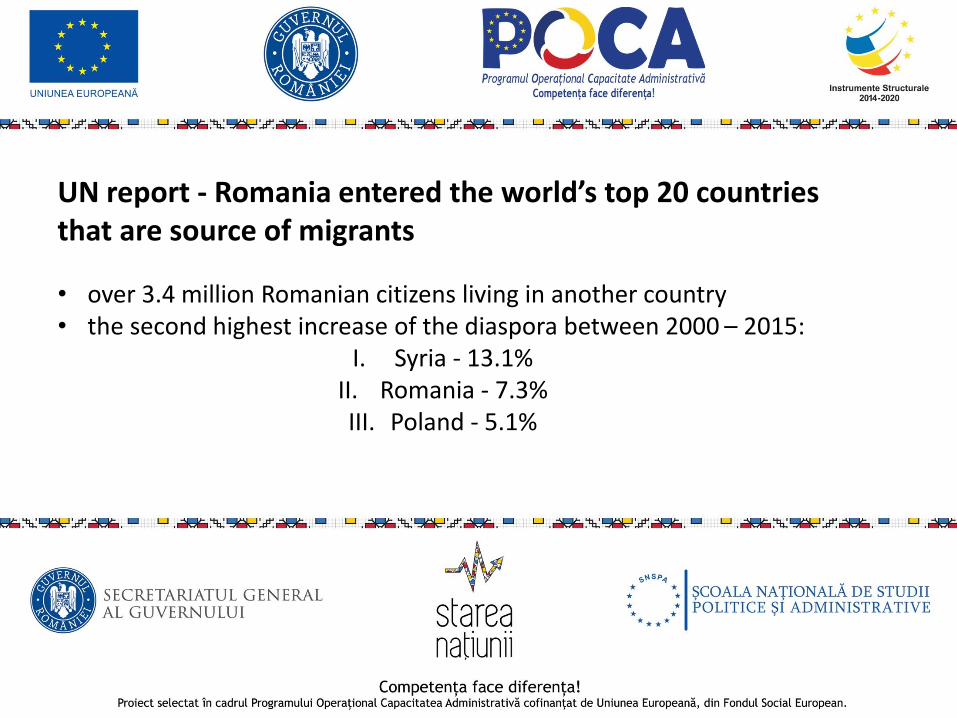
UN report - Romania entered the world’s top 20 countries that are source of migrants
• over 3.4 million Romanian citizens living in another country• the second highest increase of the diaspora between 2000 – 2015:
I. Syria - 13.1%II. Romania - 7.3% III. Poland - 5.1%
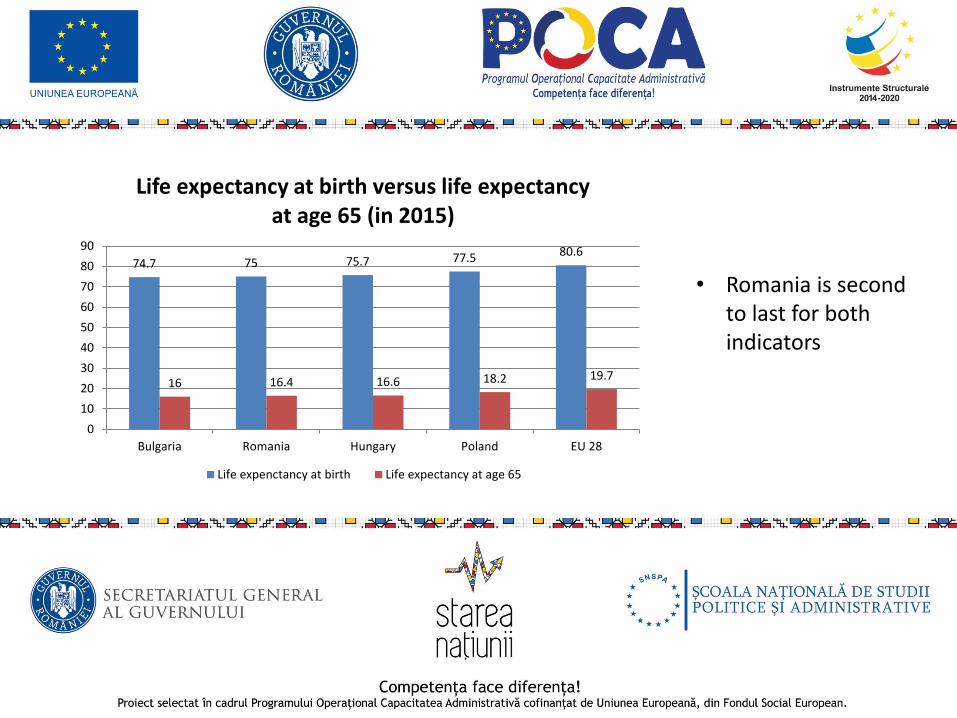
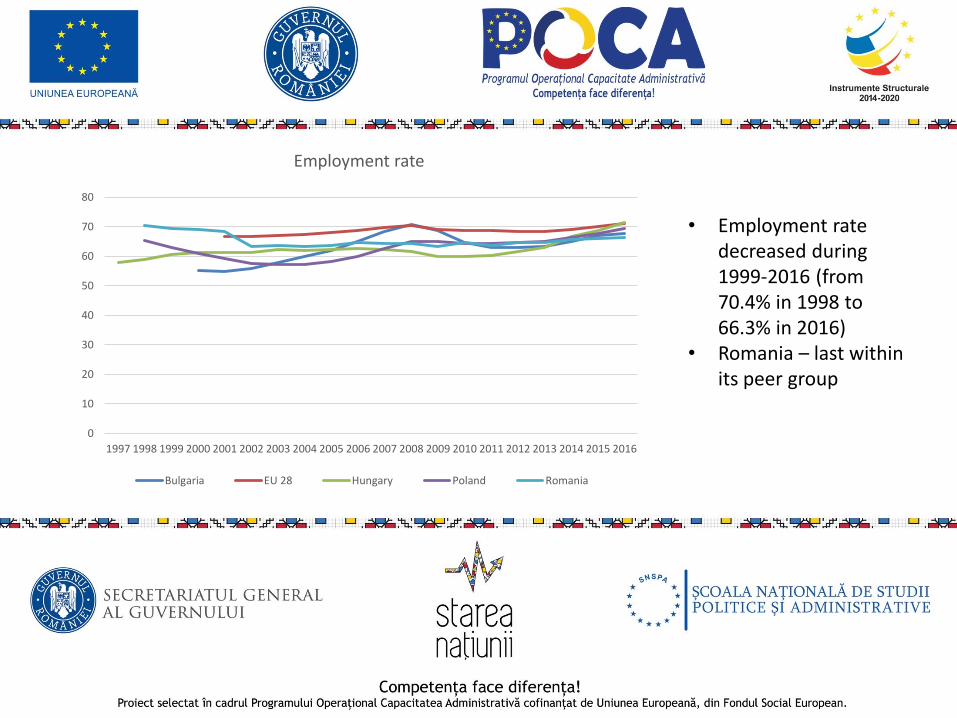
LIFE EXPECTANCY
• Romania is second to last for both indicators
74.7 75 75.7 77.5 80.6
16 16.4 16.6 18.2 19.7
0
10
20
30
40
50
60
70
80
90
Bulgaria Romania Hungary Poland EU 28
Life expectancy at birth versus life expectancy at age 65 (in 2015)
Life expenctancy at birth Life expectancy at age 65
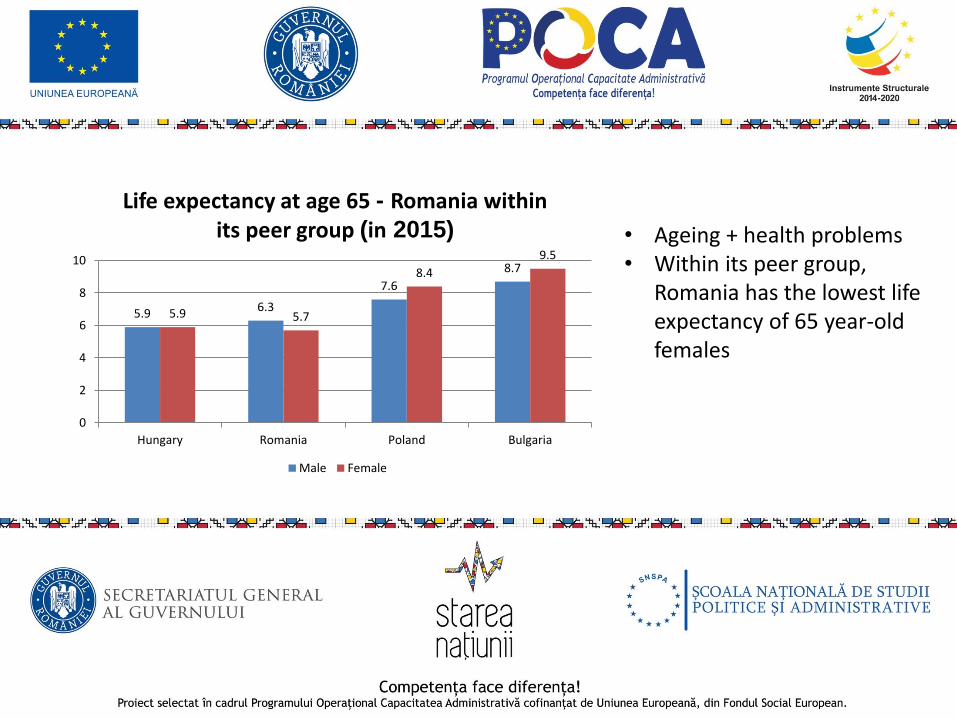
• Ageing + health problems • Within its peer group,
Romania has the lowest life expectancy of 65 year-old females
5.9 6.3
7.6
8.7
5.9 5.7
8.4
9.5
0
2
4
6
8
10
Hungary Romania Poland Bulgaria
Life expectancy at age 65 - Romania within its peer group (in 2015)
Male Female
INEQUALITY AND REGIONAL DISPARITIES
• Striking regional disparities• In 2015, the most
developed region (Bucuresti-Ifov) had a GDP per capita in PPS more than two times higher than the least developed region (North-East)
05,000
10,00015,00020,00025,00030,00035,00040,00045,000
An
The evolution of the GDP per capita (Purchasing Power Standards) at EU 28 level and within Romania (NUTS 2)
(2000-2015)
Nord-Vest Centru Nord-Est Sud-Est
Sud Muntenia Bucuresti-Ilfov S-V Oltenia Vest
Total Romania Total EU 28
• Romania has one the highest levels of income inequality in the EU (increase)
• The income of the richest 20% is 8 times higher than the income of the poorest 20%
8.1
7.06.5
6.1 6.26.6 6.8
7.2
8.3
7.27.06.5
5.9 5.9
6.56.1
6.6 6.87.1
7.9
5.3 5.1 5.0 5.0 5.0 4.9 4.9 4.9 4.9
3.7 3.6 3.5 3.43.9 4.0
4.3 4.3 4.3 4.3
0.0
1.0
2.0
3.0
4.0
5.0
6.0
7.0
8.0
9.0
2007 2008 2009 2010 2011 2012 2013 2014 2015 2016
Income inequality - the S80/S20 income share ratio
Romania Bulgaria Poland Hungary
EDUCATION AND RESEARCH
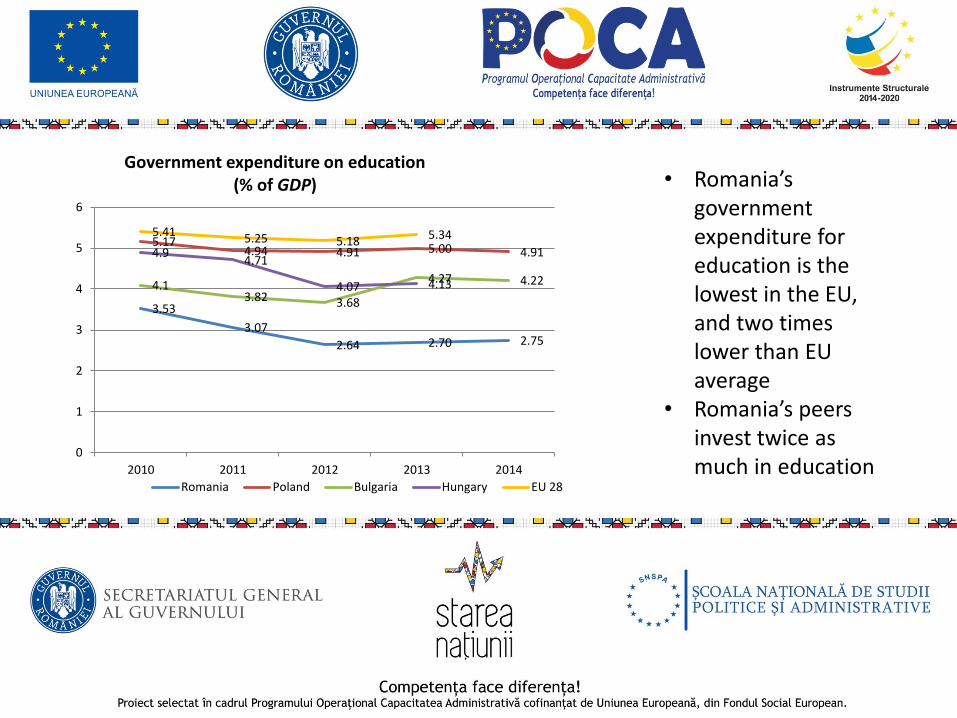
• Romania’s government expenditure for education is the lowest in the EU, and two times lower than EU average
• Romania’s peers invest twice as much in education
3.53
3.07
2.64 2.70 2.75
5.174.94 4.91 5.00 4.91
4.13.82 3.68
4.27 4.22
4.94.71
4.07 4.13
5.41 5.25 5.18 5.34
0
1
2
3
4
5
6
2010 2011 2012 2013 2014
Government expenditure on education(% of GDP)
Romania Poland Bulgaria Hungary EU 28
• 2016: 18,5% (increase)
• Five times higher in rural areas than in cities and urban areas
0
10
20
30
40
2012 2013 2014 2015 2016
Early leavers from education and training, by degree of urbanization
(2012-2016)
Cities
Towns and suburbs
Rural areas
• In 2015, Romania spent only 0,49% of the GDP on R&D
• The country’s performance levels in R&D are the lowest in within its peer group
0.00
0.50
1.00
1.50
2.00
2.50
2011 2012 2013 2014 2015
Gross domestic expenditure on R&D (GERD)% of GDP
EU 28 Hungary Poland Bulgaria Romania
AGRICULTURE
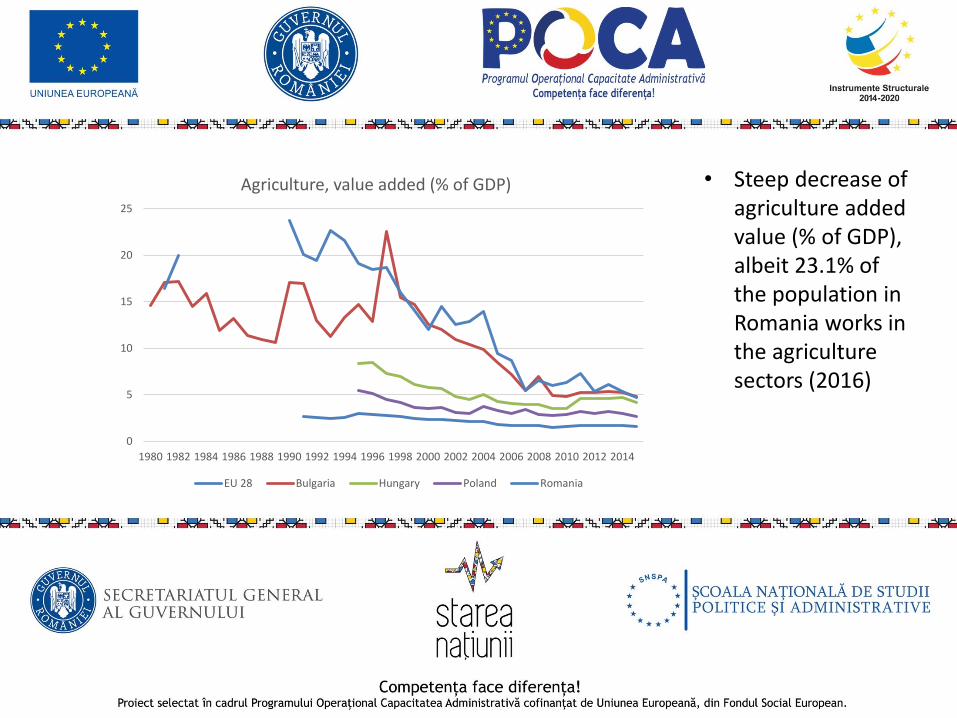
• Steep decrease of agriculture added value (% of GDP), albeit 23.1% of the population in Romania works in the agriculture sectors (2016)
• Purpose of the presentation: not to draw a grim picture of today’s Romania, but to underline, in an evidence-based manner) structural problems:• that are key to development (demography, debt, lack of
territorial cohesion, natural potential) • that have grown over time• and whose resolution requires medium to long term


![Vintilă Corbu - Dinastia Sunderland Beauclair - Idolii de aur vol.3 [1993]](https://static.documents.pub/doc/80x56/577ce62b1a28abf1039247a8/vintila-corbu-dinastia-sunderland-beauclair-idolii-de-aur-vol3-1993.jpg)
![Vintilă Corbu - Dinastia Sunderland Beauclair - Idolii de aur vol.2 [1993]](https://static.documents.pub/doc/80x56/577ce62b1a28abf1039247a1/vintila-corbu-dinastia-sunderland-beauclair-idolii-de-aur-vol2-1993.jpg)


