1 State of the State of the National Airspace Infrastructure National Airspace Infrastructure Jasenka Rakas NEXTOR University of California, Berkeley National Airspace System Performance Workshop Asilomar Conference Center Pacific Grove, CA March 14-17, 2006
Transcript
1
State of the State of the National Airspace Infrastructure National Airspace Infrastructure
Jasenka RakasNEXTOR
University of California, Berkeley
National Airspace System Performance WorkshopAsilomar Conference Center
Pacific Grove, CAMarch 14-17, 2006
2
• The United States accounts for approximately 30 percent of allcommercial aviation and 50 percent of all general aviation activity in the world.
• Prior to September 11, 2001 the NAS handled 1.9 million passengers traveling on 60,000 flights daily.
• NAS moves over 600 million passengers per year. Projected enplanements in year 2013 is over 900 million.
• NAS conducts over 26 million operations per year. Projected number of operations in 2013 is over 33 million.
Source: ACE 2002
Why Do We Need Reliable and ModernAviation Infrastructure?
3
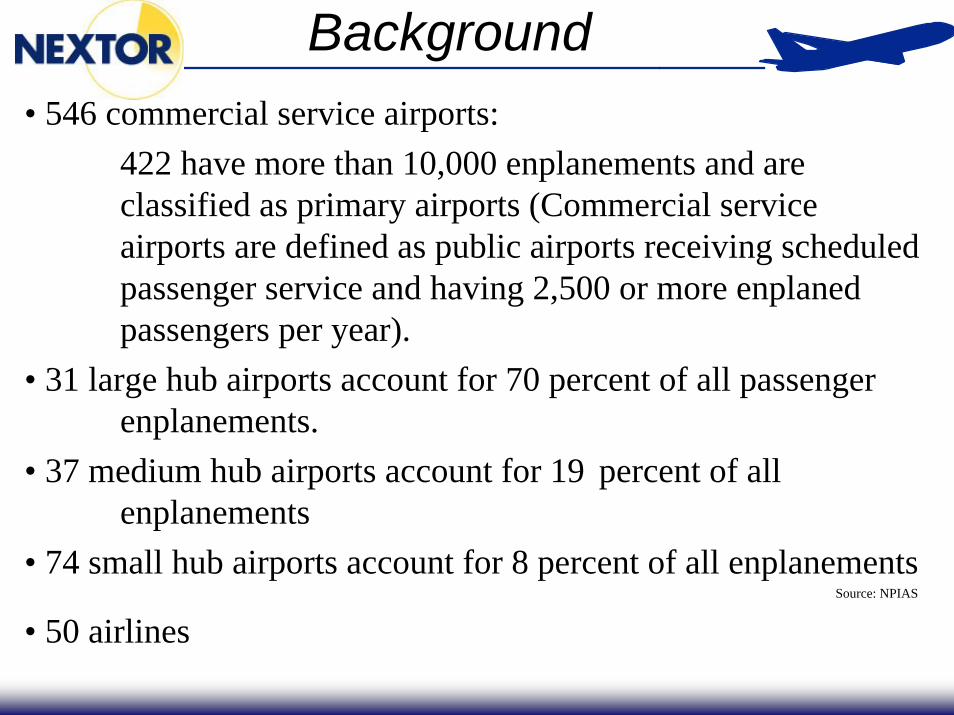
• 546 commercial service airports:422 have more than 10,000 enplanements and are classified as primary airports (Commercial service airports are defined as public airports receiving scheduled passenger service and having 2,500 or more enplaned passengers per year).
• 31 large hub airports account for 70 percent of all passenger enplanements.
• 37 medium hub airports account for 19 percent of all enplanements
• 74 small hub airports account for 8 percent of all enplanementsSource: NPIAS
• NAS has about 44,000 pieces of equipment and services that provide air traffic management (ATM) services. Source: http://www.faa.gov/ats/aaf/
• NAS’ large inventory of capital assets are in various stages of approaching physical or technical obsolescence.
Background
NAS Inventory
7
Background
Cause Code 60 (scheduled) and 80 (unscheduled) outages for ASR
0
100
200
300
400
500
600
1980 1985 1990 1995 2000 2005
Year
freq
uenc
y
6080
Frequencies of Scheduled (Cause Code 60) and Unscheduled Outages (Cause Code 80) for Airport Surveillance Radars (ASR)
Source: NAPRS data
8
Background
Frequency of Scheduled (Cause Code 60) and Unscheduled Outages (Cause Code 80) for Localizers (LOC)
Source: NAPRS data LOC 60 and 80 cause codes
0
1000
2000
3000
4000
5000
6000
1980 1985 1990 1995 2000 2005
year
freq
uenc
y
80 60
9
Background
Downtimes of Scheduled (Cause Code 60) and Unscheduled Outages (Cause Code 80) for Localizers (LOC)
Source: NAPRS dataplot of LOC 60 and 80 cause codes
0
5000
10000
15000
20000
25000
30000
35000
1980 1985 1990 1995 2000 2005
year
sum
of d
ownt
imes
8060
10
Background
Frequency of Scheduled (Cause Code 60) and Unscheduled Outages (Cause Code 80) for All NAPRS Equipment
Source: NAPRS data60 and 80 for all NAPRS equipment
0
10000
20000
30000
40000
50000
60000
1980 1985 1990 1995 2000 2005
year
freq
uenc
y
6080
11
Background
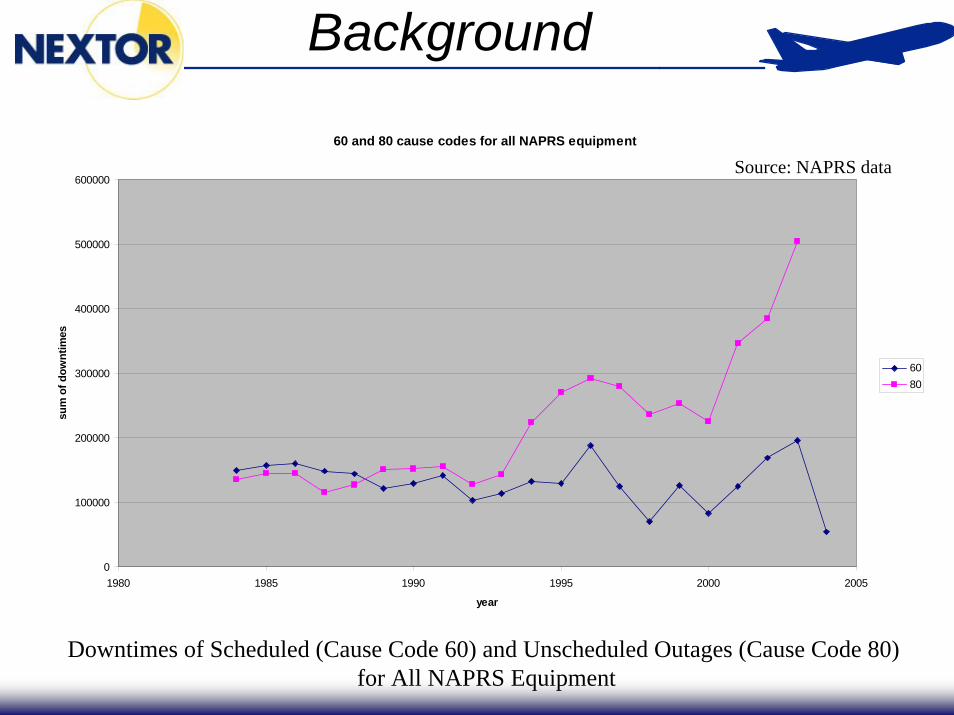
Downtimes of Scheduled (Cause Code 60) and Unscheduled Outages (Cause Code 80) for All NAPRS Equipment
Source: NAPRS data60 and 80 cause codes for all NAPRS equipment
0
100000
200000
300000
400000
500000
600000
1980 1985 1990 1995 2000 2005
year
sum
of d
ownt
imes
6080
12
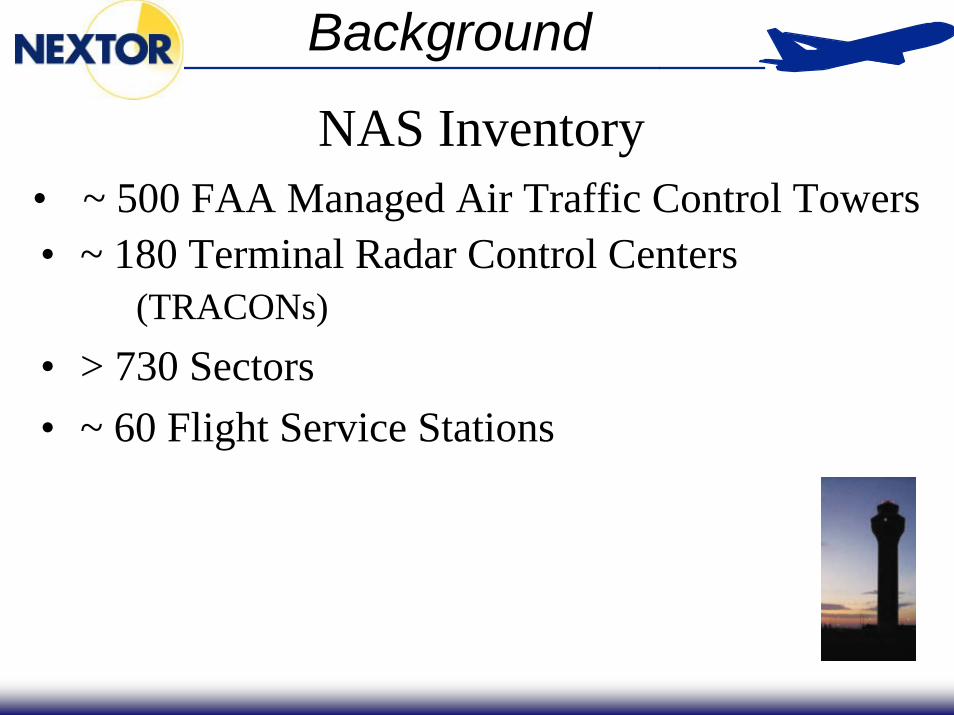
• ~ 180 Terminal Radar Control Centers (TRACONs)
• > 730 Sectors • ~ 60 Flight Service Stations
Background
NAS Inventory• ~ 500 FAA Managed Air Traffic Control Towers
13
• 20,000 – 25,000 administrative and mission supportcomputers
• 1,800 people to maintain and operate NAS software
• $100 million contract costs to maintain NAS software
Background
NAS Inventory
14
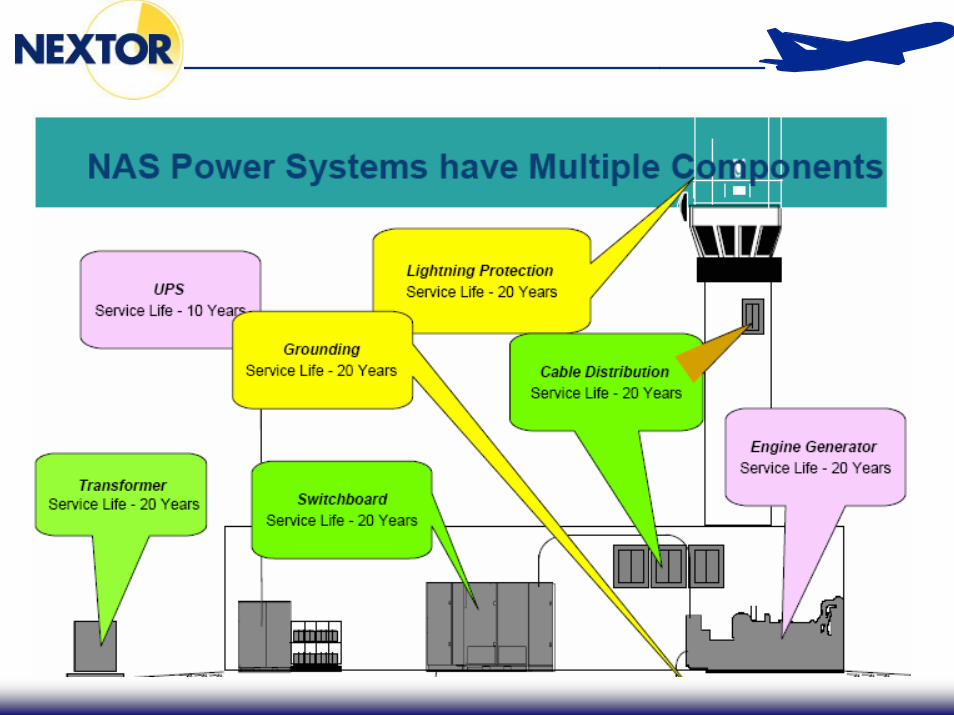
NAS building and building systems infrastructure is made up of:21 Air Route Traffic Control Centers (ARTCCs)3 Center Approach Control (CERAPs)1 Combined facility (ATC/TRACON/CERAP)519 Terminal facilities3 Automated Flight Services Stations (Alaska)14 Flight Service Stations (Alaska)9,000 General National Airspace unstaffed facilitiesPower systems
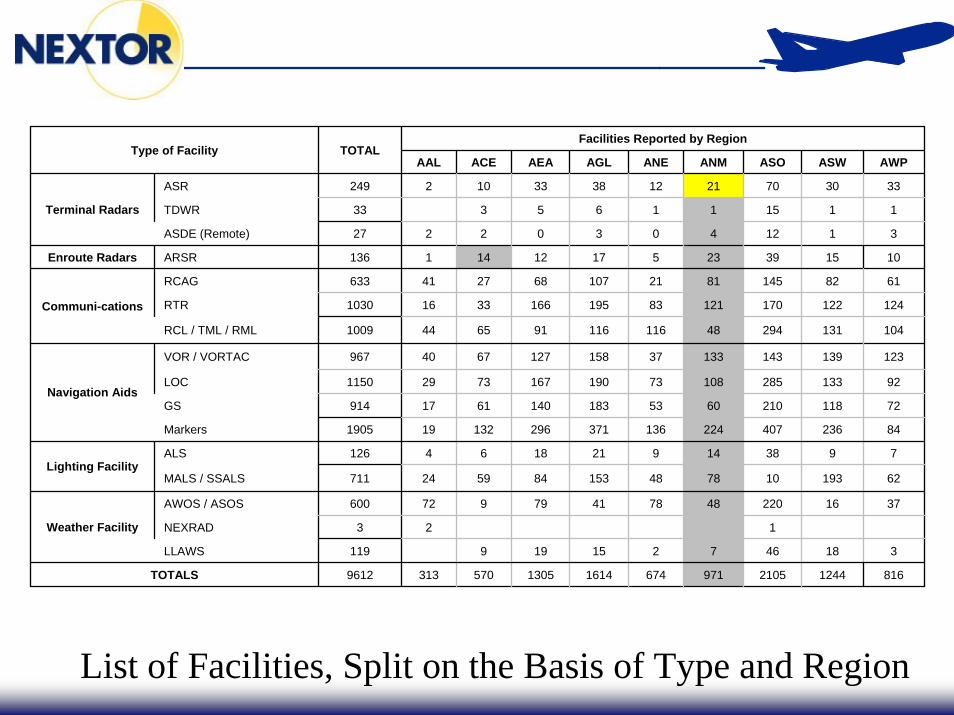
List of Facilities, Split on the Basis of Type and Region
17
Abbreviation Facility Type
TDWR Terminal Doppler Weather Radar
ASR Airport Surveillance Radar
ASDE Airport Surface Detection Equipment
ARSR Airport Route Surveillance Radar
RTR Remote Transmitter Receiver
RCL Radio Communication Link
RML Remote Microwave Link
TML Television Microwave Link
VOR VHF Omnidirectional Range
VORTAC VOR collected with TACAN
TACAN Tactical Aircraft Control and Navigation
LOC Localizer
ALS Approach Light System
MALS Medium Intensity Approach Lighting System
SSALS Simplified Short Approach Lighting System
AWOS Automated Weather Observation System
ASOS Automatic Surface Observing System
NEXRAD Next Generation Weather Radar
LLWAS Low Level Wind Shear Alert System
RCAG Remote Communication Air / Ground
GS Glide Slope
18
Each of 9 regions signifies different climactic conditions.
Adverse weather conditions vary a lot over the 9 different regions, including the large temperature changes in the Alaska region and strong winds in southern region.
Varied weather patterns result in different deterioration patterns among same types of facilities.
Conditions of the facilities vary.
NAS Regions
19
20
There are about 800 facilities (ATCTs, ARTCCs, or TRACONs) in the NAS, with the average age between 16 and 40 years. For example, average ages of specific facilities and equipment types are:
• The maintenance of individual equipment or systems supporting air traffic control of the NAS requires technicians trained in many disciplines deployed over the entire country.
• Maintenance workforce is managed out of a national network of cost centers.
• Each cost center has a limited number of technicians who are responsible for providing scheduled and unscheduled maintenance and repair for the equipment assigned to that center.
NAS Infrastructure Management
22
• Different types of equipment have different repair time characteristics.
• Technicians are trained to repair specific types of equipment.
• To date there is no centralized system for equipment maintenance.
BackgroundNAS Infrastructure Management
23
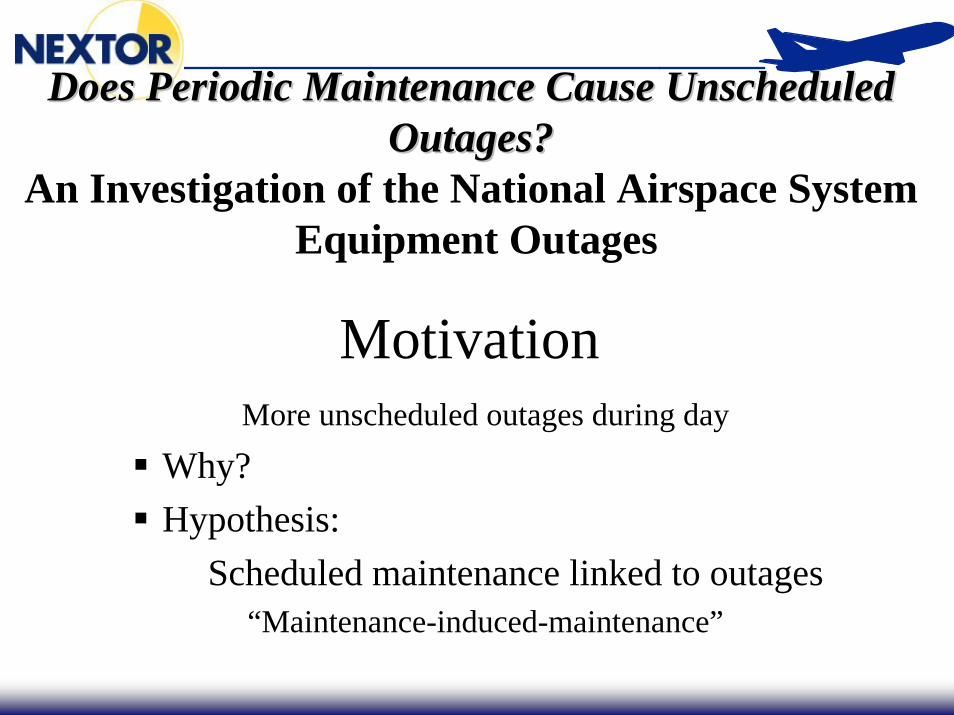
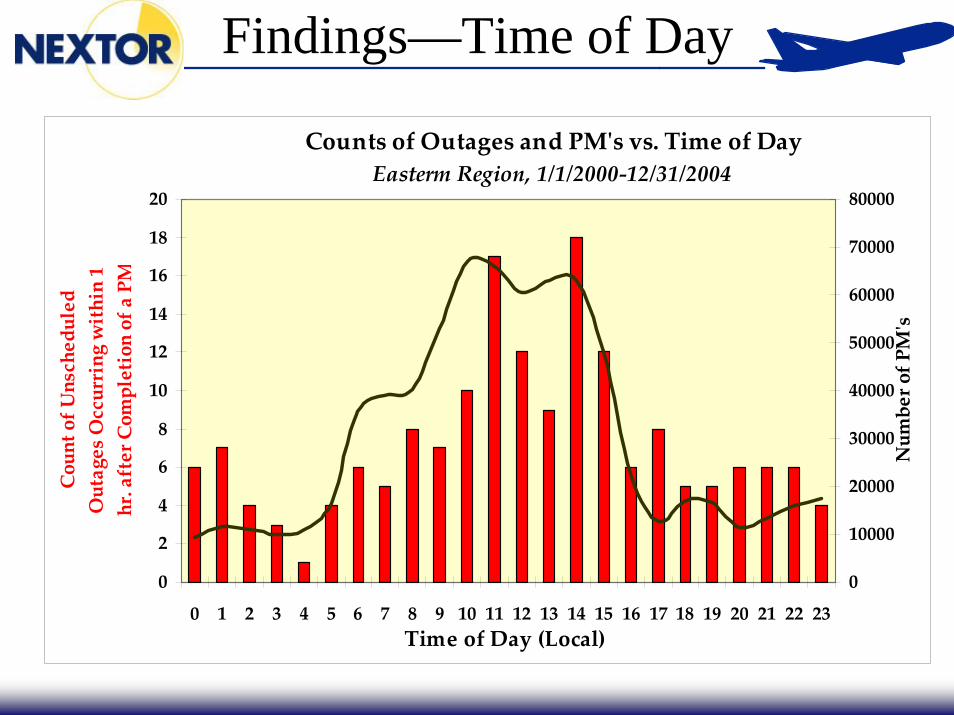
MotivationMore unscheduled outages during day
Why?Hypothesis:
Scheduled maintenance linked to outages“Maintenance-induced-maintenance”
Does Periodic Maintenance Cause Unscheduled Does Periodic Maintenance Cause Unscheduled Outages?Outages?
An Investigation of the National Airspace SystemEquipment Outages
24
EvidenceEvidence
Number of Unscheduled Equipment Outages and PMʹs vs. Time of Day
Note: Eastern Region includes: New York, New Jersey, Pennsylvania, West Virginia, Virginia, Maryland, Delaware, and DC
25
MethodsData from Maintenance Management SystemUnscheduled outages from:
1. Equipment failure or malfunction2. Unknown cause
Find time between each PM and next outage on given equipment
26
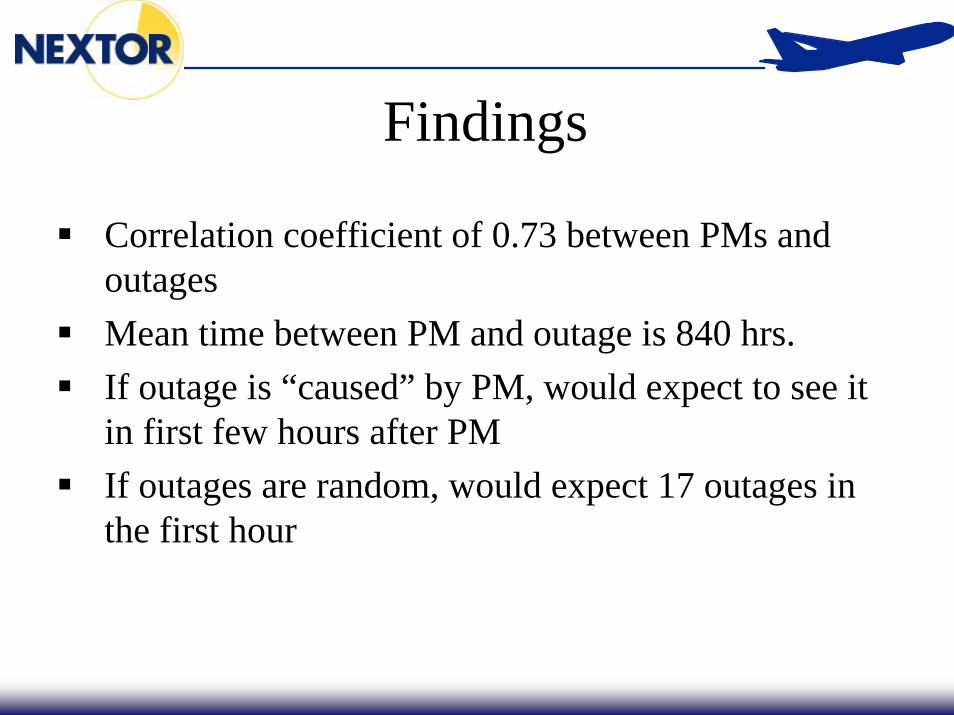
Findings
Correlation coefficient of 0.73 between PMs and outagesMean time between PM and outage is 840 hrs.If outage is “caused” by PM, would expect to see it in first few hours after PMIf outages are random, would expect 17 outages in the first hour
27
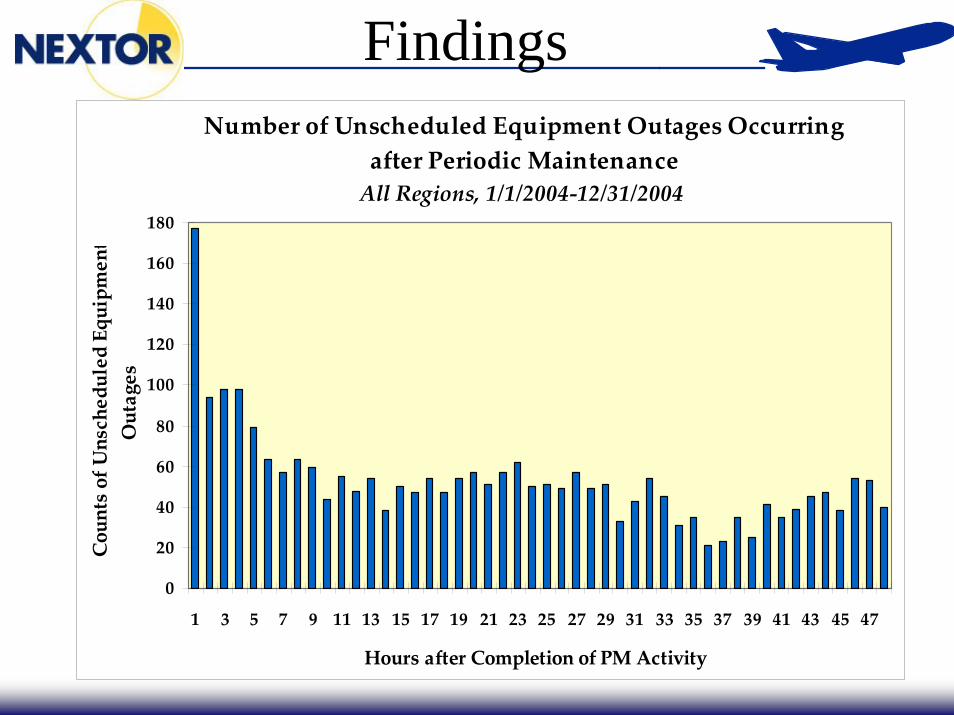
FindingsFindings
Number of Unscheduled Equipment Outages Occurring after Periodic MaintenanceAll Regions, 1/1/2004‐12/31/2004
• Maintenance-induced maintenance or secondary maintenanceoccurs, which is also common in industrial facilities.
• PM’s should be performed during time periods when the consequence of an outage is low, i.e., when there are low numbers of air traffic controllers, pilots, and aircraft relying on the equipment.
•The fact that some PM’s do cause unscheduled outages does not mean, however, that reducing the number of PM’s will necessarilydecrease the number of unscheduled outages.
31
Future WorkFuture Work
Differences across equipment types/locationsDelay-causing outages
Outages “of consequence”Balance between too many PMs and too few
32
33
34
35
36
37
38
39
40
41
42
43
44
45
46
47
48
49
SummaryInfrastructure is
critical to running the NASInfrastructure does
not get a lot of publicityIntroduce
maintenance optimization models that also consider the airport/airline side of the problemIntroduce
reliability-centered maintenance.
Cost Center Description:
StaffingSparingProbability distributions for equipment MTBFType of failureScheduled or unscheduledTravel TimeShift PoliciesAdministrative TimeTechnician Qualifications
Output Measures:
Technician UtilizationOutage Durations
ServiceAvailability
Module
Output measure:
Availabiltiy
Service Description:
Equipment making up a serviceRedundancy
Airport Model
Airport Characteristics:
Aircraft mixAircraft classSpeed% weather (VFR and IFR)Final Approach Path GeometryHolding PatternNumber of runwaysAircraft arrival demandSequencing ruleMile-in-trail separation matricesrunway ocupancy time