61
B&M Forum Market trends and product positioning

B&M ForumMarket trends and product
positioning

State of the European supplements industry
Speaker:
Claire Morton, Senior Industry Analyst, Nutrition Business Journal, New Hope Network, US

Source: Nutrition Business Journal (2017 preliminary estimates; $mil, consumer sales)
State of the European Supplement IndustryVitafoods Europe 2018
Claire MortonSenior Industry Analyst, Nutrition Business Journal
New Hope Network | Informa Global Health & Nutrition Network

Source: Nutrition Business Journal (2017 preliminary estimates; $mil, consumer sales)
Annual global supplement sales hit $129 billion in 2017
128,933
0%
1%
2%
3%
4%
5%
6%
7%
8%
$0
$20,000
$40,000
$60,000
$80,000
$100,000
$120,000
$140,000
$160,000
$180,000
2006 2007 2008 2009 2010 2011 2012 2013 2014 2015 2016 2017e 2018e 2019e 2020e

Source: Nutrition Business Journal (2017 preliminary estimates; $mil, consumer sales)
U.S. maintains highest market share with over one-third
of global supplement sales
United States34.1%
China14.3%
Western Europe13.4%
Eastern Europe and Russia5.4%
Other Asian Countries10.6%
Japan9.1% Latin America
7.3%
Australia/New Zealand2.2%
Canada1.6%
Middle East1.1%
Africa0.9%

Source: Nutrition Business Journal (2017 preliminary estimates; $mil, consumer sales)
U.S. maintains highest market share with over one-third
of global supplement sales
United States34.1%
China14.3%
Western Europe13.4%
Eastern Europe and Russia
5.4%
Other Asian Countries10.6%
Japan9.1% Latin America
7.3%
Australia/New Zealand2.2%
Canada1.6%
Middle East1.1%
Africa0.9%

Source: Nutrition Business Journal (2017 preliminary estimates; $mil, consumer sales)
2017 European supplement market overview – growth
reaches 5.1% with sales at $23.8B
-1%
0%
1%
2%
3%
4%
5%
6%
-
5,000
10,000
15,000
20,000
25,000
30,000
2013 2014 2015 2016 2017e 2018e 2019e 2020e
Supplement Sales and Growth Supplement Market Share, 2017e
Vitamins &Minerals
Herbs &Botanicals
Sports, Meal,Homeopathic &Specialty

Source: Nutrition Business Journal (2017 preliminary estimates; $mil, consumer sales)
European GDP echoes trend in supplement sales
-20%
-15%
-10%
-5%
0%
5%
17,000
18,000
19,000
20,000
21,000
22,000
23,000
2011 2012 2013 2014 2015 2016 2017e 2018e 2019e 2020e

Source: Nutrition Business Journal (2017 preliminary estimates; $mil, consumer sales)
Regulatory environment in Europe limits health claims
2012:222 Functional Health
Claims initially approved by EFSA
2012-2017:48 New Functional Health ClaimsReceived by EFSA13 Withdrawn27 Opinions
2015:Most recent positive opinion from EFSA
Source: Nutrition Business Journal (2017 preliminary estimates; $mil, consumer sales)
Safety
Science
Trust
Clean Label
Source: Nutrition Business Journal (2017 preliminary estimates; $mil, consumer sales)
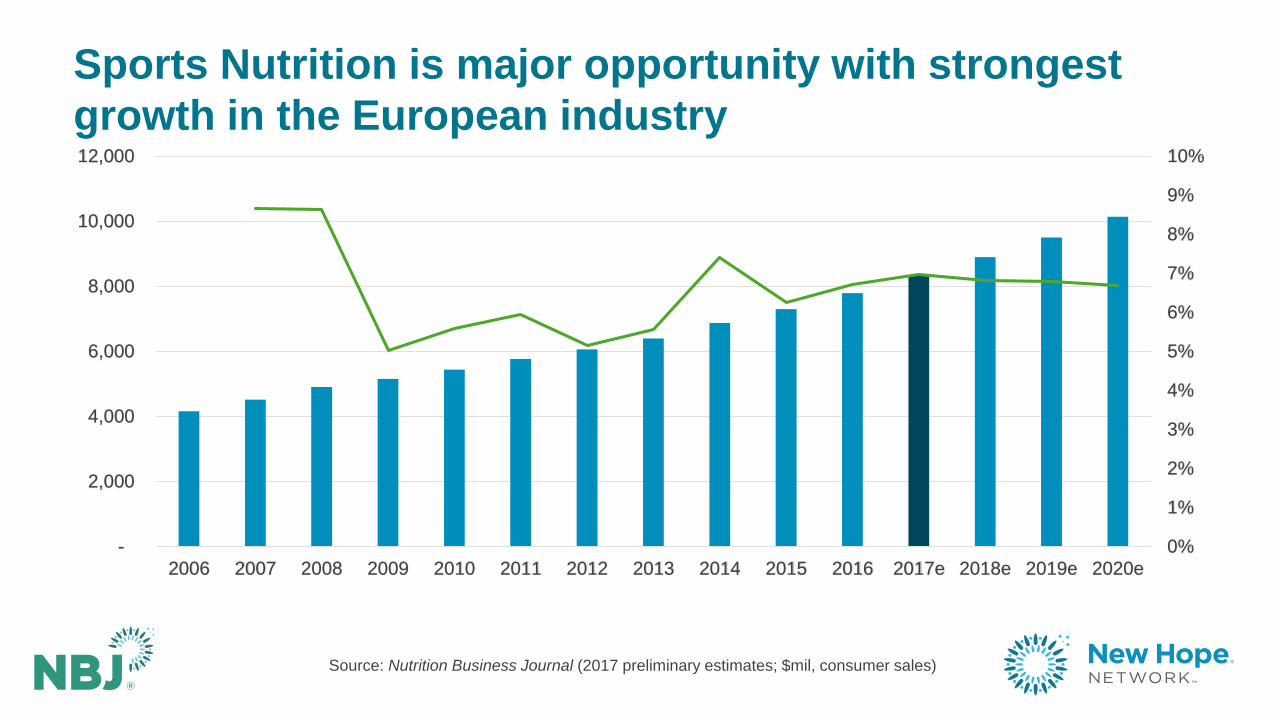
Sports Nutrition is major opportunity with strongest
growth in the European industry
0%
1%
2%
3%
4%
5%
6%
7%
8%
9%
10%
-
2,000
4,000
6,000
8,000
10,000
12,000
2006 2007 2008 2009 2010 2011 2012 2013 2014 2015 2016 2017e 2018e 2019e 2020e

Source: Nutrition Business Journal (2017 preliminary estimates; $mil, consumer sales)
2017 Western European supplement market overview –
growth recovers to 3.1% reaching $16.6B
Supplement Sales and Growth Supplement Market Share, 2017e
-4%
-3%
-2%
-1%
0%
1%
2%
3%
4%
5%
14,500
15,000
15,500
16,000
16,500
17,000
17,500
18,000
18,500
2013 2014 2015 2016 2017e 2018e 2019e 2020e
Vitamins &Minerals
Herbs &Botanicals
Sports, Meal,Homeopathic &Specialty

Source: Nutrition Business Journal (2017 preliminary estimates; $mil, consumer sales)
2017 Eastern European supplement market overview –
growth remains steady at 10.0% reaching $7.2B
Supplement Sales and Growth Supplement Market Share, 2017e
0%
2%
4%
6%
8%
10%
12%
-
1,000
2,000
3,000
4,000
5,000
6,000
7,000
8,000
9,000
10,000
2013 2014 2015 2016 2017e 2018e 2019e 2020e
Vitamins &Minerals
Herbs &Botanicals
Sports, Meal,Homeopathic &Specialty

Source: Nutrition Business Journal (2017 preliminary estimates; $mil, consumer sales)
France: 2017 sales projections reach $2.3 billion with
recovering growth of 4%
-5%
-4%
-3%
-2%
-1%
0%
1%
2%
3%
4%
5%
6%
$1,800
$1,900
$2,000
$2,100
$2,200
$2,300
$2,400
$2,500
$2,600
2006 2007 2008 2009 2010 2011 2012 2013 2014 2015 2016 2017e 2018e 2019e 2020e

Source: Nutrition Business Journal (2017 preliminary estimates; $mil, consumer sales)
Germany: 2017 sales projections reach $4.0 billion with
recovering growth of 2%
-8%
-6%
-4%
-2%
0%
2%
4%
$3,800
$3,900
$4,000
$4,100
$4,200
$4,300
$4,400
$4,500
2006 2007 2008 2009 2010 2011 2012 2013 2014 2015 2016 2017e 2018e 2019e 2020e

Source: Nutrition Business Journal (2017 preliminary estimates; $mil, consumer sales)
Italy: 2017 sales projections reach $1.8 billion with
recovering growth of 5%
-4%
-2%
0%
2%
4%
6%
8%
10%
$0
$500
$1,000
$1,500
$2,000
$2,500
2006 2007 2008 2009 2010 2011 2012 2013 2014 2015 2016 2017e 2018e 2019e 2020e

Source: Nutrition Business Journal (2017 preliminary estimates; $mil, consumer sales)
Scandinavia: 2017 sales projections reach $1.5 billion
with recovering growth of 3%
-6%
-4%
-2%
0%
2%
4%
6%
8%
$0
$200
$400
$600
$800
$1,000
$1,200
$1,400
$1,600
$1,800
2006 2007 2008 2009 2010 2011 2012 2013 2014 2015 2016 2017e 2018e 2019e 2020e

Source: Nutrition Business Journal (2017 preliminary estimates; $mil, consumer sales)
United Kingdom sales stronger than other W. Europe
countries, in part due to benefit of exchange rate
0%
1%
2%
3%
4%
5%
6%
7%
8%
$0
$500
$1,000
$1,500
$2,000
$2,500
$3,000
2006 2007 2008 2009 2010 2011 2012 2013 2014 2015 2016 2017e 2018e 2019e 2020e

Source: Nutrition Business Journal (2017 preliminary estimates; $mil, consumer sales)
Changing retail landscape

Source: Nutrition Business Journal (2017 preliminary estimates; $mil, consumer sales)
E-Commerce – Third Party
E-Commerce – Company Website
Natural
Dietary Supplement
Specialty
Top five channels by 2017 growth
Survey of Branded Supplement Manufacturers
1
2
3
4
5
1
2
3
4
Source: New Hope Network survey conducted Q1 2018 (N=136)

Source: Nutrition Business Journal (2017 preliminary estimates; $mil, consumer sales)Source: New Hope Network survey conducted Q1 2018 (N=155), All Manufacturer Results
Question: How would you rate the importance of each channel over the next five years?
35% of surveyed branded supplement manufacturers think
brick and mortar will not be at all important in 5 years
Not at all important Not very important Neutral Somewhat important Very important
0% 10% 20% 30% 40% 50% 60% 70% 80% 90% 100%
E-Commerce
Brick and Mortar

Using social media to turn consumer anecdotes into evidence
Speaker:
Peter Brady, CEO and Founder, Orbital Media, UK

Source: Nutrition Business Journal (2017 preliminary estimates; $mil, consumer sales)Orbital Media is a registered trade mark of Orbital Media and Advertising Ltd. Trade mark number: UK00003191130.

Source: Nutrition Business Journal (2017 preliminary estimates; $mil, consumer sales)
Peter Brady
CEO of Orbital Media
The uk’s most innovative digital agency
Presenter

Source: Nutrition Business Journal (2017 preliminary estimates; $mil, consumer sales)
Where a historic RCT has taken place and there is a desire or need to refresh, strengthen and generate new claims, a RWE study is a great, cost effective alternative to a new RCT
RWE BACKGROUND

Source: Nutrition Business Journal (2017 preliminary estimates; $mil, consumer sales)
Traditionally RWE is undertaken via observational studies using medical records & patient surveys
RWE BACKGROUND

Source: Nutrition Business Journal (2017 preliminary estimates; $mil, consumer sales)
Structured snapshot of real user, patient / consumer experience
RWE BACKGROUND

Source: Nutrition Business Journal (2017 preliminary estimates; $mil, consumer sales)
Increasingly accepted as adjunct or alternative to new RCTs in context of Over The Counter (OTC) licensed medicines and in principle, believed to be acceptable to European Food Standards Agency
(EFSA)
Can also supply invaluable and credible supporting evidence forfunctional food and nutraceuticals
RWE BACKGROUND
Source: Nutrition Business Journal (2017 preliminary estimates; $mil, consumer sales)
RWE results are more easily understood by healthcare users&
RCT exclusions are avoided
RWE BACKGROUND

Source: Nutrition Business Journal (2017 preliminary estimates; $mil, consumer sales)
PRODUCT CLAIM Problem:
How does a product acquire up-to-
Date evidence that supports
Differentiating claims?

Source: Nutrition Business Journal (2017 preliminary estimates; $mil, consumer sales)
Old or creaky evidence
Typical Claim problems...

Source: Nutrition Business Journal (2017 preliminary estimates; $mil, consumer sales)
No differentiation between brands using same active ingredient
Typical Claim problems...
Source: Nutrition Business Journal (2017 preliminary estimates; $mil, consumer sales)
Industry and regulatory organisations require evidence for claims. In the UK Proprietary Association of Great Britain (PAGB), Medicines & Health products Regulatory Agency (MHRA) and Advertising Standards Authority (ASA)
Typical Claim problems...

Source: Nutrition Business Journal (2017 preliminary estimates; $mil, consumer sales)
Significant risks associated with securing or strengthening claims via RCT:
1. BUDGET
2. TIME
3. RESULTS PUBLISHED
Typical Claim problems...

Source: Nutrition Business Journal (2017 preliminary estimates; $mil, consumer sales)
PRODUCT CLAIMs SOLUTION:
a brand new rwe process, using digital &
social media To recruit users into large-scale
studies, That could lead to New or
STRENGTHENED claims

Source: Nutrition Business Journal (2017 preliminary estimates; $mil, consumer sales)
RWE via digital & social media has been developed collaboratively over the last 2 years byOrbital Media and Dr Martin Goldman
It is an award winning, multi peer reviewed methodology, with a 100% success rate
Origins of the solution

Source: Nutrition Business Journal (2017 preliminary estimates; $mil, consumer sales)
Solution process - phase 1
1. Back to basics: what claims do we want to make and
why?
2. What would a peer-review process
demand?

Source: Nutrition Business Journal (2017 preliminary estimates; $mil, consumer sales)
Solution process - phase 2
1. Back to basics:
what claims do
we want to make
and why?
2. What would a
peer-review
process demand?
3. Recruitment strategy via digital,
social media & customer databases
4. Expert designed study using
validated outcome measures

Source: Nutrition Business Journal (2017 preliminary estimates; $mil, consumer sales)
Solution process - phase 3
5. Translate study on to optimised digital
platform
6. Pilot and launch within digital &
social media

Source: Nutrition Business Journal (2017 preliminary estimates; $mil, consumer sales)
Solution process - phase 4
7. Report for brand owner
8. Peer review & publication

Source: Nutrition Business Journal (2017 preliminary estimates; $mil, consumer sales)
Solution process - phase 5
New claimssecured
Proven with OTC licensed medicines in the UK,
with pipeline projects pending in functional food & other categories

Source: Nutrition Business Journal (2017 preliminary estimates; $mil, consumer sales)
Current position
X2 projects completed within the OTC licensed medicine category
X1 project completed in the functional food category, with results and academic study pending for submission into medical journals
Currently, no reason to believe that this methodology will be treated any differently within the context of functional foods by EFSA
Case study background

Source: Nutrition Business Journal (2017 preliminary estimates; $mil, consumer sales)
Solution - case study 1
Sudocrem Antiseptic healing cream
86 year old brand with grandfather license
Poor evidence base, and none to support ‘healing’: no promotion of healing permitted
Last published evidence in 1988, with less than 100 patients
Promotional claims regularly challenged
Source: Nutrition Business Journal (2017 preliminary estimates; $mil, consumer sales)
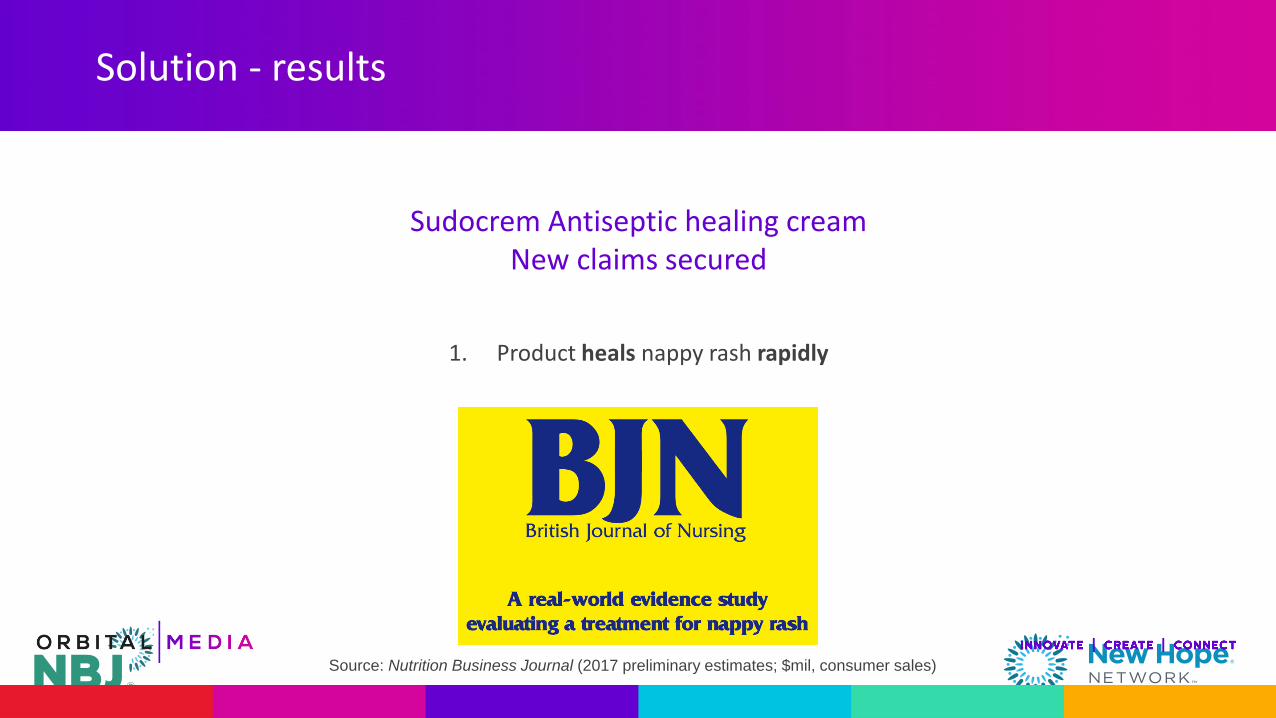
Solution - results
Sudocrem Antiseptic healing creamNew claims secured
1. Product heals nappy rash rapidly

Source: Nutrition Business Journal (2017 preliminary estimates; $mil, consumer sales)
Solution - results
Sudocrem Antiseptic healing creamNew claims secured
2. Anti-inflammatory action

Source: Nutrition Business Journal (2017 preliminary estimates; $mil, consumer sales)
Solution - results
Sudocrem Antiseptic healing creamNew claims secured
3. Reduces redness, swelling, pain and heat of nappy rash within 24 hours

Source: Nutrition Business Journal (2017 preliminary estimates; $mil, consumer sales)
Solution - case study 2
infacol
Limited and controversial evidence
Colic poorly understood condition
Promotional claims regularly challenged

Source: Nutrition Business Journal (2017 preliminary estimates; $mil, consumer sales)
Solution - results
InfacolNew claims secured
1. Infacol reduces or resolves symptoms in 9 out of 10 colicky babies

Source: Nutrition Business Journal (2017 preliminary estimates; $mil, consumer sales)
Solution - results
InfacolNew claims secured
2. Most users report improvement to symptoms on the first day of use

Source: Nutrition Business Journal (2017 preliminary estimates; $mil, consumer sales)
Solution - results
InfacolNew claims secured
3. Most users report results within 2 hours

Source: Nutrition Business Journal (2017 preliminary estimates; $mil, consumer sales)
Solution - results
InfacolNew claims secured
4. 9 out of 10 users report reduced crying in colicky babies

Source: Nutrition Business Journal (2017 preliminary estimates; $mil, consumer sales)
limitations
Not used (so far) to amend or change Summary of Product Characteristics (SmPC) or Marketing Authorisation (MA) for a licensed medicine
Used to only interpret and bolster
Not currently a full substitute for RCTs
Limitations of rwe via digital & social

Source: Nutrition Business Journal (2017 preliminary estimates; $mil, consumer sales)
strengths
Very low cost compared to RCT
Strengths of rwe via digital & social

Source: Nutrition Business Journal (2017 preliminary estimates; $mil, consumer sales)
strengths
Large numbers of product users completing each study:
2159 study completions for Sudocrem
4004 study completions for Infacol
Our latest RWE projects are showing over 6,000 study completions
Strengths of rwe via digital & social

Source: Nutrition Business Journal (2017 preliminary estimates; $mil, consumer sales)
strengths
Study promotion and recruitment via digital and social media can promote brand engagement, awareness and sales growth
Strengths of rwe via digital & social

Source: Nutrition Business Journal (2017 preliminary estimates; $mil, consumer sales)
strengths
Study recruitment is typically rapid 4 – 6 weeks
Strengths of rwe via digital & social

Source: Nutrition Business Journal (2017 preliminary estimates; $mil, consumer sales)
strengths
Reinvigorates the story a brand has to tell
Can boost marketing capability / sales long into the future
Strengths of rwe via digital & social
Source: Nutrition Business Journal (2017 preliminary estimates; $mil, consumer sales)
strengths
New claims supported by regulatory and industry bodies in the UK:- MHRA/PAGB
Exploring with European Food Standards Authority (EFSA)
Strengths of rwe via digital & social

Source: Nutrition Business Journal (2017 preliminary estimates; $mil, consumer sales)
Industry changing methodologythat could, over ten years, add £1 billion in value to the nutraceutical & functional food industry via:
• Reduced claim costs
• Enhanced marketing capability
• Additional sales
conclusion

Source: Nutrition Business Journal (2017 preliminary estimates; $mil, consumer sales)
That’s all folks!

B&M ForumMarket trends and product
positioning


