24
1 1 STATE POINT STATE POINT ANALYSIS ANALYSIS WesTech Engineering, Inc. WesTech Engineering, Inc. Salt Lake City, Utah, USA Salt Lake City, Utah, USA

11
STATE POINTSTATE POINTANALYSISANALYSIS
WesTech Engineering, Inc.WesTech Engineering, Inc.Salt Lake City, Utah, USASalt Lake City, Utah, USA

22
Simplified Activated Simplified Activated Sludge Flow SheetSludge Flow Sheet
Q + RAS Q
WAS
Q
RAS
Aeration Basin Clarifier
State Point Analysis

33
Key Parameters used in Key Parameters used in State Point AnalysisState Point Analysis
Factor / Parameter SymbolInfluent flow rateInfluent flow rate QQReturn activated sludge flow rateReturn activated sludge flow rate RASRASMixed liquor concentrationMixed liquor concentration XXmlssmlss
Sludge settling characteristicsSludge settling characteristics VVoo, k, kClarifier surface areaClarifier surface area AA

44
State Point DiagramState Point Diagram
8.07.06.05.04.03.02.01.00.0
0 2 4 6 8 10 12 14 16 18 20X, g/l
G, K
g/m
2-hr
Solids Concentration Axis
Solids Flux Axis

55
What is Solids Flux?What is Solids Flux?
Solids flux is the movementof solids through a clarifier
Solids Flux = mass per unit area per unit time
kg / m2 - hr
Solids Loading Rate (SLR) is one type of solids flux

66
State Point DiagramState Point DiagramWe will plot three elements
8.07.06.05.04.03.02.01.00.0
0 2 4 6 8 10 12 14 16 18 20X, g/l
G, K
g/m
2-hr
- Underflow rate line- Settling flux curve
- Overflow rate line

77
State Point DiagramState Point Diagram
8.07.06.05.04.03.02.01.00.0
0 2 4 6 8 10 12 14 16 18 20X, g/l
G, K
g/m
2-hr Overflow rate line
Slope = SOR = Q/A

88
State Point DiagramState Point Diagram
8.07.06.05.04.03.02.01.00.0
0 2 4 6 8 10 12 14 16 18 20X, g/l
G, K
g/m
2-hr
Underflow rate line
Slope = SUR = RAS/A
Solids loading rateXmlss(Q+RAS)
AState Point
mlssconcentration
Expected underflow conc.

99
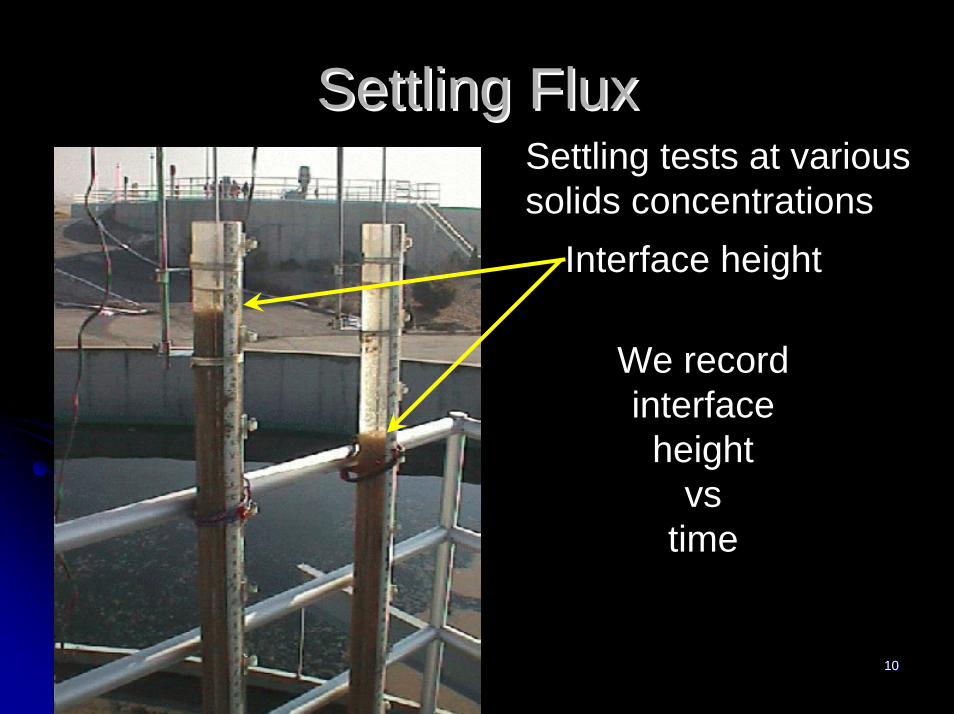
Settling FluxSettling Flux
Settling Flux, Gs = X Vs
Where: X = Solids concentration
Vs = Settling velocity at that concentration
Determine Vs with settling tests
1010
Settling FluxSettling Flux
Interface height
We record interface height
vs time
Settling tests at various solids concentrations
1111
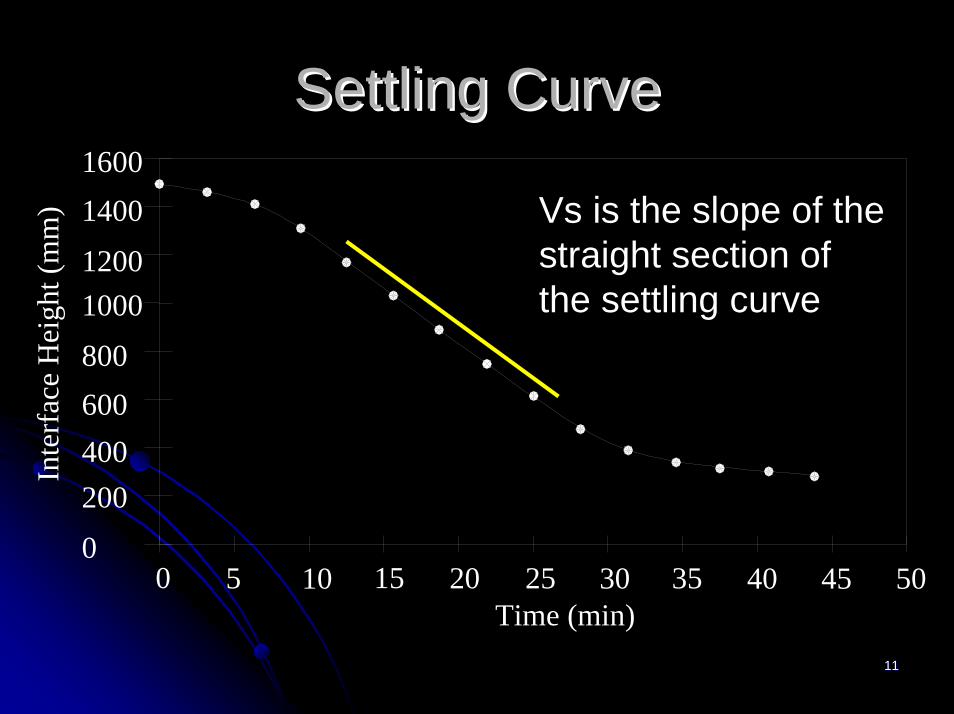
Settling CurveSettling Curve
Time (min)
Inte
rfac
e H
eigh
t (m
m)
600
00 5
200400
1510 20
1200
800
1000
14001600
503025 35 4540
Vs is the slope of the straight section of the settling curve
1212
Settling FluxSettling Flux
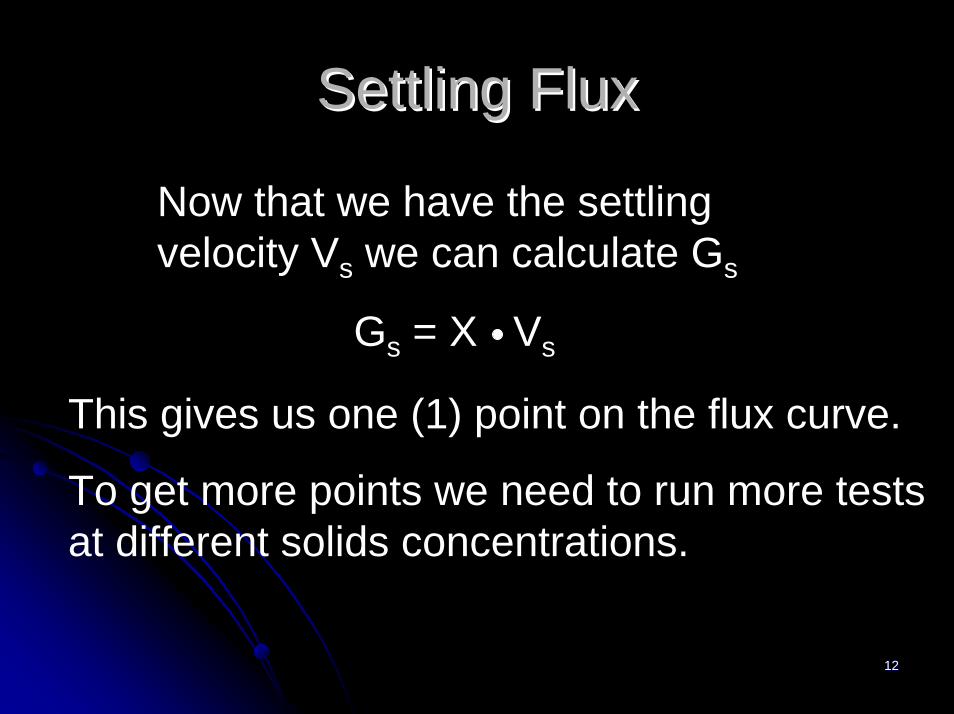
Now that we have the settling velocity Vs we can calculate Gs
Gs = X Vs
This gives us one (1) point on the flux curve.
To get more points we need to run more tests at different solids concentrations.

1313
Settling FluxSettling FluxFor most activated sludge there exists the following relationship
Vs = Vo e-kX
Substitution givesGs = X Vo e-kX
With a few settling tests we can solve for Vo and k and define the whole flux curve.

1414
VeslundVeslund RelationshipRelationship
X, g/l
lnV
s
-0.5
-2.00.0
-1.5-1.0
1.0 2.0
1.0
0.00.5
1.52.0
5.03.0 4.0
Vo = y intercept k = line slope

1515
State Point DiagramState Point Diagram
8.07.06.05.04.03.02.01.00.0
0 2 4 6 8 10 12 14 16 18 20X, g/l
G, K
g/m
2-hr Now we plot the
three elements together to form the State Point Diagram

1616
Thickening FailureThickening Failure
8.07.06.05.04.03.02.01.00.0
0 2 4 6 8 10 12 14 16 18 20X, g/l
G, K
g/m
2-hr Thickening failure

1717
Inventory ShiftInventory Shift
8.07.06.05.04.03.02.01.00.0
0 2 4 6 8 10 12 14 16 18 20X, g/l
G, K
g/m
2-hr
21

1818
Clarification FailureClarification Failure
8.07.06.05.04.03.02.01.00.0
0 2 4 6 8 10 12 14 16 18 20X, g/l
G, K
g/m
2-hr Clarification failure

1919
Flow IncreaseFlow Increase
8.07.06.05.04.03.02.01.00.0
0 2 4 6 8 10 12 14 16 18 20X, g/l
G, K
g/m
2-hr Overflow line gets steeper
State point moves up

2020
Change Settling PropertiesChange Settling Properties
8.07.06.05.04.03.02.01.00.0
0 2 4 6 8 10 12 14 16 18 20X, g/l
G, K
g/m
2-hr

2121
Optimizing RAS RateOptimizing RAS Rate
8.07.06.05.04.03.02.01.00.0
0 2 4 6 8 10 12 14 16 18 20X, g/l
G, K
g/m
2-hr
RAS rate too high
Underflow conc. too low

2222
Optimizing RAS RateOptimizing RAS Rate
8.07.06.05.04.03.02.01.00.0
0 2 4 6 8 10 12 14 16 18 20X, g/l
G, K
g/m
2-hr
Lower RAS pumping, higher RAS concentration

2323
State Point AnalysisState Point Analysis
8.07.06.05.04.03.02.01.00.0
0 2 4 6 8 10 12 14 16 18 20X, g/l
G, K
g/m
2-hr State Point Analysis is a useful
tool for both designers and operators to graphically understand the dynamics of an activated sludge clarifier.

2424
State Point AnalysisState Point Analysis
Questions ?
![[Elearnica.ir]-Bacterial Foraging Optimization Algorithm Theoretical Foundations Analysi](https://static.documents.pub/doc/80x56/55cf8aaa55034654898cc30c/elearnicair-bacterial-foraging-optimization-algorithm-theoretical-foundations.jpg)


