STATE REVIEW FRAMEWORK Alabama Clean Water Act, Clean Air Act, and Resource Conservation and Recovery Act Implementation in Federal Fiscal Year 2012 U.S. Environmental Protection Agency Region 4, Atlanta Final Report March 31, 2014
Transcript
STATE REVIEW FRAMEWORK
Alabama
Clean Water Act, Clean Air Act, and
Resource Conservation and Recovery Act
Implementation in Federal Fiscal Year 2012
U.S. Environmental Protection Agency
Region 4, Atlanta
Final Report March 31, 2014
SRF Executive Summary
Introduction
State Review Framework (SRF) oversight reviews of the Alabama Department of Environmental
Management were conducted in April and May 2013 by EPA Region 4 permitting and
enforcement staff.
The Clean Water Act National Pollutant Discharge Elimination System (CWA-NPDES) program
was reviewed under both SRF and Permit Quality Review (PQR) protocols. The Clean Air Act
(CAA) Stationary Source and Resource Conservation and Recovery Act (RCRA) Subtitle C
programs were reviewed only under SRF.
SRF findings are based on file metrics derived from file reviews, data metrics, and conversations
with program staff. PQR findings, which are not a part of this report and will be finalized at a
later date, are based on reviews of permits, fact sheets, and interviews.
Priority Issues to Address
The following are the top priority issues affecting the state’s program performance based on the
findings in the year of review:
ADEM is commended for their web-based eFile system which greatly facilitated EPA’s
review of files for the SRF. The eFile system, which was instituted by ADEM in 2009
and contains over 1.1 million electronic documents, allows permittees, the public and
stakeholders access to documents stored in ADEM’s document management system.
This system is an effective and user-friendly interface for the retrieval of documents such
as public notices, permits, discharge monitoring reports, and enforcement-related
documents. Using eFile, EPA was able to conduct portions of the SRF file reviews
remotely which contributed to the efficiency and timeliness of developing this SRF
report.
ADEM needs to improve the accuracy of data in the national databases of record,
including ICIS-NPDES and RCRAInfo.
ADEM needs to implement procedures for penalty calculations to ensure appropriate
documentation of gravity and economic benefit and the rationale for differences between
initial and final penalties for CAA and RCRA.
Major SRF CWA-NPDES Program Findings
ADEM needs to implement revised procedures that ensure the accurate reporting of
enforcement and compliance data in ICIS-NPDES. EPA will monitor progress through
electronic file reviews and existing oversight calls and when sufficient improvement is
observed the recommendation will be considered satisfied.
ADEM needs to take steps to ensure that enforcement actions return facilities to
compliance. EPA will monitor progress through existing oversight calls and other
reviews and when sufficient improvement is observed the recommendation will be
considered satisfied.
ADEM needs to implement procedures that ensure that Significant Non-compliance
(SNC) is addressed timely and appropriately. This is a recurring issue from the Round 2
SRF. EPA will monitor progress through existing oversight calls and electronic file
reviews and when sufficient improvement is observed the recommendation will be
considered satisfied.
Major SRF CAA Stationary Source Program Findings
ADEM needs to implement procedures to ensure that the documentation of penalty
calculations show the consideration of gravity and economic benefit and the rationale for
differences between initial and final penalties. This is a recurring issue from SRF Rounds
1 and 2. When EPA observes appropriate documentation, this recommendation will be
considered satisfied.
Major SRF RCRA Subtitle C Program Findings
ADEM needs to develop and implement procedures to ensure the timely and accurate
entry of data into RCRAInfo. EPA will monitor progress using ADEM’s eFile system
and RCRAInfo and once sufficient improvement is observed the recommendation will be
considered complete.
ADEM needs to implement procedures to ensure that the documentation of penalty
calculations show the consideration of gravity and economic benefit and the rationale for
differences between initial and final penalties. This is a recurring issue from SRF Rounds
1 and 2. When EPA observes appropriate documentation, this recommendation will be
considered satisfied.
Major Follow-Up Actions
Recommendations and actions identified from the SRF review will be tracked in the SRF
Tracker.
Table of Contents
State Review Framework ............................................................................................................. 5
I. Background on the State Review Framework ..............................................................................................5
II. SRF Review Process ...................................................................................................................................6
III. SRF Findings..............................................................................................................................................7
Clean Water Act Findings ..................................................................................................................... 8
Clean Air Act Findings ....................................................................................................................... 26
Resource Conservation and Recovery Act Findings ........................................................................... 41
Final Report | Alabama | Page 5
State Review Framework
I. Background on the State Review Framework
The State Review Framework (SRF) is designed to ensure that EPA conducts nationally
consistent oversight. It reviews the following local, state, and EPA compliance and enforcement
programs:
Clean Air Act Stationary Source
Clean Water Act National Pollutant Discharge Elimination System
Resource Conservation and Recovery Act Subtitle C
Reviews cover these program areas:
Data — completeness, timeliness, and quality
Compliance monitoring — inspection coverage, inspection quality, identification of
violations, meeting commitments
Enforcement actions — appropriateness and timeliness, returning facilities to compliance
Penalties — calculation, assessment, and collection
Reviews are conducted in three phases:
Analyzing information from the national data systems
Reviewing a limited set of state files
Development of findings and recommendations
Consultation is also built into the process. This ensures that EPA and the state understand the
causes of issues and seek agreement on actions needed to address them.
SRF reports are designed to capture the information and agreements developed during the review
process in order to facilitate program improvements. EPA also uses the information in the reports
to develop a better understanding of enforcement and compliance nationwide, and to identify any
issues that require a national response.
Reports provide factual information. They do not include determinations of overall program
adequacy, nor are they used to compare or rank state programs.
Each state’s programs are reviewed once every four years. The first round of SRF reviews began
in FY 2004. The third round of reviews began in FY 2012 and will continue through FY 2017.
Final Report | Alabama | Page 6
II. SRF Review Process Review period: FY 2012
Key dates:
Kickoff letter sent to state: March 22, 2013
Kickoff meeting conducted: April 29, 2013
Data metric analysis and file selection list sent to state:
RCRA - March 29, 2013
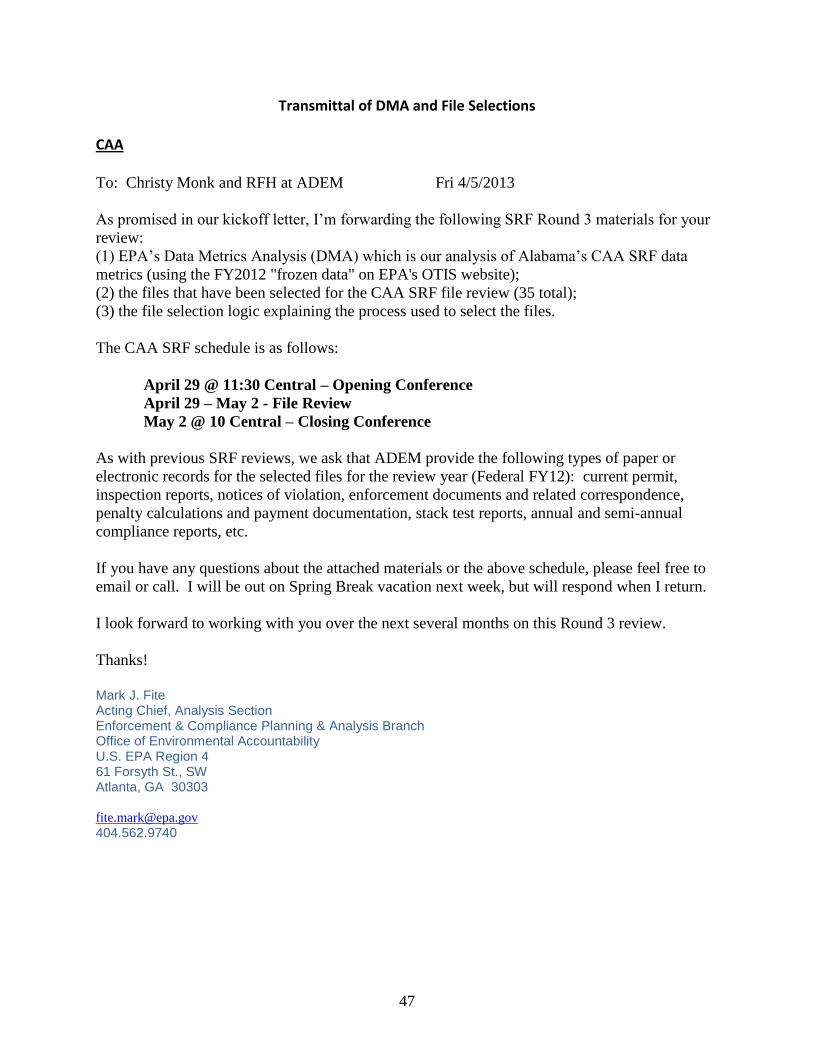
CAA - April 5, 2013
CWA - April 12, 2013
On-site file review conducted:
RCRA - April 29 – May 2, 2013
CAA – April 29 – May 2, 2013
CWA - May 13 – May 17, 2013
Draft report sent to state: November 18, 2013
Revised draft report sent to state: March 14, 2014
Report finalized: March 31, 2014
Communication with the state: Every year, in the fall management from EPA Region 4 Office
of Environmental Accountability meet with State Enforcement staff to provide information on
enforcement priorities for the year ahead and to discuss enforcement and compliance issues of
interest to the state and EPA. The meeting with ADEM staff occurred on October 24, 2012 and
the schedule for conducting an integrated SRF-PQR review of AL using FY 2012 data was
discussed. A follow up letter was sent on March 22, 2013 outlining the process.
Appendix F contains copies of correspondence between EPA and ADEM.
State and EPA regional lead contacts for review:
AL Department of
Environmental Management
EPA Region 4
SRF Coordinator
Marilyn Elliott Becky Hendrix, SRF Coordinator
Kelly Sisario, OEA Branch Chief
CAA Christy Monk
Mark Fite, OEA Technical Authority
Steve Rieck, Air and EPCRA
Enforcement Branch
CWA Glenda Dean
Richard Hulcher
Ron Mikulak, OEA Technical Authority
Laurie Jones, Clean Water Enforcement
Branch
RCRA Phil Davis
Clethes Stallworth
Shannon Maher, OEA Technical
Authority
Paula Whiting, RCRA Alabama State
Coordinator
Final Report | Alabama | Page 7
III. SRF Findings
Findings represent EPA’s conclusions regarding state performance, and may be based on:
Initial findings made during the data and/or file reviews
Annual data metric reviews conducted since the state’s Round 2 SRF review
Follow-up conversations with state agency personnel
Additional information collected to determine an issue’s severity and root causes
Review of previous SRF reports, MOAs, and other data sources
There are four types of findings:
Good Practice: Activities, processes, or policies that the SRF metrics show are being
implemented at the level of Meets Expectations, and are innovative and noteworthy, and can
serve as models for other states. The explanation must discuss these innovative and noteworthy
activities in detail. Furthermore, the state should be able to maintain high performance.
Meets Expectations: Describes a situation where either: a) no performance deficiencies are
identified, or b) single or infrequent deficiencies are identified that do not constitute a pattern or
problem. Generally, states are meeting expectations when falling between 91 to 100 percent of a
national goal. The state is expected to maintain high performance.
Area for State Attention: The state has single or infrequent deficiencies that constitute a minor
pattern or problem that does not pose a risk to human health or the environment. Generally,
performance requires state attention when the state falls between 85 to 90 percent of a national
goal. The state should correct these issues without additional EPA oversight. The state is
expected to improve and achieve high performance. EPA may make recommendations to
improve performance but they will not be monitored for completion.
Area for State Improvement: Activities, processes, or policies that SRF data and/or file metrics
show as major problems requiring EPA oversight. These will generally be significant recurrent
issues. However, there may be instances where single or infrequent cases reflect a major
problem, particularly in instances where the total number of facilities under consideration is
small. Generally, performance requires state improvement when the state falls below 85 percent
of a national goal. Recommendations are required to address the root causes of these problems,
and they must have well-defined timelines and milestones for completion. Recommendations
will be monitored in the SRF Tracker.
Final Report | Alabama | Page 8
Clean Water Act Findings
CWA Element 1 — Data Completeness: Completeness of Minimum Data Requirements.
Finding 1-1 Meets Expectations
Description ADEM has ensured that the minimum data requirements (MDRs) were
entered into the Integrated Compliance Information System (ICIS).
Explanation
Element 1 is supported by SRF Data Metrics 1a through 1g and measures
the completeness of data in the national data system. EPA provided the
FY2012 data metric analysis (DMA) to ADEM in April 2013. While
several data communication/coordination issues have been noted between
ADEM and EPA, no data completeness issues were identified for Element
1. Element 1 includes 15 data verification metrics which the State has the
opportunity to verify annually. For the sake of brevity, these metrics are
not listed here, but can be found in Appendix A.
Relevant metrics Data Metrics 1a – 1g
State response
Since EPA did not, ADEM would like to point out that EPA’s finding for
element was Area for State Improvement in the last SRF review. ADEM
believes that the SRF report should note areas where performance has
improved.
Recommendation
Final Report | Alabama | Page 9
CWA Element 2 — Data Accuracy: Accuracy of Minimum Data Requirements.
Finding 2-1 Area for State Improvement
Description The accuracy of data between files reviewed and data reflected in ICIS
needs improvement.
Explanation File Review Metric 2b measures files reviewed where data are accurately
reflected in the national data system. Of the 36 files reviewed, 50% of the
files documented information being reported accurately into ICIS.
Common discrepancies or inconsistencies between the OTIS Detailed
Facility Reports (DFRs) and the State’s files were related to a facility’s
name or address, inspection type, dates, or enforcement action taken.
While 8 of the 36 files were inaccurate solely due to facility name and/or
address discrepancies, these data discrepancies while taken as a whole,
could result in inaccurate information being released to the public, and
potentially hinder EPA’s oversight efforts. Data accuracy was an Area for
State Attention identified during the Round 2 SRF review. Steps taken by
the State in response to the Round 2 finding have not fully addressed the
issue, so data accuracy remains as an issue and is now identified as an Area
for State Improvement.
Relevant metrics 2b: Files reviewed where data are accurately reflected in the national data
system: 18/36 = 50%
National Goal 95%
State response EPA found discrepancies in facility names/addresses in 12 of 36 files, and
this was clearly the most common problem found. For 9 of the 12
instances, it was the only valid problem found for this metric. First, it has
been ADEM’s experience that applicants/permittees are often inconsistent
in how facility names and addresses are provided on documents provided
to the Department. Second, only the Facility Site Name is transferred from
ICIS to OTIS/ECHO. The Permittee Name is not transferred. This may
account for many of the discrepancies when comparing the OTIS Detailed
Facility Reports to a facility’s name in the State’s files. Last, ADEM
believes that many of the discrepancies with names/addresses predated the
commencement of ADEM beginning its flow directly to ICIS.
Since EPA did not provide a list citing the specific discrepancies with
regard to names and addresses and did not provide copies of its detailed
facility reports (DFR), we are unable to discern whether the differences
were significant enough to have resulted in EPA or a member of the public
failing to properly identify the facility. ADEM does not believe that EPA
should include inconsequential discrepancies in its assessment of ADEM’s
performance.
Final Report | Alabama | Page 10
In the interest of transparency and to aid ADEM in its investigation of
issues EPA may raise during the SRF file review, ADEM requests that
EPA provide a copy of the DFR for each facility during the file review
process. In addition, we request that EPA’s comments be more detailed in
the “Facility-specific comments” section whenever EPA is noting a
discrepancy.
For two facilities, EPA’s comment regarding the availability of the CEI
report was inaccurate. The reports were available in eFile, the system
available to EPA and the public. EPA personnel had difficulty finding the
documents initially because of the search criteria they used.
For one facility, EPA’s comment that “the inspection type was not
indicated on the IR” is not appropriate under Metric 2b. This comment
should only appear under Metric 6a.
The remaining data discrepancies were random errors that do not depict a
systemic problem in ADEM’s procedures or performance. However,
ADEM is researching the errors and correcting them as necessary. Should
ADEM’s investigation indicate that procedural improvements or additional
staff training is needed, it will undertake those efforts.
In the previous EPA SRF review, EPA identified this metric as an Area for
State Attention. In that review, EPA did not note any discrepancies in
names or addresses. It is unclear whether none were found or whether
EPA chose not to mention them. Since half of the files only had
name/address discrepancies and the other discrepancies found were not
indicative of a systemic problem in ADEM’s procedures or performance,
ADEM believes that EPA’s finding of Area for State Improvement be
downgraded to Area of State Attention.
RE: EPA’s Recommendation, to research the many of the discrepancies
EPA found, ADEM will need the DFRs with EPA’s notes in order to
ensure that we understand the exact discrepancy.
Recommendation It is recommended that ADEM take appropriate steps to research the data
discrepancies and correct them as necessary. Should ADEM’s
investigation indicate that procedural improvements or additional staff
training are needed, the State should undertake those efforts to ensure that
information and data reported are accurate EPA Region 4 will assess
progress in ADEM’s performance through periodic on-site and/or
electronic file reviews. If by September 30, 2014, these periodic reviews
indicate that sufficient improvement in data accuracy is observed, this
recommendation will be considered complete.
Final Report | Alabama | Page 11
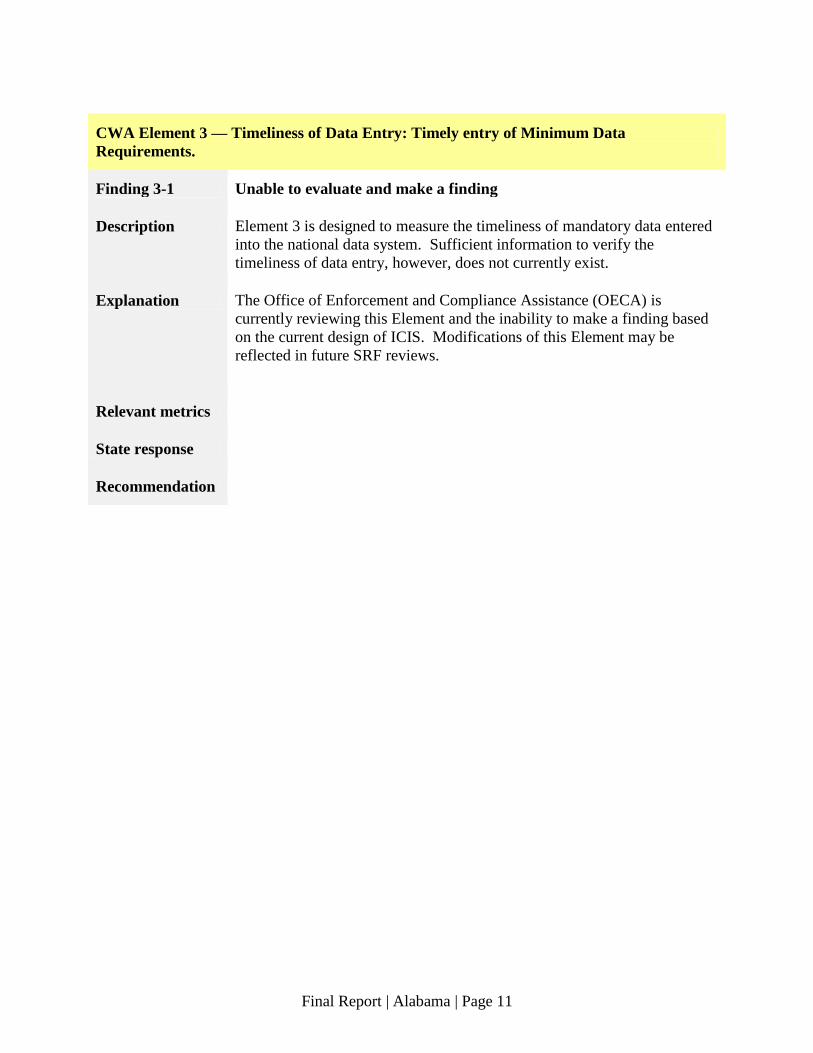
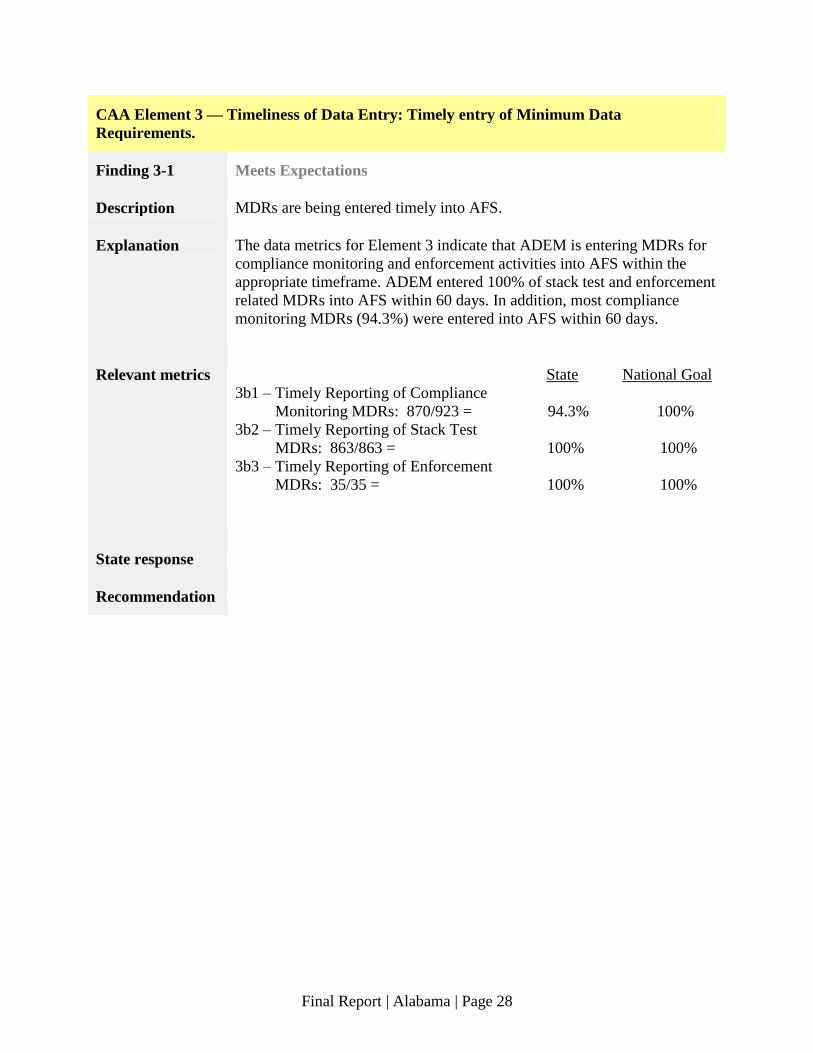
CWA Element 3 — Timeliness of Data Entry: Timely entry of Minimum Data
Requirements.
Finding 3-1 Unable to evaluate and make a finding
Description Element 3 is designed to measure the timeliness of mandatory data entered
into the national data system. Sufficient information to verify the
timeliness of data entry, however, does not currently exist.
Explanation The Office of Enforcement and Compliance Assistance (OECA) is
currently reviewing this Element and the inability to make a finding based
on the current design of ICIS. Modifications of this Element may be
reflected in future SRF reviews.
Relevant metrics
State response
Recommendation
Final Report | Alabama | Page 12
CWA Element 4 — Completion of Commitments: Meeting all enforcement and compliance
commitments made in state/EPA agreements.
Finding 4-1 Meets Expectations
Description ADEM met their inspection and non-inspection compliance/enforcement
(C/E) commitments outlined in their FY12 Compliance Monitoring
Strategy (CMS) Plan and FY 2012 CWA §106 Workplan.
Explanation Element 4 measures planned inspections completed (Metric 4a) and other
planned C/E activities completed (Metric 4b). The National Goal for this
Element is for 100% of commitments to be met. Under Metric 4a, the State
met or exceeded all FY 12 inspection commitments. Under Metric 4b, the
State met or exceeded its planned C/E activities related to data
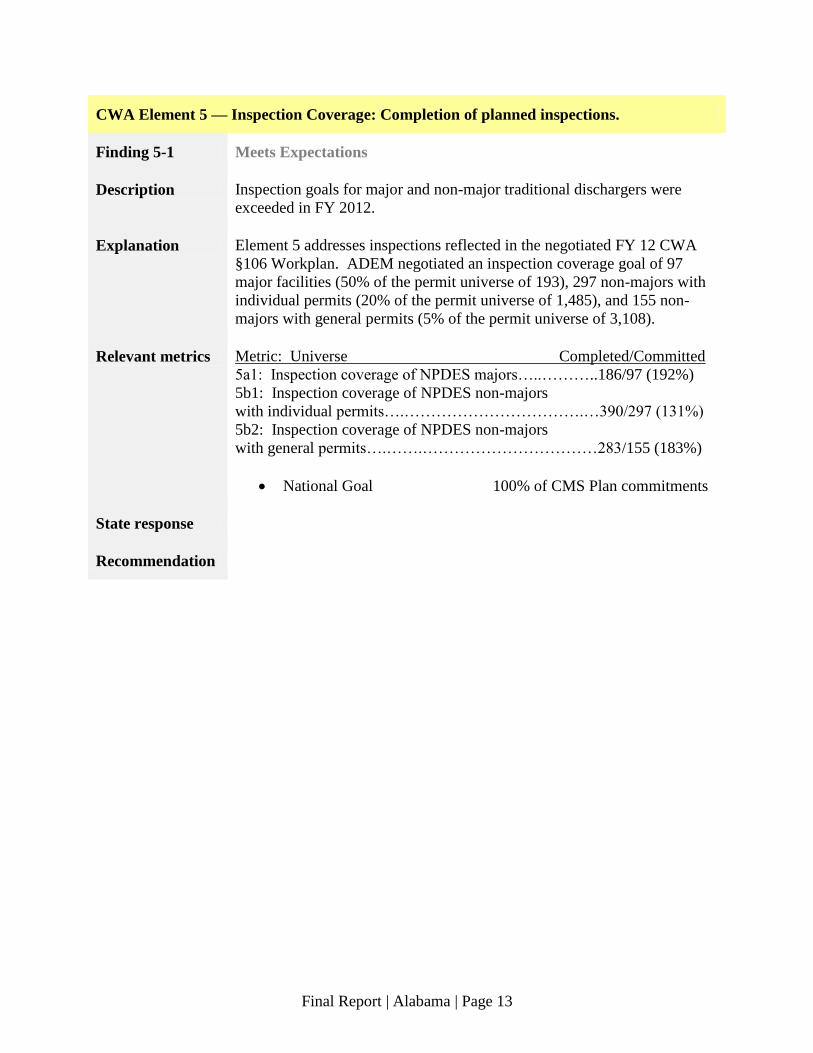
RCRA Element 5 — Inspection Coverage: Completion of planned inspections.
Finding 5-1 Meets Expectations
Description ADEM met the inspection coverage for operating TSDs and LQGs.
Explanation Element 5 measures three types of required inspection coverage that are
outlined in the EPA RCRA Compliance Monitoring Strategy: (1) 100%
coverage of operating Treatment Storage Disposal (TSD) facilities over a
two-year period, (2) 20% coverage of LQGs every year, and (3) 100%
coverage of LQGs every five years. In FY2012, ADEM met or exceeded
all inspections in these areas.
Relevant metrics Data Metric State National Goal
5a – Two-year inspection coverage 100% 100%
for operating TSDFs (11/11)
5b – Annual inspection coverage 48.9% 20%
for LQGs (111/227)
5c – Five-year inspection coverage 100% 100%
For LQGs (227/227)
State response No response necessary
Recommendation
Final Report | Alabama | Page 47
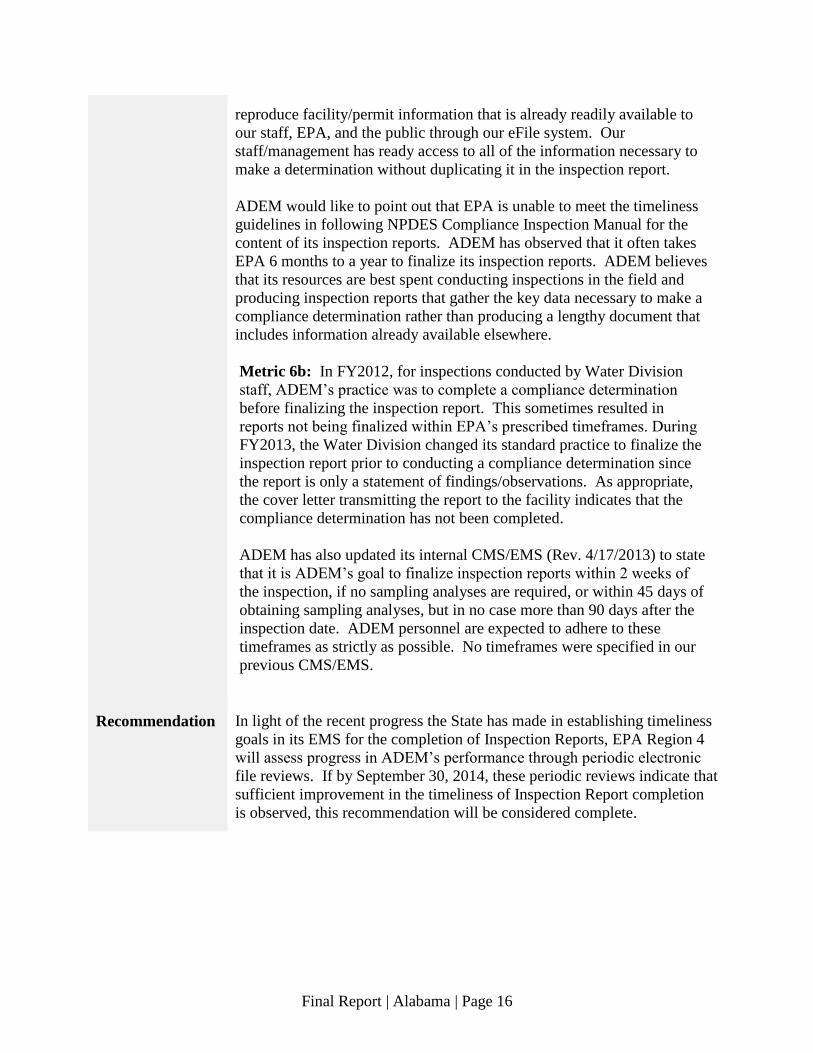
RCRA Element 6 — Quality of Inspection Reports: Proper and accurate documentation of
observations and timely report completion.
Finding 6-1 Meets Expectations
Description ADEM’s inspection reports provided sufficient documentation to
determine compliance at the facility, and were completed in a timely
manner.
Explanation File Review Metric 6a assesses the completeness of inspection reports and
whether the reports provide sufficient documentation to determine
compliance at the facility. Of the inspection reports reviewed, 93.5% (29 of
31) were complete and had sufficient documentation to determine
compliance at the facility. The content and narrative of the reports varied
widely across inspection staff, but in general the reports provided sufficient
information for compliance determinations. File Review Metric 6b
measures the timely completion of inspection reports. According to the
RCRA ERP, violation determination should be made within 150 days of
the first day of inspection. ADEM considers issue date of the informal
enforcement action as the date of violation determination. In the file
review, it was found that 94.1% of the reports were completed in by Day
150. The two criteria for inspection report quality meets SRF expectations.
Relevant metrics File Metric State National Goal
6a – Percentage of inspection reports that are
complete and provide documentation
to determine compliance (29/31) 93.5% 100%
6b – Percentage of inspection reports
that are completed timely (32/34) 94.1% 100%
State response No response necessary
Recommendation
Final Report | Alabama | Page 48
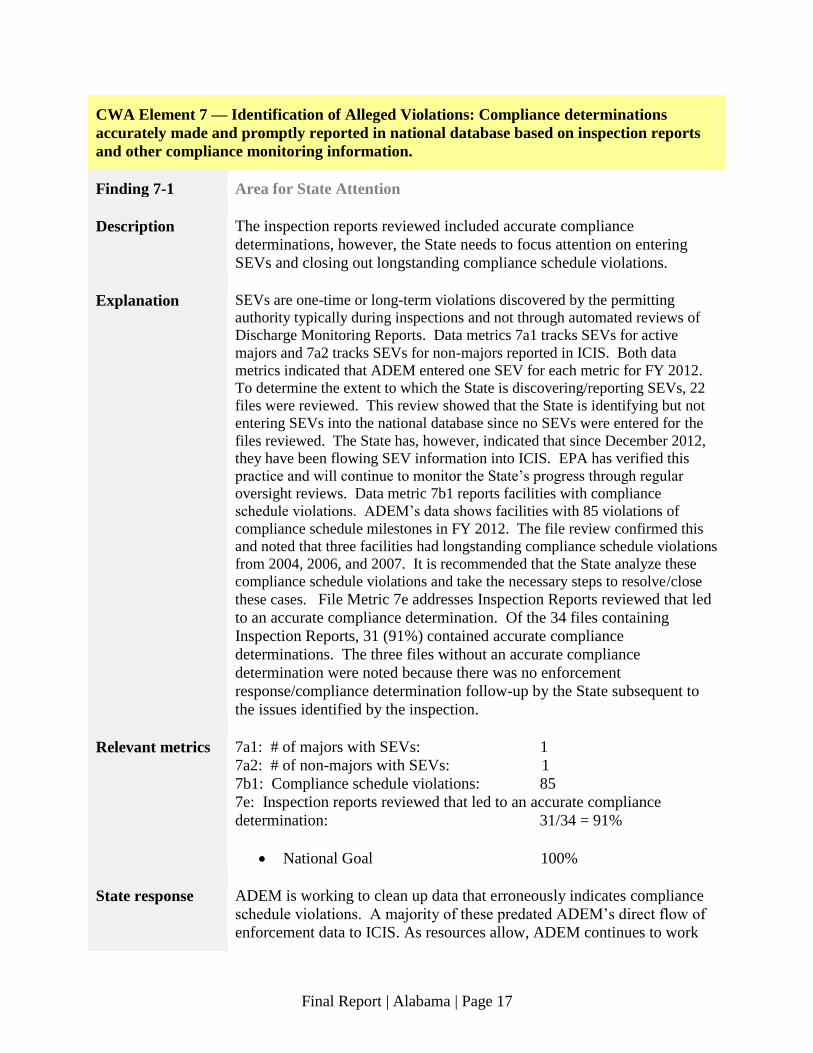
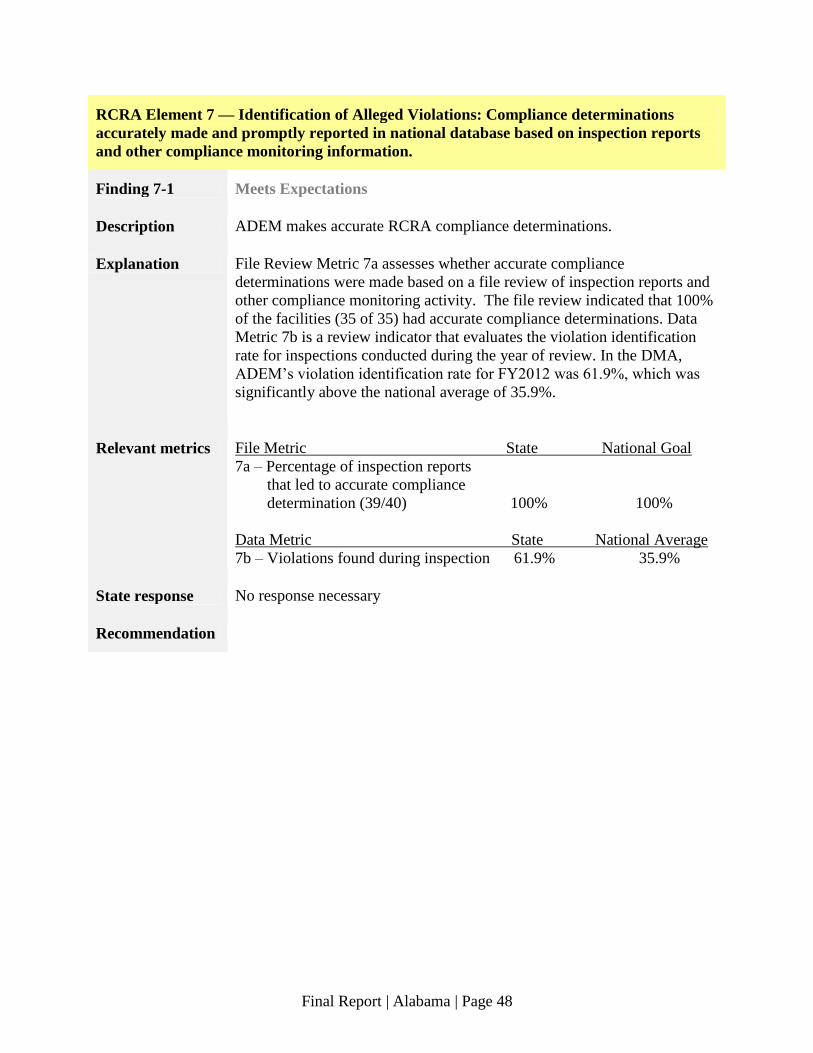
RCRA Element 7 — Identification of Alleged Violations: Compliance determinations
accurately made and promptly reported in national database based on inspection reports
and other compliance monitoring information.
Finding 7-1 Meets Expectations
Description ADEM makes accurate RCRA compliance determinations.
Explanation File Review Metric 7a assesses whether accurate compliance
determinations were made based on a file review of inspection reports and
other compliance monitoring activity. The file review indicated that 100%
of the facilities (35 of 35) had accurate compliance determinations. Data
Metric 7b is a review indicator that evaluates the violation identification
rate for inspections conducted during the year of review. In the DMA,
ADEM’s violation identification rate for FY2012 was 61.9%, which was
significantly above the national average of 35.9%.
Relevant metrics File Metric State National Goal
7a – Percentage of inspection reports
that led to accurate compliance
determination (39/40) 100% 100%
Data Metric State National Average
7b – Violations found during inspection 61.9% 35.9%
State response No response necessary
Recommendation
Final Report | Alabama | Page 49
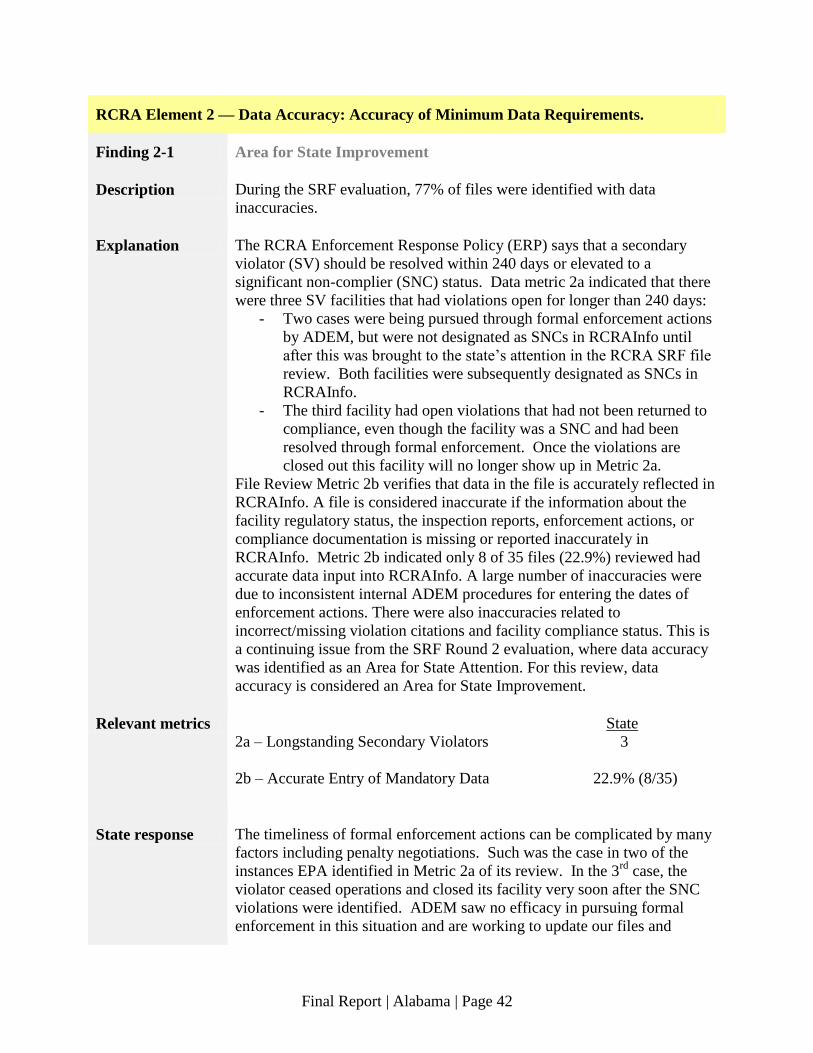
RCRA Element 8 — Identification of SNC and HPV: Accurate identification of significant
noncompliance and high-priority violations, and timely entry into the national database.
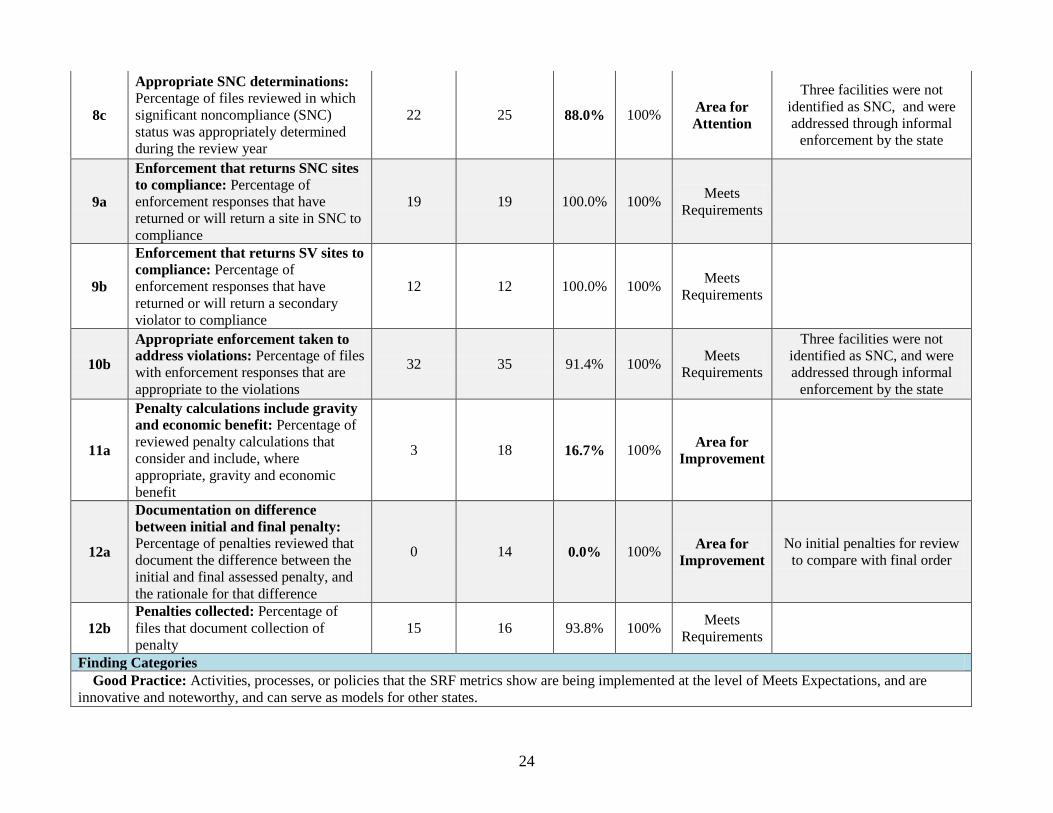
Finding 8-1 Area for State Attention
Description In the majority of cases, ADEM makes timely and accurate SNC
determinations.
Explanation Data Metric 8a identifies the percent of facilities that received a SNC
designation in FY2012, the year of data reviewed for ADEM’s SRF
evaluation. ADEM’s SNC identification rate was 4.8% which was above
the national average of 1.7%. Data Metric 8b measures the number of
SNC determinations that were made within 150 days of the first day of
inspection. Timely SNC designation is important so that significant
problems are addressed in a timely manner. In FY2012, ADEM reported
85.7% (18 of 21) of their SNC designations by Day 150.
In the 1998 RCRA Memorandum of Agreement between ADEM and EPA
Region 4, the state has agreed to take timely and appropriate enforcement
action as defined in the 1996 RCRA ERP. The ERP provides the national
definition of SNC facilities, and includes the criteria for taking timely and
appropriate enforcement at these violating facilities. File Review Metric
8c measures the percentage of violations in the files that were accurately
determined to be a SNC. Of the files reviewed, there were three facilities
that were SNC-caliber, but were designated as Secondary Violators by the
state and the violations were addressed through informal enforcement
rather than appropriate formal enforcement actions. Thus, the percentage of
files reviewed where the violation was accurately determined to be a SNC
was 88% (22 of 25 SNC facilities). The accurate identification of SNC
facilities and the timely entry of SNC designations into RCRAInfo are
considered an Area for State Attention. The data entry procedures for SNC
designations should be reviewed for possible efficiencies for timely data
entry. ADEM should also refer to the criteria outlined in the RCRA ERP
for accurate identification of SNC-caliber facilities. It is the expectation
that by following these steps, the accurate identification of SNCs and
timely entry of SNC designations will improve without further oversight
by EPA.
Relevant metrics State National Average
8a – SNC identification rate 4.8% 1.7%
State National Goal
8b – Percentage of SNC determinations
entered into RCRAInfo by Day 150 (18/21) 85.7% 100%
8c – Percentage of violations in files
Final Report | Alabama | Page 50
reviewed that were accurately
determined to be SNCs (22/25) 88% 100%
State response EPA identified three facilities with violations that it indicated should have
been determined SNC’s rather that Secondary Violations. ADEM does not
agree with this assessment. In the three cases EPA identified, ADEM
determined that the violations cited during the compliance evaluation
inspections posed low potential threat of exposure to hazardous waste or
hazardous waste constituents and decided no actual or imminent
endangerment to human health or the environment. The facilities did not
have known or documented histories of recalcitrant or non-compliant
behavior with respect to the management of hazardous wastes and the
nature of violations (i.e., failure to comply with certain administrative
requirements of the Hazardous Waste Program regulations rather than
failure to act or be in accordance with the substantive requirements of State
law or regulations) was such that the sites could be expected to (and in fact
did) return to compliance with the applicable rules.
The RCRA ERP provides generalized guidelines for determining which
violations of RCRA constitute significant non-compliance. However, the
ERP does not definitively or specifically categorize RCRA violations as
instances of SNC or as Secondary Violations. This makes a SNC
determination largely a judgment call.
ADEM acknowledges EPA’s role in evaluating State enforcement
programs and its use of the ERP to guide its oversight efforts. But since a
SNC determination is a judgment call of the enforcement authority, ADEM
does not believe it would be inappropriate for EPA to substitute its
judgment for the Department’s.
Recommendation
Final Report | Alabama | Page 51
RCRA Element 9 — Enforcement Actions Promote Return to Compliance: Enforcement
actions include required corrective action that will return facilities to compliance in
specified timeframe.
Finding 9-1 Meets Expectations
Description ADEM consistently issues enforcement responses that have returned or
will return a facility in SNC or SV to compliance.
Explanation File Review Metric 9a shows the percentage of SNC enforcement
responses reviewed that have documentation that the facility has returned
or will return to compliance. The file review showed 100% (18 of 18) of
the SNC facilities had documentation in the files showing that the facility
had returned to compliance, or that the enforcement action required the
facility to return to compliance within a certain timeframe. At the time of
drafting this report, there are an additional four SNC facilities that are in
the process of negotiating consent orders that were not counted in this
metric. File Review Metric 9b gives the percentage of SV enforcement
responses reviewed that have documentation that the facility has returned
or will return to compliance. The file review showed 100% of the SVs (12
of 12) had documentation showing that the facility had returned to
compliance, or that the enforcement action required them to return to
compliance within a certain timeframe.
Relevant metrics File Metric State National Goal
9a - Percentage of enforcement responses
that have or will return site in SNC
to compliance (18/18) 100% 100%
9b - Percentage of enforcement responses
that have or will return a SV
to compliance (12/12) 100% 100%
State response No response necessary
Recommendation
Final Report | Alabama | Page 52
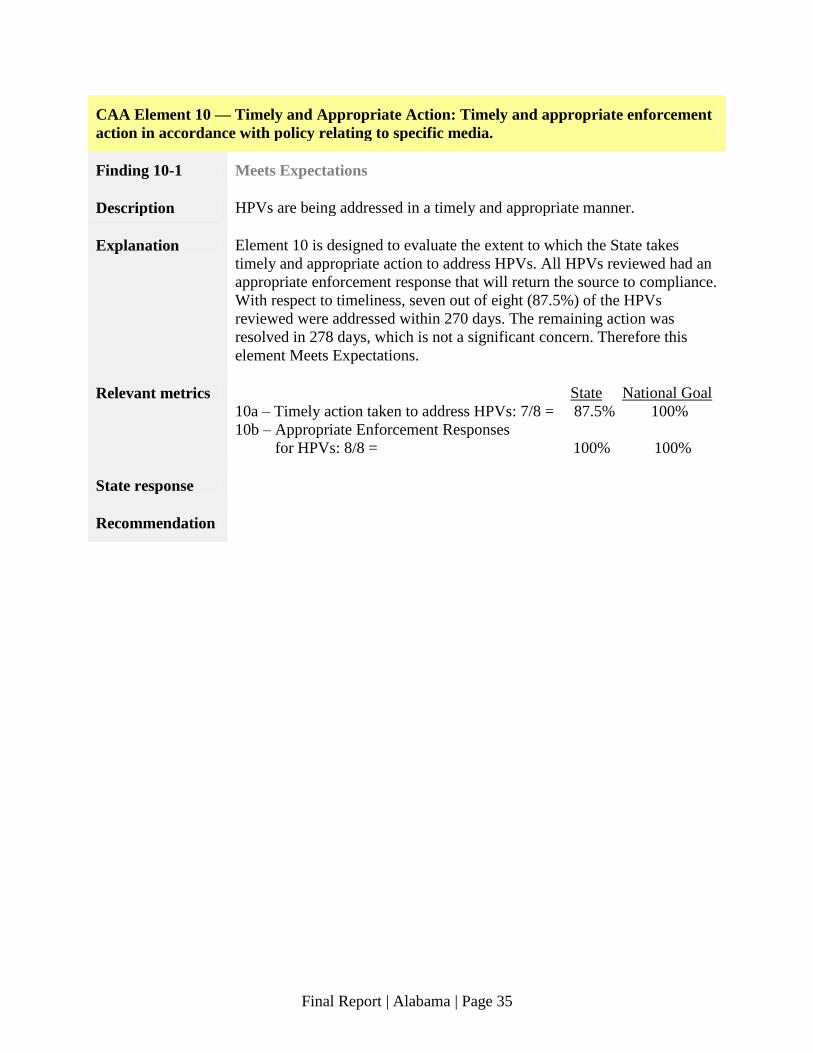
RCRA Element 10 — Timely and Appropriate Action: Timely and appropriate
enforcement action in accordance with policy relating to specific media.
Finding 10-1 Meets Expectations
Description ADEM takes timely and appropriate enforcement actions.
Explanation Data Metric 10a indicated that ADEM completed 100% (10 out of 10) of
the formal enforcement actions at SNC facilities within 360 days of the
first day of inspection, the timeline outlined in the RCRA ERP. ADEM
exceeded the national goal of 80% of enforcement actions meeting this
timeline. This is a significant improvement from the SRF Rounds 1 and 2
evaluations. File Review Metric 10b assesses the appropriateness of
enforcement actions for SVs and SNCs, as defined by the RCRA ERP. In
the files reviewed, 91.4% of the facilities with violations (32 of 35) had the
appropriate enforcement response to addressing the identified violations.
There were three SNC-caliber facilities that were addressed through
informal actions rather than formal actions as required by the RCRA ERP.
Relevant metrics State National Goal
Data Metric 10a:
Timely enforcement to address SNCs (10/10) 100% 80%
File Metric 10b:
Percentage of files with appropriate
enforcement responses (32/35) 91.4% 100%
State response No response necessary
Recommendation
Final Report | Alabama | Page 53
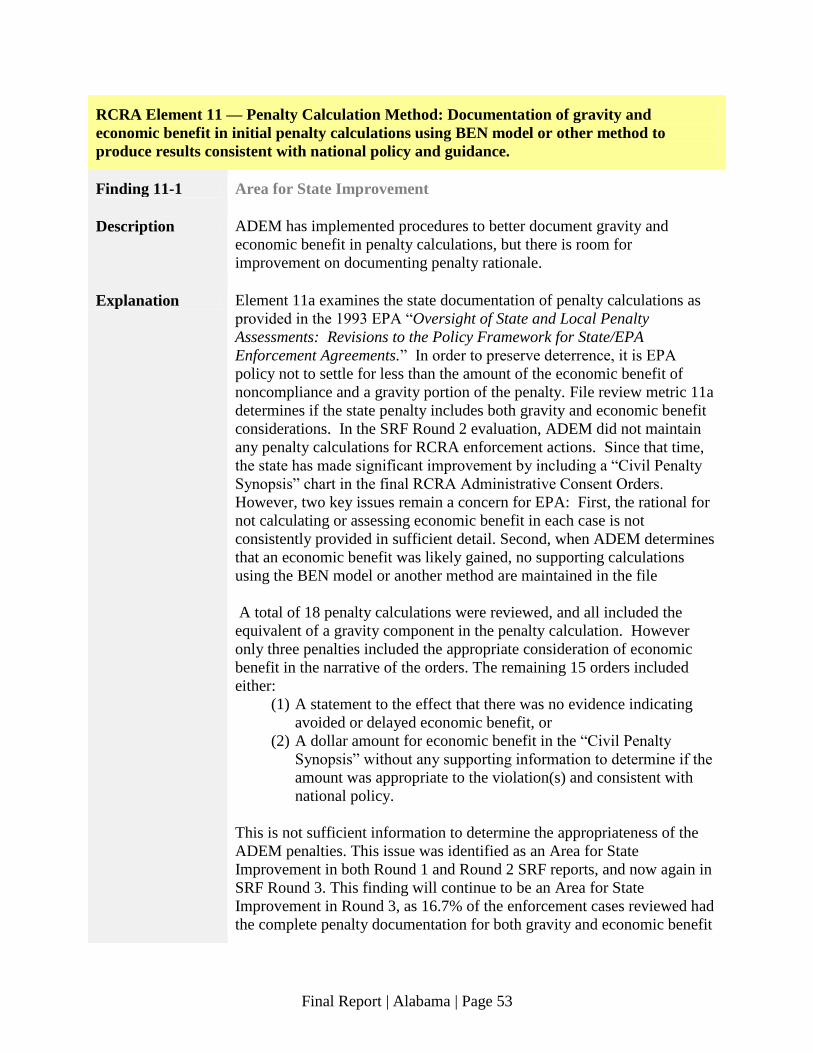
RCRA Element 11 — Penalty Calculation Method: Documentation of gravity and
economic benefit in initial penalty calculations using BEN model or other method to
produce results consistent with national policy and guidance.
Finding 11-1 Area for State Improvement
Description ADEM has implemented procedures to better document gravity and
economic benefit in penalty calculations, but there is room for
improvement on documenting penalty rationale.
Explanation Element 11a examines the state documentation of penalty calculations as
provided in the 1993 EPA “Oversight of State and Local Penalty
Assessments: Revisions to the Policy Framework for State/EPA
Enforcement Agreements.” In order to preserve deterrence, it is EPA
policy not to settle for less than the amount of the economic benefit of
noncompliance and a gravity portion of the penalty. File review metric 11a
determines if the state penalty includes both gravity and economic benefit
considerations. In the SRF Round 2 evaluation, ADEM did not maintain
any penalty calculations for RCRA enforcement actions. Since that time,
the state has made significant improvement by including a “Civil Penalty
Synopsis” chart in the final RCRA Administrative Consent Orders.
However, two key issues remain a concern for EPA: First, the rational for
not calculating or assessing economic benefit in each case is not
consistently provided in sufficient detail. Second, when ADEM determines
that an economic benefit was likely gained, no supporting calculations
using the BEN model or another method are maintained in the file
A total of 18 penalty calculations were reviewed, and all included the
equivalent of a gravity component in the penalty calculation. However
only three penalties included the appropriate consideration of economic
benefit in the narrative of the orders. The remaining 15 orders included
either:
(1) A statement to the effect that there was no evidence indicating
avoided or delayed economic benefit, or
(2) A dollar amount for economic benefit in the “Civil Penalty
Synopsis” without any supporting information to determine if the
amount was appropriate to the violation(s) and consistent with
national policy.
This is not sufficient information to determine the appropriateness of the
ADEM penalties. This issue was identified as an Area for State
Improvement in both Round 1 and Round 2 SRF reports, and now again in
SRF Round 3. This finding will continue to be an Area for State
Improvement in Round 3, as 16.7% of the enforcement cases reviewed had
the complete penalty documentation for both gravity and economic benefit
Final Report | Alabama | Page 54
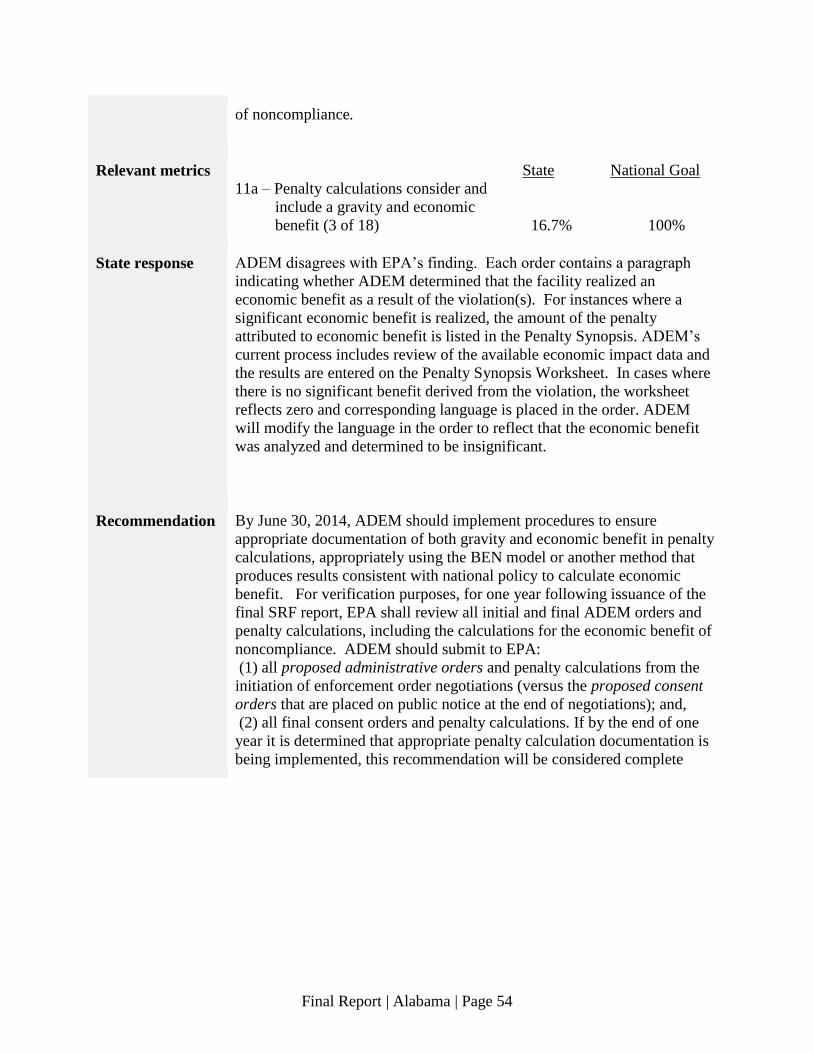
of noncompliance.
Relevant metrics State National Goal
11a – Penalty calculations consider and
include a gravity and economic
benefit (3 of 18) 16.7% 100%
State response ADEM disagrees with EPA’s finding. Each order contains a paragraph
indicating whether ADEM determined that the facility realized an
economic benefit as a result of the violation(s). For instances where a
significant economic benefit is realized, the amount of the penalty
attributed to economic benefit is listed in the Penalty Synopsis. ADEM’s
current process includes review of the available economic impact data and
the results are entered on the Penalty Synopsis Worksheet. In cases where
there is no significant benefit derived from the violation, the worksheet
reflects zero and corresponding language is placed in the order. ADEM
will modify the language in the order to reflect that the economic benefit
was analyzed and determined to be insignificant.
Recommendation By June 30, 2014, ADEM should implement procedures to ensure
appropriate documentation of both gravity and economic benefit in penalty
calculations, appropriately using the BEN model or another method that
produces results consistent with national policy to calculate economic
benefit. For verification purposes, for one year following issuance of the
final SRF report, EPA shall review all initial and final ADEM orders and
penalty calculations, including the calculations for the economic benefit of
noncompliance. ADEM should submit to EPA:
(1) all proposed administrative orders and penalty calculations from the
initiation of enforcement order negotiations (versus the proposed consent
orders that are placed on public notice at the end of negotiations); and,
(2) all final consent orders and penalty calculations. If by the end of one
year it is determined that appropriate penalty calculation documentation is
being implemented, this recommendation will be considered complete
Final Report | Alabama | Page 55
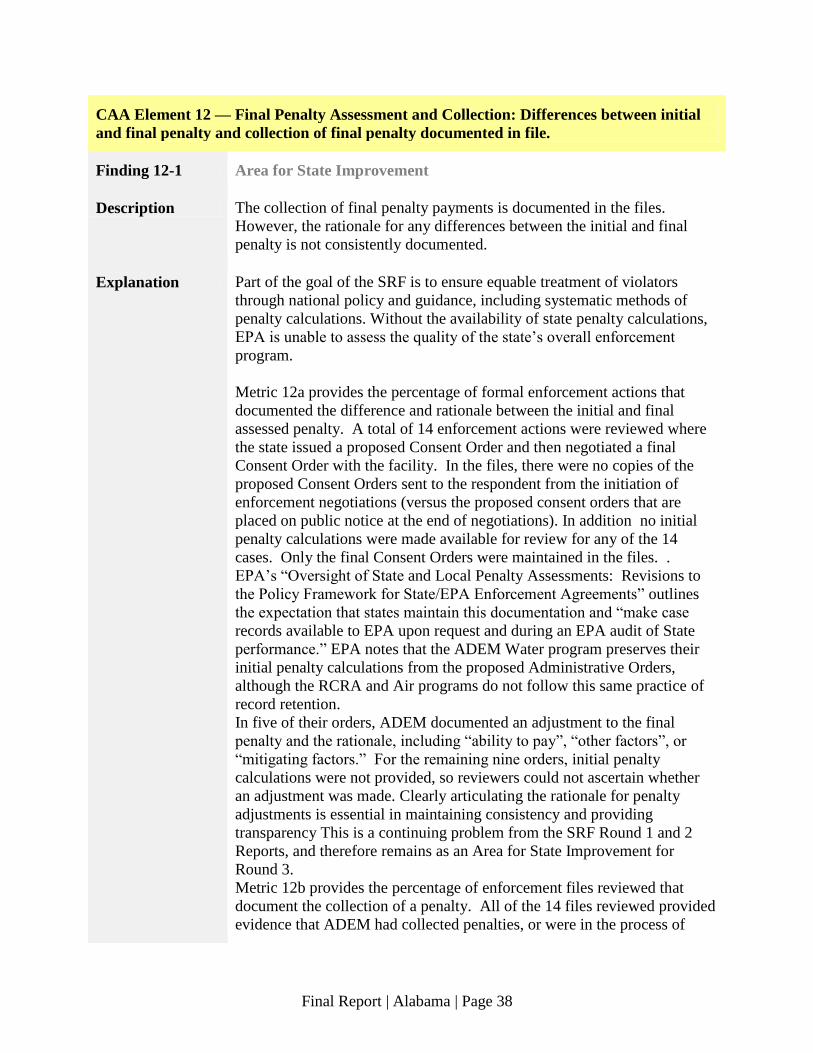
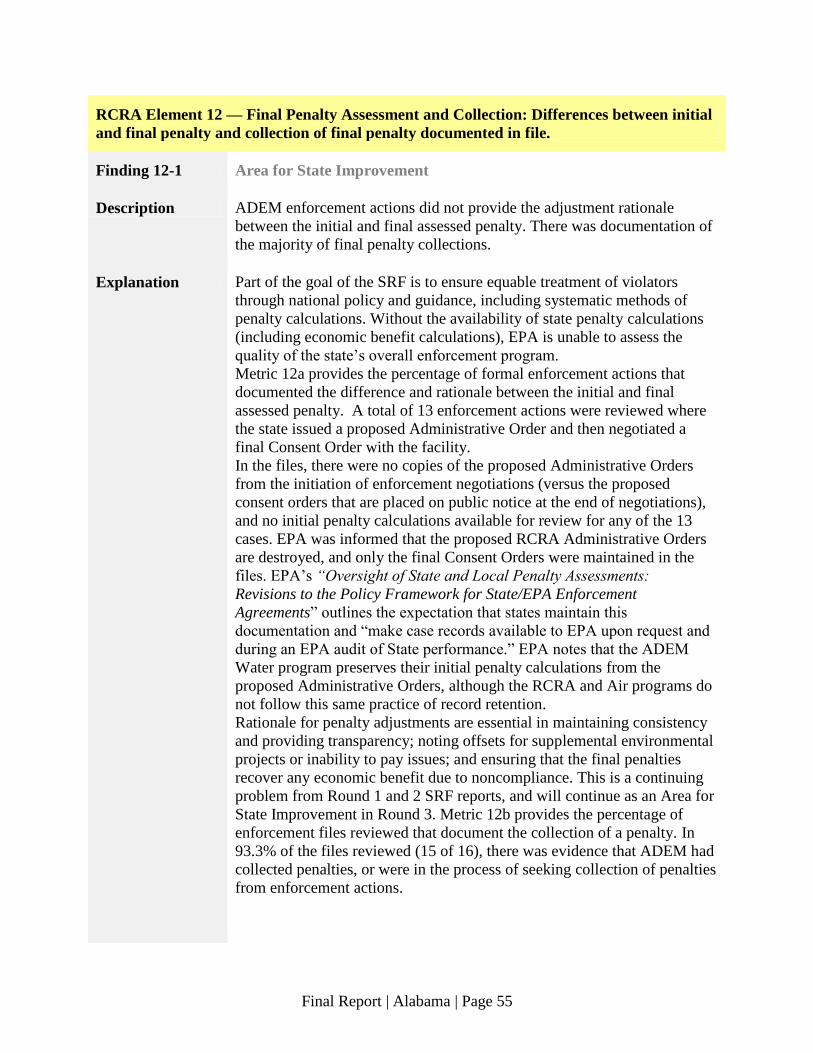
RCRA Element 12 — Final Penalty Assessment and Collection: Differences between initial
and final penalty and collection of final penalty documented in file.
Finding 12-1 Area for State Improvement
Description ADEM enforcement actions did not provide the adjustment rationale
between the initial and final assessed penalty. There was documentation of
the majority of final penalty collections.
Explanation Part of the goal of the SRF is to ensure equable treatment of violators
through national policy and guidance, including systematic methods of
penalty calculations. Without the availability of state penalty calculations
(including economic benefit calculations), EPA is unable to assess the
quality of the state’s overall enforcement program.
Metric 12a provides the percentage of formal enforcement actions that
documented the difference and rationale between the initial and final
assessed penalty. A total of 13 enforcement actions were reviewed where
the state issued a proposed Administrative Order and then negotiated a
final Consent Order with the facility.
In the files, there were no copies of the proposed Administrative Orders
from the initiation of enforcement negotiations (versus the proposed
consent orders that are placed on public notice at the end of negotiations),
and no initial penalty calculations available for review for any of the 13
cases. EPA was informed that the proposed RCRA Administrative Orders
are destroyed, and only the final Consent Orders were maintained in the
files. EPA’s “Oversight of State and Local Penalty Assessments:
Revisions to the Policy Framework for State/EPA Enforcement
Agreements” outlines the expectation that states maintain this
documentation and “make case records available to EPA upon request and
during an EPA audit of State performance.” EPA notes that the ADEM
Water program preserves their initial penalty calculations from the
proposed Administrative Orders, although the RCRA and Air programs do
not follow this same practice of record retention.
Rationale for penalty adjustments are essential in maintaining consistency
and providing transparency; noting offsets for supplemental environmental
projects or inability to pay issues; and ensuring that the final penalties
recover any economic benefit due to noncompliance. This is a continuing
problem from Round 1 and 2 SRF reports, and will continue as an Area for
State Improvement in Round 3. Metric 12b provides the percentage of
enforcement files reviewed that document the collection of a penalty. In
93.3% of the files reviewed (15 of 16), there was evidence that ADEM had
collected penalties, or were in the process of seeking collection of penalties
from enforcement actions.
Final Report | Alabama | Page 56
Relevant metrics State National Goal
12a – Formal enforcement actions that
document the difference and rationale
between the initial & final penalty (0 of 13) 0 % 100%
12b – Final formal actions that documented
the collection of a final penalty (15 of 16) 93.8% 100%
State response EPA’s reference to the practices of ADEM’s Water program is not
appropriate for this Element given the significant differences in the types
of violations identified by the two programs. The most common RCRA
violations involve the discreet failure to perform specific preventative
actions required by the regulations. This is unlike the CWA program
where the most common violations involve the self-reported excursion
from a permitted discharge limit. These vastly different violation profiles
do not lend themselves to the same penalty assessment methodology and
should not be compared. As a result of previous SRF reviews, the
Department has revised its penalty documentation. These revisions were
implemented during the period of concern for this SRF review. The
Penalty Summary sheet is our documentation of the initial and final penalty
and the adjustments made between the initial penalty and final penalty.
There are no changes made to the amounts under "Seriousness of
Violation", "Standard of Care", "History of Previous Violations", or
"Economic Benefit" unless the facility provides evidence that our initial
assessment in these areas was inaccurate, thereby making any such changes
"corrections" not "adjustments". Adjustments made due to negotiations are
reflected in the sections for "Mitigation Factors", "Ability to Pay", or
"Other Factors". For the majority of Orders, "Other Factors" is the
adjustment made and typically reflects a facility's good faith for
negotiating. When no amounts are recorded in "Mitigation Factors",
"Ability to Pay", or "Other Factors", it means that no adjustments to the
initial penalty were made. All ten RCRA orders issued during the SRF
review year used this outlined process. Two order were issued with no
adjustment from the initial to the final penalty (the Penalty Synopsis
Worksheet showed no adjustment). The remaining eight orders had
adjustments made to the initial penalty. All were documented on the
Penalty Synopsis Worksheet. This methodology is transparent in that it
identifies the final penalty and all the compromises from the initial penalty.
This documentation allows all citizen the ability to review not only the
final penalty but the compromises between the initial and final penalty.
Since the order (including the Penalty Synopsis Worksheet) is subject to a
30 day comment prior to actual issuance of the order, ADEM process
provides complete transparency. Based on this explanation, the Penalty
Synopsis identifies the initial and final penalty and demonstrates that this
Element (12) should be classified as “Meets Expectations”.
Final Report | Alabama | Page 57
Recommendation By June 30, 2014 ADEM should implement procedures to ensure
appropriate documentation of the rationale for any difference between the
initial and final penalty. For verification purposes, for one year following
issuance of the final SRF report, EPA shall review all initial and final
ADEM orders and penalty calculations, including the calculations for the
economic benefit of noncompliance. ADEM should submit to EPA:
(1) all proposed administrative orders and penalty calculations from the
initiation of enforcement order negotiations (versus the proposed consent
orders that are placed on public notice at the end of negotiations); and,
(2) all final consent orders and penalty calculations. If by the end of one
year it is determined that appropriate penalty calculation documentation is
being implemented, this recommendation will be considered completed.
Final Report | Alabama | Page 58
1
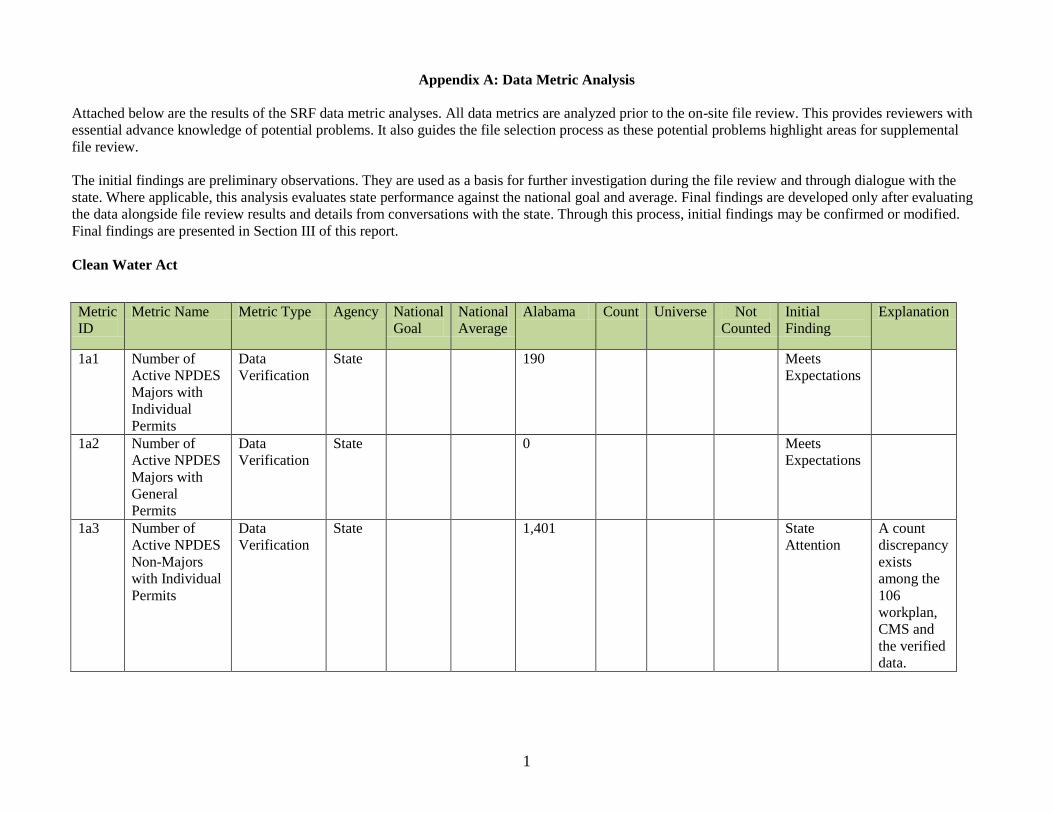
Appendix A: Data Metric Analysis
Attached below are the results of the SRF data metric analyses. All data metrics are analyzed prior to the on-site file review. This provides reviewers with
essential advance knowledge of potential problems. It also guides the file selection process as these potential problems highlight areas for supplemental
file review.
The initial findings are preliminary observations. They are used as a basis for further investigation during the file review and through dialogue with the
state. Where applicable, this analysis evaluates state performance against the national goal and average. Final findings are developed only after evaluating
the data alongside file review results and details from conversations with the state. Through this process, initial findings may be confirmed or modified.
Final findings are presented in Section III of this report.
Clean Water Act
Metric
ID Metric Name Metric Type Agency National
Goal National
Average Alabama Count Universe Not
Counted Initial
Finding Explanation
1a1 Number of
Active NPDES
Majors with
Individual
Permits
Data
Verification State 190 Meets
Expectations
1a2 Number of
Active NPDES
Majors with
General
Permits
Data
Verification State 0 Meets
Expectations
1a3 Number of
Active NPDES
Non-Majors
with Individual
Permits
Data
Verification State 1,401 State
Attention A count
discrepancy
exists
among the
106
workplan,
CMS and
the verified
data.
2
1a4 Number of
Active NPDES
Non-Majors
with General
Permits
Data
Verification State 15,366 State
Attention A count
discrepancy
exists
between the
CMS and
the verified
data. 1b1 Permit Limits
Rate for Major
Facilities
Goal State >= 95% 98.3% 100% 190 190 0 Meets
Expectations
1b2 DMR Entry
Rate for Major
Facilities.
Goal State >= 95% 97.9% 99.8% 6836 6849 13 Meets
Expectations
1b3 Number of
Major
Facilities with
a Manual
Override of
RNC/SNC to a
Compliant
Status
Data
Verification State 19 Meets
Expectations
1c1 Permit Limits
Rate for Non-
Major
Facilities
Informational
only State 67.2% 74.2% 1040 1401 361 Meets
Expectations
1c2 DMR Entry
Rate for Non-
Major
Facilities.
Informational
only State 83.1% 90.7% 10629 11718 1089 Meets
Expectations
1e1 Facilities with
Informal
Actions
Data
Verification State 2,099 Meets
Expectations
1e2 Total Number
of Informal
Actions at
CWA NPDES
Facilities
Data
Verification State 2,204 Meets
Expectations
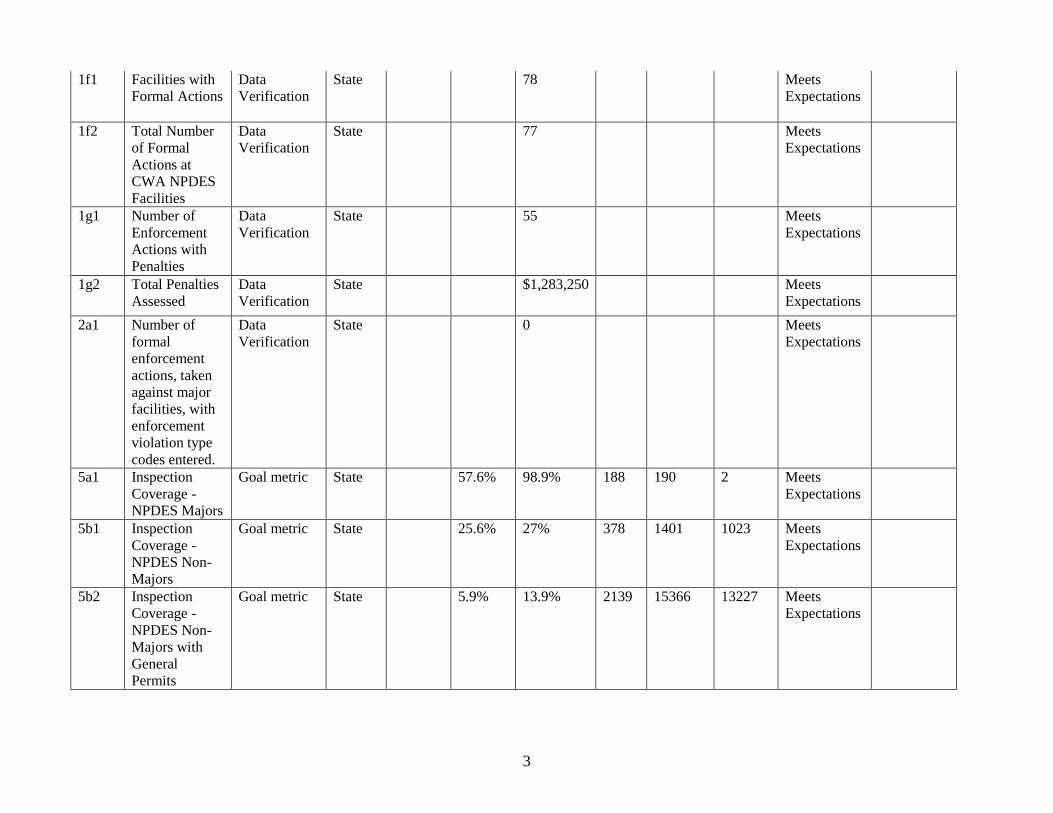
3
1f1 Facilities with
Formal Actions Data
Verification State 78 Meets
Expectations
1f2 Total Number
of Formal
Actions at
CWA NPDES
Facilities
Data
Verification State 77 Meets
Expectations
1g1 Number of
Enforcement
Actions with
Penalties
Data
Verification State 55 Meets
Expectations
1g2 Total Penalties
Assessed Data
Verification State $1,283,250 Meets
Expectations
2a1 Number of
formal
enforcement
actions, taken
against major
facilities, with
enforcement
violation type
codes entered.
Data
Verification State 0 Meets
Expectations
5a1 Inspection
Coverage -
NPDES Majors
Goal metric State 57.6% 98.9% 188 190 2 Meets
Expectations
5b1 Inspection
Coverage -
NPDES Non-
Majors
Goal metric State 25.6% 27% 378 1401 1023 Meets
Expectations
5b2 Inspection
Coverage -
NPDES Non-
Majors with
General
Permits
Goal metric State 5.9% 13.9% 2139 15366 13227 Meets
Expectations
4
7a1 Number of
Major
Facilities with
Single Event
Violations
Data
Verification State 1 State
Attention The low
rate of
SEVs will
be further
examined
during the
file
reviews. 7a2 Number of
Non-Major
Facilities with
Single Event
Violations
Informational
only State 1 State
Attention The low
rate of
SEVs will
be further
examined
during the
file
reviews. 7b1 Compliance
schedule
violations
Data
Verification State 85 State
Attention The high
rate of
compliance
schedule
violations
will be
further
examined
during the
file
reviews. 7c1 Permit
schedule
violations
Data
Verification State 1 Meets
Expectations
7d1 Major
Facilities in
Noncompliance
Review
Indicator State 60.3% 52.1% 99 190 91 Meets
Expectations
7f1 Non-Major
Facilities in
Category 1
Noncompliance
Data
Verification State 493 Meets
Expectations
5
7g1 Non-Major
Facilities in
Category 2
Noncompliance
Data
Verification State 196 Meets
Expectations
7h1 Non-Major
Facilities in
Noncompliance
Informational
only State 44.8% 627 1401 774 Meets
Expectations
8a1 Major
Facilities in
SNC
Review
indicator
metric
State 37 Meets
Expectations
8a2 Percent of
Major
Facilities in
SNC
Review
indicator
metric
State 20.6% 19.1% 37 194 157 Meets
Expectations
10a1 Major facilities
with Timely
Action as
Appropriate
Goal metric State 3.6% 0% 0 10 10 State
Improvement The low
rate of
timely
action as
appropriate
will be
further
examined
during the
file
reviews.
Clean Air Act
Metric
ID Metric Name
Metric
Type Agency
National
Goal National
Average
Alabama
(state
only) Count Universe
Not
Counted Initial
Finding Explanation
1a1 Number of Active
Major Facilities
(Tier I)
Data
Verification State 316
Meets
Expectations
1a2 Number of Active
Synthetic Minors
(Tier I)
Data
Verification State 241
Meets
Expectations
6
1a3 Number of Active
NESHAP Part 61
Minors (Tier I)
Data
Verification State 2
Meets
Expectations
1a4
Number of Active
CMS Minors and
Facilities with
Unknown
Classification (Not
counted in metric
1a3) that are
Federally-
Reportable (Tier I)
Data
Verification State 3
Meets
Expectations
1a5
Number of Active
HPV Minors and
Facilities with
Unknown
Classification (Not
counted in metrics
1a3 or 1a4) that are
Federally-
Reportable (Tier I)
Data
Verification State 0
Meets
Expectations
1a6
Number of Active
Minors and Facilites
with Unknown
Classification
Subject to a Formal
Enforcement Action
(Not counted in
metrics 1a3, 1a4 or
1a5) that are
Federally-
Reportable (Tier II)
Data
Verification State 13
Meets
Expectations
1b1
Number of Active
Federally-
Reportable NSPS
(40 C.F.R. Part 60)
Facilities
Data
Verification State 245
Meets
Expectations
7
1b2
Number of Active
Federally-
Reportable
NESHAP (40
C.F.R. Part 61)
Facilities
Data
Verification State 27
Meets
Expectations
1b3
Number of Active
Federally-
Reportable MACT
(40 C.F.R. Part 63)
Facilities
Data
Verification State 321
Meets
Expectations
1b4
Number of Active
Federally-
Reportable Title V
Facilities
Data
Verification State 307
Meets
Expectations
1c1
Number of Tier I
Facilities with an
FCE (Facility
Count)
Data
Verification State 571
Meets
Expectations
1c2 Number of FCEs at
Tier I Facilities
(Activity Count)
Data
Verification State 571
Meets
Expectations
1c3 Number of Tier II
Facilities with FCE
(Facility Count)
Data
Verification State 11
Meets
Expectations
1c4 Number of FCEs at
Tier II Facilities
(Activity Count)
Data
Verification State 11
Meets
Expectations
1d1
Number of Tier I
Facilities with
Noncompliance
Identified (Facility
Count)
Data
Verification State 27
Meets
Expectations
1d2
Number of Tier II
Facilities with
Noncompliance
Identified (Facility
Count)
Data
Verification State 6
Meets
Expectations
8
1e1
Number of Informal
Enforcement
Actions Issued to
Tier I Facilities
(Activity Count)
Data
Verification State 15
Meets
Expectations
1e2
Number of Tier I
Facilities Subject to
an Informal
Enforcement Action
(Facility Count)
Data
Verification State 14
Meets
Expectations
1f1 Number of HPVs
Identified (Activity
Count)
Data
Verification State 6
Meets
Expectations
1f2
Number of Facilities
with an HPV
Identified (Facility
Count)
Data
Verification State 6
Meets
Expectations
1g1
Number of Formal
Enforcement
Actions Issued to
Tier I Facilities
(Activity Count)
Data
Verification State 14
Meets
Expectations
1g2
Number of Tier I
Facilities Subject to
a Formal
Enforcement Action
(Facility Count)
Data
Verification State 14
Meets
Expectations
1g3
Number of Formal
Enforcement
Actions Issued to
Tier II Facilities
(Activity Count)
Data
Verification State 4
Meets
Expectations
1g4
Number of Tier II
Facilities Subject to
a Formal
Enforcement Action
(Facility Count)
Data
Verification State 4
Meets
Expectations
9
1h1 Total Amount of
Assessed Penalties Data
Verification State
$272,250
Meets
Expectations
1h2
Number of Formal
Enforcment Actions
with an Assessed
Penalty
Data
Verification State 18
Meets
Expectations
1i1 Number of Stack
Tests with Passing
Results
Data
Verification State 862
Meets
Expectations
1i2 Number of Stack
Tests with Failing
Results
Data
Verification State 1
Meets
Expectations
1i3 Number of Stack
Tests with Pending
Results
Data
Verification State 0
Meets
Expectations
1i4 Number of Stack
Tests with No
Results Reported
Data
Verification State 0
Meets
Expectations
1i5 Number of Stack
Tests Observed &
Reviewed
Data
Verification State 485
Meets
Expectations
1i6 Number of Stack
Tests Reviewed
Only
Data
Verification State 378
Meets
Expectations
1j
Number of Title V
Annual Compliance
Certifications
Reviewed
Data
Verification State 341
Meets
Expectations
2a
Major Sources
Missing CMS
Source Category
Code
Review
Indicator State 1
Meets
Expectations Supplemental file
selection
3a1 Timely Entry of
HPV
Determinations
Review
Indicator State 2
State
Improvement
Two-thirds of
HPVs entered late
into AFS (> 60
days)
10
3a2 Untimely Entry of
HPV
Determinations Goal State 0 4
State
Improvement
Two-thirds of
HPVs entered late
into AFS (> 60
days).
Supplemental file
selection.
3b1
Timely Reporting of
Compliance
Monitoring
Minimum Data
Requirements
Goal State 100% 80% 94.3% 870 923 53 Meets
Expectations
All of the late
entries are Title V
Annual
Compliance
Certification
reviews.
Timeframes range
from 61 to 436
days late.
Supplemental file
selection.
3b2
Timely Reporting of
Stack Test
Minimum Data
Requirements
Goal State 100% 73.1% 100% 863 863 0 Meets
Expectations
3b3
Timely Reporting of
Enforcement
Minimum Data
Requirements
Goal State 100% 73.7% 100% 35 35 0 Meets
Expectations
5a FCE Coverage
Major Goal State 100% 90.4% 100% 310 310 0
Meets
Expectations
5b FCE Coverage SM-
80 Goal State 100% 93.4% 100% 201 201 0
Meets
Expectations
5c FCE Coverage
Synthetic Minors
(non SM-80) Goal State 100% 53.8% 0/0 0 0 0
Meets
Expectations NA
5d FCE Coverage
Minors Goal State 100% 26.7% 0/0 0 0 0
Meets
Expectations NA
11
5e
Review of Title V
Annual Compliance
Certifications
Completed
Goal State 100% 81.8% 99.7% 306 307 1 Meets
Expectations
7b1
Alleged Violations
Reported Per
Informal
Enforcement
Actions (Tier I only)
Goal State 100% 59.7% 100% 14 14 0 Meets
Expectations
7b2 Alleged Violations
Reported Per Failed
Stack Tests
Review
Indicator State 40.8% 100% 1 1 0
Meets
Expectations
7b3 Alleged Violations
Reported Per HPV
Identified Goal State 100% 53.4% 100% 6 6 0
Meets
Expectations
8a HPV Discovery
Rate Per Major
Facility Universe
Review
Indicator State 4.3% 1.9% 6 316 310
State
Attention
Discovery rate is
below national
average, but EPA
makes HPV
determinations on
behalf of State.
8b
HPV Reporting
Indicator at Majors
with Failed Stack
Tests
Review
Indicator State 20.5% 0% 0 1 1
Meets
Expectations
10a
HPV cases which
meet the timeliness
goal of the HPV
Policy
Review
Indicator State 70.5% 87.5% 7 8 1
State
Attention
Only one HPV
exceeded the 270-
day timeline, and it
was just 8 days
late. The one
source that was
untimely was
selected as a
representative file,
and will be
discussed with the
state during the file
review
12
Resource Conservation and Recovery Act
Metric Metric Name Metric Type Agency National
Goal National
Average Alabama Count Universe
Not
Counted Initial
Finding Comments
1a1 Number of operating
TSDFs Data
Verification State 11
Meets SRF
Expectations
1a2 Number of active LQGs Data
Verification State 313
Meets SRF
Expectations
1a3 Number of active SQGs Data
Verification State 1130
Meets SRF
Expectations
1a4 All other active sites Data
Verification State 3483
Meets SRF
Expectations
1a5 Number of BR LQGs Data
Verification State 227
Meets SRF
Expectations
1b1 Number of sites
inspected Data
Verification State 294
Meets SRF
Expectations
1b2 Number of inspections Data
Verification State 301
Meets SRF
Expectations
1c1 Number of sites with new
violations during review
year
Data
Verification State 203
Meets SRF
Expectations
1c2
Number of sites in
violation at any time
during the review year
regardless of
determination date
Data
Verification State 219
Meets SRF
Expectations
1d1 Number of sites with
informal enforcement
actions
Data
Verification State 46
Meets SRF
Expectations
1d2 Number of informal
enforcement actions Data
Verification State 62
Meets SRF
Expectations
1e1 Number of sites with new
SNC during year Data
Verification State 19
Meets SRF
Expectations
13
1e2 Number of sites in SNC
regardless of
determination date
Data
Verification State 25
Meets SRF
Expectations
1f1 Number of sites with
formal enforcement
actions
Data
Verification State 10
Meets SRF
Expectations
1f2 Number of formal
enforcement actions Data
Verification State 10
Meets SRF
Expectations
1g Total dollar amount of
final penalties Data
Verification State $109,200
Meets SRF
Expectations
1h Number of final formal
actions with penalty in
last 1 FY
Data
Verification State 4
Meets SRF
Expectations
2a Long-standing secondary
violators Review
Indicator State 3
Area for
State
Attention
Discuss with state
during file review
5a Two-year inspection
coverage for operating
TSDFs Goal State 100% 88.9% 100% 11 11 0
Meets SRF
Expectations
5b Annual inspection
coverage for LQGs Goal State 20% 21.7% 48.9% 111 227 116
Meets SRF
Expectations
5c Five-year inspection
coverage for LQGs Goal State 100% 64.2% 100% 227 227 0
Meets SRF
Expectations
5d Five-year inspection
coverage for active SQGs Informational
Only State 10.9% 20% 226 1130 904
Meets SRF
Expectations
5e1 Five-year inspection
coverage at other sites
(CESQGs)
Informational
Only State 232
Meets SRF
Expectations
5e2 Five-year inspection
coverage at other sites
(Transporters)
Informational
Only State 42
Meets SRF
Expectations
5e3 Five-year inspection
coverage at other sites
(Non-notifiers)
Informational
Only State 6
Meets SRF
Expectations
14
5e4
Five-year inspection
coverage at other sites
(not covered by metrics
5a-5e3)
Informational
Only State 453
Meets SRF
Expectations
7b Violations found during
inspections Review
Indicator State 35.9% 61.9% 179 289 110
Meets SRF
Expectations
8a SNC identification rate Review
Indicator State 1.7% 4.8% 14 289 275
Meets SRF
Expectations
8b Timeliness of SNC
determinations Goal State 100% 78.7% 85.7% 18 21 3
Area for
State
Attention
Discuss with state
during file review
10a Timely enforcement
taken to address SNC Review
Indicator State 80% 83.2% 100% 10 10 0
Meets SRF
Expectations
15
Appendix B: File Metric Analysis
This section presents file metric values with EPA’s initial observations on program performance. Initial findings are developed by EPA at the conclusion
of the file review.
Initial findings are statements of fact about observed performance. They should indicate whether there is a potential issue and the nature of the issue. They
are developed after comparing the data metrics to the file metrics and talking to the state.
Final findings are presented above in the CWA Findings section.
Because of limited sample size, statistical comparisons among programs or across states cannot be made.
Clean Water Act
State: Alabama Year Reviewed: FY 2012
CWA
Metric
# Description Numerator Denominator
Metric
Value Goal
Initial
Findings Details
2b
Files reviewed where data are
accurately reflected in the national
data system: Percentage of files
reviewed where data in the file are
accurately reflected in the national data
systems
18 36 50.0% 95% State
Improvement
There are many discrepancies
between information in the
OTIS DFRs and the file - most
commonly related to names
and addresses; several did
have discrepancies between
compliance and enforcement
actions.
3a Timeliness of mandatory data
entered in the national data system 0 0 NA 100% NA
4a1 Pretreatment compliance inspections
and audits NA NA NA 100% NA
4a2 Significant industrial user (SIU)
inspections for SIUs discharging to
non-authorized POTWs 303 303 100.0% 100%
Meets
Expectations
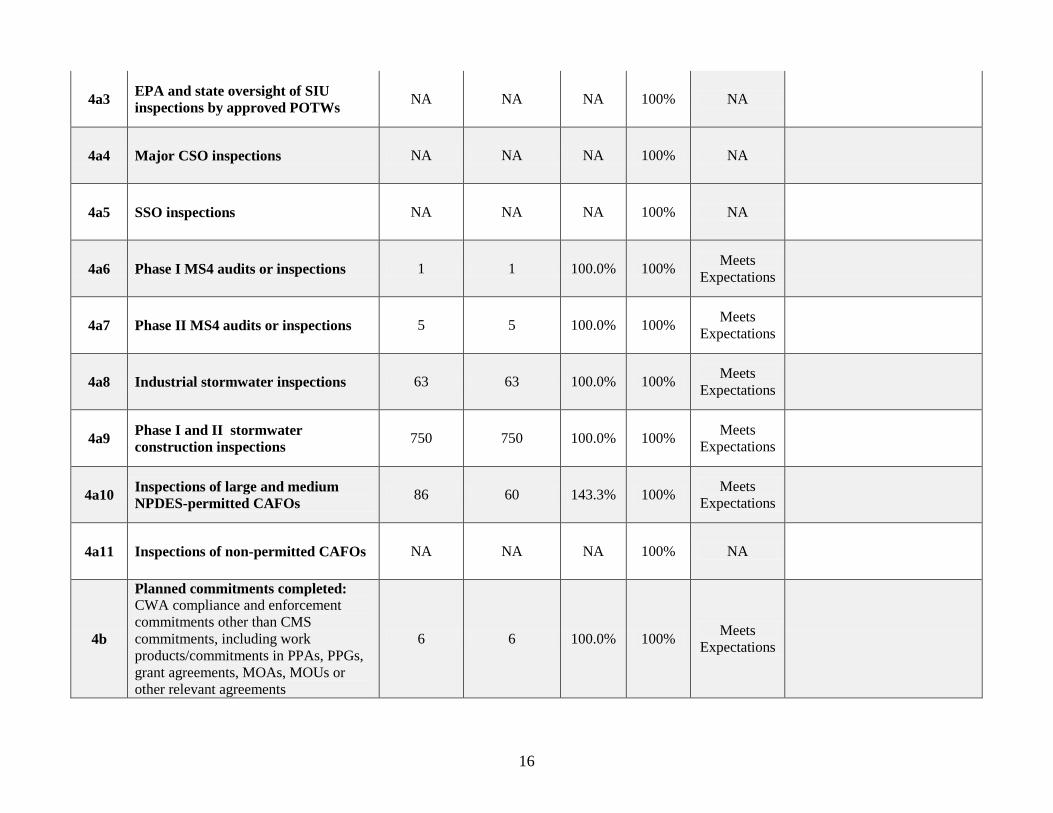
16
4a3 EPA and state oversight of SIU
inspections by approved POTWs NA NA NA 100% NA
4a4 Major CSO inspections NA NA NA 100% NA
4a5 SSO inspections NA NA NA 100% NA
4a6 Phase I MS4 audits or inspections 1 1 100.0% 100% Meets
Expectations
4a7 Phase II MS4 audits or inspections 5 5 100.0% 100% Meets
4a11 Inspections of non-permitted CAFOs NA NA NA 100% NA
4b
Planned commitments completed:
CWA compliance and enforcement
commitments other than CMS
commitments, including work
products/commitments in PPAs, PPGs,
grant agreements, MOAs, MOUs or
other relevant agreements
6 6 100.0% 100% Meets
Expectations
17
6a Inspection reports reviewed that
provide sufficient documentation to
determine compliance at the facility 34 34 100.0% 100%
While "sufficient" for
compliance determinations,
many inspection reports are
not "complete", i.e., the
checklist may be marked as
"yes or no" but it's difficult to
determine what was evaluated
during the inspection and why
the facility was compliant or
not - there is little or no
documentation on how a
compliance determination was
reached. Many reports do not
include important elements
such as a narrative describing
the field activities and
observations, permit status
(particularly when the permit
has expired), facility
description, identifying the
water body discharged to,
regulatory citations, permit
citations, dates and signatures,
etc.
6b
Inspection reports completed within
prescribed timeframe: Percentage of
inspection reports reviewed that are
timely
26 34 76.5% 100% State
Improvement
Many inspection reports are
not timely using 30 days for a
non-sampling inspection and
45 for sampling…2 of these
had no date for an inspection
report completion, therefore,
they are recorded as not
timely...
7e Inspection reports reviewed that led
to an accurate compliance
determination 31 34 91.2% 100%
Meets
Expectations Meets Expectations
18
8b Single-event violation(s) accurately
identified as SNC or non-SNC 22 22 100.0% 100%
Meets
Expectations
SEVs were not being entered
into ICIS….ADEM has
apparently made progress in
this area and SEVs data are
now flowing...
8c
Percentage of SEVs Identified as SNC
Reported Timely: Percentage of SEVs
accurately identified as SNC that were
reported timely
NA NA NA 100% NA NA - no SEVs were identified
as SNC…
9a Percentage of enforcement responses
that return or will return source in
SNC to compliance 16 28 57.1% 100%
State
Improvement
Many of the enforcement
responses have not returned
the source to compliance - in
several cases, there has been
no response to the State's
enforcement action and
noncompliance continues or
noncompliance continues
despite the State's actions.
There were 3 cases in which
compliance schedule
violations are ongoing and 1 in
which the State escalated but
after the review period.
10b Enforcement responses reviewed that
address violations in a timely manner 2 8 25.0% 100%
State
Improvement
6 of 8 State enforcement
actions were informal with no
supporting justification
documenting why a formal
action was not taken.
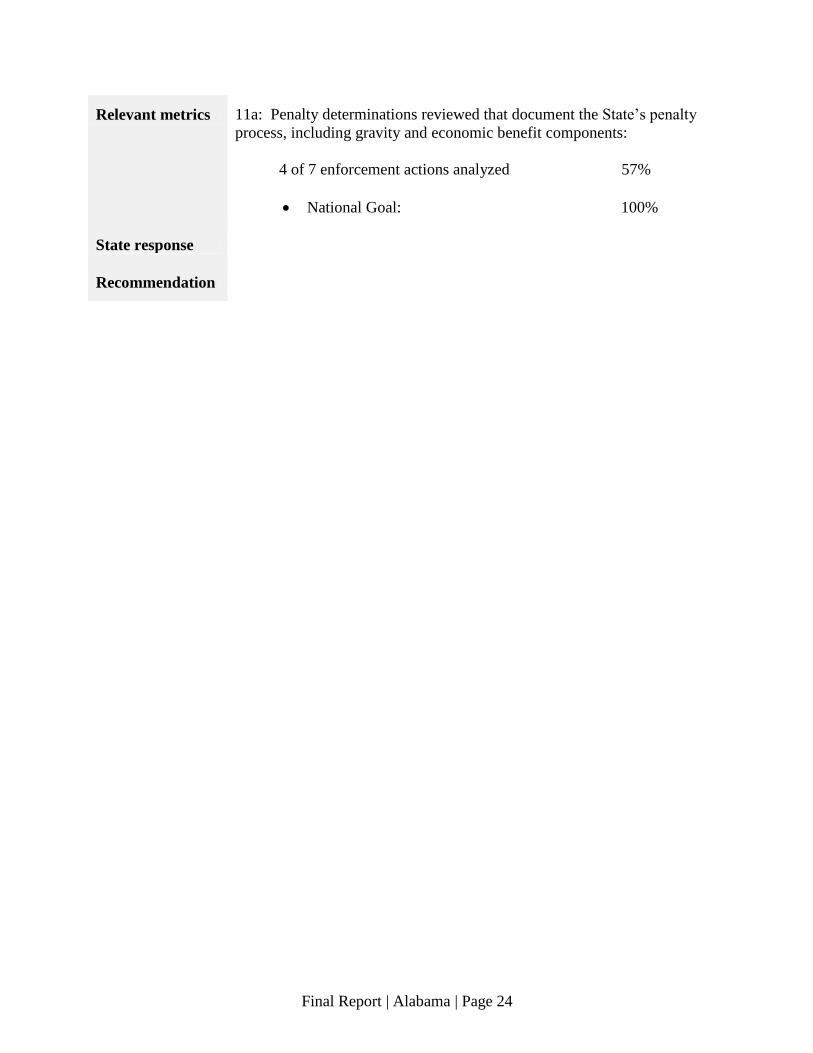
11a
Penalty calculations that include
gravity and economic benefit:
Percentage of penalty calculations
reviewed that consider and include,
where appropriate, gravity and
economic benefit
4 7 57.1% 100% State
Attention
1 muni case with no EB and 1
with partial EB (for failure to
sample but not eff vio), 2 older
mining cases with no Gravity
or EB. Methodologies are
now being implemented to
better document penalty
calculations…
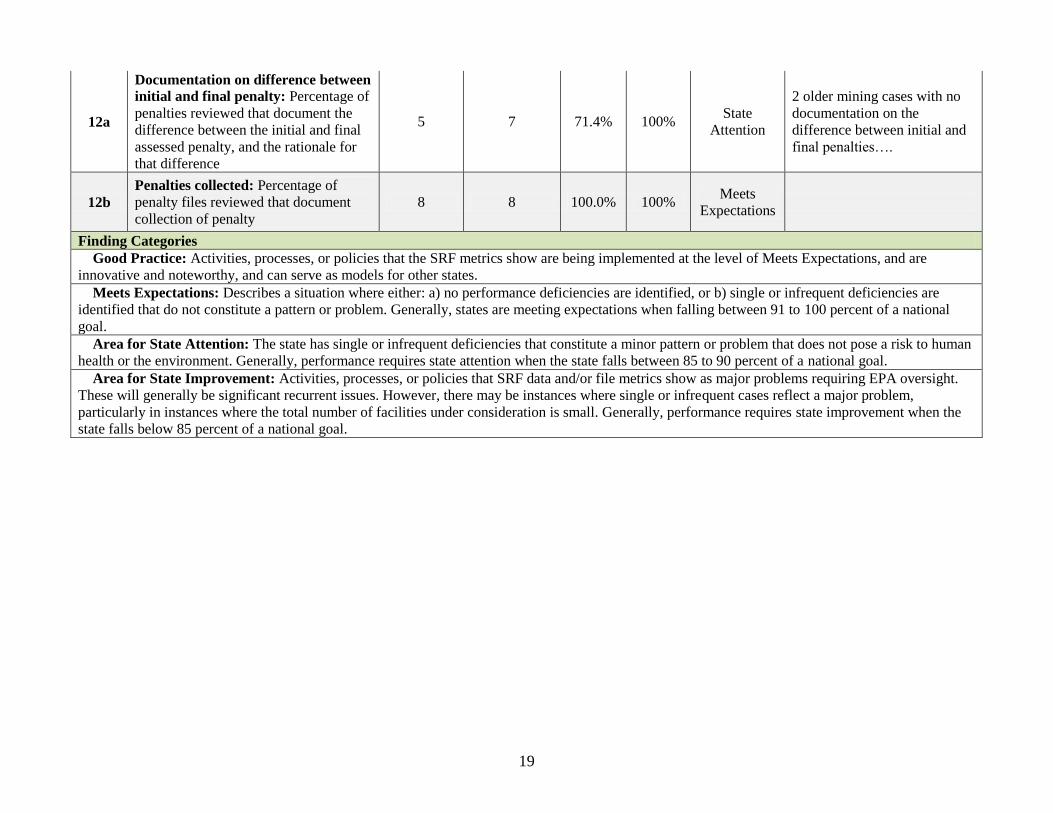
19
12a
Documentation on difference between
initial and final penalty: Percentage of
penalties reviewed that document the
difference between the initial and final
assessed penalty, and the rationale for
that difference
5 7 71.4% 100% State
Attention
2 older mining cases with no
documentation on the
difference between initial and
final penalties….
12b Penalties collected: Percentage of
penalty files reviewed that document
collection of penalty 8 8 100.0% 100%
Meets
Expectations
Finding Categories Good Practice: Activities, processes, or policies that the SRF metrics show are being implemented at the level of Meets Expectations, and are
innovative and noteworthy, and can serve as models for other states. Meets Expectations: Describes a situation where either: a) no performance deficiencies are identified, or b) single or infrequent deficiencies are
identified that do not constitute a pattern or problem. Generally, states are meeting expectations when falling between 91 to 100 percent of a national
goal. Area for State Attention: The state has single or infrequent deficiencies that constitute a minor pattern or problem that does not pose a risk to human
health or the environment. Generally, performance requires state attention when the state falls between 85 to 90 percent of a national goal. Area for State Improvement: Activities, processes, or policies that SRF data and/or file metrics show as major problems requiring EPA oversight.
These will generally be significant recurrent issues. However, there may be instances where single or infrequent cases reflect a major problem,
particularly in instances where the total number of facilities under consideration is small. Generally, performance requires state improvement when the
state falls below 85 percent of a national goal.
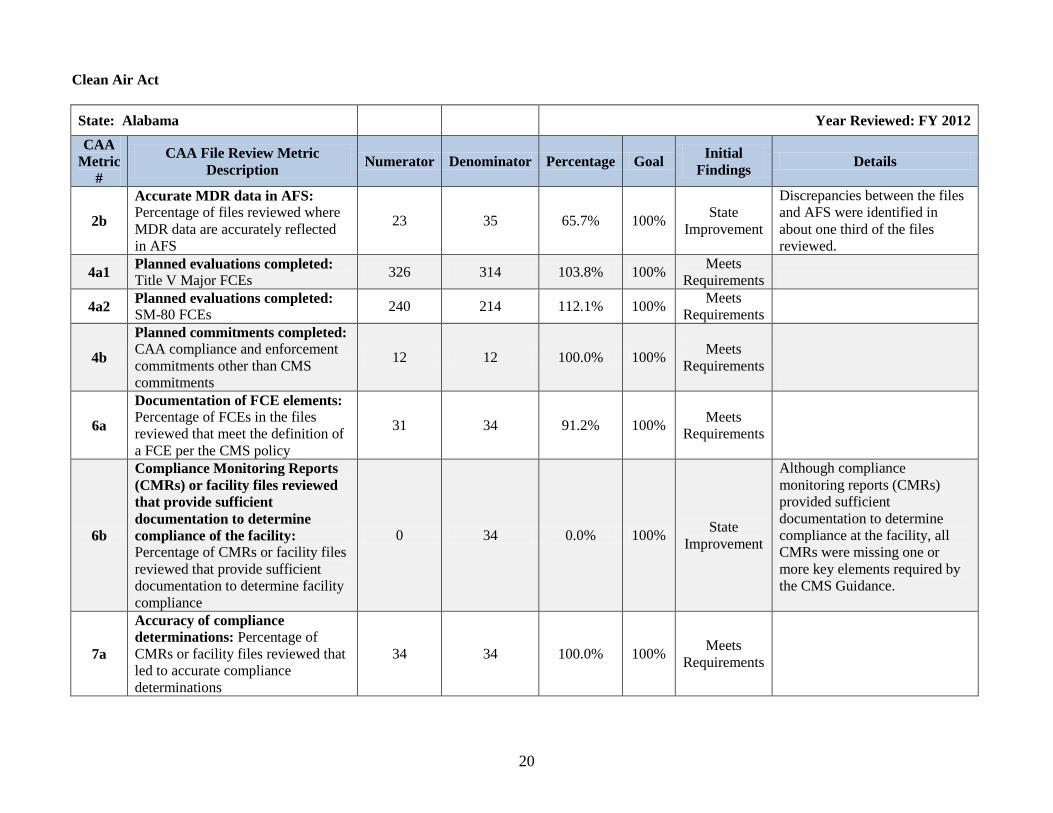
20
Clean Air Act
State: Alabama Year Reviewed: FY 2012
CAA
Metric
#
CAA File Review Metric
Description Numerator Denominator Percentage Goal
Initial
Findings Details
2b
Accurate MDR data in AFS:
Percentage of files reviewed where
MDR data are accurately reflected
in AFS
23 35 65.7% 100% State
Improvement
Discrepancies between the files
and AFS were identified in
about one third of the files
reviewed.
4a1 Planned evaluations completed:
Title V Major FCEs 326 314 103.8% 100%
Meets
Requirements
4a2 Planned evaluations completed: SM-80 FCEs
240 214 112.1% 100% Meets
Requirements
4b
Planned commitments completed: CAA compliance and enforcement
commitments other than CMS
commitments
12 12 100.0% 100% Meets
Requirements
6a
Documentation of FCE elements:
Percentage of FCEs in the files
reviewed that meet the definition of
a FCE per the CMS policy
31 34 91.2% 100% Meets
Requirements
6b
Compliance Monitoring Reports
(CMRs) or facility files reviewed
that provide sufficient
documentation to determine
compliance of the facility: Percentage of CMRs or facility files
reviewed that provide sufficient
documentation to determine facility
compliance
0 34 0.0% 100% State
Improvement
Although compliance
monitoring reports (CMRs)
provided sufficient
documentation to determine
compliance at the facility, all
CMRs were missing one or
more key elements required by
the CMS Guidance.
7a
Accuracy of compliance
determinations: Percentage of
CMRs or facility files reviewed that
led to accurate compliance
determinations
34 34 100.0% 100% Meets
Requirements
21
8c
Accuracy of HPV determinations: Percentage of violations in files
reviewed that were accurately
determined to be HPVs
9 9 100.0% 100% Meets
Requirements
9a
Formal enforcement responses
that include required corrective
action that will return the facility
to compliance in a specified time
frame: Percentage of formal
enforcement responses reviewed
that include required corrective
actions that will return the facility to
compliance in a specified time
frame
14 14 100.0% 100% Meets
Requirements
10a
Timely action taken to address
HPVs: Percentage of HPV
addressing actions that meet the
timeliness standard in the HPV
Policy
7 8 87.5% 100% Meets
Requirements
10b
Appropriate Enforcement
Responses for HPVs: Percentage of
enforcement responses for HPVs
that appropriately address the
violations
8 8 100.0% 100% Meets
Requirements
11a
Penalty calculations reviewed that
consider and include gravity and
economic benefit: Percentage of
penalty calculations reviewed that
consider and include, where
appropriate, gravity and economic
benefit
0 14 0.0% 100% State
Improvement
ADEM did not consider and
document economic benefit
using the BEN model or other
method which produces results
consistent with national policy
and guidance.
12a
Documentation on difference
between initial and final penalty
and rationale: Percentage of
penalties reviewed that document
the difference between the initial
and final assessed penalty, and the
rationale for that difference
5 14 35.7% 100% State
Improvement
The rationale for any
differences between the initial
and final penalty is not
consistently documented.
22
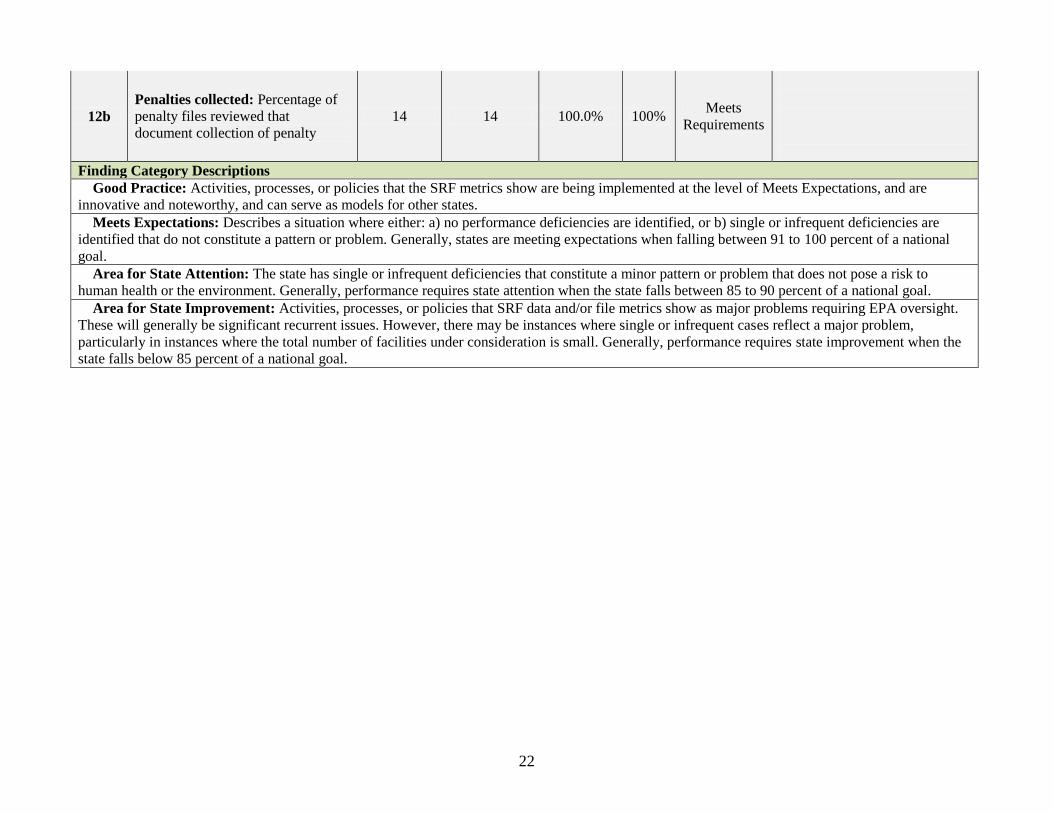
12b Penalties collected: Percentage of
penalty files reviewed that
document collection of penalty 14 14 100.0% 100%
Meets
Requirements
Finding Category Descriptions Good Practice: Activities, processes, or policies that the SRF metrics show are being implemented at the level of Meets Expectations, and are
innovative and noteworthy, and can serve as models for other states. Meets Expectations: Describes a situation where either: a) no performance deficiencies are identified, or b) single or infrequent deficiencies are
identified that do not constitute a pattern or problem. Generally, states are meeting expectations when falling between 91 to 100 percent of a national
goal. Area for State Attention: The state has single or infrequent deficiencies that constitute a minor pattern or problem that does not pose a risk to
human health or the environment. Generally, performance requires state attention when the state falls between 85 to 90 percent of a national goal. Area for State Improvement: Activities, processes, or policies that SRF data and/or file metrics show as major problems requiring EPA oversight.
These will generally be significant recurrent issues. However, there may be instances where single or infrequent cases reflect a major problem,
particularly in instances where the total number of facilities under consideration is small. Generally, performance requires state improvement when the
state falls below 85 percent of a national goal.
23
Resource Conservation and Recovery Act
State: Alabama Year Reviewed: FY 2012
RCRA
Metric
# Name and Description Numerator Denominator
Metric
% Goal
Initial
Findings Details
2b
Accurate entry of mandatory data:
Percentage of files reviewed where
mandatory data are accurately
reflected in the national data system
8 35 22.9% 100% Area for
Improvement
3a
Timely entry of mandatory data:
Percentage of files reviewed where
mandatory data are entered in the
national data system in a timely
manner
0 0 N/A 100% Cannot make a finding, no
method to determine timeliness
data entry in file review.
4a
Planned non-inspection
commitments completed: Percentage
of non-inspection commitments
completed in the review year
3 3 100.0% 100% Meets
Requirements
The enforcement activities in
the grant workplan are
projections, rather than
commitments, which are
outside the control of ADEM.
Counting actual activities
rather than grant categories,
ADEM completed 99% of the
grant projections.
6a
Inspection reports complete and
sufficient to determine compliance:
Percentage of inspection reports
reviewed that are complete and
provide sufficient documentation to
determine compliance
29 31 93.5% N/A Meets
Requirements
6b
Timeliness of inspection report
completion: Percentage of inspection
reports reviewed that are completed in
a timely manner
32 34 94.1% 100% Meets
Requirements
7a
Accurate compliance
determinations: Percentage of
inspection reports reviewed that led to
accurate compliance determinations
35 35 100.0% 100% Meets
Requirements
24
8c
Appropriate SNC determinations:
Percentage of files reviewed in which
significant noncompliance (SNC)
status was appropriately determined
during the review year
22 25 88.0% 100% Area for
Attention
Three facilities were not
identified as SNC, and were
addressed through informal
enforcement by the state
9a
Enforcement that returns SNC sites
to compliance: Percentage of
enforcement responses that have
returned or will return a site in SNC to
compliance
19 19 100.0% 100% Meets
Requirements
9b
Enforcement that returns SV sites to
compliance: Percentage of
enforcement responses that have
returned or will return a secondary
violator to compliance
12 12 100.0% 100% Meets
Requirements
10b
Appropriate enforcement taken to
address violations: Percentage of files
with enforcement responses that are
appropriate to the violations
32 35 91.4% 100% Meets
Requirements
Three facilities were not
identified as SNC, and were
addressed through informal
enforcement by the state
11a
Penalty calculations include gravity
and economic benefit: Percentage of
reviewed penalty calculations that
consider and include, where
appropriate, gravity and economic
benefit
3 18 16.7% 100% Area for
Improvement
12a
Documentation on difference
between initial and final penalty:
Percentage of penalties reviewed that
document the difference between the
initial and final assessed penalty, and
the rationale for that difference
0 14 0.0% 100% Area for
Improvement No initial penalties for review
to compare with final order
12b Penalties collected: Percentage of
files that document collection of
penalty 15 16 93.8% 100%
Meets
Requirements
Finding Categories Good Practice: Activities, processes, or policies that the SRF metrics show are being implemented at the level of Meets Expectations, and are
innovative and noteworthy, and can serve as models for other states.
25
Meets Expectations: Describes a situation where either: a) no performance deficiencies are identified, or b) single or infrequent deficiencies are
identified that do not constitute a pattern or problem. Generally, states are meeting expectations when falling between 91 to 100 percent of a national
goal. Area for State Attention: The state has single or infrequent deficiencies that constitute a minor pattern or problem that does not pose a risk to
human health or the environment. Generally, performance requires state attention when the state falls between 85 to 90 percent of a national goal.
Area for State Improvement: Activities, processes, or policies that SRF data and/or file metrics show as major problems requiring EPA oversight.
These will generally be significant recurrent issues. However, there may be instances where single or infrequent cases reflect a major problem,
particularly in instances where the total number of facilities under consideration is small. Generally, performance requires state improvement when the
state falls below 85 percent of a national goal.
26
Appendix C: File Selection
Files are selected according to a standard protocol using a web-based file selection tool. These are designed to provide consistency and transparency to the
process. Based on the description of the file selection process below, states should be able to recreate the results in the table.
Clean Water Act
File Selection Process
Using the OTIS File Selection Tool, 40 FY 2012 Representative Files were selected for review as part of Round 3 of the Alabama State Review
Framework (SRF) review to be conducted from May 13 - 17, 2013. As specified in the SRF File Selection Protocol, between 35 and 40 files are to be
selected for a state with a universe greater than 1,000 facilities. Since Alabama’s universe is greater than 1,000; 40 files were selected for the SRF review
and between 35 and 40 files will be reviewed during the on-site file review. The Permit Quality Review (PQR)/SRF Integrated File Selection Process calls
for additional files to be selected and reviewed as part of the integrated review. Common files that will be reviewed by permits and enforcement staff
include files selected for the PQR core review and additional files randomly selected from the Regional Topics.
There are 190 major individual permits, 1,401 non-major individual permits and 15,366 non-major general permits in the Alabama universe of facilities.
Of the 40 files to review: 55 percent (or 22) of the files selected are majors, and 45 percent (or 18) of the files are non-majors.
For the major facilities, the Alabama universe was sorted based on Inspections, Significant Noncompliance (SNC), Single Event Violations (SEV),
Violations, Informal/Formal Actions and Penalties. Twenty-two major facilities were then randomly selected for a file review.
For non-major facilities, the Alabama universe was also sorted based on Inspections, SNC, SEVs, Violations, Informal/Formal Actions and Penalties.
Eighteen non-major facilities were then randomly selected for a file review.
Using the sorting criteria noted above, the 40 facilities selected for the SRF file review include facilities with a total of 37 inspections, 28 violations, 1
Of the 40 files selected for the SRF review, 14 of the files include those selected for the integrated PQR/SRF review as follows: 9 are Core Permits, and 5
permits are covered by Regional Topics (i.e., Compliance Schedules, Quarry/Sand and Gravel Mines, and Coal Bed Methane). The remaining files were
selected for SRF review purposes; however, several files selected for the SRF review will include a focus on major facilities with timely action as
appropriate and storm water construction general permits.
27
CWA File Selection Table
# ID Number Facility Name City Univer
se
Permit
Componen
ts
Inspectio
ns
Violati
on
Single
Event
Violatio
ns
SNC Inform
al
Action
s
Forma
l
Actio
ns
Penaltie
s
1 AL000011
6
DECATUR
FACILITY
(ASCEND)
DECATUR Major 1 No 0 No 0 0 0
2 AL000086
8
ARCLIN USA
INC
RIVER
FALLS
Major 1 Yes 0 SNC 0 0 0
3 AL000284
4
POWER
SOUTH
ENERGY
COOPERATI
VE
ANDALUSIA Non-
Major
1 Yes 0 Categor
y 1
1 0 0
4 AL002004
4
ENTERPRISE
SOUTHEAST
LAGOON
ENTERPRISE Major POTW,
Pretreatme
nt
2 Yes 0 SNC 0 1 16400
5 AL002015
0
GUNTERSVI
LLE WWTP
GUNTERSVI
LLE
Major Biosolids,
POTW,
Pretreatme
nt
2 Yes 0 No 1 0 0
6 AL002099
1
BRIDGEPOR
T LAGOON
BRIDGEPOR
T
Major POTW,
Pretreatme
nt
2 Yes 0 No 2 0 0
7 AL002199
7
MASLAND
CARPETS
INC
ATMORE Major 1 Yes 0 No 1 0 0
8 AL002220
9
PHENIX
CITY WWTP
PHENIX
CITY
Major POTW,
Pretreatme
nt
1 Yes 1 No 1 0 0
9 AL002276
4
OMMUSSEE
CREEK
(DOTHAN)
DOTHAN Major Biosolids,
POTW,
Pretreatme
nt
1 No 0 No 0 0 0
1
0
AL002311
6
HELENA
WWTP
HELENA Major POTW,
Pretreatme
nt
1 Yes 0 SNC 1 0 0
1
1
AL002458
9
COLUMBIAN
A WWTP
COLUMBIAN
A
Major POTW,
Pretreatme
nt
1 Yes 0 No 0 0 0
28
1
2
AL002478
3
J AND M
CYLINDERS
GASES INC
DECATUR Non-
Major
1 Yes 0 Categor
y 1
1 0 0
1
3
AL002598
4
TUSKEGEE
SOUTH
WPCP
TUSKEGEE Major POTW,
Pretreatme
nt
1 Yes 0 SNC 0 1 175000
1
4
AL002659
0
JIM WALTER
MINE 4
BROOKWOO
D
Major 2 Yes 0 SNC 1 0 0
1
5
AL002772
3
PINE CREEK
WASTEWAT
ER TRMT
PLT
PRATTVILLE Major Biosolids,
POTW,
Pretreatme
nt
1 Yes 0 No 1 0 0
1
6
AL002797
9
DEEP SEA
FOODS INC
BAYOU LA
BATRE
Non-
Major
1 Yes 0 Categor
y 1
1 0 0
1
7
AL004084
3 (Core)
HANCEVILL
E FACILITY
(AM.
PROTEIN)
HANCEVILL
E
Major 3 Yes 0 No 1 0 0
1
8
AL004410
5
BRUNDIDGE
WWTP
BRUNDIDGE Non-
Major
POTW,
Pretreatme
nt
2 Yes 0 No 1 0 0
1
9
AL004750
3
EVERGREEN
LAGOON
EVERGREEN Major POTW,
Pretreatme
nt
1 Yes 0 No 0 0 0
2
0
AL005013
0
OPELIKA
WESTSIDE
WWTP
OPELIKA Major POTW,
Pretreatme
nt
1 Yes 0 No 0 0 0
2
1
AL005042
3
CULLMAN
WWTP
CULLMAN Major Biosolids,
POTW,
Pretreatme
nt
2 Yes 0 SNC 1 0 0
2
2
AL005093
8
CALERA
POLLUTION
CONTROL
PLANT
CALERA Major POTW,
Pretreatme
nt
1 Yes 0 SNC 1 0 0
2
3
AL005433
0 (Core)
FOX
VALLEY
APARTMEN
TS LAGOON
MAYLENE Non-
Major
0 Yes 0 Categor
y 1
1 0 0
2
4
AL005463
1
CLANTON
CITY OF
CLANTON Major POTW,
Pretreatme
1 Yes 0 SNC 1 0 0
29
nt
2
5
AL005585
9
MOBILE
FACILITY
(SHELL)
SARALAND Major 1 No 0 No 0 0 0
2
6
AL005619
7
CUMBERLA
ND HEALTH
AND REHAB
BRIDGEPOR
T
Non-
Major
1 Yes 0 No 0 0 0
2
7
AL005687
1
CAHABA
PARK WEST
LAGOON
SELMA Non-
Major
1 Yes 0 Categor
y 1
2 0 0
2
8
AL005765
7
ATTALLA
WASTEWAT
ER
TREATMENT
LAGOON
RAINBOW
CITY
Major POTW,
Pretreatme
nt
1 Yes 0 SNC 1 0 0
2
9
AL005772
0
AUTAUGAVI
LLE WWTP
AUTAUGAVI
LLE
Non-
Major
POTW,
Pretreatme
nt
0 Yes 0 Categor
y 1
0 1 2400
3
0
AL005840
8
OXFORD
TULL C
ALLEN
WWTP
OXFORD Major POTW,
Pretreatme
nt
1 Yes 0 SNC 0 1 20450
3
1
AL006021
6
MAXWELL
CROSSING
FACILITY
BUHL Non-
Major
1 No 0 No 0 0 0
3
2
AL006178
6
MINE NO. 1
(TACOA
MINERALS)
MONTEVAL
LO
Non-
Major
1 No 0 No 0 1 75000
3
3
AL006890
0
NORTH
ALABAMA
SAND AND
GRAVEL
PHIL
CAMPBELL
Non-
Major
2 No 0 No 0 1 40000
3
4
AL007323
7
MALBIS PIT SPANISH
FORT
Non-
Major
1 No 0 No 1 0 0
3
5
AL007567
1
MADISON
MATERIALS
GUNTERSVI
LLE
QUARRY
GUNTERSVI
LLE
Non-
Major
1 No 0 No 1 1 16250
30
3
6
AL007775
5
RUSSELL
MATERIALS
PIT
KENT Non-
Major
1 No 0 No 0 0 0
3
7
AL007814
0
COOSA
VALLEY
WATER
TRMT PLT
RAGLAND Non-
Major
0 Yes 0 Categor
y 1
2 0 0
3
8
ALR10732
6
HONS AT
SAVANNAH
WOODS
SPANISH
FORT
Non-
Major
3 No 0 No 3 0 0
3
9
ALR16EB
XG
LESLIE
GREENE
CUTRATE
GRADING
PHENIX
CITY,
Non-
Major
2 No 0 No 0 2 27000
4
0
ALR16EG
RK
PARK PLACE ENTERPRISE Non-
Major
3 No 0 No 0 1 24800
31
Clean Air Act
File Selection Process
Using the OTIS File Selection Tool, 35 files were selected for review during the April 2013 file review visit (28 representative and 7 supplemental). As
specified in the File Selection Protocol, since the Alabama universe includes 584 sources, 30 to 35 files must be reviewed.
Representative Files
The file review will focus on sources with compliance and enforcement activities occurring during the review period (FY12). Therefore, the targeted
number of representative files to review was determined to be approximately 30, with 5 available for supplemental review.
Enforcement files: In order to select files with enforcement related activity, the facility list was sorted to identify those sources that had a formal
enforcement action during the review period. There were 14 Tier 1 sources with a formal enforcement action in FY12, so all of these were selected for
review.
Compliance files: There were about 570 remaining sources with full compliance evaluations (FCEs) during FY12. This list was sorted by universe
(major, SM, etc.), and every 38th file was selected, resulting in 14 additional representative files.
Supplemental Files
Metric 2a: The Data Metrics Analysis (DMA) indicated 1 major source that was missing the CMS source category code, so this was selected for
supplemental review (0107100010).
Metric 3a2: The DMA identified 4 sources that had an untimely High Priority Violation (HPV) entry in AFS. All but one had already been selected as
representative files because they had a formal enforcement action. The remaining source (0100300039) took 107 days to enter the HPV, and it did not
have a formal enforcement action, so it was selected for supplemental review.
Metric 3b1: The DMA identified 53 sources with late compliance monitoring activity data entry. All of these sources had a late Title V Annual
Compliance Certification (ACC) review, so two of these were selected for supplemental review (0109708026 & 0111700004) to facilitate further
discussion with the State during the file review.
Universe Distribution: A review of the representative and supplemental files selected indicated a preponderance of Major sources, and only 7 SM
sources, so 3 additional SM sources were randomly selected for supplemental review (0100100005, 0105900010, & 0110100025), bringing the total
If you have any questions, please give me a call at 404-562-9054.
Thanks,
Kelly
July 26, 2013 Marilyn, Just wanted to follow-up on a couple SRF related items. One is the penalty calculation issue. Did you get a chance to talk with your RCRA and CAA folks about their documentation of economic benefit and the documentation between the initial and final penalties? Before we finalize our language for those two Elements of the report, I wanted to be sure we had all the documents available for review. Secondly, if you could fill out the State background information in the attachment by August 15th and return it to Becky Hendrix, that would be very helpful. Please give me a call if you have any questions or want to discuss further. Thanks, Kelly