Realizing Health Reform’s Potential DECEMBER 2010 For more information about this study, please contact: Cathy Schoen Senior Vice President Policy, Research, and Evaluation The Commonwealth Fund [email protected]The mission of The Commonwealth Fund is to promote a high performance health care system. The Fund carries out this mandate by supporting independent research on health care issues and making grants to improve health care practice and policy. Support for this research was provided by The Commonwealth Fund. The views presented here are those of the authors and not necessarily those of The Commonwealth Fund or its directors, officers, or staff. To learn more about new publications when they become available, visit the Fund's Web site and register to receive e-mail alerts. Commonwealth Fund pub. 1456 Vol. 104 State Trends in Premiums and Deductibles, 2003–2009: How Building on the Affordable Care Act Will Help Stem the Tide of Rising Costs and Eroding Benefits Cathy Schoen, Kristof Stremikis, Sabrina K. H. How, and Sara R. Collins Abstract: Rapidly rising health insurance costs have strained U.S. families and employers in recent years. This issue brief examines data for all states on changes in private employer pre- miums and deductibles for 2003 and 2009. The analysis finds that premiums for businesses and their employees increased 41 percent across states from 2003 to 2009, while per-person deductibles jumped 77 percent in large as well as small firms. If these trends continue at the rate prior to enactment of the Affordable Care Act, the average premium for family coverage will rise 79 percent by 2020, to more than $23,000. The authors describe how health reform offers the potential to reduce insurance cost growth while improving value and protection. If reforms succeed in slowing premium growth by 1 percentage point annually in all states, by 2020 employers and families together will save $2,323 annually for family coverage, compared with projected trends. OVERVIEW Across the United States, middle-income individuals and families have been los- ing ground as the cost of health insurance continues to grow faster than incomes. 1 Rising employer insurance premiums have meant that many working families have been forced to trade off increases in their wages just to hold onto their health ben- efits. 2 The expanding share of premiums paid by workers themselves has also taken a greater cut out of paychecks. 3 In state after state, premiums are up as a share of median household income, making it difficult for many U.S. families to save for education or retirement—or simply to meet day-to-day living expenses. 4 At the same time, job-based insurance affords less protection than before—per person deductibles are up sharply in almost all states, especially for health plans offered by small firms. E M B A R G O E D Not for release before 12:01 a.m. ET, Thursday, December 2, 2010
Transcript
Realizing Health Reform’s Potential DECEMBER 2010
For more information about this study, please contact:
The mission of The Commonwealth Fund is to promote a high performance health care system. The Fund carries out this mandate by supporting independent research on health care issues and making grants to improve health care practice and policy. Support for this research was provided by The Commonwealth Fund. The views presented here are those of the authors and not necessarily those of The Commonwealth Fund or its directors, officers, or staff.
To learn more about new publications when they become available, visit the Fund's Web site and register to receive e-mail alerts.
Commonwealth Fund pub. 1456 Vol. 104
State Trends in Premiums and Deductibles, 2003–2009: How Building on the Affordable Care Act Will Help Stem the Tide of Rising Costs and Eroding Benefits
Cathy Schoen, Kristof Stremikis, Sabrina K. H. How, and Sara R. Collins
Abstract: Rapidly rising health insurance costs have strained U.S. families and employers in recent years. This issue brief examines data for all states on changes in private employer pre-miums and deductibles for 2003 and 2009. The analysis finds that premiums for businesses and their employees increased 41 percent across states from 2003 to 2009, while per-person deductibles jumped 77 percent in large as well as small firms. If these trends continue at the rate prior to enactment of the Affordable Care Act, the average premium for family coverage will rise 79 percent by 2020, to more than $23,000. The authors describe how health reform offers the potential to reduce insurance cost growth while improving value and protection. If reforms succeed in slowing premium growth by 1 percentage point annually in all states, by 2020 employers and families together will save $2,323 annually for family coverage, compared with projected trends.
OVERVIEWAcross the United States, middle-income individuals and families have been los-ing ground as the cost of health insurance continues to grow faster than incomes.1 Rising employer insurance premiums have meant that many working families have been forced to trade off increases in their wages just to hold onto their health ben-efits.2 The expanding share of premiums paid by workers themselves has also taken a greater cut out of paychecks.3 In state after state, premiums are up as a share of median household income, making it difficult for many U.S. families to save for education or retirement—or simply to meet day-to-day living expenses.4 At the same time, job-based insurance affords less protection than before—per person deductibles are up sharply in almost all states, especially for health plans offered by small firms.
E M B A R G O E D Not for release before 12:01 a.m. ET,
Fortunately, the Affordable Care Act (ACA) contains a number of significant coverage and deliv-ery system reform provisions designed to reduce cost growth and provide financial protection, while improv-ing the quality of health care. The creation of state-based health insurance exchanges, the introduction of new market rules and consumer protections, and the expansion of state and federal oversight of industry practices will begin to increase value in U.S. health insurance markets.5 Further analysis suggests that the incentives for administrative efficiency and moderniza-tion included in the ACA have the potential to save businesses and families $2,000 or more in premium costs by 2019.6
Such savings, however, are not guaranteed. While the ACA provides a platform for change, the overall success of reform is contingent on a diverse set of stakeholders, both public and private, working together to ensure that markets operate in the public interest. Concerted action by private insurers and mul-tipayer initiatives will be essential to spread reforms that provide incentives to clinicians and hospitals to improve care and use resources prudently. The mul-titude of payment and delivery system innovations included in the new law have the potential to slow cost growth for private insurance as well as public programs, but to succeed as a whole they will need to undergo rapid testing, be highly coordinated, and receive ongo-ing oversight.
This issue brief examines recent trends in pri-vate employer–based health insurance premiums and projects future premium increases, state by state, if the nation fails to implement, build on, and spread reforms. It also projects the potential savings for families and employers—money on the table—if public and private sector payers working together succeed in reducing annual growth in health care costs by 1 to 1.5 percent-age points per year in each state while maintaining or improving benefits.7
As of 2009, the average premium was $13,027 a year for family coverage for private sector employers, ranging from $11,000 to over $14,000 across states. If insurance premiums for employer-sponsored health plans in each state continued to grow at the same aver-age annual rate seen from 2003 to 2009, the average premium for family coverage would rise to $23,342 by 2020—an increase of 79 percent.
On the other hand, if reform succeeds in slow-ing the annual rate of growth by 1 percentage point in all states, by 2020 annual savings on family health coverage could average $2,323, compared with pro-jected rates if trends over the past six years continue. If growth could be slowed by 1.5 percentage points, the savings would be even larger—$3,403 per year.
The past two decades provide strong evidence that cost pressures will continue absent a significant change in the way private insurance and markets func-tion. The ACA lays a foundation for such change and provides a platform for further reform.
HOW THIS STUDY WAS CONDUCTEDThis issue brief first presents recent premium and income trends by state for the under-65 population. The data for these trends come from the federal gov-ernment’s most recent annual surveys of employers—conducted for the insurance component of the Medical Expenditure Panel Survey (MEPS)—and from the U.S. Census Current Population Surveys of households. The premiums presented represent the total costs of the average private group health insurance premium for employer-sponsored coverage, including both the employer and employee shares. We also present average deductibles for employer-sponsored plans, with trends for small as well as larger firms. To assess the afford-ability of coverage for middle-income families, for each state we compared the total premium with median household income for the under-65 population, utiliz-ing a weighted average of single and family premiums compared with single and family household incomes.
State Trends in Premiums and Deductibles, 2003–2009 3
To calculate potential costs over the next decade if trends over 2003–09 continue, we estimated the size of insurance premiums by 2015 and 2020 if all states experienced annual increases equal to the average national increase seen from 2003 to 2009 (assuming the same inflation rate for all states). Next, we estimated the potential savings in the cost of fam-ily premiums if reforms spread to private and public insurers alike and succeed in slowing annual increases
Data source: 2009 Medical Expenditure Panel Survey–Insurance Component.
Exhibit 1. Premiums for Family Coverage, by State, 2009
Dollars
U.S. average = $13,027
Ark
ansa
sM
onta
naO
klah
oma
Nor
th D
akot
aSo
uth
Dak
ota
Haw
aii
Kans
asU
tah
Ohi
oId
aho
Ala
bam
aIo
wa
Tenn
esse
eN
ebra
ska
Sout
h Ca
rolin
aM
isso
uri
Kent
ucky
Wes
t Virg
inia
Mis
siss
ippi
Virg
inia
Calif
orni
aD
elaw
are
Nev
ada
Was
hing
ton
Ore
gon
Geo
rgia
Ariz
ona
New
Mex
ico
Indi
ana
Flor
ida
Nor
th C
arol
ina
Mic
higa
nM
inne
sota
Texa
sPe
nnsy
lvan
iaCo
lora
doM
aine
Rhod
e Is
land
Illin
ois
New
Jers
eyN
ew Y
ork
New
Ham
pshi
reM
aryl
and
Loui
sian
aCo
nnec
ticut
Ala
ska
Dis
tric
t of C
olum
bia
Wyo
min
gVe
rmon
tW
isco
nsin
Mas
sach
uset
ts
0
5,000
10,000
15,000
by 1 or 1.5 percentage points in each state. The tables at the end of this brief provide state-specific data. It is important to note that these estimates are presented for illustrative purposes only; we did not attempt to model the impact of reform at the state level, nor did we vary estimates for relatively higher- or lower-cost states.
This study updates and expands on a previous Commonwealth Fund analysis of health insurance pre-mium trends and projections for the next decade.8
4 The Commonwealth Fund
FINDINGS
Recent TrendsNational surveys have found that family premiums for employer-sponsored health coverages increased 52 per-cent from 2003 to 2009, while median family income rose 13 percent.9 Such a rapid increase in the cost of employer-sponsored health benefits has forced difficult choices at workplaces across the country. Studies indi-cate that slower growth in wages and lower savings for retirement (worker and employer contributions) have been part of the trade-off to preserve health benefits.10 Despite such trade-offs, the monthly cost of premiums paid by workers and their families is up, consuming an ever-greater share of any wage increases they might receive.11
At the state level, health insurance premiums for private firms have also risen rapidly, and far faster than wage increases for the middle-income under-65 population. In the six years from 2003 to 2009, total
family premiums for employer-sponsored plans rose a cumulative average of 41 percent (Table 1). The six-year increase in family premiums ranged from about 21 percent in the lowest-growth state (Delaware) to 59 percent in the highest-growth state (Louisiana). Seven states saw increases of 50 percent or more, and 23 states saw increases of 40 percent or more, well above the rate of income growth.
By 2009, the average employer-sponsored fam-ily premium across all states was $13,027, ranging from $14,000 to $14,700 in the six highest states (Alaska, Connecticut, Massachusetts, Vermont, Wisconsin, and Wyoming) and the District of Columbia to $11,000 to $12,000 in the 11 states with the lowest average private-employer family premium costs (Exhibit 1 and Table 1).12 Average family premiums in the highest-premium-cost states were about 23 percent above those of the lowest-cost states.
Workers with employer-sponsored health insurance typically do not see the total annual cost of
Data sources: 2003 and 2009 Medical Expenditure Panel Survey–Insurance Component (for total average premiums for employer-based health insurance plans, weighted by single and family household distribution); 2003–04 and 2009–2010 Current Population Surveys (for median household incomes for under-65 population).
Exhibit 2. Employer Premiums as Percentage of Median Household Income for Under-65 Population, 2003 and 2009
2003 2009
WA
OR ID
MT ND
WY
NV
CA UT
AZ NM
KS
NE
MN
MO
WI
TX
IA
IL IN
AR
LA
AL
SC TN
NC KY
FL
VA
OH
MI
WV
PA
NY
AK
MD
ME VT NH
MA RI
CT
DE
DC
HI
CO
GA MS
OK
NJ
SD
WA
OR ID
MT ND
WY
NV
CA UT
AZ NM
KS
NE
MN
MO
WI
TX
IA
IL IN
AR
LA
AL
SC TN
NC KY
FL
VA
OH
MI
WV
PA
NY
AK
ME
DE
DC
HI
CO
GA MS
OK
NJ
SD MA
RI CT
VT NH
MD
16%–17.9%14%–15.9%Less than 14%
18% or more
State Trends in Premiums and Deductibles, 2003–2009 5
the premium, since most employers pay a substantial share of it—on average, 70 percent for family cover-age and 81 percent for single coverage in 2010.13 Nevertheless, the steady increase in premiums has been consuming resources that employers might otherwise have earmarked for salary or wage increases, or for other benefits. When viewed relative to employees’ income, total premiums (including both the employer and employee shares) are up for middle-income fami-lies across the country. By 2009, there were 15 states in which the average annual premium for family cover-age equaled 20 percent or more of median household income for the under-65 population, compared with just three states in 2003 (Table 2). In 28 states, family premiums relative to incomes averaged 18 percent or more for middle-income, under-65 households.
By 2009, average premiums, including both single and family coverage, were at or above 18 per-cent of median income in 26 states. And no states had premiums averaging less than 14 percent of median income, down from 13 states in 2003. As illustrated in Exhibit 2, cost pressures are particularly acute in the South and the South-Central United States, where premium costs are high relative to incomes. The high ratio of premiums to income often reflects the rise in premiums, as well as median incomes that are below the national average (see Table 2 for median incomes). Notably, many states with premiums above the national average have family incomes below the national average.
With premiums increasing faster than incomes in all states—whether low-income or higher-income—health insurance is becoming less and less affordable. Premiums have gone up even while employers have asked workers to pay a greater share of health care costs—in the form of deductibles and copayments—or have reduced the generosity of benefits in an effort to moderate annual premium growth.
By 2009, premiums were paying for less in terms of financial protection than they had been at the start of the decade, and families were paying not only higher premiums but higher out-of-pocket costs for medical bills.14 Not only do 74 percent of workers now
have a deductible, compared with 52 percent in 2003, but per-person deductibles for private-employer health plans increased 77 percent on average from 2003 to 2009 (Table 3).
Notably, deductibles are up for people work-ing in larger firms (50 employees or more) as well as small firms (under 50 employees). In both sectors, the increase in deductibles per person averaged 80 percent (Table 4). Workers in small firms, however, are more likely to face high deductibles: in small firms across the states, the average health plan deductible was $1,283 by 2009. In all but seven states and the District of Columbia, the small-firm deductible averaged $1,000 or more; in nine states, the deductible aver-aged $1,500 or more (Table 4). In contrast, although deductibles have been increasing in larger firms, in most states the average deductible for single coverage was below $1,000 for firms with 50 or more employ-ees; similarly, family deductibles were lower for those insured through larger firms than in small firms. Thus, although deductibles are up sharply on average, there continues to be a wide spread between small and large firms in the size of deductibles (Exhibit 3).
Heading into the recession that began in December 2007, middle- and lower-income work-ing families were in a precarious position. Those with coverage through an employer faced a rising premium share and higher cost-sharing when they needed medi-cal care. At the same time, millions of workers who lost their job, or were otherwise no longer able to afford coverage, joined the ranks of the uninsured. From 2008 to 2009, the number of people with employment-based insurance fell by 6.6 million.15
Underscoring the consequences of higher premiums for living standards, median incomes have generally failed to keep up with the costs of living, not counting health care costs. From 2003 to 2009, median family incomes increased by less than 12.6 percent, on average—not enough to keep up with the general inflation rate in 29 states (Table 2).16 Stagnant incomes have left workers and their families with less money available for rent, mortgage payments, educa-tion, or daily living expenses.17
6 The Commonwealth Fund
Projected Increases over the Next DecadeAbsent successful implementation of the Affordable Care Act and the spread of reforms to private insurance markets and to other public payers, we project that, if historical trends continue, national per-person spend-ing on health insurance premiums will increase 79 percent from 2010 to 2020, or an average of 5.4 percent annually. In recent years, per-person spending increases in most states have followed national trends.
Using these national projections, and apply-ing the same rate of increase to all states, average total family premiums would reach $17,906 by 2015 and $23,342 by 2020 (Exhibit 4 and Table 5). Projections for family premiums in 2020 range from $19,654 in Arkansas to $26,380 in Massachusetts.
Realizing the Potential of Reform Fortunately, several significant coverage and delivery system reform provisions in the ACA could help mod-erate premium growth, help make premiums more affordable, and provide improved financial protection for insured individuals and families who now have ben-efit gaps, high deductibles, or limits on the medical care expenses their policies will cover.18 The new law fur-ther provides a platform on which to build and spread reforms to address concerns over the value and rising costs of coverage and medical care.
New restrictions on insurer administrative costs. The ACA places new standards on what health plans must spend on medical care, as opposed to administra-tion and profits. Beginning in 2010, health plans are required to report the proportion of premiums spent on items other than medical care—generally, clinical services, activities to improve quality of care, and all other nonadministrative costs. These reports will be publicly available online. The Department of Health and Human Services (HHS) will issue regulations that
0
500
1000
1500
2000
2500
3000
Data source: Medical Expenditure Panel Survey–Insurance Component, 2003 and 2009. Small is less than 50 employees.
Exhibit 3. Private Health Insurance Deductibles: State Averages by Firm Size and Household Type, 2003–2009
Small �rm Large �rm Small �rm Large �rm
$1,283
$2,662
$1,575 $1,610
$703
$452
$822$969
2003 2009
Single person plan Family plan
State Trends in Premiums and Deductibles, 2003–2009 7
explicitly define medical care, especially in the area of quality improvement activities, in addition to standard-ized methodologies for calculating the share of premi-ums spent on medical care. Beginning in January 2011, health plans in the large-group market that spend less than 85 percent of their premiums on medical care, as well as health plans in the small-group and individual markets that spend less than 80 percent on medical care, will be required to offer rebates to enrollees.
State review of premium increases. Beginning in 2010 the ACA requires the HHS secretary and the states to establish a process for annually reviewing “unreasonable” premium increases. A health insurer will be required to submit to the secretary and the rel-evant state a justification for any such increase prior to implementation, with the information to be posted on the insurer’s Web site. The law appropriates $250 million to HHS for state grants from 2010 to 2014 to review and approve premium increases; in August, HHS awarded grants of $1 million each to 45 states and the District of Columbia to begin implement-ing the review process.19 The review process includes
making recommendations to the new state insurance exchanges about whether particular carriers should be excluded from participating based on an observed pat-tern of excessive premium increases.
Medicaid expansion and premium and cost-shar-ing credits for comprehensive benefits. Beginning in 2014, low- and moderate-income households will benefit from new and affordable coverage options. Members of households with incomes up to $29,327 (for a fam-ily of four) will be eligible to enroll in Medicaid, while those in households earning up to $88,000 who lack employer coverage will for the first time be eligible for a federal subsidy to defray premium costs for plans sold through the new insurance exchanges (more on them below). Premium credits will cap the contribu-tions required of individuals and families at 3 percent of income for those earning just above $29,327 for a family of four; the cap will gradually increase to 9.5 percent, for households with income of $88,200. In addition, people in this income range will benefit from cost-sharing credits and caps on out-of-pocket
0
5,000
10,000
15,000
20,000
25,000
30,000
Data sources: Medical Expenditure Panel Survey–Insurance Component (premiums for 2003 and 2009); Premium estimates for 2015 and 2020 using 2003–09 historic average national growth rate.
Exhibit 4. Premiums for Family Coverage, 2003, 2009, 2015, and 2020
U.S. average Lowest state Highest state
$13,027
$10,969 $10,748
$15,077 $14,723
$20,237
$26,380
$19,654
$17,906
$23,342
$9,249$7,866
2003 2009
Health insurance premiums for family coverage
2015 2020
8 The Commonwealth Fund
spending. Benefit standards will limit out-of-pocket costs for insured individuals and families of all income levels.
State health insurance exchanges. The ACA requires each state to have a new health insurance exchange for individuals and for small employers, or a single exchange for both individuals and small employ-ers. In states that decline to establish the exchange themselves, the federal government will establish an exchange. It will be possible to buy coverage outside exchanges. However, whether sold inside or outside an exchange, plans will have to follow new insurance mar-ket rules that prohibit them from turning down anyone for coverage or from increasing premiums because of poor health. Insurance exchanges will offer a standard-ized choice of health plans that must meet essential benefit standards, helping to put small businesses on a more equal footing with larger employers when buying coverage. In 2014, states will open exchanges to com-panies with 50 or fewer employees and may in addition allow firms with up to 100 employees to participate.20 By 2016, all states must allow companies with 100 or fewer workers to buy coverage in the exchanges, and in 2017, states may open them to firms with more than 100 employees.
Health plans qualified to participate in the exchanges must provide the essential benefit package and offer plans at multiple coverage levels. In addi-tion, qualified health plans are required to report on implementation of new provider payment incentives or arrangements aimed at improving quality and health outcomes, improving patient safety, wellness programs, and reducing costs.
The broad guidelines that the ACA sets for the exchanges will be further defined by regulations issued later in 2010. But states will have considerable flexibility in designing their exchanges in ways that may help lower premiums and improve health care quality. For example, one of the risks to the exchanges is that they will attract a sicker-than-average group of people—a phenomenon known as adverse selection—which might eventually raise premiums for plans sold through the exchanges.21 The law contains a number
of provisions designed to prevent this from happen-ing, however, including market regulations that are the same inside the exchanges as they are for existing individual and small-group markets. In addition, the law enables so-called “risk adjustment” mechanisms to compensate insurance carriers with sicker-than-average enrollees. States may further reduce the potential for adverse selection by preventing the sale of plans outside the exchange.22
States will also have the flexibility to create other incentives for plans to increase value, which could help lower premiums offered through the exchanges. For example, states can restrict participation in the exchange to plans that offer innovative care systems and better value for the premium paid.23 And because there is likely to be considerable variation in plan deductibles and coinsurance—owing to the ACA’s four tiers of cost-sharing—states may choose to standardize health plans beyond the law’s requirements, in order to reduce complexity and make it easier for families to compare and select plans.24
Other provisions could also have some moder-ating influence on insurance premiums. These include the ACA requirement that each state exchange offer two multistate health plans, one of which must be non-profit, and an allocation of $6 billion in grant funding to encourage the creation of nonprofit consumer-oper-ated and -oriented plans (CO-OPs).
Payment and system reforms. The ACA includes a variety of reforms that will provide incentives and support for physicians and hospitals to join together to provide better care and use resources more prudently. These include new support for primary care physicians and community-based care to ensure timely access to care, with special emphasis on preventive care and improving health outcomes for people with chronic diseases. Payment incentives will also place a premium on safety of care and on avoidance of hospital readmis-sions resulting from care complications or a failure to follow up with discharged patients. Additional reforms include investment in electronic medical records and other forms of health information technology, as well as testing new payment methods capable of stimulating
State Trends in Premiums and Deductibles, 2003–2009 9
and supporting care systems that provide more acces-sible, safer care, deliver better outcomes, and moderate cost growth.
Looking AheadThe ACA opens the way for private insurers to lower overhead costs, innovate, and partner with health pro-viders to improve quality and value. But the overall suc-cess of the law will be contingent on public and private stakeholders working together to ensure that markets operate in the public interest, striving to improve popu-lation health, enhance patient experience, and slow cost growth. Achieving this “triple aim” will require the rapid testing and spread of innovative payment and delivery system reforms.
Previous estimates suggest that, if widely adopted, a combination of insurance market reforms, payment incentives, and delivery system changes could reduce national costs by an average of 1 to 1.5 percent-age points per year over the next decade—a target sim-ilar to one adopted by an industry coalition in 2009.25 If the ACA succeeds in “bending the cost curve” within this range, the result would be much-lower premium increases and potentially substantial increases in incomes, if savings accrued to families in the form of higher wages or salaries.
Exhibit 5. Projected Annual Savings in Family Premiums, 2015 and 2020
2015 2020 2015 2020U.S. average premium at historic rate $17,906 $23,342 $17,906 $23,342
1% slower growth 1.5% slower growthU.S. average premium with savings $16,911 $21,019 $16,431 $19,938
U.S. average savings –$995 –$2,323 –$1,475 –$3,403
Average savings for lowest 10 premium states (AR, MT, OK, ND, SD, HI, KS, UT, OH, ID)
–$888 –$2,072 –$1,316 –$3,036
Average savings for highest 10 premium states (MA, WI, VT, WY, DC, AK, CT, LA, MD, NH)
–$1,086 –$2,536 –$1,610 –$3,716
Data sources: 2009 Medical Expenditure Panel Survey–Insurance Component; Premium estimates for 2015 and 2020 using 2003–09 historic average national growth rate.
To project potential savings in each state, we calculated the differences in premiums under two sce-narios: 1) if premium growth slowed to 1 percentage point lower than projected annual rates of increase if historical trends continue; and 2) if premium growth slowed to 1.5 percentage points lower than historical rates of increase. Rather than estimating the premium savings to households and employers that might be possible in each state given its particular starting point, savings in each state were projected for both 2015 and 2020 using the same slower growth rates for all states.
In all states, reducing the rate of premium increase to either target would yield substantial savings compared with projected trends. If premium growth were to slow to 1 percentage point below the projected national growth rate, the cost of family coverage would drop an average of $995 annually by 2015 (Exhibit 5 and Table 7). Annual savings for families and employ-ers would increase to $2,323 by 2020. Average savings on family coverage premiums would range from $1,956 in Arkansas in 2020 to $2,625 in Massachusetts. Employers could use these savings to increase wages, contribute to retirement savings plans, or add jobs.
Even greater amounts could be saved if the annual premium growth rates were to slow by 1.5 percentage points. An average of $1,475 could be
10 The Commonwealth Fund
saved annually on family coverage by 2015. The sav-ings would more than double to $3,403 annually by 2020. Savings from family coverage premiums would range from $2,866 in Arkansas in 2020 to $3,847 in Massachusetts.
Because this analysis did not model the impact of potential reforms at the state level, the projected savings for each state must be viewed with caution. To the extent that there might be further room to achieve savings from delivering more cost-effective care in higher-cost states, the potential gains might be greater compared with those states that started the decade with relatively lower costs. Regardless of the starting point, however, the findings presented here illustrate the high risk the nation faces if current premium cost trends persist, as well as the potential gains for families and employers in all states if the promise of reform is realized.
CONCLUSIONS AND POLICY IMPLICATIONSOver the last several years, the combination of rising health care costs and slow growth in real incomes has left individuals and working families spending a greater percentage of their income and total compensation from work on health insurance premiums, often with greater out-of-pocket cost-sharing and less-compre-hensive benefits. With rising costs and eroding cover-age, much is at stake for the insured and uninsured alike as the nation begins to implement health care reform.
Insurance premiums have been rising far more rapidly that wages for decades, a pattern that continued from 2003 to 2009. Recent analysis of the individual and small-group market suggests that such trends continued in 2010. The ACA’s passage, however, has the potential to bring substantial change to U.S. insurance markets. The law will begin to spur plans to provide greater value by requiring insurers to justify cost increases and lower wasteful overhead in all states. And it provides states with new tools and authority, coupled with federal oversight, and establishes essential benefit standards that offer protection to all, regardless of state of residence. With its comprehensive reforms aimed at better access to care, higher quality, and slower cost growth, the ACA provides a platform for further actions across the country. If reforms are implemented well and creatively and eventually spread to private as well as public payers, they may help propel the country along the path to rising family income, higher sav-ings for education and retirement, and greater health security.
For state-specific data: See Tables 1 and 2, starting on page 14, for average premiums for single and family coverage and premiums as a percentage of median household income for nonelderly households, by state, for 2003 and 2009. See Tables 3 and 4 for average single and family deductibles by firm size in 2003 and 2009. Projected premium increases by state are included in Table 5. Tables 6 and 7 show potential savings if reforms successfully moderate cost growth.
State Trends in Premiums and Deductibles, 2003–2009 11
Notes
1 C. Schoen, Insurance Design Matters: Underinsured Trends, Health and Financial Risks, and Principles for Reform, Hearing on “Addressing the Underinsured in National Health Reform,” U.S. Senate Health, Education, Labor, and Pensions Committee, Feb. 24, 2009.
2 E. J. Emanuel and V. R. Fuchs, “Who Really Pays for Health Care?: The Myth of ‘Shared Responsibility’,” Journal of the American Medical Association, March 5, 2008 299(9):1057–59.
3 Henry J. Kaiser Family Foundation/Health Research and Educational Trust Survey of Employer-Sponsored Health Benefits, 1999–2010, http://www.kff.org/.
4 K. Davis, Why Health Reform Must Counter the Rising Costs of Health Insurance Premiums (New York: The Commonwealth Fund, Aug. 2009).
5 K. Davis, A New Era in American Health Care: Realizing the Potential of Reform (New York: The Commonwealth Fund, June 2010).
6 D. M. Cutler, K. Davis, and K. Stremikis, The Impact of Health Reform on Health System Spending (Washington and New York: Center for American Progress and The Commonwealth Fund, May 2010).
7 The coalition comprises the American Hospital Association (AHA), the American Medical Association (AMA), America’s Health Insurance Plans (AHIP), and the Pharmaceutical Research and Manufacturers of Americas (PhRMA). Letter to President Obama, May 11, 2009. Accessed at http://www.whitehouse.gov/assets/docu-ments/05-11-09_Health_Costs_Letter_to_the_President.pdf. For discussion, see fact sheet at http://www.whitehouse.gov/assets/documents/Fact_Sheet-Health_Reform_Stakeholders_5-11-09.pdf.
8 C. Schoen, J. L. Nicholson, and S. D. Rustgi, Paying the Price: How Health Insurance Premiums Are Eating Up Middle-Class Incomes—State Health Insurance Premium Trends and the Potential of National Reform (New York: The Commonwealth Fund, Aug. 2009).
9 Family premiums from Kaiser/HRET Survey of Employer-Sponsored Health Benefits, 2000–2009, http://www.kff.org/; median family income from U.S. Census Bureau, Current Population Survey.
10 K. Baicker and A. Chandra, The Labor Market Effects of Rising Health Insurance Premiums, NBER Working Paper No. 11160, Feb. 2005; D. Goldman, N. Sood, and A. Leibowitz, Wage and Benefit Changes in Response to Rising Health Insurance Costs, NBER Working Paper No. 11063, Jan. 2005; N. Sood, A. Ghosh, and J. J. Escarce, “Employer-Sponsored Insurance, Health Care Cost Growth, and the Economic Performance of U.S. Industries,” Health Services Research, Oct. 2009 44(5 Pt. 1): 1449–64.
11 Analysis of data from Henry J. Kaiser Family Foundation/Health Research and Educational Trust Survey of Employer-Sponsored Health Benefits, http://www.kff.org/.
12 Alabama, Arkansas, Hawaii, Idaho, Iowa, Louisiana, Michigan, Mississippi, Montana, Nevada, North Dakota, Ohio, Oklahoma, and South Dakota.
13 Analysis of data from Henry J. Kaiser Family Foundation/Health Research and Educational Trust Survey of Employer-Sponsored Health Benefits, http://www.kff.org/.
14 C. Schoen, S. R. Collins, J. L. Kriss, and M. M. Doty, “How Many Are Underinsured? Trends Among U.S. Adults, 2003 and 2007,” Health Affairs Web Exclusive, June 10, 2008:w298–w309; D. Rowland, C. Hoffman, and M. McGinn-Shapiro, Health Care and the Middle Class: More Costs and Less Coverage (Menlo Park, Calif.: The Henry J. Kaiser Family Foundation, July 2009).
15 C. DeNavas-Walt, B. D. Proctor, and J. C. Smith, Income, Poverty, and Health Insurance Coverage in the United States: 2009 (Washington, D.C.: U.S. Census Bureau, Sept. 2010).
16 General inflation from 2003 to 2009 was 16.6 per-cent. Economic Report of the President (Washington, D.C.: United States Government Printing Office, Feb. 2010).
17 R. Helman, C. Copeland, and J. VanDerhei, The 2009 Retirement Confidence Survey: Economy Drives Confidence to Record Lows; Many Looking to Work Longer, EBRI Issue Brief #328, April 2009.
18 Davis, A New Era in American Health Care, 2010. 19 U.S. Department of Health and Human Services,
“$46 Million in Grants to Help States Crack Down on Unreasonable Health Insurance Premium Hikes,” News Release, Aug. 16, 2010, http://www.hhs.gov/news/press/2010pres/08/20100816a.html.
20 S. R. Collins, K. Davis, J. L. Nicholson, and K. Stremikis, Realizing Health Reform’s Potential: Small Businesses and the Affordable Care Act of 2010 (New York: The Commonwealth Fund, Sept. 2010).
21 T. S. Jost, Health Insurance Exchanges and the Affordable Care Act: Key Policy Issues (New York: The Commonwealth Fund, July 2010).
22 T. S. Jost, Health Insurance Exchanges and the Affordable Care Act: Eight Diff icult Issues (New York: The Commonwealth Fund, Sept. 2010).
23 Ibid.24 Ibid.25 C. Schoen, K. Davis, S. Guterman, and K.
Stremikis, Fork in the Road: Alternative Paths to a High Performance U.S. Health System (New York: The Commonwealth Fund, June 2009). The coali-tion comprises the American Hospital Association (AHA), the American Medical Association (AMA), America’s Health Insurance Plans (AHIP), and the Pharmaceutical Research and Manufacturers of Americas (PhRMA). Letter to President Obama, May 11, 2009. Accessed at http://www.whitehouse.gov/assets/documents/05-11-09_Health_Costs_Letter_to_the_President.pdf. For discussion, see fact sheet at http://www.whitehouse.gov/assets/documents/Fact_Sheet-Health_Reform_Stakeholders_5-11-09.pdf.
State Trends in Premiums and Deductibles, 2003–2009 13
14 The Commonwealth Fund
Table 1. Single and Family Average Health Insurance Premiums, by State, 2003 and 2009
2003 2009 Percent increase, 2003–2009
State Single Family Single Family Single FamilyUnited States $3,481 $9,249 $4,669 $13,027 34% 41%
Alabama 3,156 8,045 4,647 11,978 47% 49%
Alaska 4,011 10,564 6,047 14,182 51% 34%
Arizona 3,209 8,972 4,358 12,813 36% 43%
Arkansas 3,127 7,977 3,717 10,969 19% 38%
California 3,293 9,091 4,631 12,631 41% 39%
Colorado 3,645 9,522 4,570 13,360 25% 40%
Connecticut 3,676 10,119 4,909 14,064 34% 39%
Delaware 3,854 10,499 4,955 12,682 29% 21%
District of Columbia 3,740 10,748 5,082 14,222 36% 32%
Florida 3,592 9,331 4,488 12,912 25% 38%
Georgia 3,624 8,641 4,692 12,792 29% 48%
Hawaii 3,020 7,887 4,116 11,826 36% 50%
Idaho 3,331 8,563 4,248 11,887 28% 39%
Illinois 3,692 9,693 4,725 13,708 28% 41%
Indiana 3,493 9,315 4,849 12,872 39% 38%
Iowa 3,270 8,436 4,453 12,036 36% 43%
Kansas 3,401 8,907 4,236 11,829 25% 33%
Kentucky 3,437 9,118 4,336 12,407 26% 36%
Louisiana 3,317 8,735 4,861 13,846 47% 59%
Maine 3,852 10,308 5,119 13,522 33% 31%
Maryland 3,427 9,217 4,870 13,833 42% 50%
Massachusetts 3,496 9,867 5,268 14,723 51% 49%
Michigan 3,671 9,449 4,916 13,160 34% 39%
Minnesota 3,679 10,066 4,600 13,202 25% 31%
Mississippi 3,305 8,075 4,469 12,590 35% 56%
Missouri 3,305 8,984 4,393 12,353 33% 38%
Montana 3,506 8,542 4,546 11,365 30% 33%
Nebraska 3,506 9,139 4,315 12,227 23% 34%
Nevada 3,578 8,831 4,627 12,700 29% 44%
New Hampshire 3,563 9,776 5,227 13,822 47% 41%
New Jersey 3,814 10,168 4,901 13,750 29% 35%
New Mexico 3,361 9,299 4,535 12,848 35% 38%
New York 3,592 9,439 5,121 13,757 43% 46%
North Carolina 3,411 8,463 4,676 13,087 37% 55%
North Dakota 2,999 7,866 4,127 11,590 38% 47%
Ohio 3,416 9,136 4,261 11,870 25% 30%
Oklahoma 3,285 8,739 4,243 11,417 29% 31%
Oregon 3,362 8,861 4,680 12,783 39% 44%
Pennsylvania 3,449 9,133 4,749 13,229 38% 45%
Rhode Island 3,725 9,460 5,059 13,608 36% 44%
South Carolina 3,371 8,918 4,503 12,343 34% 38%
South Dakota 3,361 8,499 4,262 11,596 27% 36%
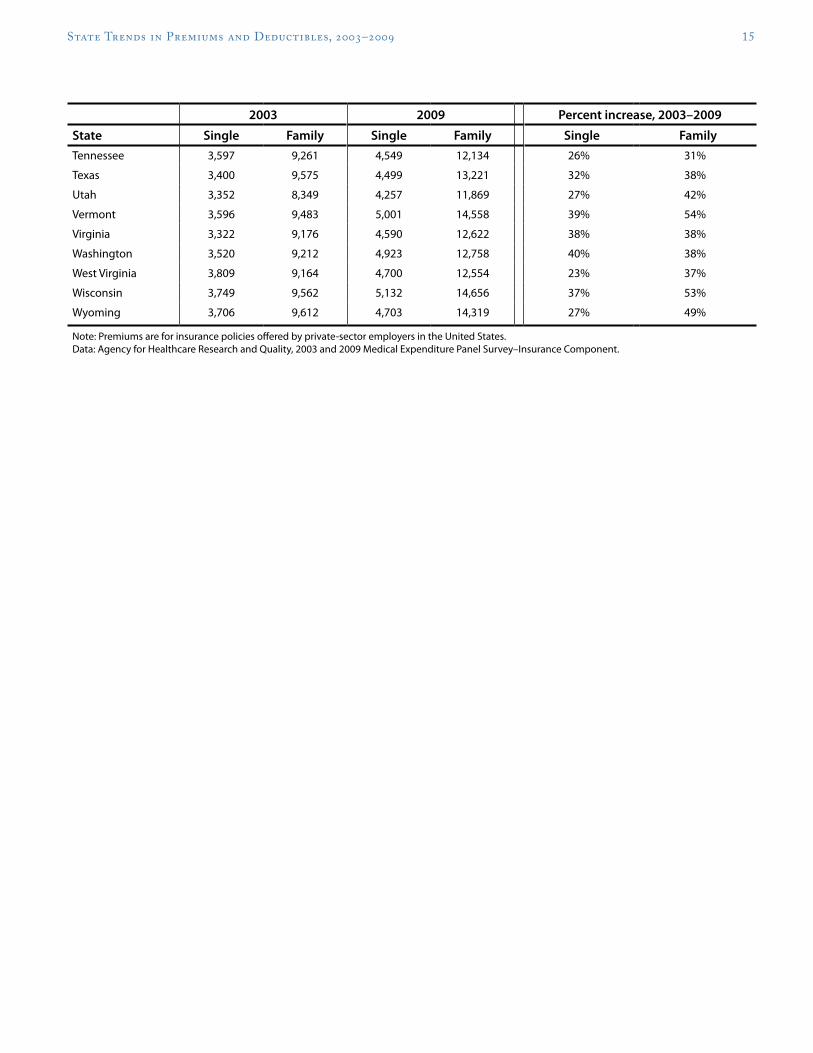
State Trends in Premiums and Deductibles, 2003–2009 15
2003 2009 Percent increase, 2003–2009
State Single Family Single Family Single FamilyTennessee 3,597 9,261 4,549 12,134 26% 31%
Texas 3,400 9,575 4,499 13,221 32% 38%
Utah 3,352 8,349 4,257 11,869 27% 42%
Vermont 3,596 9,483 5,001 14,558 39% 54%
Virginia 3,322 9,176 4,590 12,622 38% 38%
Washington 3,520 9,212 4,923 12,758 40% 38%
West Virginia 3,809 9,164 4,700 12,554 23% 37%
Wisconsin 3,749 9,562 5,132 14,656 37% 53%
Wyoming 3,706 9,612 4,703 14,319 27% 49%
Note: Premiums are for insurance policies offered by private-sector employers in the United States. Data: Agency for Healthcare Research and Quality, 2003 and 2009 Medical Expenditure Panel Survey–Insurance Component.
16 The Commonwealth Fund
Table 1a. Single and Family Average Premium by Firm Size and State, 2003 and 2009
Small firms (<50 employees) Large firms (50 or more employees)
2003 2009 2003 2009Small firm increase,
2003–09Large firm increase,
2003–09State Single Family Single Family Single Family Single Family Single Family Single Family
United States $3,623 $9,321 $4,652 $12,041 $3,438 $9,235 $4,674 $13,210 28% 29% 36% 43%
* Weighted by single and family household distribution in state. Data: Median household incomes—2003, 2004, 2009, and 2010 Current Population Surveys; Total average premiums for employer-based single and family health insurance plans—2003 and 2009 Medical Expenditure Panel Survey–Insurance Component.
20 The Commonwealth Fund
Table 3. Single and Family Average Deductible, 2003 and 2009
2003 2009 Percent increase, 2003–2009
State% with
deductible Single Family% with
deductible Single Family Single FamilyUnited States 52% $518 $1,079 74% $917 $1,761 77% 63%
Alabama 71 386 929 76 469 1,095 22% 18%
Alaska 85 463 974 95 943 1,761 104% 81%
Arizona 46 484 976 83 861 1,588 78% 63%
Arkansas 84 619 1,377 87 925 1,616 49% 17%
California 39 517 1,093 58 816 1,705 58% 56%
Colorado 54 549 1,108 78 1,018 1,870 85% 69%
Connecticut 32 412 995 58 1,138 1,839 176% 85%
Delaware 38 356 768 59 786 1,386 121% 80%
District of Columbia 32 408 874 61 644 1,203 58% 38%
Florida 44 576 1,218 77 983 1,949 71% 60%
Georgia 57 457 1,042 77 913 1,778 100% 71%
Hawaii 16 674 1,188 31 529 1,400 -22% 18%
Idaho 78 620 1,337 91 1,112 1,881 79% 41%
Illinois 61 542 1,102 84 851 1,541 57% 40%
Indiana 75 569 1,067 85 1,146 2,015 101% 89%
Iowa 75 581 1,039 94 1,144 2,271 97% 119%
Kansas 66 601 1,315 85 831 1,680 38% 28%
Kentucky 70 499 973 85 1,024 2,020 105% 108%
Louisiana 69 623 1,348 75 896 1,817 44% 35%
Maine 49 824 1,393 84 1,181 1,957 43% 40%
Maryland 45 389 885 56 772 1,437 98% 62%
Massachusetts 26 555 1,067 43 718 1,508 29% 41%
Michigan 42 365 744 73 795 1,558 118% 109%
Minnesota 53 473 1,191 88 1,060 1,988 124% 67%
Mississippi 86 619 1,343 85 1,051 1,746 70% 30%
Missouri 58 494 922 74 993 1,683 101% 83%
Montana 76 629 1,322 94 1,182 1,906 88% 44%
State Trends in Premiums and Deductibles, 2003–2009 21
2003 2009 Percent increase, 2003–2009
State% with
deductible Single Family% with
deductible Single Family Single FamilyNebraska 80 531 1,155 92 974 1,803 83% 56%
Nevada 55 479 1,145 74 804 1,753 68% 53%
New Hampshire 41 515 1,217 82 934 1,932 81% 59%
New Jersey 48 538 1,004 61 920 1,917 71% 91%
New Mexico 45 511 1,396 79 842 1,912 65% 37%
New York 33 485 1,048 51 771 1,439 59% 37%
North Carolina 66 618 1,265 88 1,035 1,736 67% 37%
North Dakota 73 437 981 91 719 1,340 65% 37%
Ohio 58 399 879 86 946 1,912 137% 118%
Oklahoma 75 486 1,074 88 812 1,720 67% 60%
Oregon 52 430 906 81 823 1,760 91% 94%
Pennsylvania 36 375 854 64 741 1,549 98% 81%
Rhode Island 32 368 885 61 856 1,628 133% 84%
South Carolina 71 584 1,153 90 1,064 2,116 82% 84%
South Dakota 87 662 1,287 93 1,093 1,902 65% 48%
Tennessee 69 532 1,140 88 974 1,854 83% 63%
Texas 63 624 1,294 86 1,115 2,042 79% 58%
Utah 65 371 958 86 854 1,729 130% 80%
Vermont 58 562 1,184 71 1,393 2,508 148% 112%
Virginia 41 500 1,078 67 835 1,486 67% 38%
Washington 63 389 983 89 766 1,733 97% 76%
West Virginia 73 423 740 88 826 1,363 95% 84%
Wisconsin 75 490 1,012 93 947 1,893 93% 87%
Wyoming 80 643 1,221 90 1,024 1,749 59% 43%
Note: Deductibles are for insurance policies offered by private-sector employers in the United States that had a deductible. Data: Agency for Healthcare Research and Quality, 2003 and 2009 Medical Expenditure Panel Survey–Insurance Component.
22 The Commonwealth Fund
Table 4. Single and Family Average Deductible, by Firm Size and State, 2003 and 2009
Small firms (<50 employees) Large firms (50 or more employees)
2003 2009 2003 2009
Small firm increase, 2003–09
Large firm increase: 2003–09
State% with
deductible Single Family% with
deductible Single Family% with
deductible Single Family% with
deductible Single Family Single Family Single Family
United States 60% $703 $1,575 74% $1,283 $2,652 50% $452 $969 74% $822 $1,610 83% 68% 82% 66%
Note: Deductibles are for insurance policies offered by private-sector employers in the United States that had a deductible. Data: Agency for Healthcare Research and Quality, 2003 and 2009 Medical Expenditure Panel Survey–Insurance Component.
24 The Commonwealth Fund
Table 5. Average Total Premium (in dollars) for Employer-Sponsored Health Insurance by State, at Current Growth Rate, 1 Percent Below Current Growth Rate, and 1.5 Percent Below Current Growth Rate, 2015 and 2020
At current growth rate At 1% below current growth rate At 1.5% below current growth rate
Data: Calculated based on 2009 premium data from Agency for Healthcare Research and Quality, 2009 Medical Expenditure Panel Survey–Insurance Component; Premium estimates for 2015 and 2020 based on Centers for Medicare and Medicaid Services, Office of the Actuary, National Health Statistics Group, national health expenditures per capita annual growth rate.
26 The Commonwealth Fund
Table 6. Annual Amount Saved on Single Premiums, at 1 Percent and 1.5 Percent Below Current Growth Rate, 2015 and 2020
Amount saved annually with 1% savings
Amount saved annually with 1.5% savings
State 2015 2020 2015 2020
United States $357 $832 $529 $1,220
Alabama $355 $829 $526 $1,214
Alaska 462 1,078 685 1,580
Arizona 333 777 493 1,139
Arkansas 284 663 421 971
California 354 826 524 1,210
Colorado 349 815 517 1,194
Connecticut 375 875 556 1,283
Delaware 378 883 561 1,295
District of Columbia 388 906 575 1,328
Florida 343 800 508 1,173
Georgia 358 837 531 1,226
Hawaii 314 734 466 1,075
Idaho 324 757 481 1,110
Illinois 361 842 535 1,234
Indiana 370 865 549 1,267
Iowa 340 794 504 1,163
Kansas 324 755 480 1,107
Kentucky 331 773 491 1,133
Louisiana 371 867 550 1,270
Maine 391 913 580 1,337
Maryland 372 868 551 1,272
Massachusetts 402 939 596 1,376
Michigan 375 877 557 1,284
Minnesota 351 820 521 1,202
Mississippi 341 797 506 1,168
Missouri 336 783 497 1,148
Montana 347 811 515 1,188
Nebraska 330 769 489 1,127
Nevada 353 825 524 1,209
New Hampshire 399 932 592 1,366
New Jersey 374 874 555 1,280
New Mexico 346 809 513 1,185
New York 391 913 580 1,338
North Carolina 357 834 529 1,222
North Dakota 315 736 467 1,078
Ohio 325 760 482 1,113
Oklahoma 324 757 480 1,109
Oregon 357 834 530 1,223
State Trends in Premiums and Deductibles, 2003–2009 27
Table 7. Annual Amount Saved on Family Premiums, at 1 Percent and 1.5 Percent Below Current Growth Rate, 2015 and 2020
Amount saved annually with 1% savings
Amount saved annually with 1.5% savings
State 2015 2020 2015 2020
United States $995 $2,323 $1,475 $3,403Alabama 915 2,136 1,356 3,129
Alaska 1,083 2,529 1,606 3,705
Arizona 979 2,285 1,451 3,348
Arkansas 838 1,956 1,242 2,866
California 965 2,252 1,430 3,300
Colorado 1,020 2,382 1,513 3,490
Connecticut 1,074 2,508 1,592 3,674
Delaware 969 2,261 1,436 3,313
District of Columbia 1,086 2,536 1,610 3,716
Florida 986 2,302 1,462 3,373
Georgia 977 2,281 1,448 3,342
Hawaii 903 2,109 1,339 3,090
Idaho 908 2,119 1,346 3,106
Illinois 1,047 2,444 1,552 3,581
Indiana 983 2,295 1,457 3,363
Iowa 919 2,146 1,363 3,145
Kansas 904 2,109 1,339 3,090
Kentucky 948 2,212 1,405 3,241
Louisiana 1,058 2,469 1,568 3,617
Maine 1,033 2,411 1,531 3,533
Maryland 1,057 2,466 1,566 3,614
Massachusetts 1,125 2,625 1,667 3,847
Michigan 1,005 2,346 1,490 3,438
Minnesota 1,008 2,354 1,495 3,449
Mississippi 962 2,245 1,426 3,289
Missouri 944 2,203 1,399 3,227
Montana 868 2,026 1,287 2,969
Nebraska 934 2,180 1,384 3,194
Nevada 970 2,264 1,438 3,318
New Hampshire 1,056 2,465 1,565 3,611
New Jersey 1,050 2,452 1,557 3,592
New Mexico 981 2,291 1,455 3,357
New York 1,051 2,453 1,558 3,594
North Carolina 1,000 2,333 1,482 3,419
North Dakota 885 2,067 1,312 3,028
Ohio 907 2,116 1,344 3,101
Oklahoma 872 2,036 1,293 2,983
Oregon 976 2,279 1,447 3,340
State Trends in Premiums and Deductibles, 2003–2009 29
Amount saved annually with 1% savings
Amount saved annually with 1.5% savings
State 2015 2020 2015 2020Pennsylvania 1,010 2,359 1,498 3,456
Rhode Island 1,039 2,426 1,541 3,555
South Carolina 943 2,201 1,398 3,225
South Dakota 886 2,068 1,313 3,030
Tennessee 927 2,164 1,374 3,170
Texas 1,010 2,357 1,497 3,454
Utah 907 2,116 1,344 3,101
Vermont 1,112 2,596 1,648 3,803
Virginia 964 2,251 1,429 3,298
Washington 974 2,275 1,445 3,333
West Virginia 959 2,238 1,421 3,280
Wisconsin 1,119 2,613 1,659 3,829
Wyoming 1,094 2,553 1,621 3,741
Data: Authors’ calculations.
30 The Commonwealth Fund
Methodology
Data for single and family premiums for 2003 and 2009 by state are from the Medical Expenditure Panel Survey–Insurance Component, which is reported by private and public sector employers and is representative by state. State median incomes for 2002–03 and 2008–09 are from the Current Population Survey for single and family households. We estimated average premiums from 2010 to 2020 for each state using the average national growth rate between 2003 and 2009 and projecting it forward. We then estimated potential savings with slower growth by projecting annual growth rates minus 1 percentage point and minus 1.5 percentage points for each year through 2020.
State Trends in Premiums and Deductibles, 2003–2009 31
About the Authors
Cathy Schoen, M.S., is senior vice president at The Commonwealth Fund, a member of the Fund’s executive management team, and research director of the Fund’s Commission on a High Performance Health System. Her work includes strategic oversight of surveys, research, and policy initiatives to track health system performance. Previously Ms. Schoen was on the research faculty of the University of Massachusetts School of Public Health and directed special projects at the UMass Labor Relations and Research Center. During the 1980s, she directed the Service Employees International Union’s research and policy department. Earlier, she served as staff to President Carter’s national health insurance task force. Prior to federal service, she was a research fellow at the Brookings Institution. She has authored numerous publications on health policy and insurance issues, and national/inter-national health system performance, including the Fund’s 2006 and 2008 National Scorecards on U.S. Health System Performance and the 2007 and 2009 State Scorecards, and coauthored the book Health and the War on Poverty. She holds an undergraduate degree in economics from Smith College and a graduate degree in economics from Boston College. She can be e-mailed at [email protected].
Kristof Stremikis, M.P.P., is senior research associate for Commonwealth Fund President Karen Davis. Previously, he was a graduate student researcher in the School of Public Health at the University of California, Berkeley, where he evaluated various state, federal, and global health initiatives while providing economic and statistical sup-port to faculty and postdoctoral fellows. He has also served as consultant in the director’s office of the California Department of Healthcare Services, working on recommendations for a pay-for-performance system in the Medi-Cal program. Mr. Stremikis holds three undergraduate degrees in economics, political science, and history from the University of Wisconsin at Madison. He received a master of public policy degree from the Goldman School at the University of California, Berkeley, and is currently enrolled in the health policy and management program at Columbia University. He can be emailed at [email protected].
Sabrina K. H. How, M.P.A., is senior research associate for the Commonwealth Fund Commission on a High Performance Health System Scorecard and Research Project, with responsibilities for developing and producing national, state, and sub-state regional analyses on health care system performance and related insurance and care system market structure analyses. She was program associate for two programs, Health Care in New York City and Medicare’s Future. Prior to joining the Fund in 2002, Ms. How was a research associate for a management consult-ing firm focused on the health care industry. Ms. How holds a B.S. in biology from Cornell University and an M.P.A. in health policy and management from New York University. She can be e-mailed at [email protected].
Sara R. Collins, Ph.D., is vice president at The Commonwealth Fund. An economist, she is responsible for sur-vey development, research, and policy analysis, as well as program development and management of the Fund’s Affordable Health Insurance program. Prior to joining the Fund, Dr. Collins was associate director/senior research associate at the New York Academy of Medicine, Division of Health and Science Policy. Earlier in her career, she was an associate editor at U.S. News & World Report, a senior economist at Health Economics Research, and a senior health policy analyst in the New York City Office of the Public Advocate. She holds an A.B. in economics from Washington University and a Ph.D. in economics from George Washington University. She can be e-mailed at [email protected].