Statement of evidence of Mark Gauntlett Tansley Dated: 30 July 2014 REFERENCE: JM Appleyard ([email protected]) TA Paddock ([email protected]) in the matter of: the Resource Management Act 1991 and in the matter of: submissions and further submissions by Christchurch International Airport Limited on proposed plan change 84: Special Purpose (Airport) Zone to the Christchurch City Plan
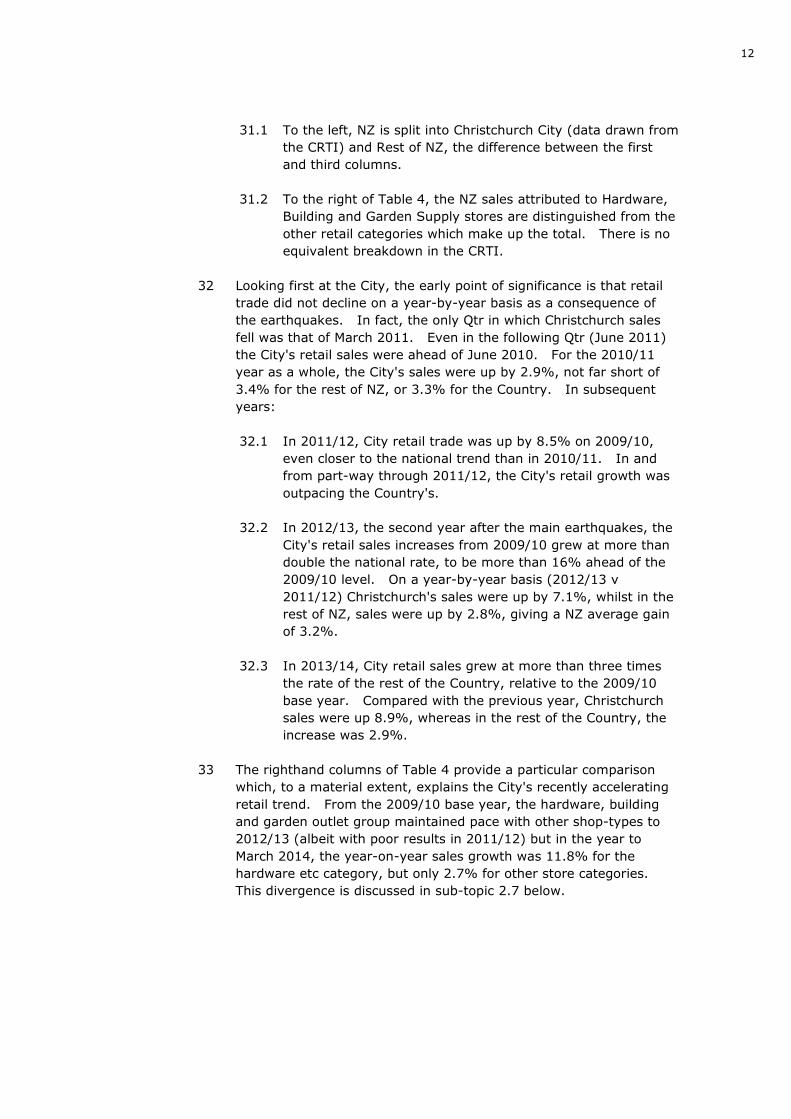
Note: All Christchurch Sales Values are provisional.
All New Zealand Sales Values are as updated retrospectively.
NZ excluding Christchurch and All Other NZ Sales Values are derived from NZ and NZ Hardware etc data.
Percentages calculated by Marketplace NZ.
All Values exclude gst and also exclude accommodation and food and beverage services.
*¹ Quarter of September 2010 earthquake.
*³ Quarter of February 2011 earthquake.
Inc on
09/10$m
Inc on
09/10$m
Inc on
09/10$m
Inc on
09/10$m
Inc on
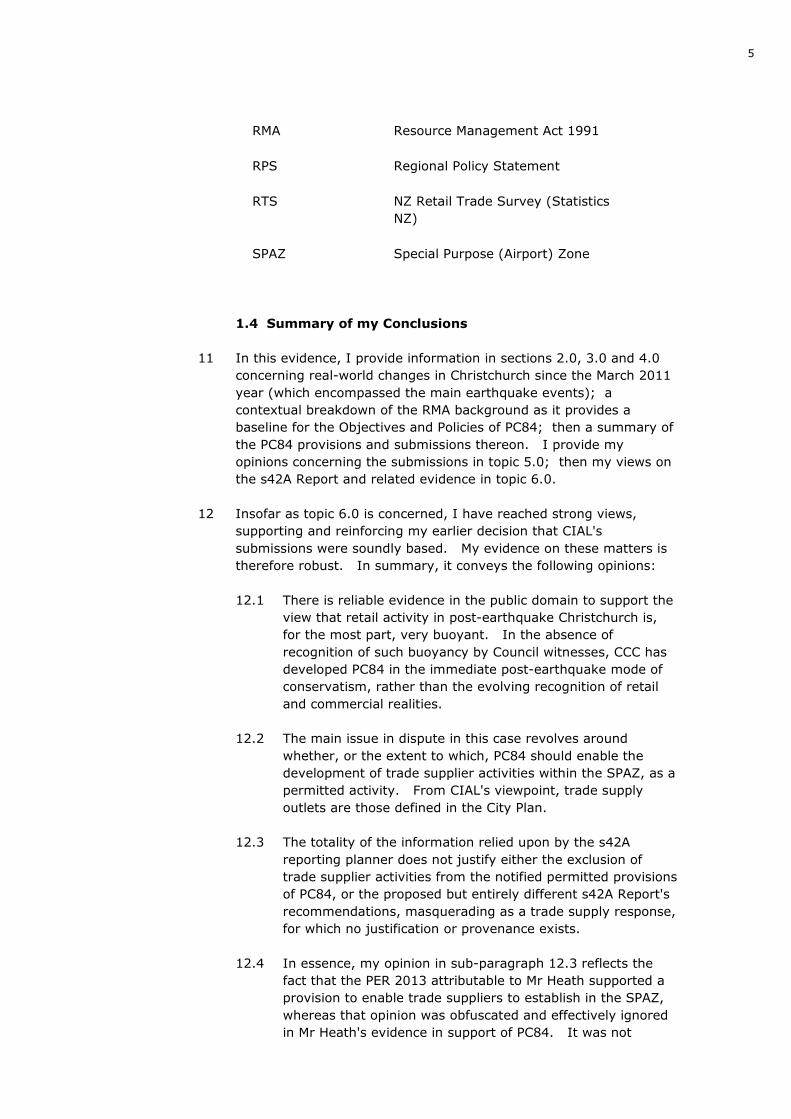
09/10
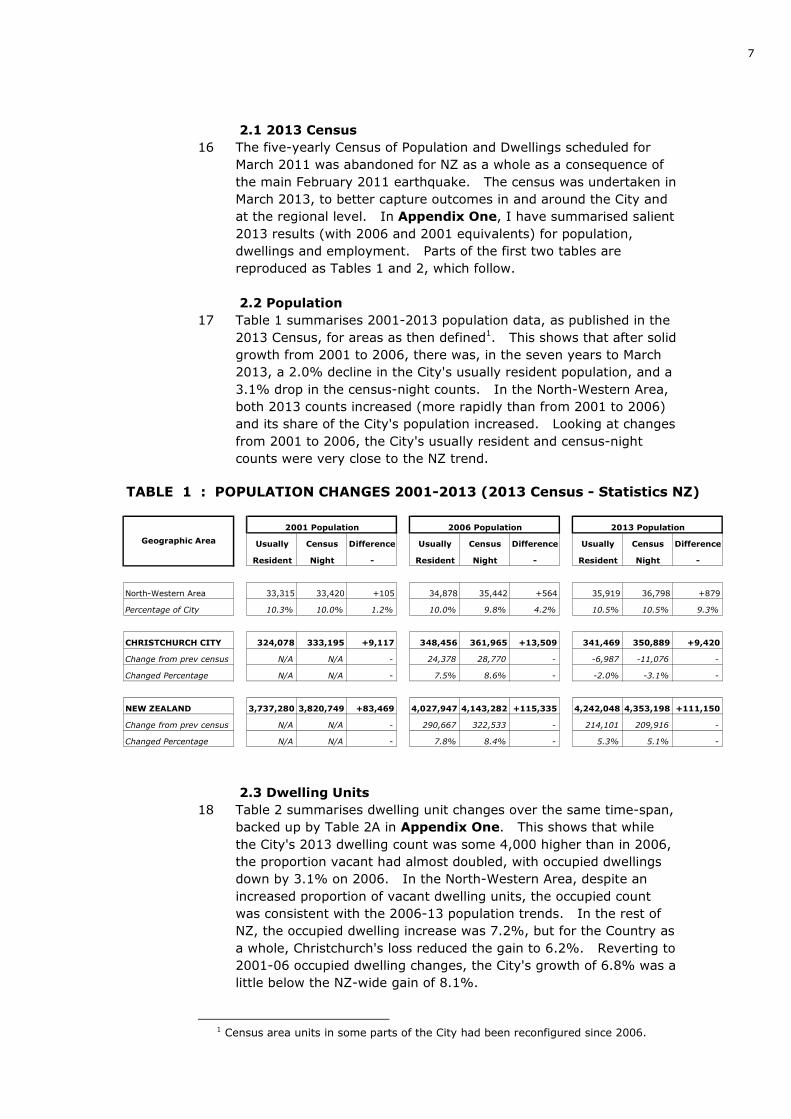
CHRISTCHURCH
CITY
NZ EXCLUDING
CHRISTCHURCH
CITY
NEW ZEALAND
NZ HARDWARE,
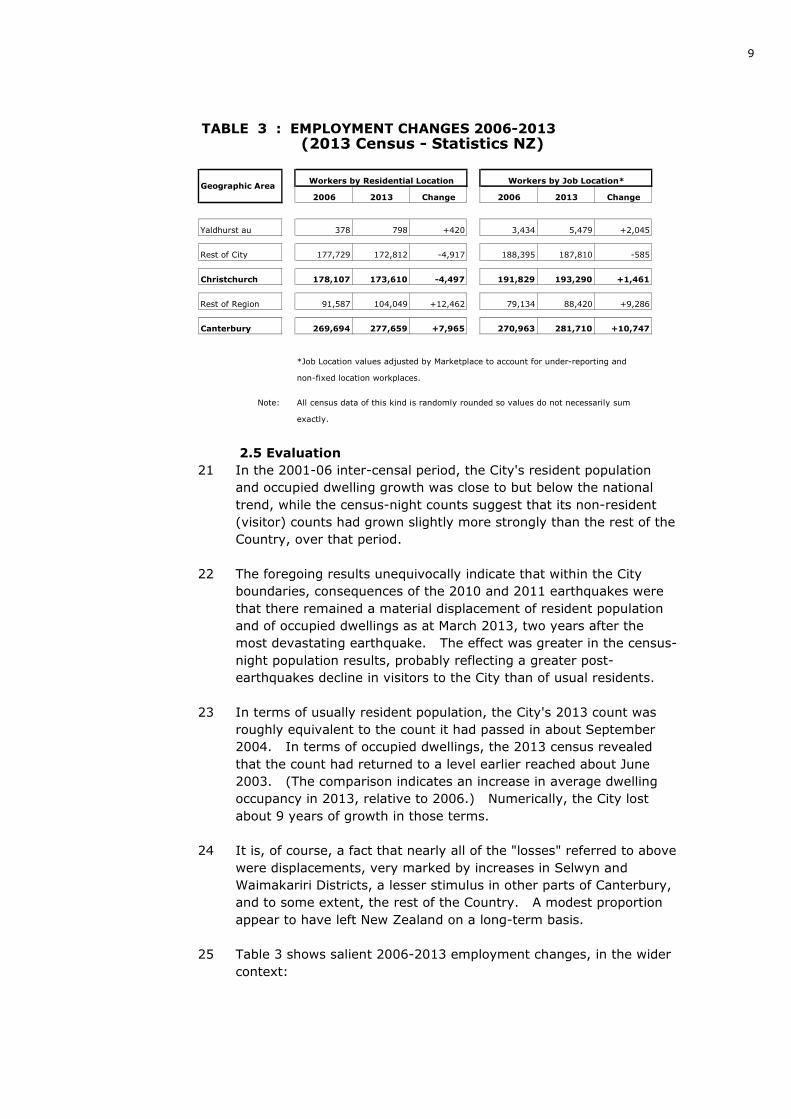
BLDRS & GARDEN
SUPPLIERS
ALL OTHER NZ
RETAIL
CATEGORIES
$m
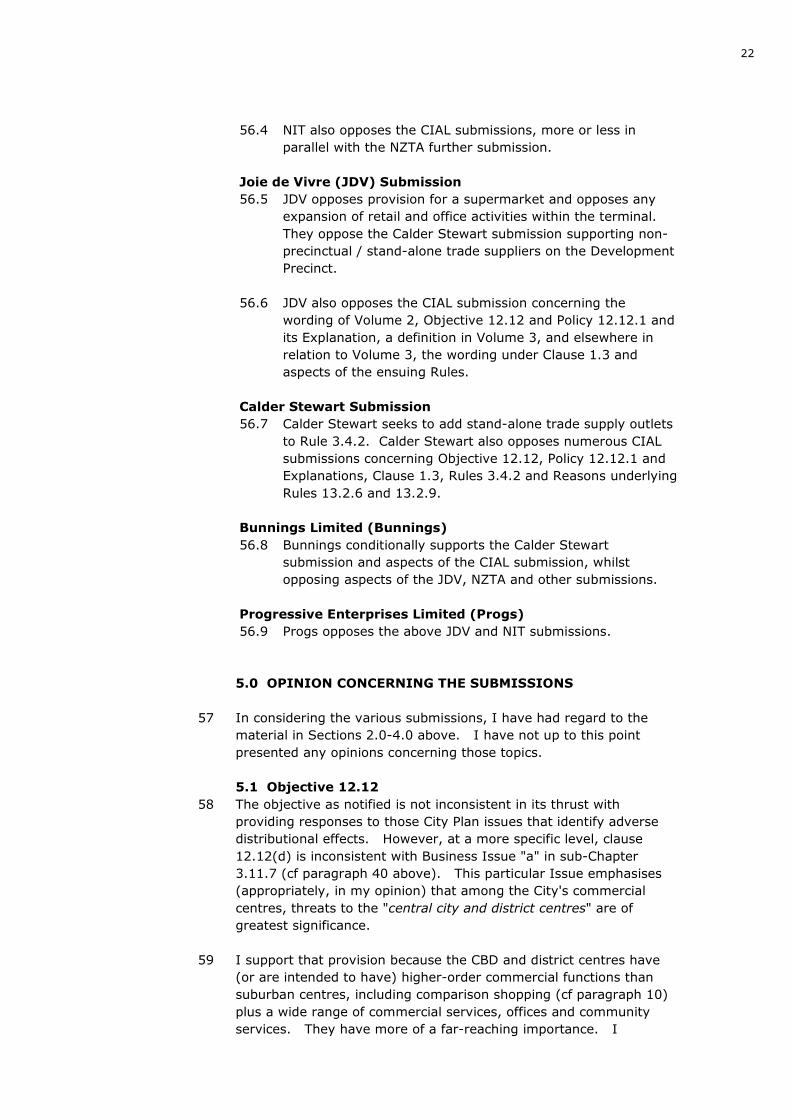
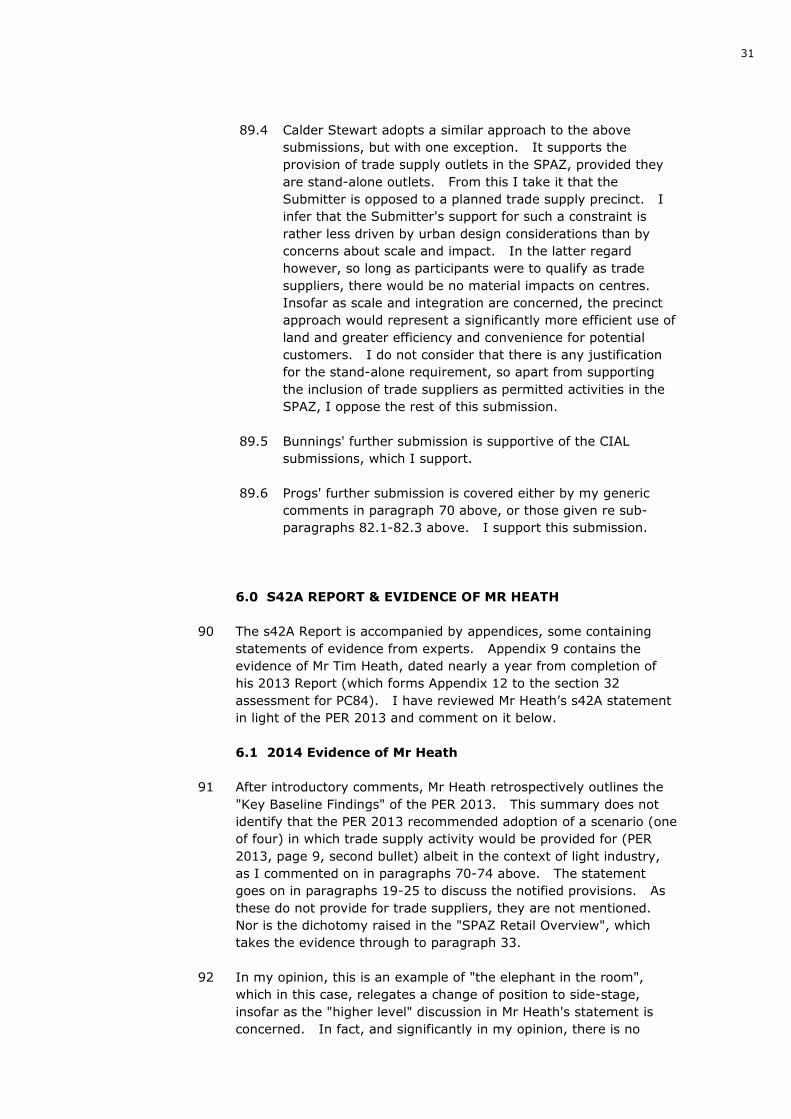
34 As noted in sub-paragraph 31.2, the CTRI does not publish a
breakdown by retail category of its sales data. However, in my
opinion, the City's unusually accelerating retail sales will have been
significantly attributable to the hardware etc group. Much of the
national sales disparity in the righthand columns of Table 4 can be
attributed to a more significant increase in demand in Christchurch
and to a lesser extent (but on a larger scale) enhanced demand in
14
Auckland. The former attribution is confirmed in general terms at
the top of p3 of the attached March Qtr RTS.
2.7 Implications of the Sales Trends
35 Salient aspects of the sales trends in the City column of Table 4
(even allowing for the special impetus provided by hardware,
building and garden supply outlets) include these, in my opinion:
35.1 Despite the substantial demolition of the CBD and damage of
varying extents to fringe CBD and non-CBD City retail areas
in 2010/11, turnover inside the City boundary was ahead of
the preceding years and grew in each ensuing year. This
means, incontrovertibly, that substantial and ongoing windfall
trade has been and is being enjoyed by most of the City's
retail centres (other than where adverse local effects have
outweighed the broader-based benefits).
35.2 The CBD's outreach beyond the City boundaries originally
disappeared and remains limited. It is increasingly apparent
that the CBD's foreseeable recovery – especially in retail
terms – will be slow and of relatively limited extent,
compared with its role prior to 2010/11.
35.3 In considering the extent to which retail development on the
Airport could adversely impact, either on the CBD retail
recovery, or on centres that continue to benefit from
earthquake damage elsewhere, regard should be had to the
Table 3 trends and the actual and potential diversion of
housing growth to the City's north and south-west and to
other parts of Greater Christchurch, including the City's
north-western suburbs.
35.4 The accelerated demand for hardware, building and garden
supplies in Christchurch has clearly ramped up substantially
over a short period, during which appropriate supply
responses have not been possible. There is a rapidly
growing gap between demand and supply, in this category.
36 The above implications are in my view, relevant to Plan Change 84
and submissions upon it. I shall be referring to them subsequently.
3.0 PLANNING CONTEXT
3.1 Statutory Plans
37 As I understand matters, the LURP has added a new Chapter 6 to the
Canterbury RPS, to provide provenance for necessary amendments
to the three affected District Plans. In the City Plan's case,
significant amended or new provisions have been adopted, whilst the
LURP directs ongoing actions to be implemented in the City Plan, by
the City and within specified time frames, to give effect to the RPS.
15
38 The position I have taken is that while there are specific statutory
requirements in terms of s75(3) of the RMA for City Plan provisions
to give effect to the RPS, where these regional provisions are
intended to be changed as a result of LURP directives, there is a
statutory requirement to not be ‘inconsistent’ with the LURP. To the
extent that this statement refers to such matters, my comments are
set out in Topic 5.0 sub-topic 5.1.
3.2 City Plan Issues
39 The City Plan was prepared in a format which elevated the Issues for
Christchurch to Volume 1 of the Plan. Whilst such an approach
(enunciating issues) is no longer mandatory, an advantage of so
doing is to provide a real world context for the Objectives. Issues
are problems justifying intervention, to which Objectives are the
response. PC84 reinforces that connection by introducing
amendments to Volume 1, Chapter 3, at 3.15.9 and 3.18.3.
40 Given that the context for all Objectives, including proposed new
Objective 12.12 is that spelt out in the Plan's Issues, I have scanned
the summaries of issues for sub-Chapters 3.11, 3.13, 3.15, 3.17 and
3.18, which appeared to me to be the most likely to provide
provenance for Objective 12.12 as notified, were it adopted.
"3.11.7 Summary of business issues a. existing commercial centres, in particular the central city and
district centres, represent an agglomeration of significant resources,
play important roles in providing for the economic and social well-
being of the city and have an associated value and range of benefits to
the community; this presents challenges for the identification of
appropriate mechanisms to ensure that such resources are sustainably
managed for existing and future communities.
(emphasis in text added)
b. retailing in new localities, or the expansion of existing centres,
may improve access to goods and services and better enable people
and communities to meet their social and economic needs. However,
any change in the pattern of distribution of commercial centres can
result in particular adverse effects or require consideration of linkages
with other aspects of urban form, including the following:
….
- impact upon existing centres, the significance of the impact,
and whether there is a likely reduction in social and
economic function and amenity of those centres;
- consequential impacts upon the ability of existing centres to
function as focal points contributing to the wellbeing of
people and communities; and
- whether affected centres have outlived their original
historical function and whether the rate of transition is such
as to maintain an appropriate level of function and amenity.
….
16
d. the central city, as a diverse urban environment providing the
greatest scale and intensity of business activities, may struggle to
maintain its role if there is significant dispersal of retail/commercial
activity even with alternative methods of support. ….
3.13.10 Summary of community issues
….
i. the role of suburban centres in providing a focus for local
community activities and buildings accessible to the community. ….
3.15.10 Summary of transport issues
….
k. the provisions that need to be made for the future operations of
Christchurch International Airport, including intensification within, and
outward growth of, the airport, and the impacts of traffic and noise on
the roading network and residential areas. ….
o. potential effects upon the transport network of new commercial
activities, centres and (out of zone) expansion of existing centres.
p. the costs of upgrading the road network to safely and efficiently
accommodate activities generating high levels of vehicle trips, where
necessary and where it is appropriate. ….
3.17.7 Summary of city form and design issues
….
3.18.5 Summary of growth issues
….
j. the effects on future growth directions of a number of important
existing activities, such as the airport, sewage treatment works and
major recreation facilities and some agricultural activity.
….
l. the potential effects of any dispersal of retailing and related
activities on any local or wider community, in terms of reduced access
to consolidated shopping and communal facilities."
41 Other Issues, which follow "d" under the 3.11.7 Summary, have not
been quoted above, given the earthquake events that succeeded
their adoption. LURP-related provisions appear to over-ride them.
The City Form and Urban Design sub-Chapter does not, in my
opinion, identify any matters that are particularly relevant to PC84's
distributional content.
42 My opinions in Topic 5.0 have regard to the above City Plan issues.
17
3.3 Airport Master Plan ("MP")
43 The MP, dated July 2006, devotes its Section 4 to "Land Use
Planning". From its Tables 4-1 and 4-2, the following information is
available:
43.1 CIAL's interest in the Airport and environs (plus non-CIAL
interests within the Airport designation) may be tabulated as
follows (with approximate areas in rounded hectares):
Designation SPAZ Outside Total
CIAL Freehold in Designation & SPAZ
668 668 0 668
CIAL Freehold in SPAZ/not Designation
0 15 0 15
CIAL Freehold in Designation/not SPAZ
53 0 0 53
CIAL Freehold Outside Designation/SPAZ
0 0 45 45
CIAL Freehold Sub-Total
721 683 45 781
CIAL Leasehold in Designation
163 0 0 163
Total CIAL Interest 884 683 45 944
Non-CIAL Interests 28 28 0 28
Area Totals (excl roads)
912 711 45 972
43.2 Table 4-2 allocates 756ha in its righthand column, to the land
use analysis of land (excluding roads) within the SPAZ, plus
CIAL holdings outside the SPAZ (711ha plus 45ha). This
includes 15ha which lies outside the Airport designation, as
shown in the second line of the detailed floorspace schedule
in paragraph 43.1 above. It is understood that CIAL has
formally sought to have this area included in the designation,
during the imminent Plan review.
43.3 The MP’s Table Table 4-2's righthand column shows that of
CIAL's (plus non-CIAL's) interests of 711ha of SPAZ / 58ha
falls within the Commercial Support Precinct (called a Sub-
Zone in the MP). This CSP represents 8.2% of the SPAZ, but
deducting 15ha of the CIAL holding on Russley Road land that
is outside the designation, the balance of 43ha represents
only 4.7% of the latter. Apart from 45ha of the SPAZ
allocated for future development (the western quarter of
which is in a completely non-commercial area) the balance of
18
the SPAZ and Airport designations are specifically allocated to
actual or potential dedicated airside activities.
43.4 Mr Rhys Boswell of CIAL provides an update on CIAL land
ownership, occupation and use as it has changed since the
2006 Master Plan.
4.0 PROPOSED PC84
44 Proposed PC84 is not attributable to any directive of the LURP. I
accept the context provided for it from paragraphs 3.2-3.11 of the
Section 42A Report. At p11, the s32 Report states (in relation to
the "Recall" decision):
”The Decision highlighted this policy gap and suggested that the
Council should seek to amend the City Plan as such to provide
greater guidance on the purpose and outcomes sought through
the Special Purpose (Airport) Zone provisions."
4.1 The Section 32 Report
45 The fourth paragraph of the s32 Report's Introduction contains the
following sentence:
"In essence, the Plan Change seeks to provide relatively limited
constraints on development of Airport zoned land, to support
the airport as a resource, where such development will not
cause adverse effects on the environment."
(emphasis added)
The context of this approach was the selection of the "Plan Change
C" option among those discussed at section 5.1 of the Report.
46 At section 5.2 of the Report, there is no reference to consideration of
possible alternative wording of Objective 12.12, or its Explanation
and Reasons. Recognition of the implicit "issue" of adverse
distributional effects forms aspect (d) of the Objective, whilst (b) and
(c) also touch upon other distributional considerations.
47 Section 5.3 addresses proposed Policy 12.12.1. There is a brief and
discounted discussion about alternative approaches, culminating in
the assertion that the proposed Policy is both efficient and effective.
There is no explicit consideration of alternative policy scope and no
assertion that the notified version is the most appropriate. Aspects
(b)(ii), (c) and (e) of the Policy are directly concerned with
distributional matters.
48 Section 5.3 also addresses Rules and Methods. In consideration of
Specific Rules / Provisions, the Report opens with the following
comment, which reflects the high order approach quoted in
paragraph 45 above:
19
"The overall premise behind the development of the new and
amended rule package, is that it is only necessary to control/limit
activities that would result in some kind of adverse effect on the
environment. As part of enabling the appropriate development
at the airport resource, it is considered appropriate to permit
any activity where there is no resource management
reason for restraint…."
(emphasis added)
49 The "rule package" referred to includes the following Permitted
provisions:
….
Community Standard [3.3.1]
"One Supermarket, not exceeding 2,700m² gross leasable floor
area."
….
Activities within the SPAZ Development Precinct [3.4.2 b)9]
"Retail activities limited to:
a) a total gross leasable floor area within the zone of
1,400m² (excluding any supermarket), provided that
no single tenancy shall exceed 450m² of gross
leasable floor area, except that this limit does not
include:
i. Any retail activity inside the terminal buildings;
ii. Food and beverage outlets.
(Note: one supermarket is provided for under community
standard 3.3.1.)"
50 I further understand that:
50.1 Insofar as a supermarket is concerned, any proposal for a
supermarket of more than 2,700m² gla, or for a second
supermarket lifting the aggregate gla of both to more than
2,700m² gla would be a discretionary activity.
50.2 Insofar as Rule 3.4.2 b)9 is concerned, commercial service
activities (eg banks, travel or booking services, hairdressers,
drycleaners) fall within the category of "retail" activities,
under provisions of the Plan.
50.3 The proposed 1,400m² gla upper threshold therefore applies
to the aggregate of permitted retail and commercial service
activities outside the terminal complex. Any proposal to
establish more than 1,400m² gla of those activities outside
the terminal would be non-complying.
50.4 The foregoing limits would not include food and beverage
outlets (eg restaurants, lunch bars, fast food and takeaway
food services) so that in conjunction with retail stores and
commercial services, more than 1,400m² gla would be
permitted.
20
51 In the summary of conclusions concerning Rules, a significant section
is devoted to retail activities. This includes the following passages:
"Retail activities are generally intended to be limited to ensure
that there are not adverse effects on the central city, key activity
centres, or suburban centres. To achieve this outcome, and
based on economic advice, it is proposed that retail activities
generally are limited in extent to reflect the resource consent
granted for the "Spitfire Square" development. …. In addition a
limit on individual tenancy size is included to avoid an imbalance
in activity scale. …"
Beyond this, it is not considered appropriate or necessary to limit
retail activity inside the terminal buildings as this provides a
specific function for travellers/visitors. …
Similarly the economic advice is that food and beverage
outlets, and trade suppliers do not need to be limited in
the zone as establishment of such activities would not result in
business distribution impacts.
"Large format retail is not anticipated within the zone as the
advice received is that it could have distributional effects.
Likewise advice received is that specialty or department style
(sic?) retail activity could cause adverse impacts on the central
city recovery or suburban centres.
Alternative approaches to managing retail activity were
considered. It would be inappropriate to enable all retail activity
in an unlimited manner where there is clear advice that this could
lead to adverse effects on the environment. Likewise,
restricting all retail activity (such that consent is necessary)
would be inappropriate where some such activity would
not lead to adverse effects and is necessary to the
functioning of the zone. It is therefore considered efficient
and effective to provide for some reasonable activity as is
proposed."
(emphasis added)
52 I will also refer to the above-quoted passages when offering my
opinions on the submissions to the proposed Change.
4.2 CIAL Submissions
53 At paragraph 4 of its Notice of Submission, CIAL indicates that
(among others) it is particularly interested in the following aspects of
PC84:
"4.1 Inclusion of a specific Objective (12.12) and Policy
(12.12.1) recognising the role and function of the
Special Purpose (Airport) Zone;
21
4.2 Recognition of specific 'Precincts' within the Special
Purpose (Airport) zone and the range of activities
enabled within the precincts; and
4.3 The range of business activities provided for within the
'Development Precinct'. …"
Elements 4.1-4.3 of the sought relief fundamentally cover the
matters of Airport retailing and the related planning context to
which this statement is addressed (cf paragraph 8 above).
54 CIAL seeks modification of proposed new Objective 12.12 by
amending its clause (d) to replace the terms "key activity centres"
and "suburban centres" with "district centres" and by adding the
qualification "significant" to the words "adverse distributional
effects". CIAL seeks equivalent modifications to Policy 12.12.1
clauses (b)(ii) and amendments to clauses (c) and (e):
54.1 In relation to clause (c) the submission seeks only to
rephrase the thrust (from limiting to enabling) whilst not
altering the substance of the policy.
54.2 In relation to clause (e) the submission seeks to delete the
reference to lfr activities as being inappropriate.
55 Insofar as proposed Rule 3.4.2 is concerned, CIAL seeks that trade
suppliers be added as "iii" to the exemptions listed in item 9a) which
relates to retail activities. The reasons for the amendment sought
by CIAL are indicated by proposed wording changes to the
Explanation and Reasons for both the Objective and Policy.
4.3 Other Submissions and Further Submissions
56 Submissions and further submissions which have a direct interest in
or bearing on the above CIAL submissions are briefly summarised
below:
NZ Transport Agency (NZTA) Submissions
56.1 NZTA seeks to extend the constraints concerning retail
activities in Policy 12.12.1 and supports the notified
provisions of its clause (e).
56.2 NZTA also opposes CIAL submissions concerning Objective
12.12, Policy 12.12.1 and its Explanation, the inclusion of
Trade Suppliers in Rule 3.4.2(b)9 and related wording
changes.
National Investment Trust (NIT) Submissions
56.3 NIT is opposed to additional retail activity within the SPAZ,
and considers that retail activity within the terminals should
be restricted. NIT is also opposed to entrenchment of the
current but unimplemented consent for the Spitfire Square
development within the zone rules.
22
56.4 NIT also opposes the CIAL submissions, more or less in
parallel with the NZTA further submission.
Joie de Vivre (JDV) Submission
56.5 JDV opposes provision for a supermarket and opposes any
expansion of retail and office activities within the terminal.
They oppose the Calder Stewart submission supporting non-
precinctual / stand-alone trade suppliers on the Development
Precinct.
56.6 JDV also opposes the CIAL submission concerning the
wording of Volume 2, Objective 12.12 and Policy 12.12.1 and
its Explanation, a definition in Volume 3, and elsewhere in
relation to Volume 3, the wording under Clause 1.3 and
aspects of the ensuing Rules.
Calder Stewart Submission
56.7 Calder Stewart seeks to add stand-alone trade supply outlets
to Rule 3.4.2. Calder Stewart also opposes numerous CIAL
submissions concerning Objective 12.12, Policy 12.12.1 and
Explanations, Clause 1.3, Rules 3.4.2 and Reasons underlying
Rules 13.2.6 and 13.2.9.
Bunnings Limited (Bunnings)
56.8 Bunnings conditionally supports the Calder Stewart
submission and aspects of the CIAL submission, whilst
opposing aspects of the JDV, NZTA and other submissions.
Progressive Enterprises Limited (Progs)
56.9 Progs opposes the above JDV and NIT submissions.
5.0 OPINION CONCERNING THE SUBMISSIONS
57 In considering the various submissions, I have had regard to the
material in Sections 2.0-4.0 above. I have not up to this point
presented any opinions concerning those topics.
5.1 Objective 12.12
58 The objective as notified is not inconsistent in its thrust with
providing responses to those City Plan issues that identify adverse
distributional effects. However, at a more specific level, clause
12.12(d) is inconsistent with Business Issue "a" in sub-Chapter
3.11.7 (cf paragraph 40 above). This particular Issue emphasises
(appropriately, in my opinion) that among the City's commercial
centres, threats to the "central city and district centres" are of
greatest significance.
59 I support that provision because the CBD and district centres have
(or are intended to have) higher-order commercial functions than
suburban centres, including comparison shopping (cf paragraph 10)
plus a wide range of commercial services, offices and community
services. They have more of a far-reaching importance. I
23
therefore consider it appropriate to reflect the Issue's terminology in
Objective 12.12.
60 The term "key activity centre" ("KAC") is not yet defined in the City
Plan. I accept that it will need to be, to give effect to regional
policy, but its use in that context is not hierarchical in the same
sense as is the Plan's term "district centres". The KAC
nomenclature is flavoured or influenced by the RPS' recovery-related
considerations and in that context, spans both district and suburban
centres. I think it very unwise to introduce the term to the Plan via
PC84 before commensurate consideration has been given to
hierarchical considerations, including the identification of KACs that
may not be intended to undertake a district centre function.
61 As to the term “suburban centres" it is relegated, by its distinction
from district centres, to lower-order (regular but more limited)
functions. This status is reinforced by Issue "i" at sub-Chapter
3.13.10 of the Plan (cf paragraph 40 above). It is also reinforced by
the unavoidable fact that in distributional terms, smaller
convenience-orientated centres are necessarily much more
numerous than more specialised district centres. That is the
distributional system that has evolved to best meet the wellbeing of
communities.
62 In light of the foregoing, the s32 Report's silence on the pros and
cons of Objective 12's wording (cf paragraph 46 above) and my
comments in paragraph 39, I fully support CIAL's submission on the
terminologies used in item (d) of Objective 12.12. I consider that
submissions in favour of the notified status quo lack equivalent
merit.
63 Insofar as the absence of the term "significant" is concerned, I
consider this an important omission. While there has continually
been uncertainty about a precise interpretation, this flexibility is
necessary. The alternative would be to adopt some resource
management version of the Duckworth-Lewis formula (for resolving
inequal cricket match opportunities, in shortened forms of the
game).
5.2 Policy 12.12.1
64 Clause (b)(ii) of the new Policy mirrors the wording of Objective
12.12. For the reasons given under topic 5.1 above, I consider the
CIAL amendments more appropriate than the notified version. It is
a natural extension of that opinion to align sub-policy (b)(ii) with the
Objective. I therefore support CIAL's submission on this part of the
Policy.
65 Jumping to clause (e) as notified, I consider that its inclusion of
"large format retail activities" as inappropriate in the Zone alongside
noxious industry, but with no other inappropriate activities
exemplified (ie, nothing to link or contextualise these two extremes)
is inherently pejorative. Before considering the justification or
otherwise for that inclusion in the Policy, I would simply note that it
24
would have been more logical to identify perceived inappropriate
retail examples in an amended version of clause (c). For that
reason, I include this aspect of Policy 12.12.1 within my discussion
of clause (c).
66 Clause (c) as notified seeks to create a nexus as between the retail
and office activities deemed acceptable on the one hand and the
needs of travellers, other Airport visitors and workers in the SPAZ on
the other. It is a very restrictive approach, which I am unable to
attribute to Objective 12.12 (as notified or, preferably, amended as
sought by CIAL). As discussed below, I am also unable to identify
any "real-world" circumstances, Plan provisions or s32 justification
for clause (c) as notified.
67 Turning first to my Section 2.0, the "real-world" evidence is:
67.1 There has been a modest acceleration of population and
occupied dwelling counts in the suburban areas close to the
Airport since 2006, against the City's wider experience;
67.2 There was, between 2006 and 2013, a very substantial
increase in employment in and close to the Airport,
representing more jobs than were gained by the City as a
whole;
67.3 In the last two years, Christchurch's retail turnover increases
have far outstripped those of the Country as a whole, largely
driven by demand for hardware, building and garden
supplies, and at a rate significantly exceeding that of
population and dwelling growth;
67.4 These sales results have outstripped, by an even wider
margin, the level of City retail supply, meaning that sales
productivity in retail centres – particularly district centres –
and even more so in building supply outlets, is uniquely
buoyant.
This is not a market which justifies significant constraints on Airport
retailing unless such were driven by non-distributional
considerations.
68 The City Plan's Issues in relation to retailing and other commercial
activity – in my opinion – fall within what I would term the
mainstream approach, whereby related Policies include provision for
the assessment of significant un-zoned developments to determine
whether or not (or the extent to which) they can proceed, whilst
avoiding significant adverse effects on other centres and their
communities. Turning to Airport Issues, Transport Issue 3.15.10(k)
identifies the need to provide for the future operations of the Airport
and related traffic impacts. As the Airport designation and land
holdings significantly exceed the extent of the SPAZ, I infer that
there is no particular Issue (ie concern) that there is inadequate land
in reserve for future core activity expansion.
25
69 The Section 32 Report's Introduction describes proposed constraints
as "relatively limited" and related to development that could cause
adverse effects on the environment (paragraphs 45 and 48 above).
The Report quotes economic advice that food and beverage outlets
(cafés, restaurants, takeaways etc) and trade suppliers (of which
builders supply outlets are the largest and most commonly
recognised) need not be limited in the SPAZ.
70 By any objective reckoning, I consider that some non-terminal
retailing activities can clearly be permitted in the SPAZ, in reliance
on the matters identified in paragraphs 67 - 69 and on the wording
of Objective 12.12. I do not consider that sub-Policy 12.12.1(c) and
the 12.12.1(e) inclusion of trade suppliers (as large format retail
activities) as notified, are justifiable provisions in PC84, on the
evidence of those paragraphs.
71 However, there are two apparent dichotomies which I must address:
71.1 In the second-last quoted passage of paragraph 51, the s32
Report identifies that the economic advice received
discourages provision for lfr and specialty or department style
(a presumed typo intended to say "department store")
retailing, as such could give rise to adverse distributional
effects. At face value, the blanket term "large format
retailing" includes trade suppliers, which are distinguished in
the previous quotation (and the Plan) as not able to cause
adverse distributional effects.
71.2 In the final quoted paragraph of paragraph 51, the
introduction of the implicit criterion:
"… and is necessary to the functioning of the zone."
is completely unrelated to the distributional effect
considerations that are common ground in the Plan and the
rest of the s32 Report.
72 In relation to sub-paragraph 71.1, lfr is represented in nearly all
retail categories. In the City Plan context, the term refers to retail
outlets with gfa of 450m² or more. These encompass
supermarkets, large grocery, food or liquor stores, department
stores, large apparel and accessory stores, furnishing and larger
appliance stores, some sporting goods, book, stationery and duty
free outlets and a smattering of others. The consistently largest
however, is the category of building supply outlets, which are
classified as trade suppliers in the City Plan, a category which also
includes other suppliers like automotive accessory stores and
plumbers supply outlets. Unless evidence from Council indicates
otherwise, I am confident that lfr observations were not intended to
contradict the lack of concern about trade suppliers, from the
viewpoint of adverse distributional effects. As to other forms of lfr,
whether or not they may raise concern, they, with the exception of
one supermarket, are not intended to be accommodated in the
26
SPAZ. The CIAL submission does not seek to enable the
establishment of such activities. I do not therefore consider that
the apparent dichotomy is any more than that.
73 In relation to sub-paragraph 71.2, I have reviewed the August 2013
Property Economics Report ("PER 2013") commissioned by CCC3.
The topic of non-terminal retailing in the SPAZ appears in its Chapter
8, from part-way down p44. However, immediately above the
section concerned, under the sub-heading "Industrial" the subject of
trade-based activity is raised. The explanation for that
categorisation is found in the second of the two paragraphs,
especially the first and last sentences:
"For clarification trade based activity is included in this category…. These store types do not typically locate in centres for land economic and site requirement reasons, with light industrial zones being the typical zone / location of choice. These activities trade like, look like, perform like, are categorised like and function like light industrial activities, and as such are not considered retail stores, making the light industrial zone an appropriate 'fit' for such activity types."
(emphasis added)
74 I am unclear as to the nature of the "clarification", especially given
the final sentence of the paragraph at the top of page 45 of the
Report and bearing in mind that hardware and building supply
outlets are trade suppliers under the Plan's definitions and therefore
"retail activities". I refer further to this in paragraph 95.
"Trade supplier
Updated 16 November 2009 means a business engaged in sales to businesses and institutional
customers and may also include sales to the general public, and wholly consists of suppliers of goods in one or more of the following categories:
…. • building suppliers." "Retail activity Updated 16 November 2009 means the use of land or buildings for displaying or offering goods
for sale or hire to the public and includes, but is not limited to, food and beverage outlets, trade suppliers, yard based suppliers, service stations, second hand goods outlets and foodcourts."
(emphasis in text added)
I would add that building suppliers are the most visited type of trade
supplier in the marketplace, with leading brands that exhibit and
promote heavily to the general public, as well as to commercial
customers.
75 Notwithstanding their classification however, the PER 2013 is
unequivocal in stipulating (on page 44) that:
3 Found at Appendix 12 to the section 32 Report for PC84.
27
"The level of 'threat' trade supply stores will have on the KACs and Central City recovery is negligible in Property Economics view as they are not prevalent store types in these centres, and nor does their role, function, amenity, vitality, performance and viability of the centres rely of (sic) store types."
(emphasis added)
At page 46, it notes that non-convenience lfr in the general realms of
furnishings, appliances and notably, hardware, building and
garden supplies retailing are not integral, fundamental or critical
to the role and function that KACs play in the market. I agree
totally with this assertion, albeit substituting the term "district and
suburban centres" for KACs, in the City Plan context.
76 Furthermore, the economic assessment supports the immediate
provision of one-only supermarket and the inclusion of the SPAZ as
an option (among others) to meet future non-convenience (ie
comparison and specialty) shopping demands in the north-west of
the City. There is no nexus whatever, between this Report's views
and the fraught PC84 Policy thrust, of limiting retailing to that which
is necessary to the functioning of the SPAZ.
77 I therefore consider that the foregoing matters confirm that the s32
Report gives insufficient weight to the Report's thrust, in that:
77.1 building supply outlets should not be considered as generic
KAC lfr anchor outlets in the PER 2013 context, and that
therefore,
77.2 Policy 12.12.1(c)'s wording is not able to rely on that same
Report for its justification.
78 In my opinion therefore, the CIAL submission concerning the
wording of sub-Policies 12.12.1(c) and (e) is preferable to the
notified version. I support the CIAL's proposed amendments as
both appropriate and necessary.
5.3 The Rules in Relation to Retailing
79 Looking up the cascade from the bottom, the proposed Rules
represent the main method [given that PC84 otherwise adopts
operative methods used in the Plan] of giving effect to Policy
12.12.1, which implements proposed Objective 12.12. At the end
of the day, the Rules are paramount, as to what may or may not
occur, as of right and/or by way of application and consent. Given
my opinions in paragraphs 64, 67.4, 69, 70, 71.1, 72 and 73-77, I
support CIAL's submission on Rule 3.4.2 (cf paragraph 52 above).
With the addition of trade suppliers at Rule 3.4.2 9a) iii (as sought
by CIAL) the Rule package for retail and related commercial
activities in PC84 is very conservative, in my view. It enables the
following permitted development, outside the terminal:
A supermarket no larger than 2,700m² gla;
Retail and commercial services, individually <451m² and
no greater in aggregate extent than 1,400m² gla;
28
Food and beverage service outlets; and
Trade suppliers.
80 Turning first to the supermarket, it is in the medium size range of
full-service supermarkets in large urban areas, but the low range of
modern supermarkets in such situations, if walk-up CBD "Metro"
type stores are excluded. Those parts of the proposed Airport
Development Precinct that are likely to accommodate a super-
market are roughly equidistant from the two strong commercial
corridors to the north and west of the CBD, featuring both large
district centres and dedicated lfr centres, with additional out-of-
centre retailing prominent in the western corridor.
81 Within those two corridors, a residential wedge of suburbs (the
North Western Suburbs) more or less bisected by Memorial Ave,
has numerous roading connections to the corridor centres.
Historically, the commercial centre network that developed within
these suburbs has been convenience-orientated, with comparison
shopping and large-ticket purchasing increasingly directed to the
corridor centres (or to the CBD, to the extent that it has been
available since 2010/11). Within the blue-shaded area on the
Appendix One Map, there are two centres zoned B2 (Bishopdale
and Avonhead/Merrin Mall) whilst on the eastern literal edge of that
North-Western area, there are two more; mixed B1/B2 Zoned
Wairakei Rd / Bryndwr and Ilam North / Clyde Road centres. Both
contain very small supermarkets (around 1,000-1,2000m² gla).
With the limited exception of Bishopdale (which until quite recently
contained two supermarkets) these centres are contained by zoning
boundaries and by the development and zoning on the other side of
that interface.
82 The distributional effect evaluation which supported the Spitfire
Square application found that the development of the supermarket
would not have significant adverse distributional effects. From my
appreciation of the circumstances, I have no reason to doubt such
an assessment. In advancing that view, I am taking into account:
82.1 The extent to which an Airport-based supermarket would
cater for the opportunity to supply inbound travellers and
provide an anchor outlet around which other inbound-tourist
services can establish and better serve the visitor cohort of
the region's non-resident population.
82.2 The extent to which an Airport-based supermarket would
provide a convenient point-of-sale opportunity for those who
work within the Airport campus, or visit it (especially regulars
like taxi drivers, couriers and other transportation workers
who visit it for non-travel reasons).
82.3 The extent to which it is likely to meet the growing demand
for supermarket services among those resident (or shortly to
be resident) in the City's growing North-Western areas,
29
including the extent to which that is likely to divert custom
from existing centre-based supermarkets.
83 A 1,400m² threshold on retail and commercial service development
means that competition for space will ensure that its retail element
will be limited to less than 1,400m². The 450m² individual retail
limitation (which can not sensibly be applied to any foreseeable
commercial service activity) in conjunction with the former retail
constraint, ensures that only a small number of retail stores, none
of them destinational in character, can be established. Such a
limit absolutely precludes the establishment of any kind of
comparison or specialty shopping area, which could compete
directly with established district centres.
84 The absence of constraints on prepared food and beverage services
reflects the fact that such activities have no fundamental under-
pinning role for district or suburban centres, above the smallest of
the latter hierarchical examples. Apart from the potential enabling
of high profile fast food outlets (such as McDonalds) which basically
redistribute trade as between their own and other fast food outlets,
most cafés and restaurants and lower profile prepared food outlets
only "feed" on the level of trade generated by retailing or
employment in their environs. In the case of restaurants,
relatively stand-alone traders can survive or prosper in non-
commercial locations, but normally in circumstances that are more
"amenable" than an Airport precinct. To the extent that such
activities may be able to function successfully outside the terminal
pursuant to Rule 3.4.2 9a) ii, they deserve to be enabled. They
will not adversely affect other centres or communities, whilst
benefiting Airport users.
85 Turning to trade suppliers, the case for enabling such within the
SPAZ is based on their differentiation from other retail activities in
the City Plan and the expert retail / economic evidence (including
the PER 2013) that such outlets do not compete materially with
district or suburban centres. Additionally, there is a current and
foreseeable enhanced demand for such outlets, in the CCC
circumstances. Whilst such activities may have little potential
trading support from Airport personnel and visitors, there is no
distributional basis for excluding them, either in real-world terms,
or as a consequence of the Plan's Issues and Objectives, including
PC84's proposed Objective 12.12. The only appropriate basis for
their exclusion as permitted activities would be concern about their
potential to inhibit future core Airport activities.
5.4 Conclusions regarding Submissions
86 I would observe that outside the provision for a 2,700m²
supermarket, pursuant to Rule 3.3.1, the default situation for other
retail activities, as discussed in above paragraph 50, is
discretionary or non-complying. In my professional opinion, a
permitted gfa or gla threshold beyond which any breach is non-
complying is inherently inequitable. If a 1,400m² threshold is
"safe", the classification of a 1,401m² proposal as non-complying is
30
unrealistic, in my opinion. I would expect to see provision for an
intermediate expansion of such a "safe" threshold as discretionary,
before an absolute non-complying status is applied. The fact that
such a PC84 provision has not been included (or sought) reinforces
my opinion that the 1,400m² retail threshold in proposed Rule 3.4.2
9a) should be regarded as a minimum, when consideration is given
to submissions seeking its cancellation.
87 In my opinion, provision for significantly more such activity, as
discretionary or restricted discretionary activities, would have been
appropriate, together with criteria that ensured assessment of the
wider distributional effects of such expansion. No such provision
has been made in PC84, nor has it been sought, but I consider that
at the very least, the net approach supported by CIAL is
conservative and appropriate.
88 Some other Submitters explicitly or implicitly oppose the provision
for a supermarket and associated retail activity. My position, based
on my experience, is that it would have been remiss of the drafters
of PC84 to not recognise the Spitfire Square resource consent, when
updating the SPAZ provisions. It should be clear from my evidence
that in terms of demographics and trade, circumstances since the
grant of that consent reflect increasing buoyancy in demand. This,
at the very least, supports whatever basis underlay the proposal,
possibly enhances that basis and provides no grounds to consider
deliberately ignoring the consent, in my opinion.
89 Turning directly to those other submissions, my opinions are as
follows:
89.1 NZTA's further submission opposes all aspects of the CIAL
primary submission. I have no professional view about the
merits of both NZTA submissions, from the viewpoint of
transportation concerns. However, for reasons I have
detailed above, I consider that the NZTA's position
concerning proposed Policy 12.12.1 is neither supported by
Objective 12.12, nor by the City Plan, the s32 Report or the
factual commercial circumstances of the City.
89.2 NIT's submissions on the provisions for retailing go beyond
those of NZTA, by seeking to cap terminal-based retailing at
October 2013 levels. I consider that to disenable CIAL's
need to cater within the terminal for growing passenger and
associated personnel counts, in the absence of any City Plan
or real-world provenance for such a Policy, is unreasonable.
89.3 The JDV / Canterbury Trustees (2012) submissions raise no
matters concerning distributional aspects of PC84 that I have
not already referred to above, and/or expressly or implicitly
in the earlier paragraphs of part 5.0. I do not consider, from
the viewpoint of my expertise, that the JDV position is
appropriate.
31
89.4 Calder Stewart adopts a similar approach to the above
submissions, but with one exception. It supports the
provision of trade supply outlets in the SPAZ, provided they
are stand-alone outlets. From this I take it that the
Submitter is opposed to a planned trade supply precinct. I
infer that the Submitter's support for such a constraint is
rather less driven by urban design considerations than by
concerns about scale and impact. In the latter regard
however, so long as participants were to qualify as trade
suppliers, there would be no material impacts on centres.
Insofar as scale and integration are concerned, the precinct
approach would represent a significantly more efficient use of
land and greater efficiency and convenience for potential
customers. I do not consider that there is any justification
for the stand-alone requirement, so apart from supporting
the inclusion of trade suppliers as permitted activities in the
SPAZ, I oppose the rest of this submission.
89.5 Bunnings' further submission is supportive of the CIAL
submissions, which I support.
89.6 Progs' further submission is covered either by my generic
comments in paragraph 70 above, or those given re sub-
paragraphs 82.1-82.3 above. I support this submission.
6.0 S42A REPORT & EVIDENCE OF MR HEATH
90 The s42A Report is accompanied by appendices, some containing
statements of evidence from experts. Appendix 9 contains the
evidence of Mr Tim Heath, dated nearly a year from completion of
his 2013 Report (which forms Appendix 12 to the section 32
assessment for PC84). I have reviewed Mr Heath’s s42A statement
in light of the PER 2013 and comment on it below.
6.1 2014 Evidence of Mr Heath
91 After introductory comments, Mr Heath retrospectively outlines the
"Key Baseline Findings" of the PER 2013. This summary does not
identify that the PER 2013 recommended adoption of a scenario (one
of four) in which trade supply activity would be provided for (PER
2013, page 9, second bullet) albeit in the context of light industry,
as I commented on in paragraphs 70-74 above. The statement
goes on in paragraphs 19-25 to discuss the notified provisions. As
these do not provide for trade suppliers, they are not mentioned.
Nor is the dichotomy raised in the "SPAZ Retail Overview", which
takes the evidence through to paragraph 33.
92 In my opinion, this is an example of "the elephant in the room",
which in this case, relegates a change of position to side-stage,
insofar as the "higher level" discussion in Mr Heath's statement is
concerned. In fact, and significantly in my opinion, there is no
32
passage within Mr Heath's evidence, which clarifies and explains why
the latter is inconsistent with the PER 2013. In the absence of such,
and in support of the CIAL position, I am therefore obliged to
illustrate and exemplify my concerns.
93 Before doing so however, I wish to refer to what Mr Heath terms the
"CIA Core Retail Catchment" in paragraphs 28-30 and Figure 1 of his
statement4. The latter can not represent a retail catchment,
because there was no retail activity outside the terminal in
December 2008 to which retail shoppers could have been attracted.
It is a surrogate Airport-influence marker, having no regard to the
significant retail and associated functions of large centres at or near
its periphery. My concern is that if the geographic area depicted on
Figure 1 is accepted at face value, as a potential catchment for any
Airport Centre, the latter may implicitly (and quite wrongly) be seen
as having widespread adverse distributional connotations –
especially as the evidence is more or less silent on the absence of
such, were trade suppliers permitted.
94 To some extent, such a perception is or should be diluted by
comments in paragraphs 31-33 of Mr Heath's statement. These
implicitly recognise that the catchment influences of any centre are
primarily determined by the nature and extent of its retail and
related activities, having regard to the nature, location and extent of
the influences of competing centres. However, I am aware that "a
picture is worth a thousand words" and it is the picture, captioned as
a catchment, to which my last comments are addressed.
95 Picking up the thread from paragraph 92 above, I turn to paragraph
77 of Mr Heath's evidence, with its list of activities classified as
wholesale, for statistical purposes. In Appendix Three, I have
provided excerpts from the ANZSIC 2006, including the differences
between activities with similar product ranges, by which they are
categorised as "wholesale" or "retail". I have added some
explanatory notes and emphasis to otherwise original ANZSIC 2006
pages. This material reinforces that trade suppliers are a subset of
retail and that the concept of a wholesale trade supplier has no
distributional context. The material reinforces and explains my
earlier comments at paragraphs 73-75, concerning the context given
building suppliers and wider trade supply activities in the PER 2013,
relative to Statistics NZ categories and the operative Plan's
provisions.
96 Notwithstanding what I perceive to be material inconsistencies in
that approach, Mr Heath's evidence from paragraphs 78-82 makes
no attempt to rationalise the approach discussed in paragraph 92
above. In fact, I consider these paragraphs to reinforce the change
of direction to which I referred in paragraph 92.
97 It is stated in paragraph 64 of Mr Heath's evidence (in a broader lfr
context) that:
4 The same data was included in the PER 2013
33
"The balance of other non-convenience LFR activity is generally in the retail sectors of:
• Furniture, Floor Covering, Houseware and Textile Goods Retailing • Electrical and Electronic Goods Retailing."
This passage omits the third bullet of the PER 2013, which, in the
same context and otherwise identical paragraph, added a third bullet
to the above two:
"• Hardware, Building and Garden Supplies Retailing, albeit this
activity type is considered a trade based activity and should be treated as such for strategic planning purposes."
(emphasis added)
98 In the distributional context of the PER 2013, provision for such an
activity within the SPAZ was explicitly supported. In his s42A
statement, when discussing distributional effects, it rates no
mention, that I can find, prior to paragraph 92 of his statement,
under the topic "Comparative Industrial Area Analysis". However,
that mention is specifically focused on what is termed "the Wholesale
Trade sector", which I discussed in above paragraphs 92 and 93 and
in respect of which I introduced Appendix Three. Thus, it does not
refer to the unqualified trade suppliers which are defined in the Plan.
The approach is inconsistent with the PER 2013, as is the description
"a non-retail RMA issue"
at paragraph 95 of Mr Heath's statement.
99 The above approach leads to a suggested
"Wholesale Trade GFA trigger of 2,500 sqm"
in paragraph 98 of the evidence, qualified as invoking discretionary
consent status. I am at a loss in trying to rationalise this end point
of the foregoing devolution from the clear PEL 2013 findings to a
recommended rule purporting to apply to wholesalers, who have no
propensity whatever to adversely impact on centres and their
communities, under the guise of "a non-retail RMA issue". This
dichotomy is hinted at in Mr Heath's paragraph 113. None-the-less,
the "trigger" proposal is reiterated in his "Conclusion", ending at
paragraph 119 with what I find to be a completely confounding
definition of it as:
"… a simple and pragmatic retail mechanism…."
(emphasis added)
6.2 The Section 42A Report
100 Following on directly from the previous paragraph, I note that Rule
3.4.2 b) is subject to changes recommended in the s42A Report
concerning notified clause 9 and the introduction of a new clause 18.
100.1 At clause 9, trade suppliers are specifically detached from the
provisions covering retail activities.
34
100.2 New clause 18 is worded as follows, to provide for
"Trade suppliers not otherwise provided for as a permitted activity,
limited to a total gross leasable floor area within the zone, of 2,500m²."
101 These amendments have no provenance arising from Mr Heath's
evidence, in my opinion:
101.1 The added words at clause 9 do not, for practical purposes
alter the notified provision, beyond requiring that the
1,400m² retail activity threshold can not include any trade
suppliers. However, the wording of proposed clause 18 can
not be interpreted as applying to trade suppliers as defined in
the Plan, if this provision is adopted.
101.2 Clause 18 otherwise introduces a cumulative zone threshold,
above which "wholesale trade suppliers" would be non-
complying.
101.3 Mr Heath, in his statement of evidence, provides no
unambiguous discussion, opinion or explanation concerning
the distributional effects of what I might describe as "normal"
trade suppliers, having regard to the PER 2013's findings on
the matter. However, subject to the ambiguity inherent in
its last two sentences, paragraph 37 opens on a note at least
consistent with the PER 2013 thrust. At face value, the
words concerned imply continuing support for Mr Heath's
2013 opinions. At the end of the day however, there is no
updated guidance in the evidence concerning defined trade
suppliers. I do not believe that the Rule changes can be
attributed to Mr Heath's advice.
102 The rationale presented in relation to the amended trade supplier
proposals is set out on page 24 of the s42A Report. However,
paragraphs 5.32 and the top of paragraph 5.33 reveal an absence of
rational (step-by-step) justification.
102.1 Paragraph 5.32 discusses submitter positions about trade
supply activities but does not recognise that in the context of
their submissions, especially those having regard to the PER
2013, trade suppliers means what the Plan says it means.
That is the only conceivable basis on which the submissions
could have been made. However, the first sentence of
paragraph 5.33 posits the response as one responding to the
submissions. In fact, it has no relationship to the
submissions, because the response contains no outcome in
relation to the submissions. The provision that has been
made is for activities that qualify as wholesalers, not trade
suppliers.
102.2 As the originator of the definition of and provision for "trade
suppliers" in the City Plan (in the context of Variation 86) I
can state with certainty that the definition "trade suppliers"
35
does not extend to legitimate wholesalers. The terminology
of "wholesale trade suppliers" is a contradiction in terms and
in my view, is an oxymoron. Wholesalers are wholesalers.
102.3 There is no distributional evidence to support the discussion
on page 24 of the Report. Most of paragraph 5.33 ignores
the above dichotomy. Reference to "larger building
suppliers" in the final sentence is gratuitous, in that there is
no evidence in Mr Heath's statement (or in the PER 2013) to
support the contention.
102.4 The reliance on the retail evidence of Mr Heath part-way
through paragraph 5.34 is misleading and equally off-point
for the reasons outlined above. Any "retail" trade supply
issues were sidelined and bypassed in the latest evidence of
Mr Heath. What is more, Mr Heath did not propose a zone-
wide threshold. He proposed an individual store threshold,
above which applications for a discretionary consent would
have to be made. Use of the word "accordingly" in the final
sentence of the paragraph is therefore not appropriate. The
provisions do not accord with Mr Heath's evidence and are
completely opposite to the more transparent views expressed
in the PER 2013.
103 Paragraph 5.35 reads as follows:
"I have also recommended some consequential amendments to the objectives, policies and explanatory text to reflect the changes above. These are detailed in Appendix 4."
I refer to these "details" below, but in the context that my
appreciation of the RMA is that methods and rules are supposed to
implement policies and give effect to objectives, not to formulate
them.
104 Turning first to the proposed changes to Objective 12.12, I refer only
to sub-Objective (d). For reasons that I have already outlined in
paragraphs 55-58, I agree with all but the final provision. However,
insofar as retail parks are concerned, having regard to their health
is, by their nature and definition, inconsistent with the Plan's
emphasis on the City's centres. These lfr centres are commercially
driven and are not justifiable where they would significantly
adversely affect the wider role and community function of district
centres. I therefore consider that aspect of the proposed
amendment to be inappropriate.
105 Turning to proposed changes to Policy 12.12.1, I focus on the s42A
Report's suggested amendments at clauses (b) and (c) of that
provision:
105.1 Proposed amendments at clause (b)(ii) include repetition of
the provision to protect the function of retail parks. For the
reasons set out in paragraph 104, I consider that aspect of
the s42A recommendation to be inappropriate.
36
105.2 For reasons already outlined at length, there is no
justification attributable to Mr Heath's work on distributional
effects, for the recommended introduction of this Policy
element, as sub-Policy (b)(iii).
105.3 Insofar as the new introduction to sub-Policy 12.12.1 is
concerned, there is no distributional justification whatever for
its incorporation in the City Plan. I need not re-iterate the
many reasons why.
106 For the reasons summarised above, but elaborated upon in more
detail throughout this statement, I consider the proposed s42A
Report's above Policy recommendations to lack justification and to be
contrary to s5 of the RMA. They are not consistent with any real-
world Objective and rely upon Policy enunciations that are
unsupported by expert evidence. They represent the Report's Rule-
focused tail wagging the Objective and Policy dog.
107 From the viewpoint of a distributional effect analysis, I consider that
the s42A Report's evaluation is flawed and unsupportable in a s32
context. I consider that its rejection of CIAL's submission lacks
distributional integrity.
Dated: 30 July 2014
Mark Gauntlett Tansley
APPENDIX ONE : DEMOGRAPHIC DATA
A1
1. All tabular information in this Appendix has been sourced from Statistics NZ, with added
calculations by Marketplace NZ Ltd.
2. Area units (aus) contributing to the North-Western Area, including Yaldhurst, are illustrated
on the City's Area Unit Map overleaf and detailed in Tables herein. The Yaldhurst au
contains all of the SPAZ, and, mainly to the Airport's south-west, it includes Rural zoned
land, with minor other Zone contributions, none of them of a Business nature. Apart from
some Primary Industry employment and a small number of persons who work from home,
the SPAZ would, for practical purposes, be the venue of almost all of the au's job/workplace
counts.
3. Tables 1A and 2A are considered self-explanatory, assisted by the brief comments at
paragraphs 2.2.1 and 2.3.1 of the statement to which this Appendix is attached.
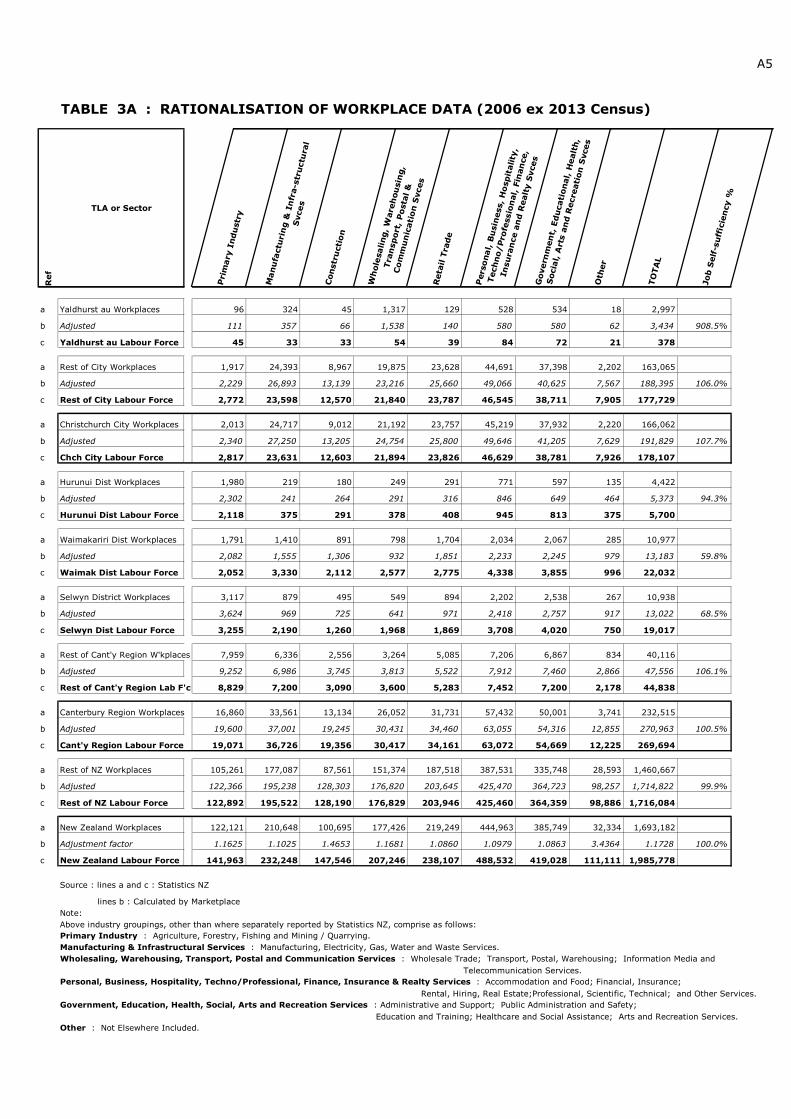
4. Tables 3A and 3B however, require additional explanation. They adopt a consistent format,
drawing upon data from the 2013 census, which also incorporated comparable 2006 data
aligned to the revised area unit boundaries. Lines a and c for each geographic area
represent census counts; "a" being job location and "c" the residential location of persons
actively working full or part-time. The lines do not necessarily cross-add exactly, as all
census data of this kind is randomly rounded. The adjustments on lines b of the tables are
explained as follows:
(1) As can be seen from the NZ data, the general trend is for line c values to exceed the
values of line a. This is due to a combination of factors, including that:
(i) Some jobs (especially in the construction and transport industries) are not
associated with a fixed workplace; whilst
(ii) Unlike the home addresses from which census returns are collected, places of
employment can be inadequately or not identified.
(2) Notwithstanding the discrepancy, the actual value of line a, at the national level, must
be the same as that of line c. Residents not enumerated in the census do not appear in
either line.
(3) Different groups of industries have different propensities to identify a primary
workplace. At the NZ level, the line b adjustment factors identify the shortfall in line a
and therefore, the average propensity to under-account for job locations, in that group.
For the purpose of Tables 3A and 3B, that NZ-wide propensity is adopted as the
adjustment factor for each column. This results in the workplace shortfall being
adjusted pro-rata, using the adjustment factor. In the Yaldhurst au, for example, 96 x
1.1625 Primary Industry jobs converts to an effective 111 workplaces, including workers
"at large".
(4) It is pointless to adopt declared workplaces from census to census as a guide to change.
In the Table 3A total column, 85% of the employed labour force in 2006 identified a
workplace at District or City level. That 15% shortfall shrank to 9% in the 2013
census, presumably as a result of a greater level of rigour being applied by
enumerators, before accepting the response to the workplace question. Only the
adjusted data, at local authority level, provides helpful comparisons.
(5) Data by au is collectively less helpful, as some responses identifying a local authority
area; eg Christchurch, will be included in the City total but will not appear in a specific
area unit. For that reason, the Yaldhurst workplace values will be understated, in both
lines a and b. This results in line b of the Yaldhurst results being a conservative tally of
its effective employment contribution.
5. The data in Tables 3A and 3B shows a NZ-wide increase of less than 1% in the numbers
engaged in 2013, relative to 2006. In Christchurch City, notwithstanding the earthquake
effects, the increase essentially paralleled that trend. In the Yaldhurst au however, effective
workplaces increased by around 60% or 7% pa compounded. For the reasons explained in
sub-paragraph (5) above, data in both 2006 and 2013 is likely to be understated, relative to
the City equivalent, if such comparisons are made.
A3
TABLE 1A : POPULATION CHANGES 2001-2013 (2013 Census - Statistics NZ)
2001 Population 2006 Population 2013 Population
Usually Census Difference Usually Census Difference Usually Census Difference
Resident Night - Resident Night - Resident Night -
Rental, Hiring, Real Estate;Professional, Scientific, Technical; and Other Services.
Government, Education, Health, Social, Arts and Recreation Services : Administrative and Support; Public Administration and Safety;
Education and Training; Healthcare and Social Assistance; Arts and Recreation Services.
Other : Not Elsewhere Included.
APPENDIX TWO : Excerpts from the CHRISTCHURCH RETAIL TRADE
INDICATOR – March 2014 Report Qtr
Christchurch Retail Trade Indicator: March 2014 quarter Embargoed until 10:45am – 24 June 2014
Key facts For the March 2014 quarter, compared with the December 2013 quarter, seasonally adjusted figures show that in Christchurch city:
� Total retail and hospitality sales rose 1.5 percent (nationally, sales rose 0.7 percent). � Retail sales rose 1.8 percent. � Hospitality sales fell 0.1 percent.
Total retail and hospitality growth was similar for Christchurch and New Zealand before the earthquakes, but diverged markedly between the June 2010 and September 2012 quarters. Increases in the Christchurch series over the past year have moved it further ahead of the
national growth level.
Liz MacPherson, Government Statistician ISSN 2253-2803 24 June 2014 � Christchurch retail and hospitality sales move further ahead
� Retail trade sales continue to rise � Hospitality sales fall � Caution about using data
All values are seasonally adjusted, unless otherwise stated, and are not adjusted for price change.
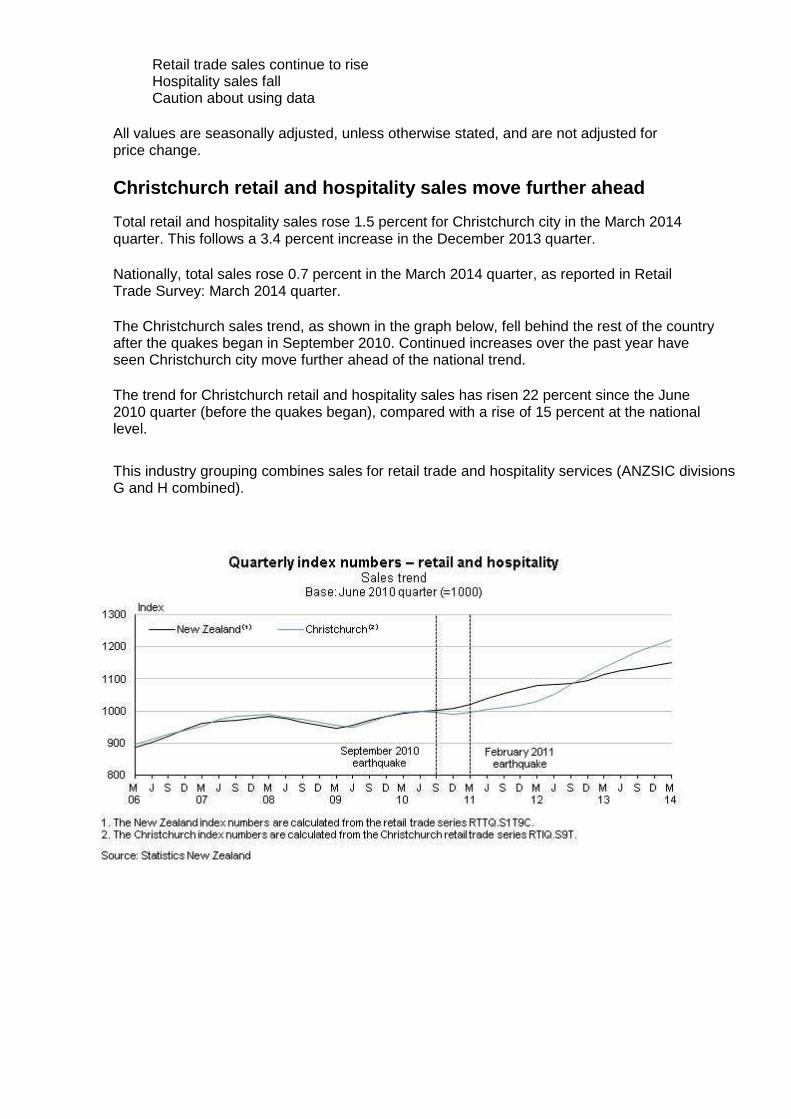
Christchurch retail and hospitality sales move further ahead
Total retail and hospitality sales rose 1.5 percent for Christchurch city in the March 2014 quarter. This follows a 3.4 percent increase in the December 2013 quarter.
Nationally, total sales rose 0.7 percent in the March 2014 quarter, as reported in Retail Trade Survey: March 2014 quarter.
The Christchurch sales trend, as shown in the graph below, fell behind the rest of the country after the quakes began in September 2010. Continued increases over the past year have seen Christchurch city move further ahead of the national trend.
The trend for Christchurch retail and hospitality sales has risen 22 percent since the June 2010 quarter (before the quakes began), compared with a rise of 15 percent at the national level.
This industry grouping combines sales for retail trade and hospitality services (ANZSIC divisions G and H combined).
Christchurch retail sales rose 1.8 percent in the March 2014 quarter. This follows a large increase of 4.2 percent in the December 2013 quarter.
The trend for Christchurch retail sales has risen strongly (up 26 percent) since the slight fall in the December 2010 quarter. This growth continues to be driven by hardware, building, and garden supplies.
The retail industry grouping (ANZSIC division G) includes businesses that mainly sell goods to the public, including motor vehicle and parts retailing, fuel retailing, food retailing, and other store-based and non-store retailing. This grouping currently accounts for 87 percent of the total
retail and hospitality sales in Christchurch.
Hospitality sales fall
Hospitality sales in Christchurch have fallen 0.1 percent in the March 2014 quarter, following decreases of 1.2 percent and 1.0 percent in the December 2013 and September 2013 quarters, respectively.
The trend for hospitality sales has eased slightly in recent quarters, following five quarters of growth, and is 16 percent higher than the most-recent low point in the March 2012 quarter.
The hospitality industry grouping (ANZSIC division H – Accommodation and food services) includes businesses that mainly provide short-term accommodation for visitors, and food and
beverage services. The hospitality group currently accounts for 13 percent of total retail and hospitality sales in Christchurch. About three-quarters of these sales are for food and beverage services, and the rest for accommodation.
Caution about using data
The Christchurch retail trade indicator is an experimental series. We release it to provide information on the state of the Christchurch retail trade industry after the Canterbury earthquakes began in September 2010. The statistics are provisional, because they reflect new methods that we may modify.
When interpreting the data, we recommend focusing on movements in the series rather than the level of sales, because:
� there is a known undercoverage of businesses with no suitable GST or RTS data � sales of capital items may be included in the data � income from insurance payments may be included in the data.
For more information about the design and limitations of the Christchurch retail trade indicator series, see the data quality section.
For more detailed data see the Excel tables in the ‘Downloads’ box.
APPENDIX THREE : Excerpts from the AUSTRALIAN AND NEW ZEALAND
STANDARD INDUSTRIAL CLASSIFICATION (ANZSIC) - 2006
[the version in current usage in 2014]
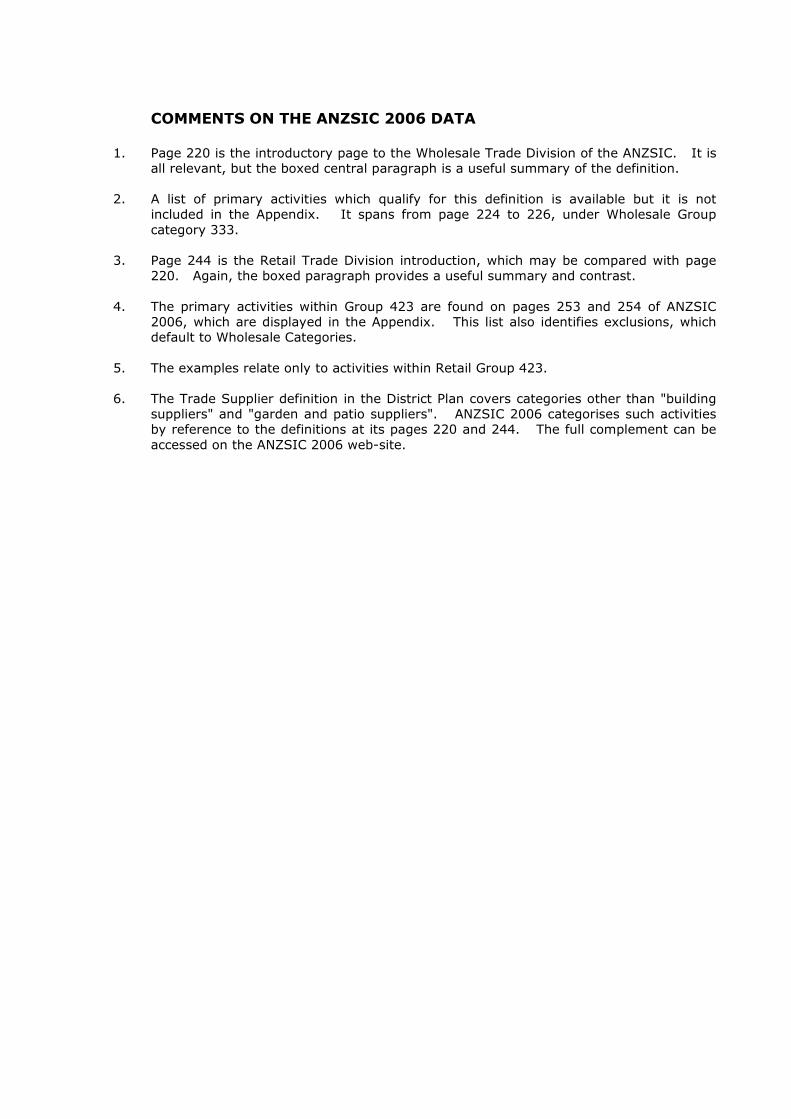
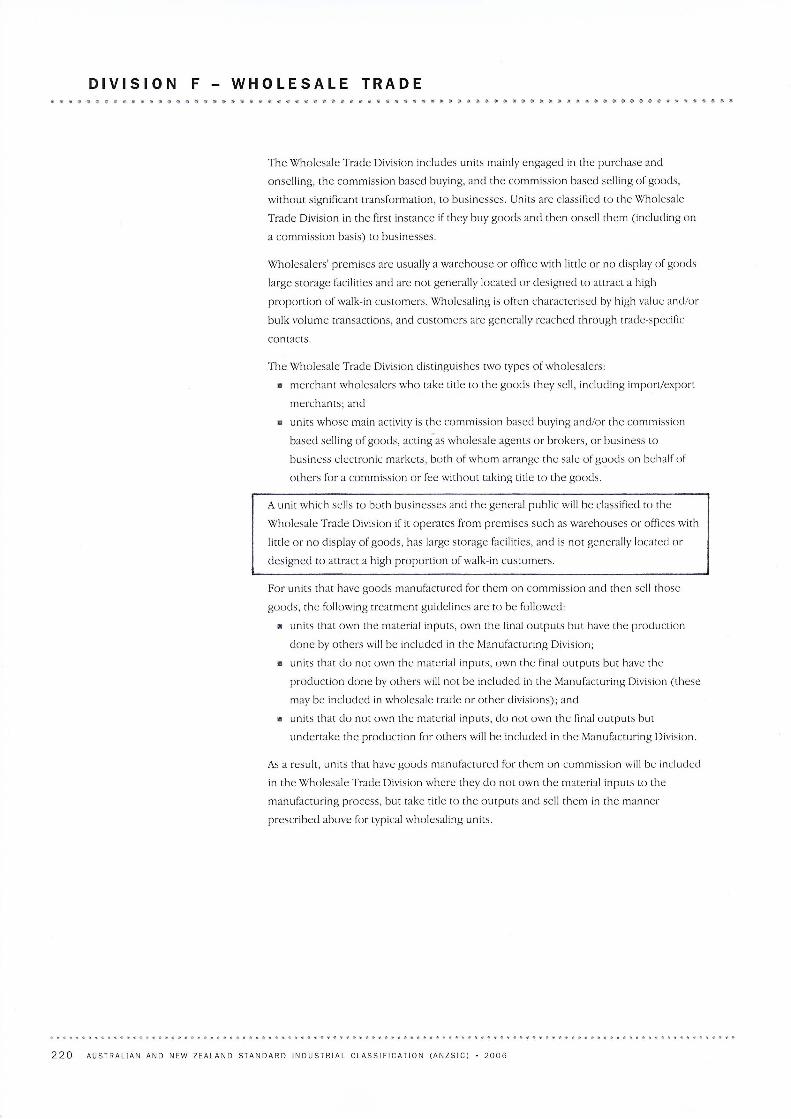
COMMENTS ON THE ANZSIC 2006 DATA 1. Page 220 is the introductory page to the Wholesale Trade Division of the ANZSIC. It is
all relevant, but the boxed central paragraph is a useful summary of the definition.
2. A list of primary activities which qualify for this definition is available but it is not
included in the Appendix. It spans from page 224 to 226, under Wholesale Group
category 333.
3. Page 244 is the Retail Trade Division introduction, which may be compared with page
220. Again, the boxed paragraph provides a useful summary and contrast.
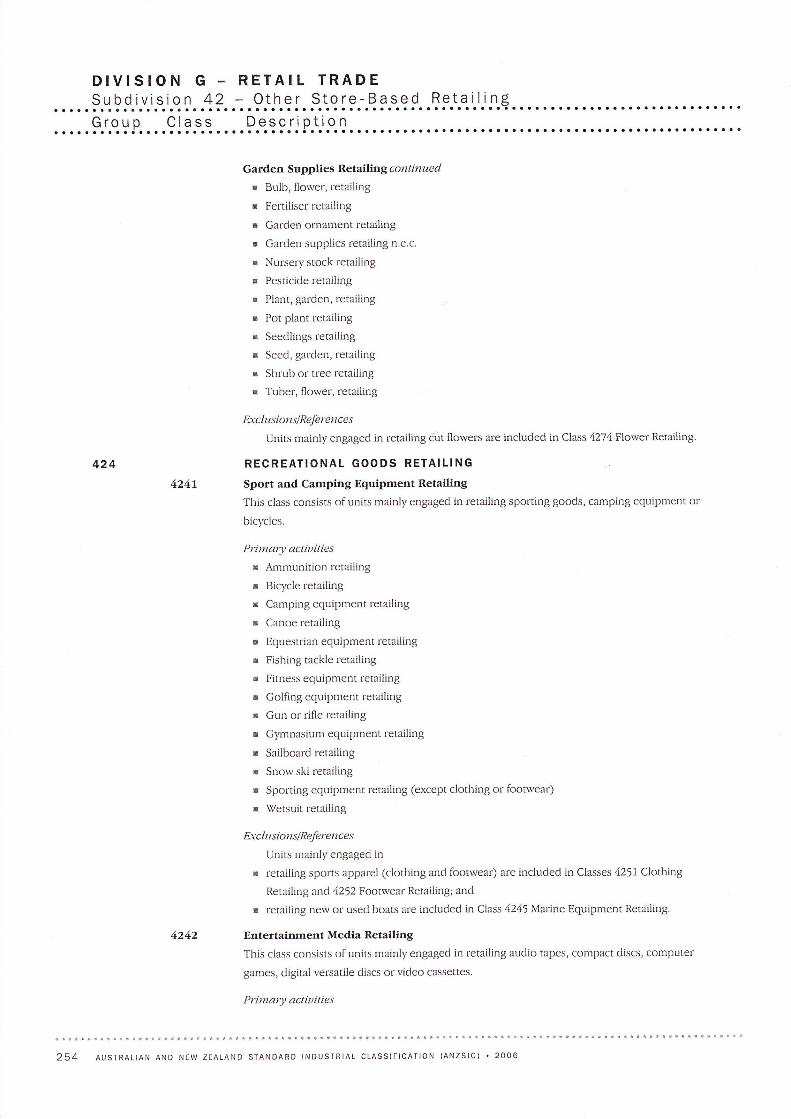
4. The primary activities within Group 423 are found on pages 253 and 254 of ANZSIC
2006, which are displayed in the Appendix. This list also identifies exclusions, which
default to Wholesale Categories.
5. The examples relate only to activities within Retail Group 423.
6. The Trade Supplier definition in the District Plan covers categories other than "building
suppliers" and "garden and patio suppliers". ANZSIC 2006 categorises such activities
by reference to the definitions at its pages 220 and 244. The full complement can be


![Holographic superconductors and spatial modulationPT does not necessarily need to be broken [Donos,Gauntlett]. Examples, in magnetic eld: in D=4,5 with mixing term ˚ F ^G [Donos,Gauntlett,CP]](https://static.documents.pub/doc/80x56/5f57daf7b167d10bdb3daad1/holographic-superconductors-and-spatial-modulation-pt-does-not-necessarily-need.jpg)
![INDEX [resources.ccc.govt.nz]resources.ccc.govt.nz/files/TheCouncil/policiesreportsstrategies/... · INDEX PART ONE: BRIEF ... civic square for the purpose of community gathering,](https://static.documents.pub/doc/80x56/5aac91207f8b9aa9488d29fb/index-part-one-brief-civic-square-for-the-purpose-of-community-gathering.jpg)


