Budget Paper No. 4 Presented by the Honourable John Brumby MP Treasurer of the State of Victoria on the occasion of the Budget 2005-06 2005-06 Statement of Finances (Incorporating Quarterly Financial Report No. 3)
Transcript
2005-06 Statement of Finances(Incorporating Quarterly Financial Report No. 3)Budget Paper No. 4www.budget.vic.gov.au
2005-06 Statement of Finances (Incorporating Q
uarterly Financial Report No. 3)
Budget Paper No. 4
Budget Paper No. 4 Presented by the Honourable John Brumby MP Treasurer of the State of Victoria on the occasion of the Budget 2005-06
2005-06 Statement of Finances (Incorporating Quarterly Financial Report No. 3)
Printed on recycled paper
■
■
The Secretary Department of Treasury and Finance 1 Treasury PlaceMelbourne Victoria 3002 Australia
2005-06 Budget Paper set includes: Budget Paper No. 1 – Treasurer’s Speech Budget Paper No. 2 – Strategy and Outlook Budget Paper No. 3 – Service Delivery Budget Paper No. 4 – Statement of Finances (Incorporating Quarterly Financial Report N0. 3) Budget Overview
Published by the Department of Treasury and Finance
This book is subject to copyright. No part may be reproduced by any process except in accordance with the provisions of the Copyright Act.
ISSN 1 440-6969
Published May 2005 by authority
Front cover images The Peace Tower (2003), artist Suesy Circosta in collaboration with residents of the Collingwood housing estate ‘Work for the Dole’ participants and volunteers from the City of Yarra The Voices of Atherton Gardens Choral Group photographed by Angela Bailey 2004
Statement of Finances 2005-06
Presented by
The Honourable John Brumby, M.P. Treasurer of the State of Victoria
Auditor-General’s Report....................................................................................................8 Department of Treasury and Finance statement in relation to the Estimated Financial Statements ...........................................................................................................................9 Estimated Financial Statements for the Victorian general government sector....................10 Notes to the Estimated Financial Statements .....................................................................13
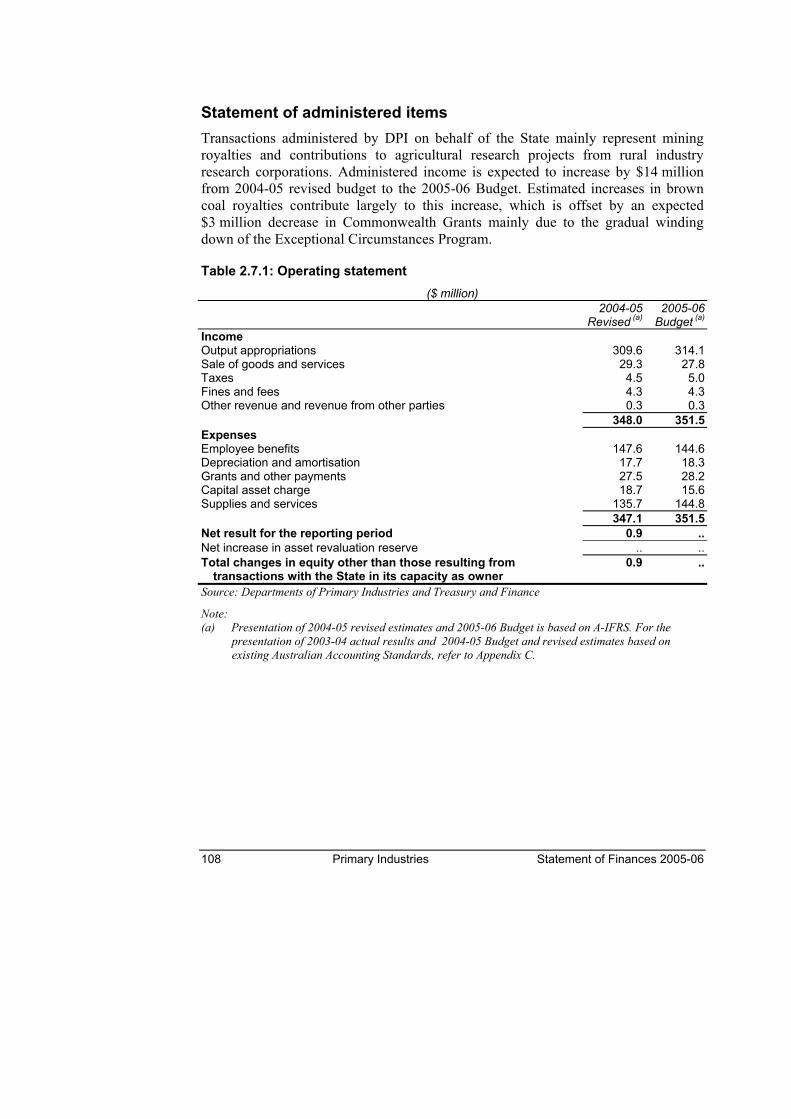
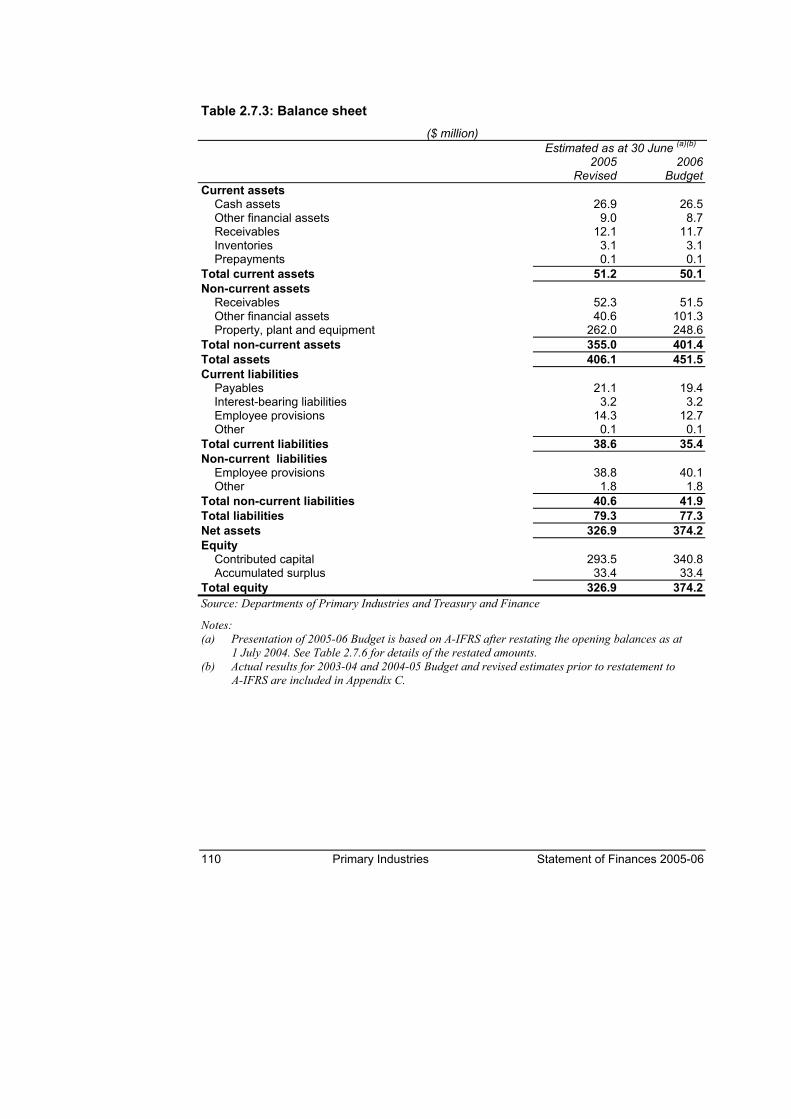
Chapter 2 – Departmental Financial Statements .................................................. 55 Department of Education and Training ...............................................................................57 Department of Human Services..........................................................................................66 Department of Infrastructure...............................................................................................75 Department of Innovation, Industry and Regional Development.........................................84 Department of Justice.........................................................................................................91 Department of Premier and Cabinet .................................................................................100 Department of Primary Industries .....................................................................................107 Department of Sustainability and Environment.................................................................115 Department of Treasury and Finance ...............................................................................124 Department for Victorian Communities .............................................................................132 Parliament of Victoria........................................................................................................139
Chapter 3 – State Revenue.................................................................................... 145 Summary of general government sector revenue.............................................................145 State sourced revenue......................................................................................................147 Grants...............................................................................................................................160
Chapter 5 – Public Account .................................................................................. 179 Consolidated Fund ...........................................................................................................179 The Trust Fund .................................................................................................................179
Chapter 6 – Uniform Presentation of Government Finance Statistics ............. 193 The accrual GFS presentation..........................................................................................193 Institutional sectors...........................................................................................................194 Uniform Presentation Framework tables...........................................................................196 Victoria’s 2005-06 Loan Council Allocation.......................................................................208
Appendix A – Historical and Forward Estimates Tables ................................... 211
ii
Table of Contents (continued) Appendix B – Revised 2004-05 Budget Outcome ............................................... 233
Presentation of 2004-05 revised outcome on A-IFRS basis..............................................233 Revised 2004-05 statement of financial performance under existing Australian Accounting Standards.......................................................................................................238 Revised 2004-05 cash flow statement ..............................................................................243 Revised 2004-05 statement of financial position...............................................................245
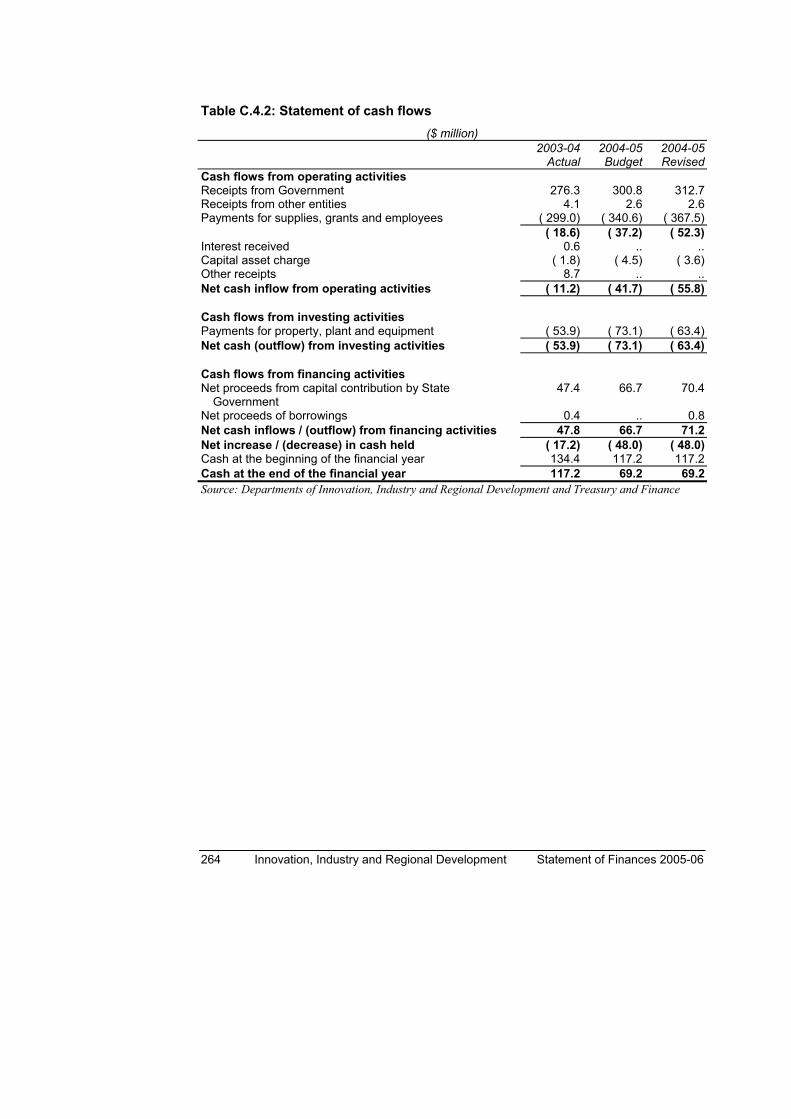
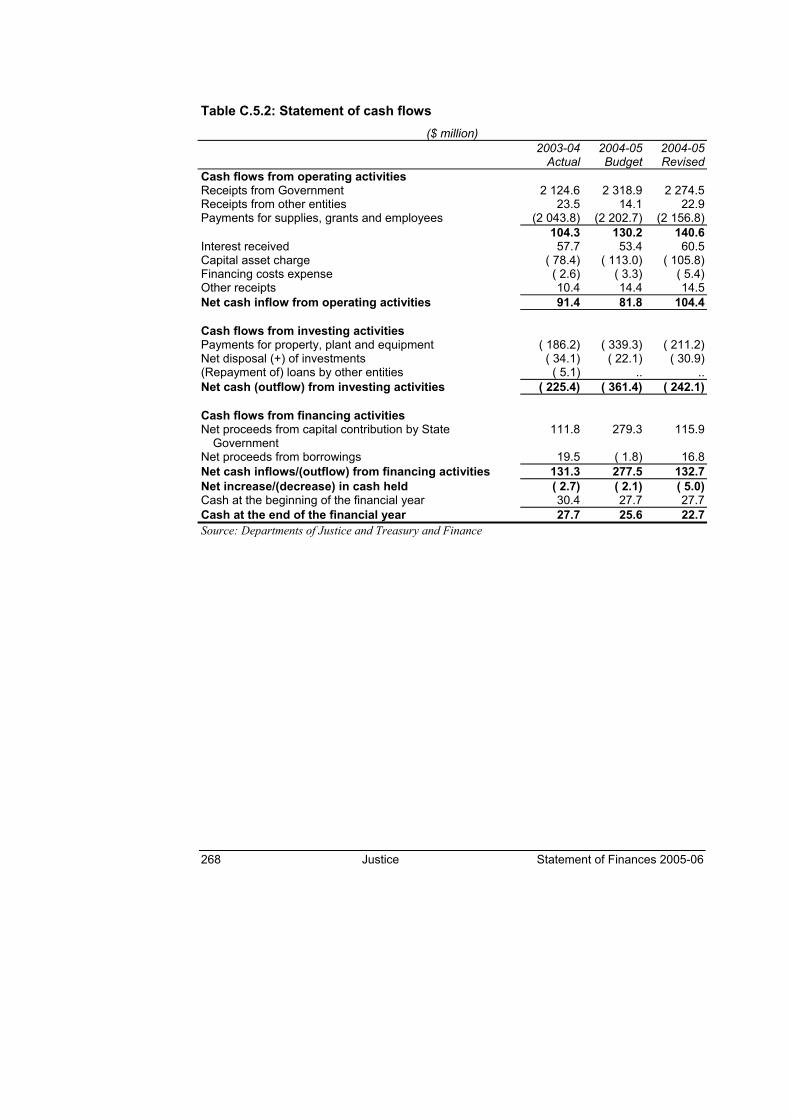
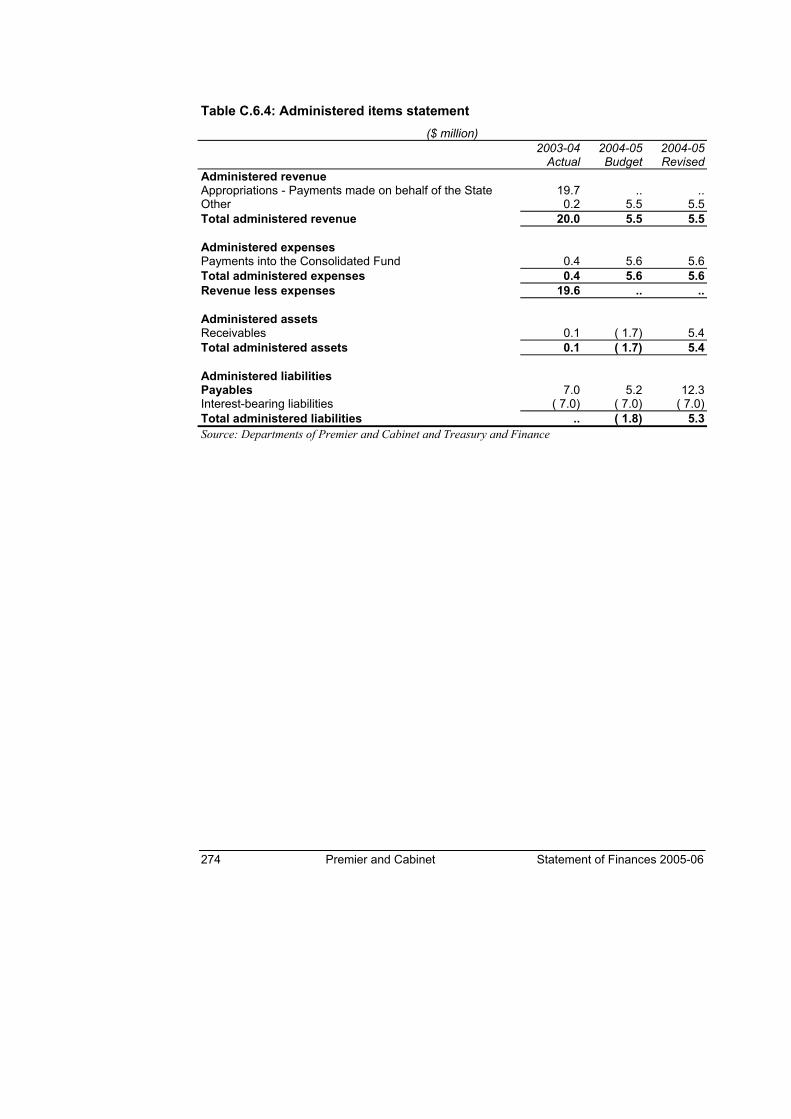
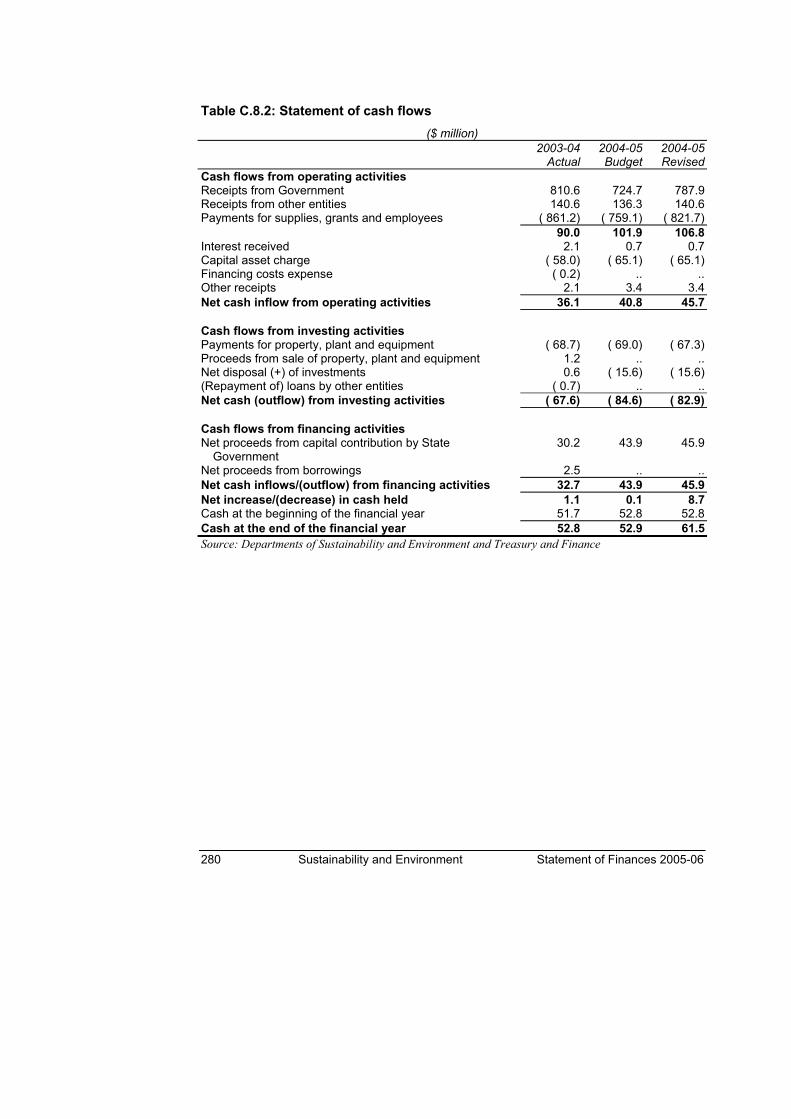
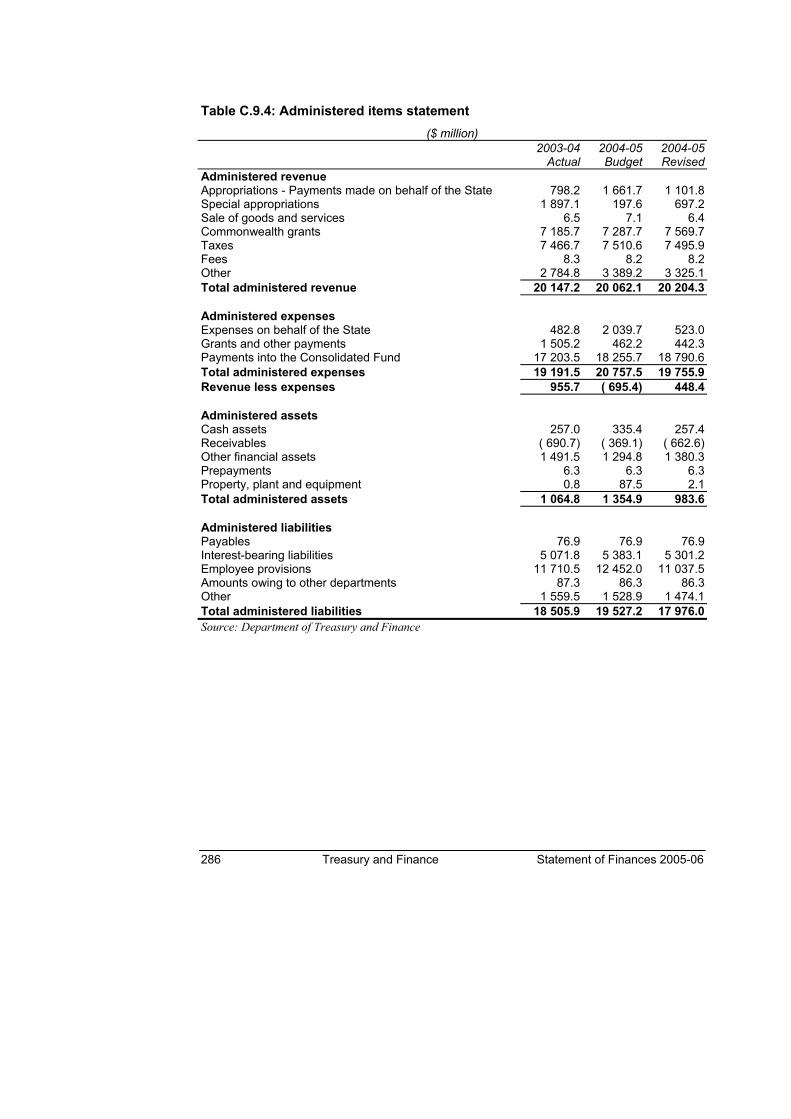
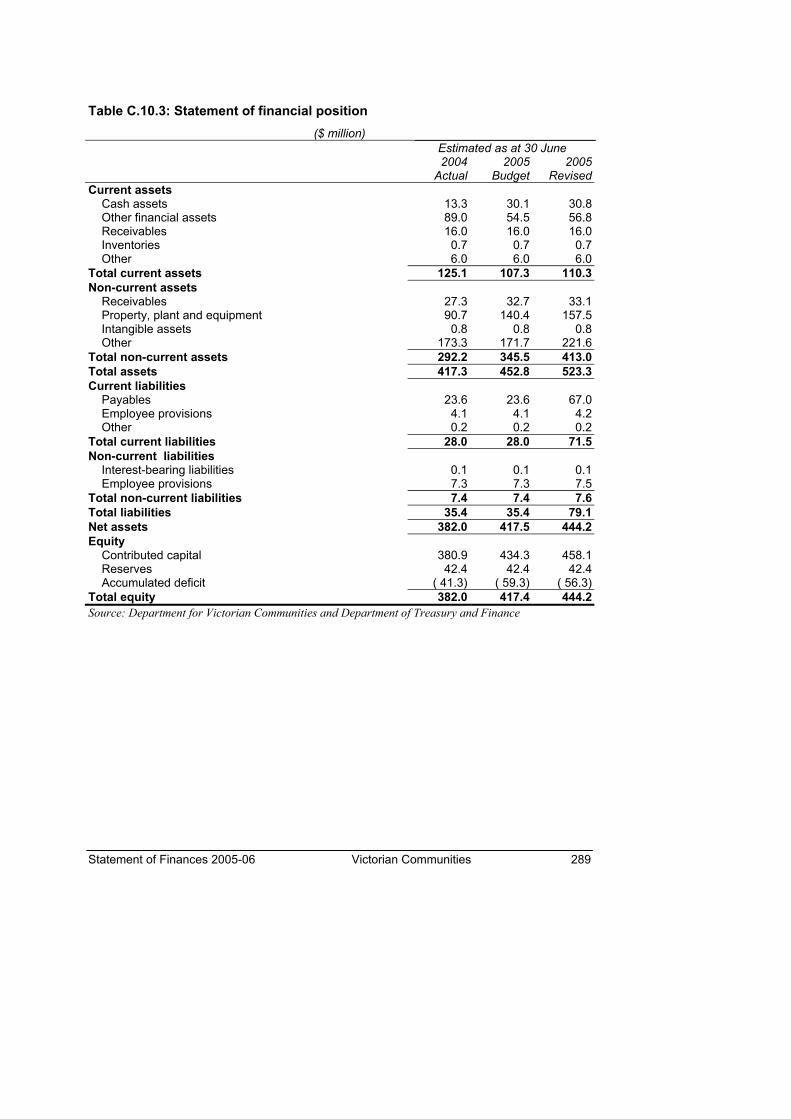
Department of Education and Training .............................................................................251 Department of Human Services ........................................................................................255 Department of Infrastructure .............................................................................................259 Department of Innovation, Industry and Regional Development .......................................263 Department of Justice .......................................................................................................267 Department of Premier and Cabinet .................................................................................271 Department of Primary Industries .....................................................................................275 Department of Sustainability and Environment .................................................................279 Department of Treasury and Finance ...............................................................................283 Department for Victorian Communities .............................................................................287 Parliament of Victoria ........................................................................................................291
Appendix D – Quarterly Financial Report for the Victorian General Government Sector ................................................................................................ 295
Operating statement – A-IFRS Presentation.....................................................................295 Quarterly financial report for the Victorian general government sector .............................297 Financial statements for the general government sector...................................................298
Statement of Finances 2005-06 Introduction 1
INTRODUCTION
Budget Paper No. 4, Statement of Finances, provides the financial details for the aggregated general government sector as outlined in Budget Paper No. 2, Strategy and Outlook. This information includes details on sources of funding, and how the departments are funding their service delivery.
The 2005-06 Budget is the first Victorian Budget prepared under the Australian equivalents to International Financial Reporting Standards (A-IFRS), and one of the first financial reports published in Australia under the new standards.
Information in this Budget Paper relating to the years 2005-06 onwards have been presented based on A-IFRS. The years prior to this have been presented on an existing Australian Accounting Standards (AAS) basis. For 2004-05, the A-IFRS transition year, information is provided on both existing AAS and A-IFRS bases.
In 2002, Australia’s Financial Reporting Council agreed that Australia would adopt International Financial Reporting Standards (IFRS). The rationale for this decision was that the economy would benefit if Australian standards were comparable with international standards as this would reduce the cost of capital and increase investor confidence.
On 15 July 2004, the Australian Accounting Standards Board (AASB) approved the A-IFRS to come into effect for reporting periods commencing on or after 1 January 2005.
Australia’s accounting regime is unusual in that the standards are sector neutral - that is, the same standards are applied to both private and public sector reporting entities.
The 2005-06 Financial Report for the State of Victoria, which must be tabled in Parliament on or before 15 October 2006, will be prepared under the new standards. However, unlike the private sector, governments also report prospectively through the annual budget. Victoria’s 2005-06 Budget has been prepared on an A-IFRS basis so that users will be able to compare the 2005-06 outcome against the budget estimates.
Major impacts of A-IFRS The implementation of A-IFRS in Victoria is primarily about achieving compliance with the new standards which, in most cases, do not result in significant changes to the State’s balance sheet or operating statement.
2 Introduction Statement of Finances 2005-06
However, there is one area in which A-IFRS will have a significant impact. This relates to the changes in the way that the State’s net liability for defined benefit superannuation schemes is measured under A-IFRS. The new standards require the liabilities to be measured using the effective Commonwealth ten-year bond rate, rather than the long-term earning rate of the schemes’ assets.
All Victoria’s defined benefit schemes have been closed, with the exception of the Emergency Services Superannuation Scheme for police, fire-fighters and ambulance employees which is now fully-funded. The Government closed the Parliamentary Scheme in 2004.
The liabilities for these schemes were largely accrued prior to 1988 in a period in which it was the practice of most Australian governments to fund these liabilities as payment fell due rather than as the future liabilities were incurred.
The re-measurement of the State’s superannuation liabilities as at the A-IFRS transition date of 1 July 2004 added approximately $4 billion to the net superannuation liability to be reported in the restated A-IFRS opening balance sheet, bringing the total net liability to $17 billion. However, the net liability will also change each year with fluctuations in the long-term bond rate, and these movements will impact on the operating statement net result.
Based on the net liability as at 1 July 2004, a 0.5 per cent increase in the bond rate would reduce the net liability by approximately $1.5 billion, with a corresponding increase in the liability if the bond rate falls. These potential movements are so large as to obscure the underlying financial performance of the State as measured by the Net result.
It is important to note that while there is an increase in the reported net liability under A-IFRS, this does not mean that additional funds will be needed to meet these liabilities. Funding for the State’s superannuation liabilities will continued to be determined by independent actuarial assessment of the payments required to meet these obligations
More information on superannuation impacts is available in Budget Paper No. 2 Chapter 4, Balance Sheet Management and Outlook.
A-IFRS reporting format and financial measure As part of its implementation of A-IFRS, the Government has reviewed both the format of its reporting and the financial measure against which the $100 million operating surplus is to be achieved.
The objective of the review was to ensure that the A-IFRS reporting format and the Government’s financial measure met the essential test of providing users with better information, consistent with the Government’s commitment to transparency in financial reporting.
Statement of Finances 2005-06 Introduction 3
As a result of the review, the Government has adopted an A-IFRS operating statement format for the general government sector which separates out those items over which the Government exercises control – its expenditure relative to its income – and reports these as transactions. The second category, other economic flows, is made up of items over which the Government has no control, such as the annual movements in the net superannuation liability resulting from changing financial market conditions.
Transactions and other economic flows are defined terms used in reporting of Government Finance Statistics (GFS) under both the International Monetary Fund and Australian Bureau of Statistics reporting frameworks. Although GFS terminology is used, the A-IFRS operating statement is based on accounting principles and complies with the new accounting standards.
The A-IFRS operating statement includes a sub-total Net result from transactions which reports the outcome of the financial decisions made by Government. The Net result from transactions can be regarded as the Government’s primary result under A-IFRS and will be used to measure achievement of its objective to maintain an operating surplus of at least $100 million.
Net result from transactions is a more robust measure of the Government’s management of the State’s finances than Net result which, under A-IFRS, will be impacted by potentially large movements in superannuation liabilities. These movements could increase or decrease the Net result by billions of dollars so that it becomes primarily a measure of the impact of market movements, rather than a measure of the Government’s financial management.
The Government has decided not to adopt the option provided by the AASB under A-IFRS to report superannuation volatility in a separate statement rather than in the operating statement. The rationale for this decision is that reporting through the operating statement makes the information more easily accessible, and allows users to compare 2005-06 against previous financial reports. In addition, the AASB has expressed the view that recognising these annual movements immediately in the operating statement is the most sound and useful approach. Finally, it is expected that the new reporting standard for governments being developed by the AASB will require that movements in superannuation be reported in the government operating statement. This new reporting standard is discussed below.
GFS/GAAP Convergence The international standards on which A-IFRS are based have been developed for private sector entities. Although Australia’s accounting standards are sector neutral, it is necessary to have a government-specific reporting standard because of the different needs of users of government financial reports.
4 Introduction Statement of Finances 2005-06
The Commonwealth and most State and Territory governments use Government Finance Statistics (GFS) as their primary reporting basis, while Victoria and the Australian Capital Territory base their reporting on the accounting standards, here referred to as generally accepted accounting principles (GAAP). The AASB’s new reporting standard for Australian governments will be based on convergence of these two reporting frameworks to create a single, consistent basis of reporting by all governments. This GFS/GAAP format will include a number of GFS concepts, including a cash surplus/deficit measure as part of the cash flow statement.
The AASB will soon release an Exposure Draft of the GFS/GAAP converged reporting format for comment, but it is not clear as yet when the new reporting standard will come into effect.
In developing its A-IFRS reporting format for the 2005-06 Budget, the Victorian Government aims to enable a smooth transition to a new GFS/GAAP converged reporting format, avoiding another step change for users.
A-IFRS transition information in the 2005-06 Budget • Chapter 2, Departmental Financial Statements, contains tables detailing the
restatement of the balance sheet opening balance from an existing AAS basis to A-IFRS as at 1 July 2004 for controlled and administered items. The Notes accompanying these tables explain the impact of transition.
• Appendix B, Revised 2004-05 Budget Outcome, presents the revised Budget outcome on both existing AAS and A-IFRS.
• Appendix D, Quarterly Financial Report for the Victorian General Government Sector, also contains an illustrative presentation of the March quarter results in an A-IFRS format.
Contents of Chapters The following is a summary of the contents in each of the chapters.
Chapter 1 – Estimated Financial Statements and Notes This chapter presents the Estimated Financial Statements and accompanying notes, for the Victorian general government sector, based on A-IFRS, and is consistent with the Financial Policy Objectives and Strategies Statement (see Budget Paper No. 2, Chapter 1, Financial Policy Objectives and Strategy).
The Victorian Auditor-General has reviewed the Estimated Financial Statements for the Victorian general government sector and the Auditor-General’s Review Statement is presented at the beginning of Chapter 1.
Statement of Finances 2005-06 Introduction 5
Chapter 2 – Departmental Financial Statements Chapter 2 contains departmental financial estimates that detail information on departmental resources, as well as the authority for resources for each department.
The departmental estimated financial statements are presented on a consolidated basis for all general government reporting entities within each departmental portfolio. They form the basis of the consolidated Estimated Financial Statements for the general government sector provided in Chapter 1.
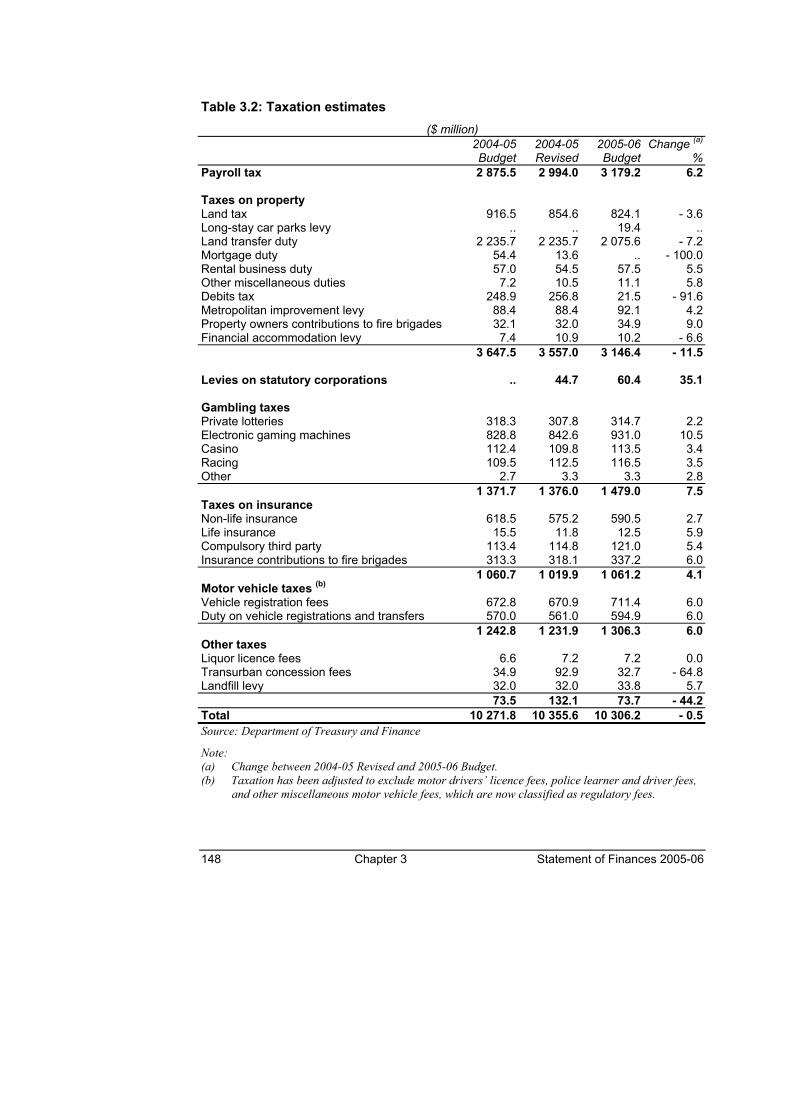
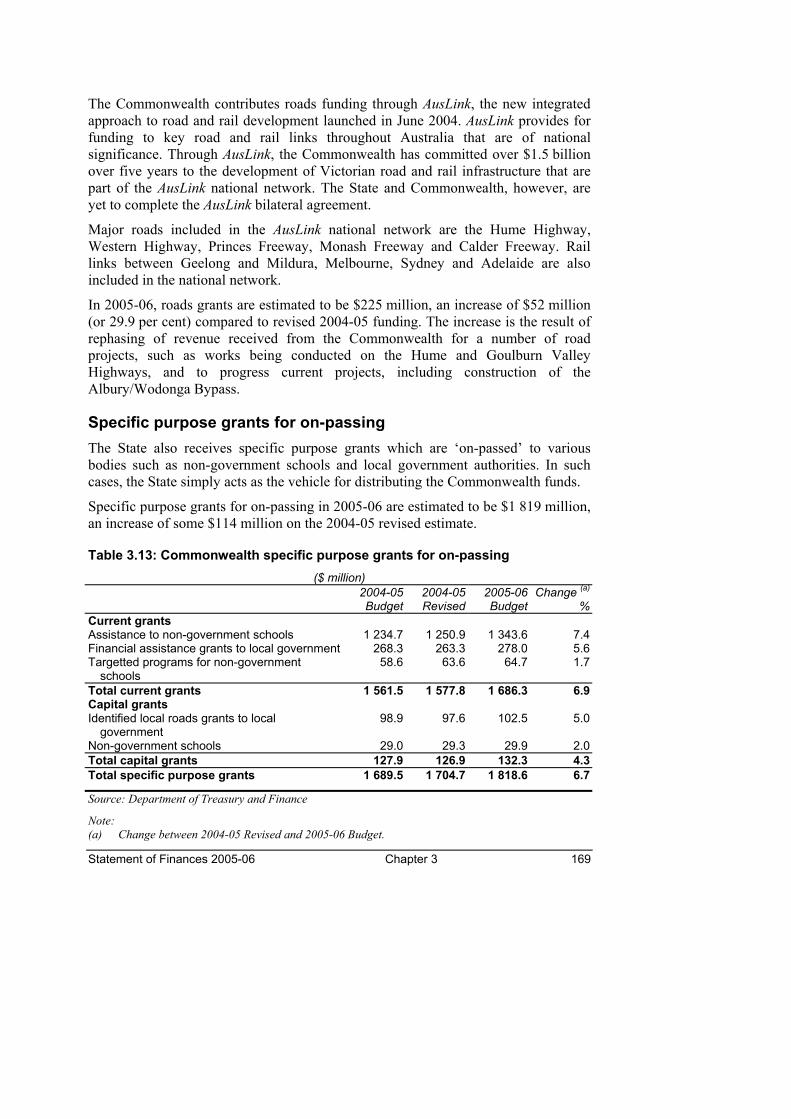
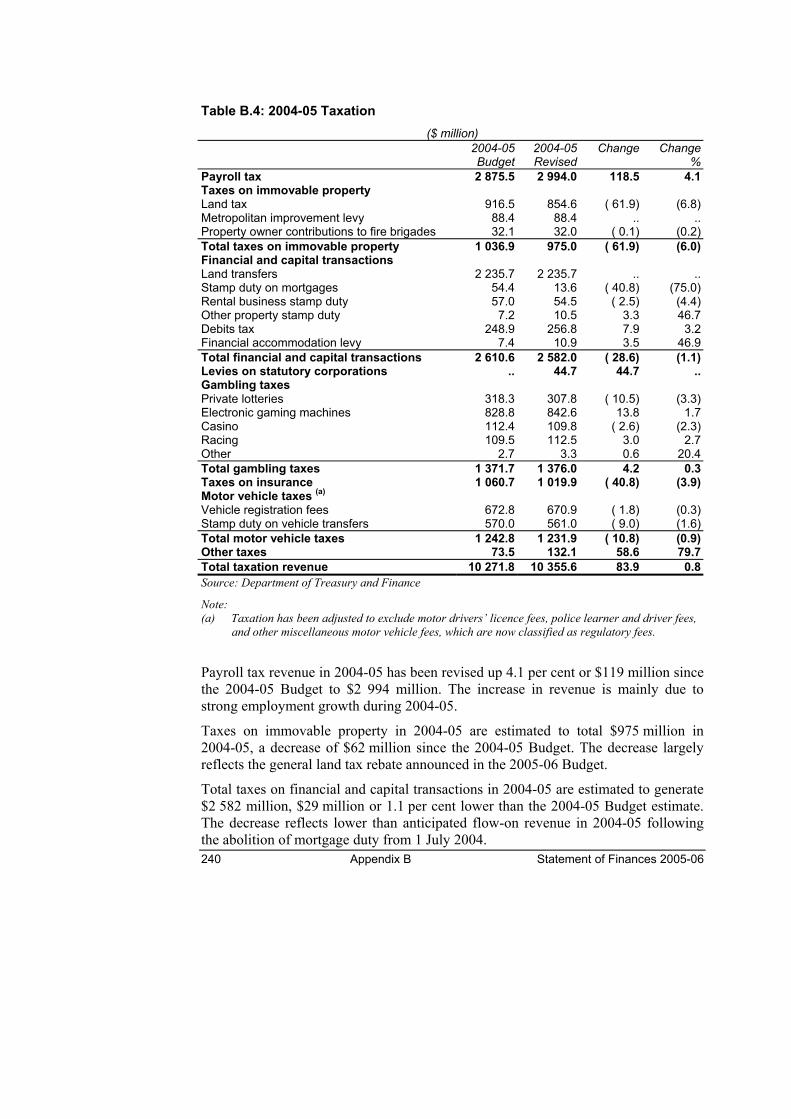
Chapter 3 – State Revenue Chapter 3 outlines the major sources of state revenue, both state-sourced revenue, including taxes, fines and regulatory fees and investment revenue, and that provided through Commonwealth grants, for both general and specific purposes. The estimates of the Commonwealth Government grants represent the latest information available to the Victorian Government. However, the Commonwealth budget is not due to be brought down until 10 May 2005 and, as a result, there may be variations between the information published in this chapter and the amounts actually granted by the Commonwealth.
Chapter 4 – Tax Expenditures and Concessions Chapter 4 fulfils the higher-level disclosure requirements under the Financial Management (Financial Responsibility) Act 2000 by providing an overview and forward estimates of tax expenditures. This chapter also outlines the estimated cost of Victorian Government concessions.
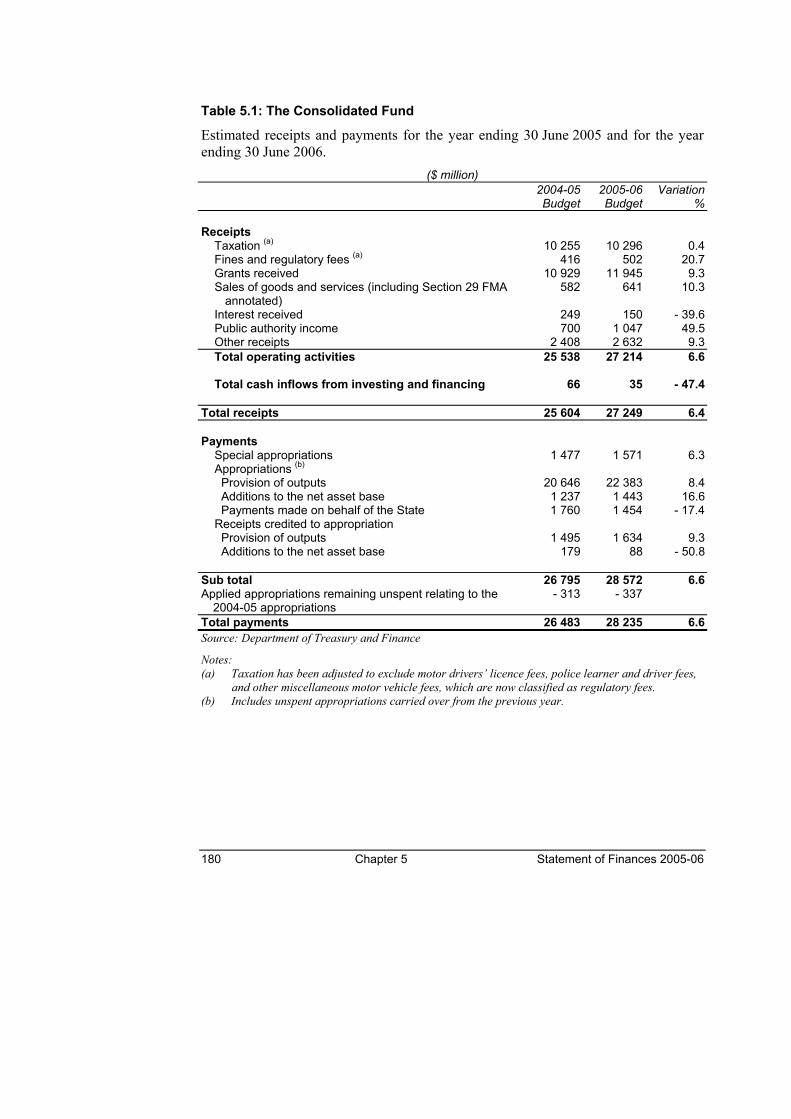
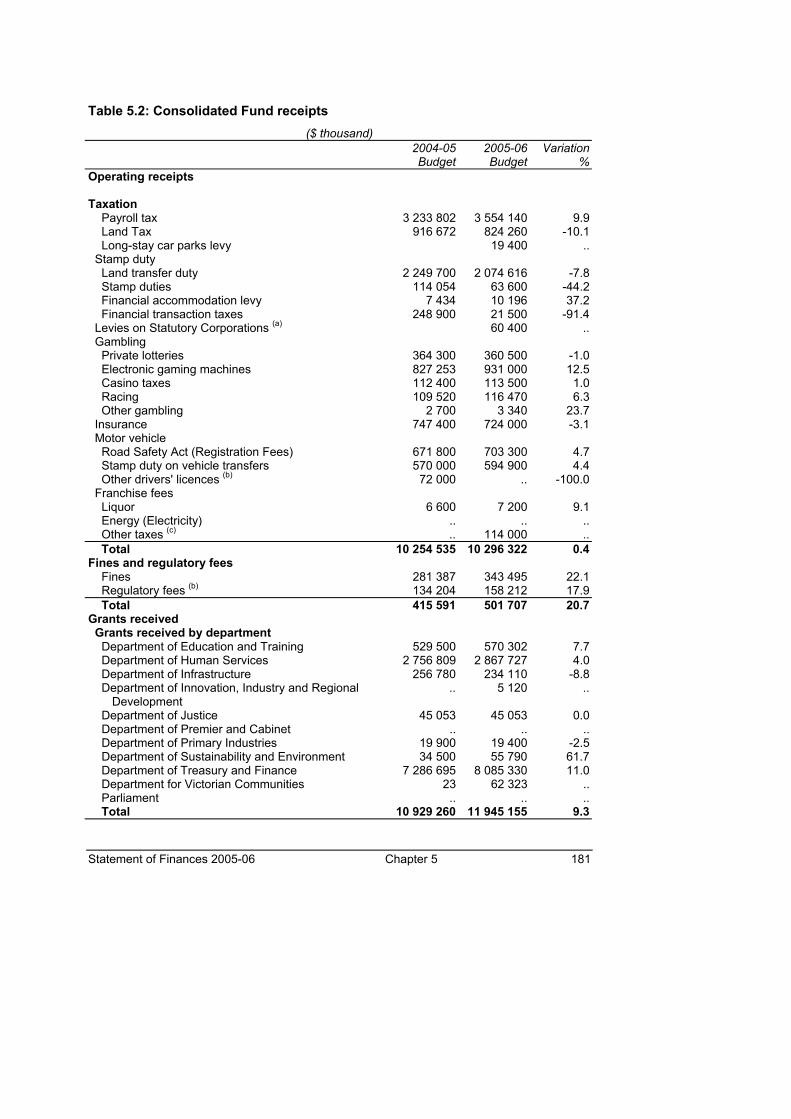
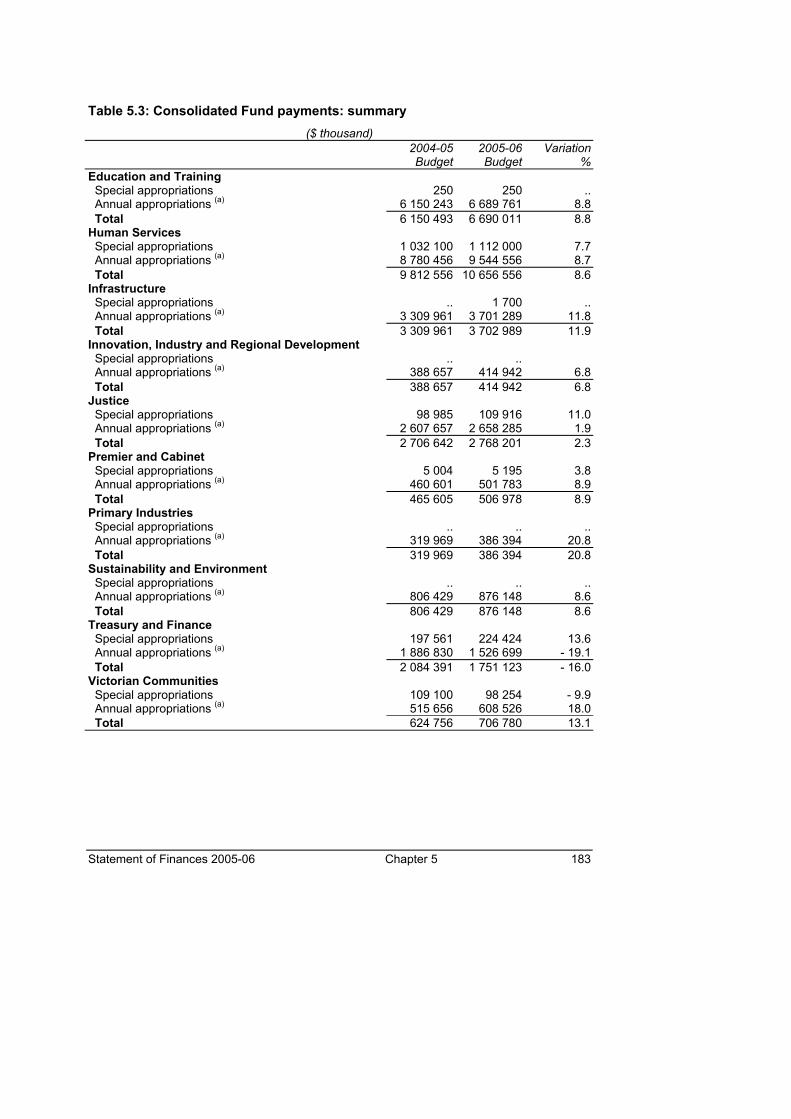
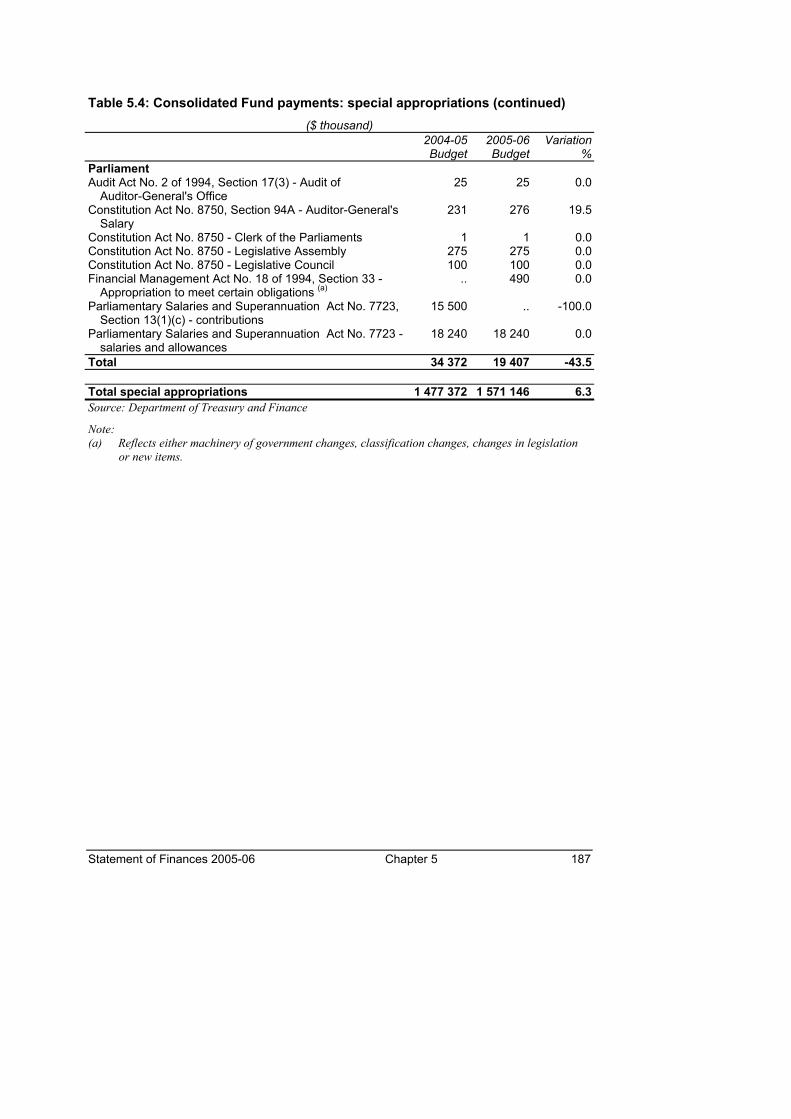
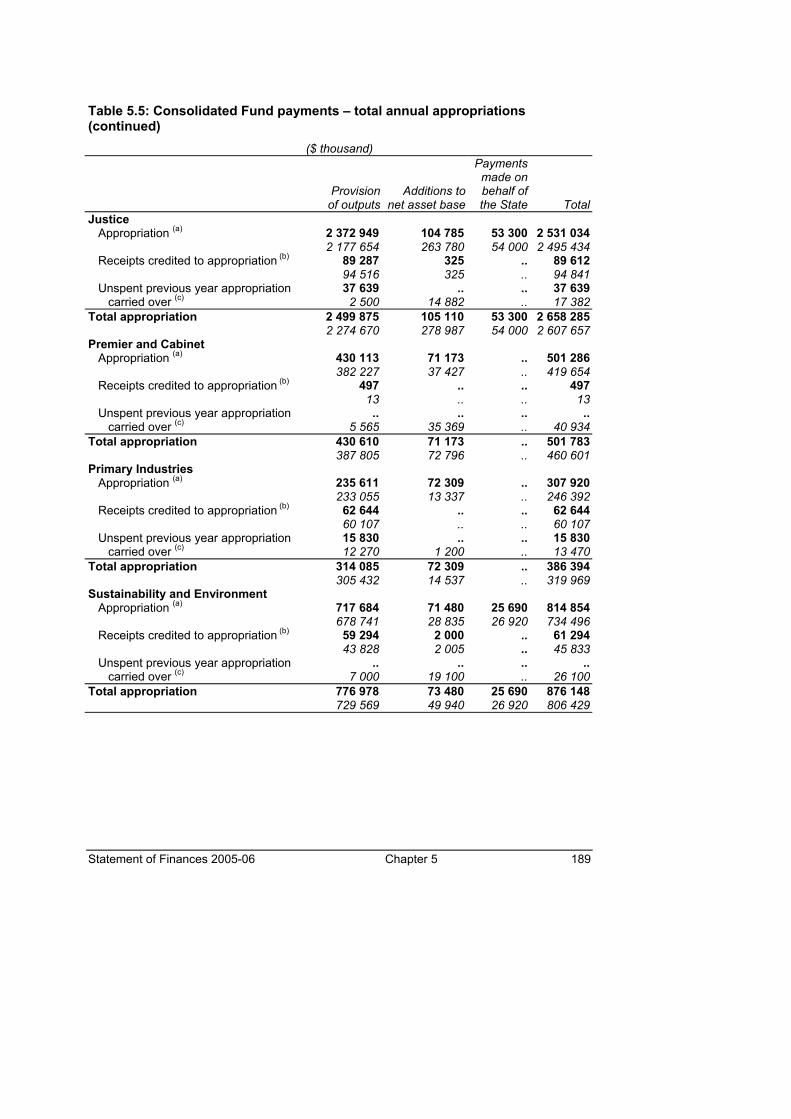
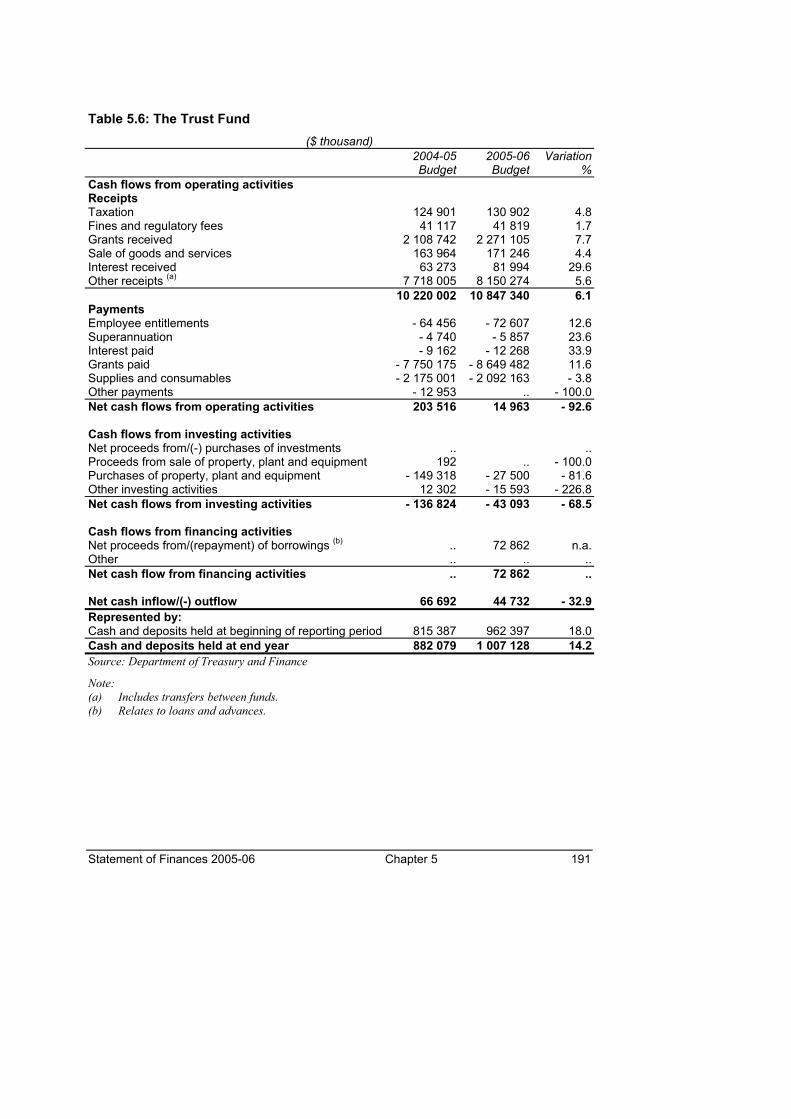
Chapter 5 – Public Account Chapter 5 discloses information on the Public Account, which includes the estimated transactions and the year-end balances of the Consolidated Fund and the Trust Fund. Details of estimated consolidated fund receipts and payments against each special appropriation and annual departmental appropriations are also provided. Information relating to Trust Fund activities includes estimated cash flows and projected year-end balances.
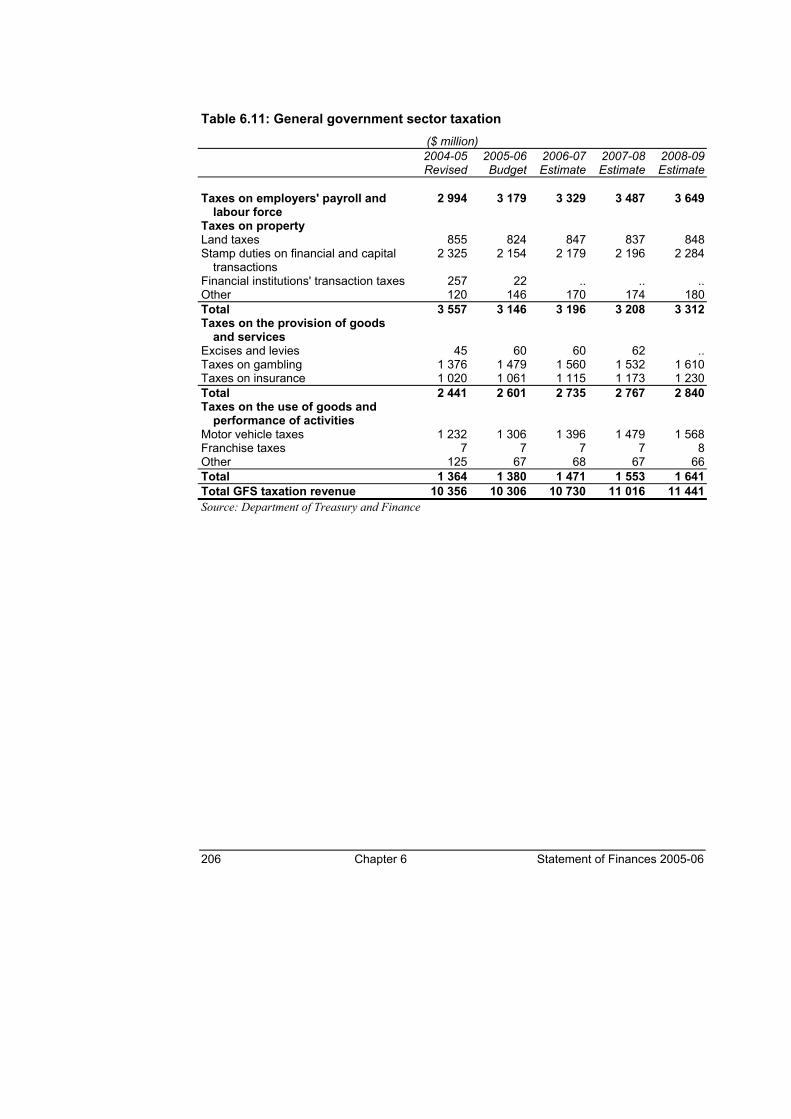
Chapter 6 – Uniform Presentation of Government Finance Statistics The Uniform Presentation Framework (UPF), based on Government Finance Statistics (GFS), is outlined in Chapter 6. GFS shows consolidated transactions of the institutional sectors of government from an economic viewpoint. The GFS framework also includes a statement of general government expenses by function and a taxation table classified by type. A reconciliation statement between GFS and the general government financial statements presented in Chapter 1 is also provided.
6 Introduction Statement of Finances 2005-06
As required by the UPF, Victoria’s 2005-06 nominated Loan Council Allocation table is also provided. This includes details of Victoria’s infrastructure projects with private sector investment where contracts are expected to be signed in 2005-06.
Appendix A – Historical and Forward Estimates Tables The historical and forward estimates tables in Appendix A show the trend in general government sector aggregate cash flows over the period 1986-87 to 2008-09. In addition, the general government operating result for the period 1996-97 to 2008-09 is also provided.
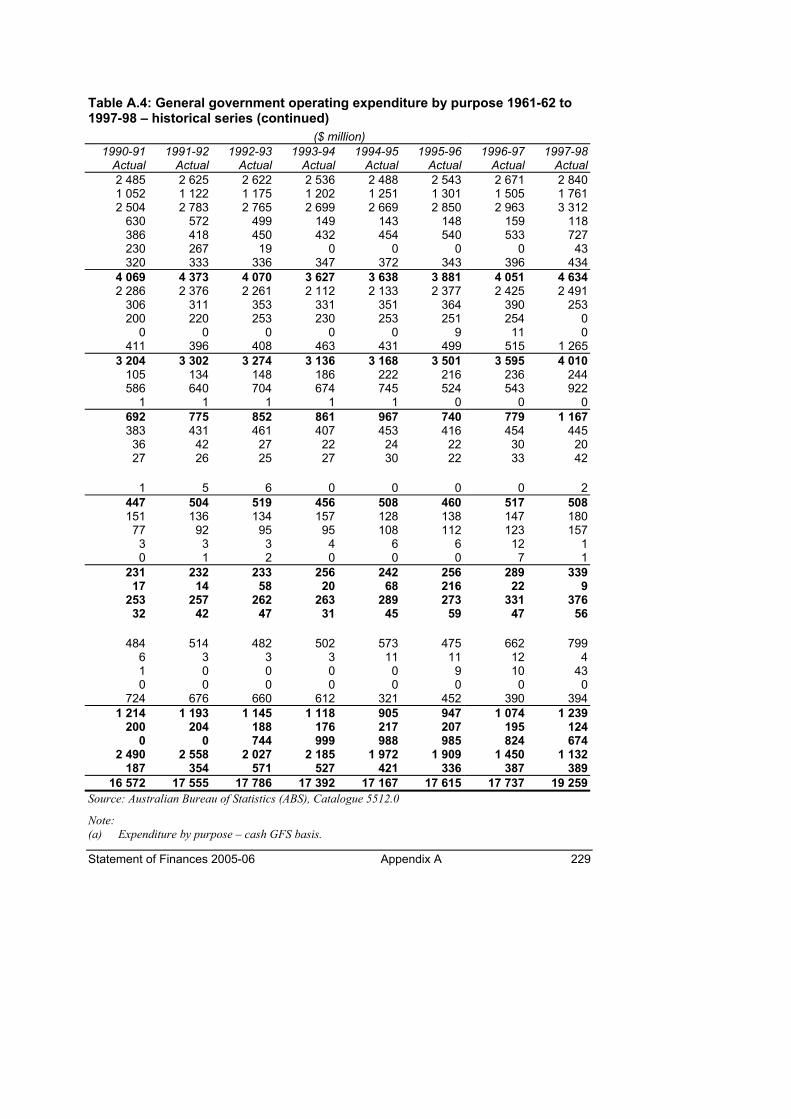
The remaining tables show GFS information for the general government sector classified by government purpose. Operating expenditure classified by function is presented for the period 1961-62 to 1997-98. The GFS accruals expenditure series classified by purpose is presented for the period 1998-98 to 2008-09.
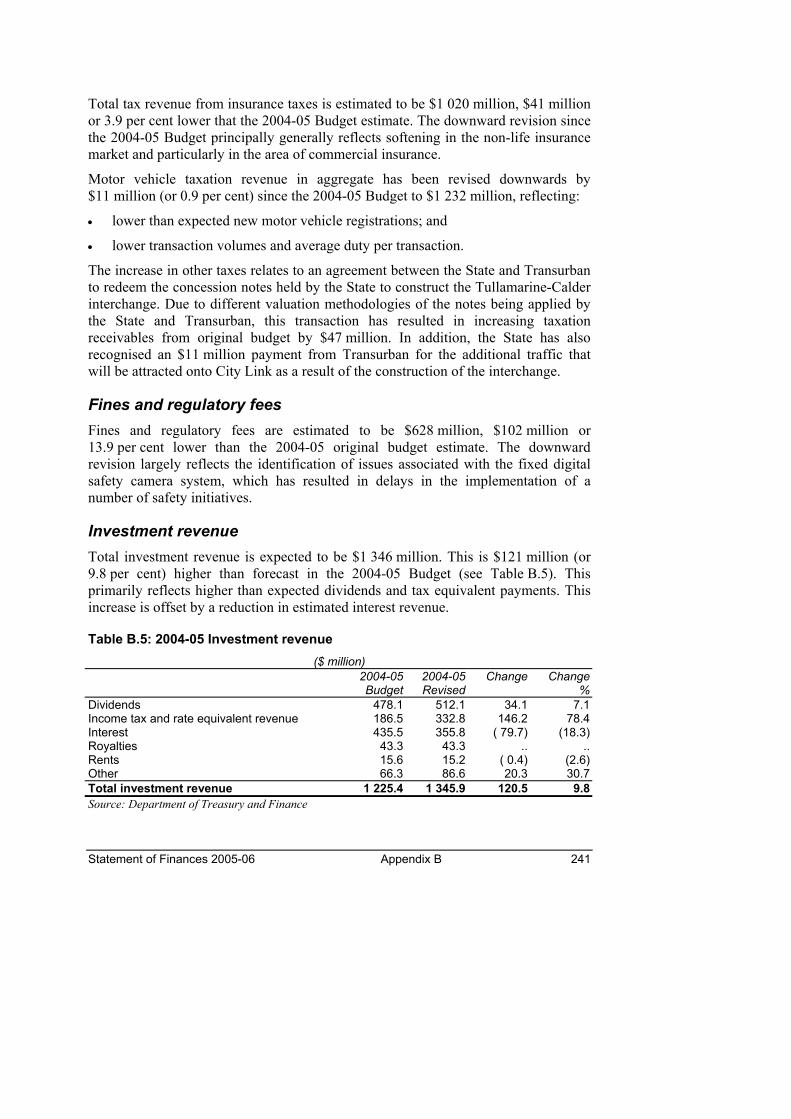
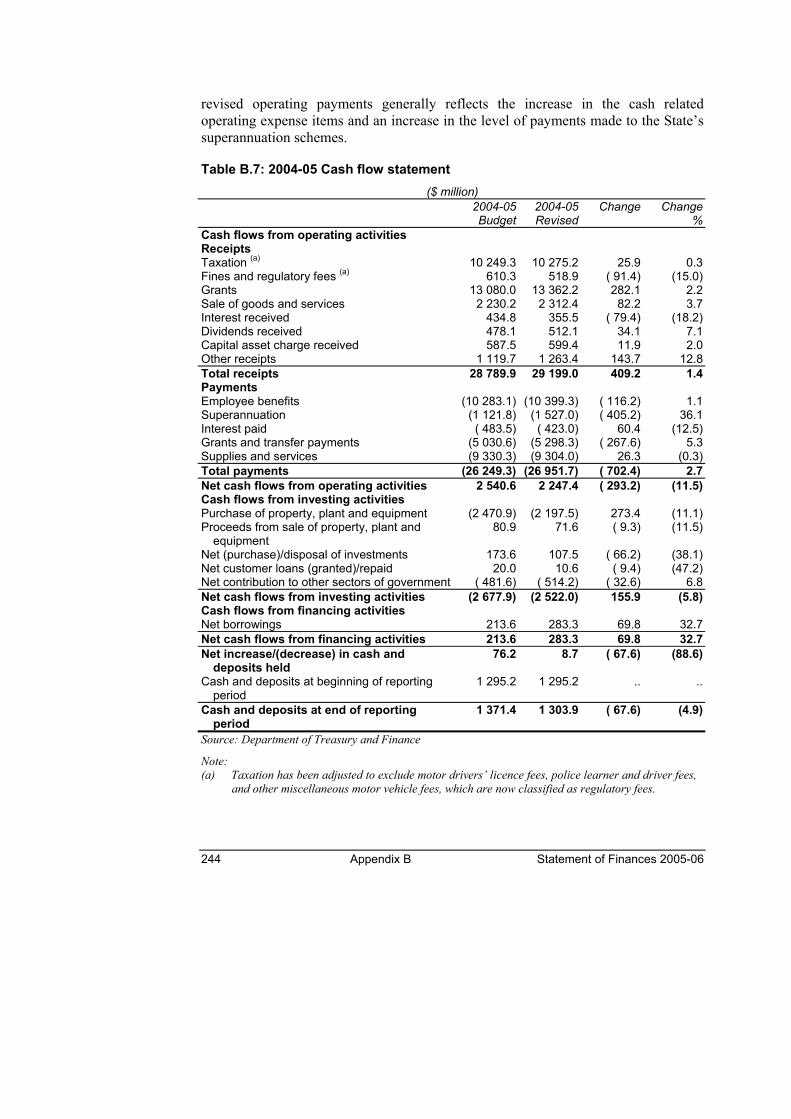
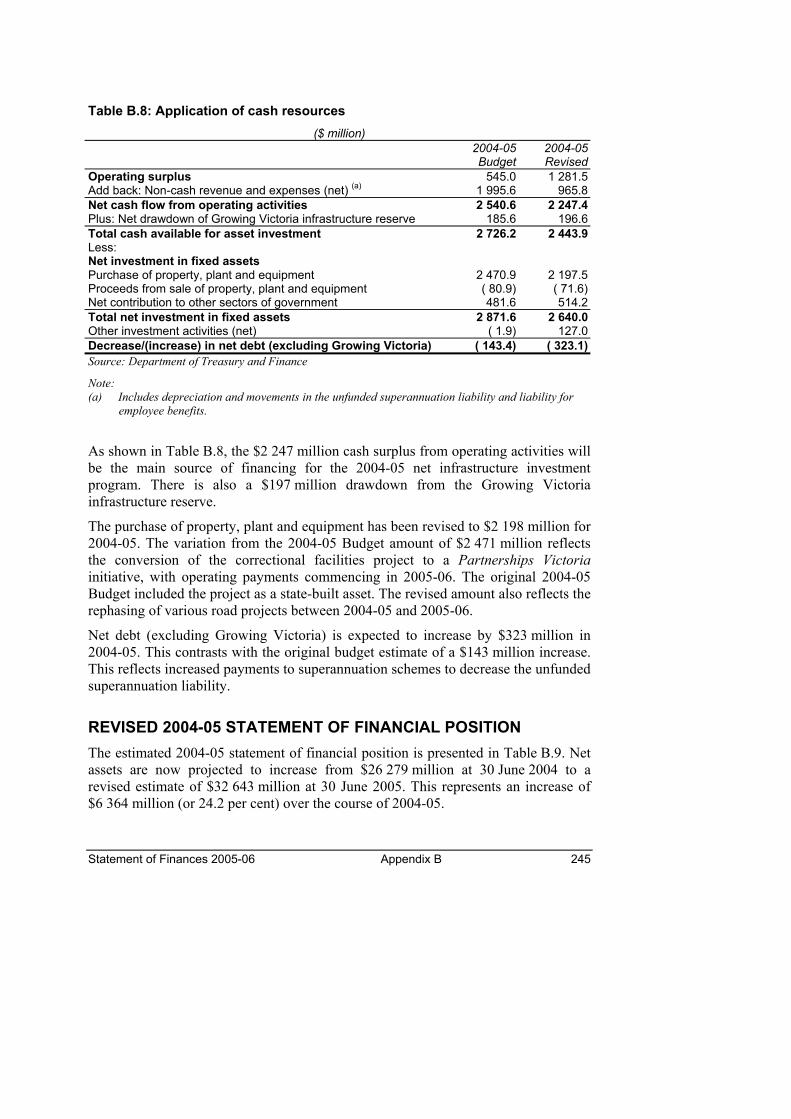
Appendix B – Revised 2004-05 Budget Outcome The revised 2004-05 Budget outcome is presented in Appendix B. The revised 2004-05 estimates take into account government policy decisions and economic developments affecting both revenue and expenses since the presentation of the 2004-05 Budget to the Parliament in May 2004.
Appendix C – Departmental Financial Statements – Revised Estimates 2004-05 The revised 2004-05 departmental financial estimates in Appendix C provide a comparison between 2003-04 actual results and the 2004-05 revised estimate based on existing AAS. These statements are not directly comparable with the departmental statements presented in Chapter 2 of this publication, which are based on A-IFRS.
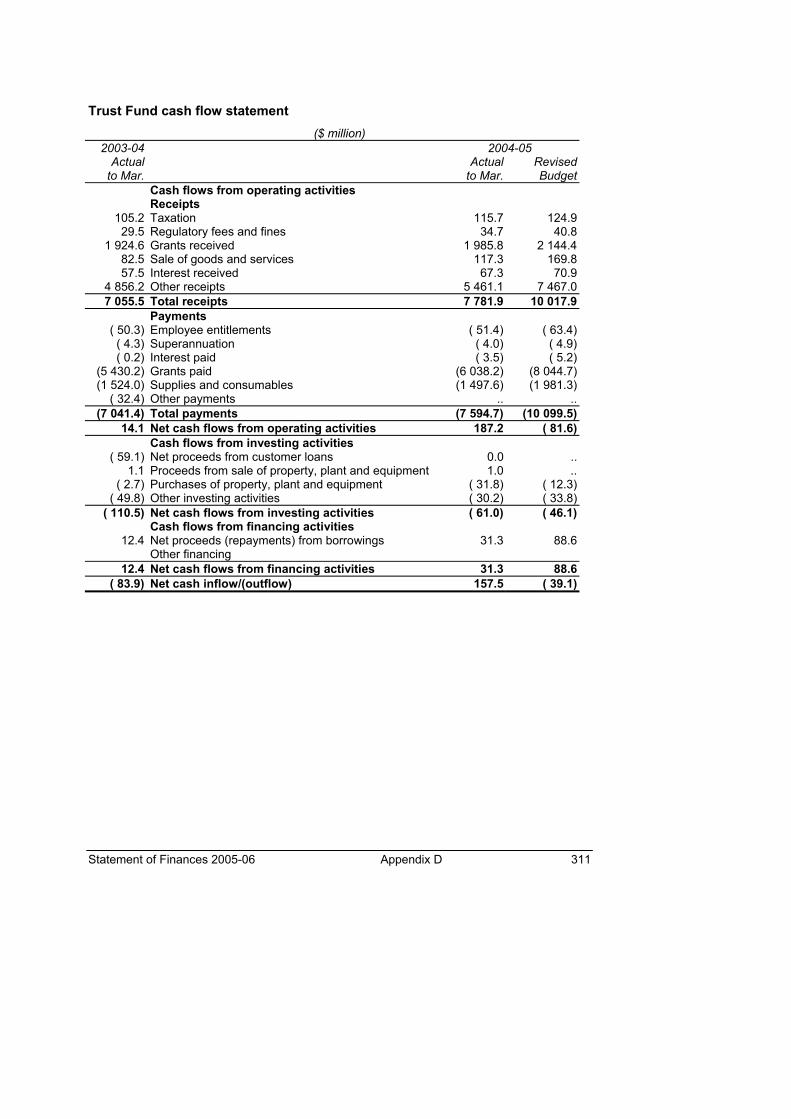
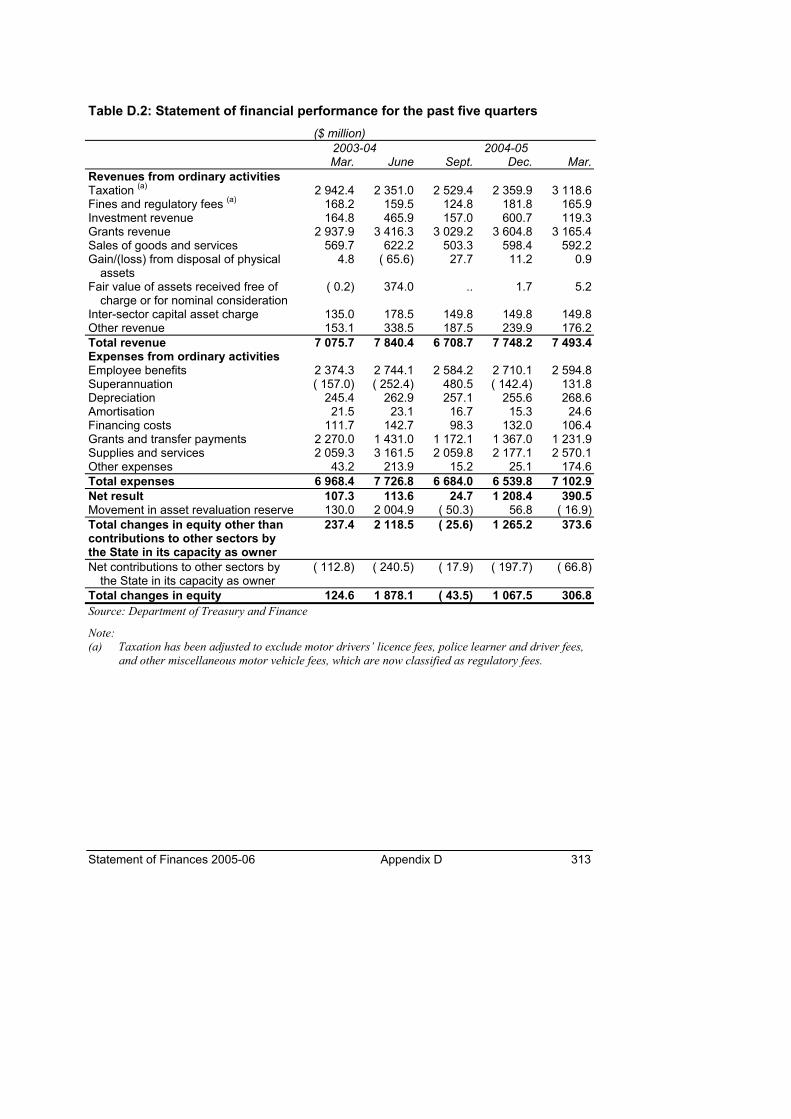
Appendix D – Quarterly Financial Report for the Victorian General Government Sector The Quarterly Financial Report for the Victorian general government sector, incorporating the actual outcome for the nine-month period ended 31 March 2005 and quarter-by-quarter results, are included in Appendix D. The March year-to-date outcome is compared with the full year revised 2004-05 Budget included in the Appendix B of this document.
Statement of Finances 2005-06 Chapter 1 7
CHAPTER 1 – ESTIMATED FINANCIAL STATEMENTS AND NOTES
The following Estimated Financial Statements and accompanying explanatory notes set out the forecast financial results for the Victorian general government sector for the period 2005-06 to 2008-09.
The prospective nature of these statements reflect a number of professional judgements about the most likely operating and financial conditions for the Victorian general government sector. Variations in these assumed conditions, such as international developments and other risks to the national economy, from which Victoria would not be immune, may cause the general government actual result to differ from the projections.
The Estimated Financial Statements have been prepared in accordance with the provisions of the Financial Management Act 1994. This Act requires the Estimated Financial Statements to be consistent with the Financial Policy Objectives and Strategies Statement (see Budget Paper No. 2, Chapter 1, Financial Policy Objectives and Strategy) and in a manner and form determined by the Minister, having regard to appropriate financial reporting frameworks.
The statements have been prepared in accordance with applicable pronouncements and abstracts of the Australian Accounting Standards Board (AASB), including the Australian equivalent to International Financial Reporting Standards (A-IFRS). However, as there is no specific Australian accounting standard or other authoritative pronouncement that prescribes the preparation and presentation of prospective financial statements, the preparation of the Estimated Financial Statements is based on New Zealand Financial Reporting Standard Prospective Financial Information (FRS 29), and the presentation format is consistent with the new A-IFRS and is intended to transitionally address the needs of users pending finalisation and introduction of a new reporting standard for government.
The accompanying notes to the statements provide details of the material economic and other assumptions used, and the specific forecast assumptions underlying material items in the financial statements. A number of these assumptions are subject to inherent uncertainties, which are outside the control of the Government.
The Victorian Auditor-General has reviewed these Estimated Financial Statements and his review opinion follows.
8 Chapter 1 Statement of Finances 2005-06
AUDITOR-GENERAL’S REPORT
To the Members of the Parliament of Victoria
Scope of Review I have reviewed the accompanying estimated financial statements of the Victorian General Government Sector, as defined in note 19 to the statements, for the financial year ended 30 June 2006 and the three forward financial years ended 30 June 2007, 2008 and 2009. The statements comprise an estimated operating statement, an estimated balance sheet, an estimated statement of cash flows and accompanying notes. The remaining parts of the Budget Papers have not been subject to my review. The Treasurer of Victoria is responsible for the preparation and presentation of the estimated financial statements and the information they contain. The estimated financial statements have been prepared for inclusion in the Budget Papers which are presented to the Parliament. Any assumption of responsibility for any reliance on this report or on the estimated financial statements of the Victorian General Government Sector to which this report relates is disclaimed to any person other than the Members of the Parliament of Victoria. My review of the estimated financial statements has been conducted under section 16B of the Audit Act 1994 which requires me to state whether anything has come to my attention that would cause me to not believe that the statements have been prepared on a basis consistent with the accounting policies on which they are stated to be based, are consistent with the target established for the key financial measure specified in the accompanying notes to the statements and have been properly prepared on the basis of the economic assumptions stated in the accompanying notes to the statements, and the methodologies used to determine those assumptions were reasonable. The review has been conducted in accordance with Australian Auditing Standards applicable to review engagements, and has been limited primarily to inquiries of relevant personnel and assessments of the reasonableness of the key methodologies and processes followed to determine the assumptions and data upon which the estimated financial statements are based, and appropriate analytical procedures. These procedures do not provide all the evidence that would be required in an audit, thus the level of assurance provided is less than that which would be given in an audit. Accordingly, an audit has not been performed and an audit opinion is not expressed. Prospective financial information relates to events and actions that have not yet occurred and may not occur. While evidence may be available to support the assumptions and underlying data upon which prospective financial information is based, such evidence is generally future oriented and therefore less certain in nature. As a result, I am not in a position to obtain the level of assurance necessary to express a positive opinion on those assumptions and the accompanying forecast information included in the estimated financial statements. Accordingly, an opinion is not expressed on whether the forecasts will be achieved.
Review Statement Based on my review, which is not an audit, nothing has come to my attention that causes me to not believe that: • the estimated financial statements have been prepared on a basis consistent with the accounting policies on which they
are stated to be based; • the estimated financial statements are consistent with the target established for the key financial measure specified in the
accompanying notes to the statements; • the estimated financial statements have been properly prepared on the basis of the economic assumptions stated in the
accompanying notes to the statements; and • the methodologies used to determine those assumptions were reasonable. Actual results achieved by the Victorian General Government Sector are likely to be different from those forecast in the estimated financial statements since anticipated results frequently do not occur as expected and the variation may be material. Accordingly, I express no opinion as to whether the forecasts will be achieved.
Statement of Finances 2005-06 Chapter 1 9
DEPARTMENT OF TREASURY AND FINANCE STATEMENT IN RELATION TO THE ESTIMATED FINANCIAL STATEMENTS The Estimated Financial Statements for the Victorian general government sector have been prepared on the basis of the economic and fiscal information available to the Department of Treasury and Finance. Given the prospective nature of the Estimated Financial Statements, it has been necessary to apply the best professional judgement in preparing the Estimated Financial Statements.
In my opinion, the Estimated Financial Statements have been properly prepared for the purposes of sections 23H–23K of the Financial Management Act 1994 and take into account government decisions and other circumstances that have a material effect.
Ian Little Secretary
Department of Treasury and Finance
27 April 2005
10 Chapter 1 Statement of Finances 2005-06
ESTIMATED FINANCIAL STATEMENTS FOR THE VICTORIAN GENERAL GOVERNMENT SECTOR
Table 1.1: Estimated operating statement for the financial year ending 30 June ($ million)
Notes 2005-06 2006-07 2007-08 2008-09 Budget Estimate Estimate Estimate Income from transactions .. .. .. .. ..Taxation 2 10 306.2 10 729.8 11 016.2 11 441.3Fines and regulatory fees .. 726.9 772.3 757.1 763.7Investment income 3 1 397.9 1 260.2 1 235.2 1 138.3Grants income 4 14 262.1 14 733.3 15 263.7 15 992.0Sales of goods and services .. 2 397.1 2 449.8 2 490.8 2 521.6Fair value of assets received free of charge
or for nominal consideration .. 22.0 .. .. 160.0
Inter-sector capital asset charge .. 778.8 777.7 768.7 755.6Other income .. 732.6 731.4 725.2 729.9Total income from transactions .. 30 623.6 31 454.5 32 257.0 33 502.4Expenses from transactions .. .. .. .. ..Employee benefits .. 11 201.5 11 552.7 11 887.8 12 191.8Superannuation 5 1 759.3 1 784.9 1 785.0 1 802.0Depreciation and amortisation 6 1 235.1 1 291.6 1 383.3 1 444.5Financing costs 7 492.1 500.7 503.8 524.1Grants and transfer payments 8 5 579.3 5 539.9 5 545.3 5 574.3Supplies and services .. 9 991.2 10 465.0 10 838.4 11 414.4Other expenses .. 0.4 0.4 0.4 0.4Total expenses from transactions 9 30 258.9 31 135.2 31 944.0 32 951.5Net result from transactions .. 364.7 319.3 313.0 550.8
Income/(expenses) from other economic flows
.. .. .. .. ..
Net gain/(loss) from disposal of physical assets
.. 25.7 21.4 9.1 9.7
Other income from other economic flows 3 8.5 8.5 8.5 8.5Actuarial gains/(losses) on superannuation
defined benefit plans 5 .. .. .. ..
Other expenses from other economic flows 6,9 ( 74.8) ( 70.9) ( 60.3) ( 56.5)Net result from other economic flows .. ( 40.6) ( 41.0) ( 42.6) ( 38.3)Net result 324.1 278.2 270.3 512.6
Gain/(loss) on revaluation of properties .. 2 276.0 2 460.1 2 647.2 2 870.5Total changes in equity other than
contributions to other sectors by the State in its capacity as owner
.. 2 600.1 2 738.3 2 917.6 3 383.1
The accompanying notes form part of these Estimated Financial Statements.
Statement of Finances 2005-06 Chapter 1 11
Table 1.2: Estimated balance sheet as at 30 June ($ million)
.. Notes 2006 2007 2008 2009
.. .. Budget Estimate Estimate Estimate Current assets .. .. .. .. .. Cash and cash equivalents .. 1 305.0 1 305.5 1 308.1 1 309.2 Other financial assets .. 1 940.8 1 062.6 798.3 842.1 Receivables .. 1 609.5 1 729.2 1 862.8 1 954.6 Prepayments .. 88.0 88.4 88.6 88.8 Inventories .. 97.1 97.8 98.3 98.8 Assets held for sale .. 61.9 62.9 63.9 64.9 Total current assets .. 5 102.1 4 346.3 4 219.9 4 358.4 Non-current assets .. .. .. .. .. Other financial assets .. 652.5 626.1 544.8 483.8 Receivables .. 294.2 262.8 288.2 312.6 Property, plant and equipment and
infrastructure systems other than roads 10,12 32 410.8 34 785.1 37 237.1 40 154.1
Net (purchase)/disposal of investments .. 370.2 904.7 345.7 17.3Net customer loans (granted)/repaid .. 0.6 3.0 3.0 3.1Net contribution to other sectors of
government .. ( 569.6) ( 534.5) ( 217.8) ( 56.6)
Net cash flows from investing activities .. (2 594.2) (1 903.7) (1 911.5) (2 232.4)Cash flows from financing activities .. .. .. .. ..Net borrowings .. 8.2 5.1 293.2 488.6Net cash flows from financing activities .. 8.2 5.1 293.2 488.6Net increase in cash and deposits held .. ( 7.3) 0.5 2.6 1.1Cash and deposits at beginning of
The accompanying notes form part of these Estimated Financial Statements. Memorandum item: The IMF GFS cash surplus/(deficit) shown below can be calculated from the statement of cash flows above and is equal to the net cash flows from operating activities less the net purchase of property, plant and equipment (i.e. purchases less sale proceeds). Cash surplus/(deficit) 183.2 ( 377.8) ( 421.5) ( 451.2)
Statement of Finances 2005-06 Chapter 1 13
NOTES TO THE ESTIMATED FINANCIAL STATEMENTS Due to the possibility that circumstances or events outlined in the Estimated Financial Statements may not occur as expected, actual results may differ from those forecast and the difference may be material. Accordingly, no guarantee is given that the financial results will be achieved. However, the best professional judgement has been applied in preparing the Estimated Financial Statements.
Note 1: Statement of significant accounting policies and forecast assumptions ....... 17 Note 2: Taxation......................................................................................................... 38 Note 3: Investment income ........................................................................................ 39 Note 4: Grants income ............................................................................................... 39 Note 5: Superannuation ............................................................................................. 40 Note 6: Depreciation and amortisation....................................................................... 42 Note 7: Financing costs.............................................................................................. 42 Note 8: Grants and transfer payments....................................................................... 43 Note 9: Total expenses by department ...................................................................... 43 Note 10: Property, plant and equipment and infrastructure systems......................... 44 Note 11: Road networks............................................................................................. 44 Note 12: Reconciliation of movements in fixed assets............................................... 45 Note 13: Other assets ................................................................................................ 45 Note 14: Employee benefits ....................................................................................... 45 Note 15: Reconciliation of net cash flows from operating activities ........................... 46 Note 16: Reconciliation of cash.................................................................................. 46 Note 17: Purchase of property, plant and equipment by department ........................ 47 Note 18: Reconciliation of net assets as at 1 July 2004 ............................................ 48 Note 19: General government sector entities ............................................................ 49
14 Chapter 1 Statement of Finances 2005-06
Assumptions The Estimated Financial Statements have been prepared using the material economic and other assumptions listed below.
Material economic and other assumptions(a) (per cent change)
2005-06 2006-07 2007-08 2008-09 Real gross state product 3.00 3.50 3.50 3.25Employment 1.00 1.25 1.50 1.25Consumer price index (b) 2.75 2.50 2.50 2.50Wage price index (c) 3.75 3.50 3.50 3.50Population (d) 1.00 1.00 1.00 1.00Source: Australian Bureau of Statistics, Department of Treasury and Finance
Notes: (a) Year-average per cent change on previous year unless otherwise indicated. All projections apart
from population are rounded to the nearest 0.25 percentage points. Projections of population are rounded to the nearest 0.1 percentage points.
(b) Departmental output revenue for the budget year, that is subject to indexation under the departmental funding model, is indexed by the consumer price index forecast at the time of the Budget Update (2.5 per cent). This may differ from the updated forecast consumer price index as disclosed.
(c) Total hourly rate excluding bonuses. (d) June quarter, per cent change on previous June quarter.
Economic risks The main risks to the Victorian economic projections stem from prospective financial market developments, including movements in interest rates, the Australian dollar and the price of crude oil. In addition, reports of growing capacity constraints in the economy, including skilled labour shortages, have the potential to contribute to higher inflation and interest rates.
The Reserve Bank raised interest rates by 25 basis points in March 2005, to 5.50 per cent, the first increase in the official cash rate since December 2003. Following the increase in rates, and comments from the Reserve Bank about growing inflation pressures, financial markets are anticipating an additional 25 basis point increase in the cash rate in the near term. Given relatively high debt levels in the household sector, a larger increase in rates could place some pressure on the growth forecast over the coming year.
There have been growing reports of capacity constraints in certain sectors of the Australian economy; in particular, shortages of skilled labour have been reported in several industries, notably construction. With many businesses operating near capacity, there is a risk that shortages of skills and materials will contribute to higher costs, which could push inflation above the Reserve Bank’s medium-term target range of 2 to 3 per cent. Such a scenario could see interest rates rise above the profile expected by financial markets, which would put pressure on the medium-term growth
Statement of Finances 2005-06 Chapter 1 15
forecast and prospects for the real estate market. The Reserve Bank has noted faster growth in producer prices, including in the construction sector, in the second half of 2004.
The Australian dollar continues to trade at high levels, extending the broad upward trend seen over the past few years. The strength in the currency appears to reflect numerous factors, including Australia’s rising terms of trade, relatively high interest rates (by global standards) and concern over the size of the US current account deficit, which has caused the US dollar to weaken. Further increases in the terms of trade could place upward pressure on the exchange rate. Although a positive for the inflation outlook, continued strength in the Australian dollar could threaten returns to Victorian farmers, manufacturers, local tourism and firms exposed to import competition.
On the international front, the US economy recorded strong growth last year, continuing the recovery from the 2001 slowdown. The economy appears to have reasonable momentum, although analysts expect more moderate growth outcomes over the next two years due in part to higher interest rates. The main risks to the US outlook stem from the record high current account deficit, and some signs of emerging inflation pressures. Both scenarios could result in higher interest rates than are currently anticipated by financial markets, with implications for the global economic outlook. Weaker growth in Victoria’s major trading partners could negatively affect the projections for exports and economic growth.
The price of crude oil has remained at persistently high levels, and has revisited the peaks seen in October 2004. Financial markets are expecting the oil price to remain broadly steady over the coming year. If the current high oil price is sustained or rises further, this would likely have some effect on both growth and inflation projections for 2005-06.
On the positive side, continued strength in dwelling construction represents an upside risk to the economic outlook. The housing sector has been surprisingly resilient, partly reflecting increases in Victoria’s population growth rate (driven by higher international migration).
Key financial measure The Government has set out its key financial measure in the Financial Policy Objectives and Strategies Statement. The key financial measure of a substantial budget operating surplus is expected to be achieved throughout the forecast period.
Fiscal target Key financial measure Target Maintain a substantial budget sector operating surplus At least $100 million
16 Chapter 1 Statement of Finances 2005-06
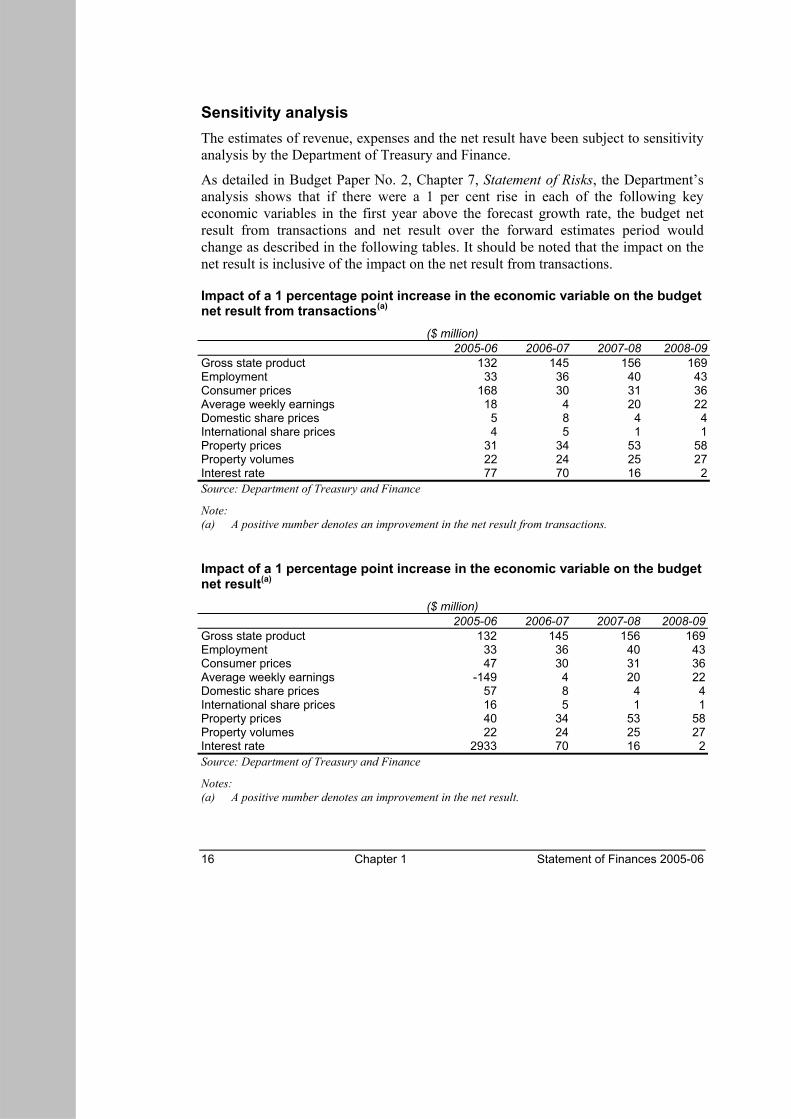
Sensitivity analysis The estimates of revenue, expenses and the net result have been subject to sensitivity analysis by the Department of Treasury and Finance.
As detailed in Budget Paper No. 2, Chapter 7, Statement of Risks, the Department’s analysis shows that if there were a 1 per cent rise in each of the following key economic variables in the first year above the forecast growth rate, the budget net result from transactions and net result over the forward estimates period would change as described in the following tables. It should be noted that the impact on the net result is inclusive of the impact on the net result from transactions.
Impact of a 1 percentage point increase in the economic variable on the budget net result from transactions(a)
Notes: (a) A positive number denotes an improvement in the net result.
Statement of Finances 2005-06 Chapter 1 17
Note 1: Statement of significant accounting policies and forecast assumptions The following summary sets out the significant accounting policies and forecast assumptions that have been adopted in preparing and presenting the Estimated Financial Statements for the forecast period (which includes the budget year and the estimates for the three subsequent years).
(A) Compliance framework In July 2002, the Financial Reporting Council announced that Australia would adopt International Financial Reporting Standards (IFRS) for reporting periods ending on or after 1 January 2005. In July 2004, the Australian Accounting Standards Board (AASB) issued 40 new and revised accounting standards based on IFRS. Together with a number of Urgent Issues Group Interpretations which are incorporated by AASB 1048 Interpretation and Application of Standards, the AASB pronouncements are to apply to all reporting entities preparing general purpose financial reports. In addition, certain existing Australian accounting standards, including AAS 31 Financial Reporting by Government, will continue to apply because there are no IFRS equivalents.
The Australian equivalent to International Financial Reporting Standards (A-IFRS) will be applicable to the 2005-06 Annual Financial Report of the State of Victoria. As there are no specific Australian authoritative pronouncements that prescribe the preparation and presentation of prospective financial statements, the Estimated Financial Statements have been presented based on a New Zealand Financial Reporting Standard Prospective Financial Information (FRS 29). FRS 29 requires prospective financial statements to be prepared in accordance with the accounting policies expected to be used in the future for reporting historically oriented general purpose financial reports; hence, the 2005-06 Estimated Financial Statements have been prepared on an A-IFRS basis. Information on the reconciliation of net assets as at the date of transition to A-IFRS is detailed in Note 18 in this budget paper.
In addition to compliance with A-IFRS and FRS 29, these Estimated Financial Statements have been prepared in accordance with sections 23H–23K of the Financial Management Act 1994, applicable pronouncements issued by the AASB, and other authoritative pronouncements. The information presented in the Estimated Financial Statements takes into account government decisions and other circumstances that may have a material effect on the statements.
The requirements of FRS 29 have been modified to achieve consistency in the presentation of the Estimated Financial Statements with AASB 101 Presentation of Financial Statements.
As part of the continuous improvement in financial reporting for the State, the Victorian Government has modified the presentation format of the operating statement to improve the usefulness and useability of its financial reports for
18 Chapter 1 Statement of Finances 2005-06
government performance reporting. The presentation format for the operating statement is intended to address the needs of all users pending introduction of a proposed Government Financial Statistics (GFS) and generally accepted accounting principles (GAAP) harmonised reporting format. In particular, the classification of income and expenses in the operating statement according to whether they arise from ‘transactions’ or ‘other economic flows’ will assist in meeting improved government accountability requirements within an accounting framework. The presentation format was developed with professional consultation and reference to authoritative guidance. More information on the definitions for ‘transactions’ and ‘other economic flows’ is detailed in Section F of this Note.
(B) Basis of accounting and measurement The accrual basis of accounting has been employed in the preparation of the Estimated Financial Statements whereby assets, liabilities, income, expenses and equity are recognised in the reporting period to which they relate, regardless of when cash is received or paid.
The opening balances of 1 July 2005 are based on the audited financial report as at 30 June 2004 adjusted for opening adjustments for the adoption of A-IFRS and revised estimated movements for 2004-05, and have been prepared in accordance with the historical cost convention, except for those items measured at valuation, which include:
• non-current physical assets (other than plant, equipment and vehicles, which are valued at historical cost), which are reassessed with sufficient regularity to ensure the carrying amount does not differ from their fair value in accordance with AASB 116 Property Plant and Equipment and AASB 136 Impairment of Assets;
• investments and productive trees in commercial native forests which are recognised at their fair value less estimated point of sale costs in accordance with AASB 141 Agriculture; and
• certain liabilities, most notably unfunded defined benefit superannuation liabilities, which are calculated with regard to actuarial assessments in accordance with AASB 119 Employee Benefits.
(C) Reporting entity The Victorian general government sector includes all government departments, agencies and other bodies engaged in providing services free of charge or at prices significantly below their cost of production. The general government sector is not a separate entity but represents the budget sector within the State of Victoria whole-of-government reporting entity. Details of the entities included in the general government sector are shown in Note 19 to the financial statements.
The primary function of entities within the general government sector is to provide public services (outputs) which are mainly non-market in nature, for the collective
Statement of Finances 2005-06 Chapter 1 19
consumption of the community, and involve the transfer or redistribution of income and are financed mainly through taxes and other compulsory levies.
Estimated Financial Statements are not prepared for the State of Victoria reporting entity, but readers are encouraged to refer to the Annual Financial Report of the State of Victoria, which includes reporting for both the whole of government and the various sectors of government.
(D) Basis of consolidation The Estimated Financial Statements incorporate assets and liabilities of all reporting entities within the Victorian general government sector and their income and expenses for the respective period.
Where control of an entity is obtained during a financial year, its results are included in the consolidated operating statement from the date on which control commenced. Where control ceases during a financial period, the entity’s results are included for that part of the period in which control existed. Where dissimilar accounting policies are adopted by entities and their effect is considered material, adjustments are made to ensure consistent policies are adopted in these Estimated Financial Statements.
In the process of reporting the general government sector as a single economic entity, all material transactions and balances between entities within the sector are eliminated.
(E) Forecast reporting periods The reporting period for most consolidated entities is the year ended 30 June. However, for those entities with a reporting period other than 30 June, the most recently audited financial year results are used as a basis for the opening balance beginning 1 July 2005. For example, TAFE institutes have a reporting period ending on 31 December. Consequently, the results of these entities for the year ended 31 December 2004 and the balances existing as at 31 December 2004 have been used in the preparation of these financial statements, revised for estimated movements in the six months to 30 June 2005.
(F) Changes to the presentation of the operating statement As part of continuous improvement to its financial reports for government performance reporting, the Department of Treasury and Finance has adopted a new format in its presentation of the operating statement.
The presentation format is not inconsistent with A-IFRS, and is intended to transitionally address the needs of all users pending finalisation and introduction of a new reporting standard for government. AASB 101 Presentation of Financial Statements has introduced a degree of flexibility not available under the previous standards, to enable more relevant information to be presented to users to improve
20 Chapter 1 Statement of Finances 2005-06
understanding of financial performance. This includes the use of subtotals and the functional classification of items into transactions and other economic flows.
The income and expenses in the operating statement are classified according to whether or not they arise from ‘transactions’ or ‘other economic flows’. Hence, the results on the face of the operating statement are grouped under headings of ‘income from transactions’, ‘expenses from transactions’, ‘net result from transactions’, and ‘net result from other economic flows’.
A transaction is defined under the Government Finance Statistics Manual 2001 published by the International Monetary Fund (IMF). Transactions are those economic flows that are considered to arise as a result of policy decisions, usually an interaction between two entities by mutual agreement, and also flows within an entity such as depreciation where the owner is simultaneously acting as the owner of the depreciating asset and as the consumer of the service provided by the asset. Taxation is regarded as mutually agreed interactions between the Government and taxpayers. Transactions can be in kind (e.g. assets provided/given free of charge or for nominal consideration) or where the final consideration is cash. In simple terms, transactions arise from the policy decisions of the government.
Other economic flows are also defined in the Government Finance Statistics Manual 2001 published by the IMF. They include gains and losses from disposals, revaluations and impairments of non-current physical and intangible assets; actuarial gains and losses arising from defined benefit superannuation plans; fair value changes of financial instruments and agricultural assets; and depletion of natural assets (non-produced) from their use or removal. In simple terms, other economic flows are changes arising from market remeasurements.
(G) Income from transactions Income is recognised to the extent that it is probable that the economic benefits will flow to the entity and the income can be reliably measured.
Taxation State taxation and fee revenue is recognised upon the earlier of either the receipt by the State of a taxpayer’s self-assessment or the time the taxpayer’s obligation to pay arises, pursuant to the issue of an assessment.
The types of taxation revenue raised by the State include:
• payroll tax;
• land tax;
• duties levied principally on conveyancing and land transfers and rental business;
• levies on statutory corporations (including the environmental levy);
Statement of Finances 2005-06 Chapter 1 21
• gambling taxes levied mainly on private lotteries, electronic gaming machines, casino operations and racing;
• insurance duty relating to compulsory third party, life and non-life policies and insurance company contributions to fire brigades;
• motor vehicle taxes, including registration fees and duty on registrations and transfers; and
• other taxes, including landfill levies, concession fees payable by Transurban in respect of Melbourne City Link and licence fees.
Forecast assumption The State’s tax revenues are forecast by a process that involves:
• assessment of economic and other factors influencing the tax bases from which taxes are sourced (e.g. in the case of payroll tax, assessment of employment and wages outlooks; in the case of motor vehicle taxes, assessment of the outlook for demand for cars reflecting both long-term underlying demand factors and cyclical demand factors);
• analysis of historical information and relationships using econometric and other statistical methods;
• application of the Department of Treasury and Finance’s economic forecasts where there is a relationship between taxation revenue and economic variables; and
• consultation with private sector economists, industry associations, and relevant government authorities (e.g. State Revenue Office, Roads Corporation, Victorian Commission for Gambling Regulation).
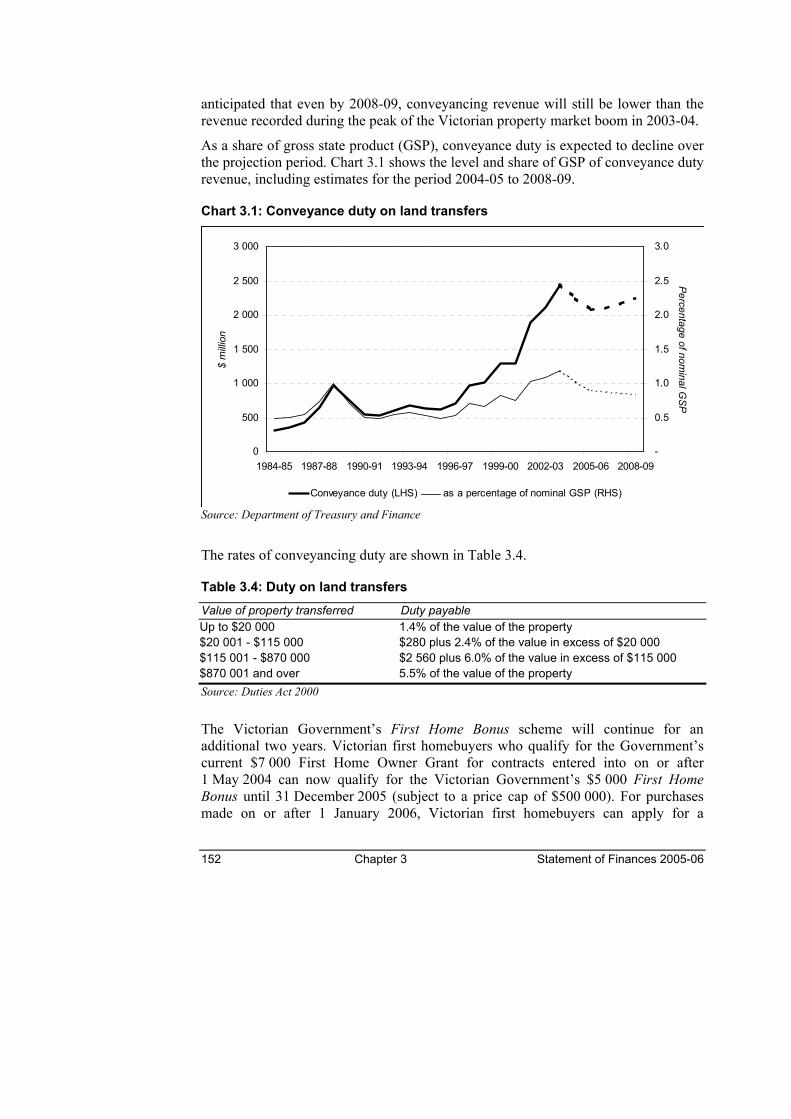
Some state taxes are sourced from tax bases which are particularly volatile. Hence, tax revenues from these sources are subject to substantial annual variation. Duty on land transfers is an example of a volatile tax base.
The Tattersalls lottery licence expires on 30 June 2007. The Government is currently reviewing the post-2007 lottery arrangements. Estimates have been prepared on the basis of existing arrangements. These may be subject to revision when the review is finalised.
Fines and regulatory fees Revenue from fines and regulatory fees, including motor driver licence fees and other miscellaneous motor vehicle fees, is recognised at the time the fine is issued or the regulatory fee is billed.
22 Chapter 1 Statement of Finances 2005-06
Forecast assumption The forecasts of regulatory fees and fines are prepared by those government agencies that collect them. Some of the components may be based on contractual obligations, while the prediction of fines principally involves assessment of the behaviour of road users.
Automatic indexation is applied to fees and fines payable to the Public Account under provisions included in the Monetary Units Act 2004.
An indexation factor of 2.5 per cent has been applied to fines and regulatory fees for 2005-06.
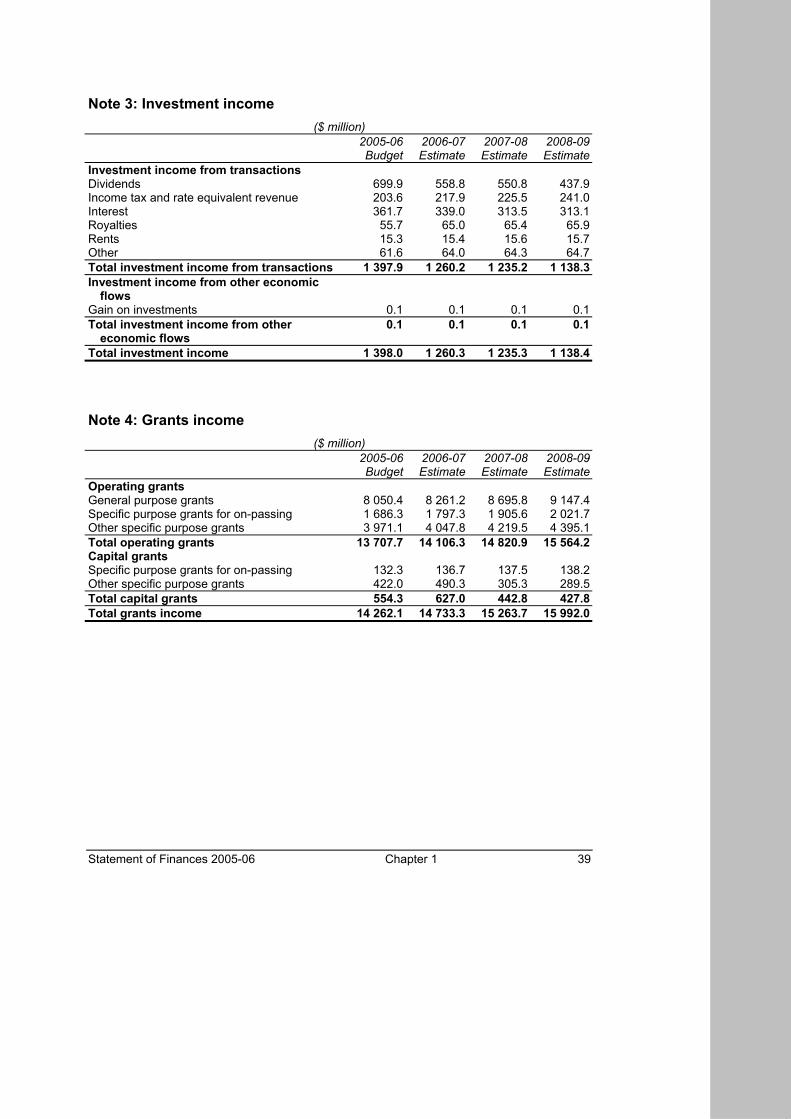
Investment income Investment income includes interest received, discount interest on financial assets, royalties, dividends and income tax and rate equivalent revenue from other sectors of government. Interest income is recognised on an accrual basis and dividend income is recognised when dividends are determined. Net realised and unrealised gains and losses on the revaluation of investments do not form part of investment income under income from transactions, but are reported as part of income from other economic flows. Forecast assumption As part of the budget process, government business enterprises provide their best available estimates of these future payments for the forecast period.
In determining the forecast dividend payments, the following two general benchmarks are used:
• 50 per cent of net profit after tax; or
• dividends and income tax equivalent paid or payable of 65 per cent of pre-tax profit.
Other commercial factors considered that will affect the dividend forecasts include the views of each agency’s board of directors, the liquidity, operating cash flow and forecast cash requirements of each government business enterprise (including planned capital works), gearing and interest cover of the business, retained earnings and any other specific commercial factors relating to individual businesses.
Dividend and income tax equivalent forecasts can be significantly influenced by a number of factors, including the volatility of the financial markets and climatic conditions impacting on the water authorities. Revenue raised under the National Tax Equivalent Regime (NTER), administered by the Australian Taxation Office, remains with the State. Currently, 40 government business enterprises (including subsidiaries) are subject to the NTER.
Forecast interest revenue assumes projected budget cash surpluses are invested.
Statement of Finances 2005-06 Chapter 1 23
Grants income Grants mainly comprise funds provided by the Commonwealth to assist the State in meeting general or specific service delivery obligations, primarily for the purpose of aiding in the financing of the operations of the recipient, capital purposes and/or for on-passing to other recipients. Grants also include grants from other jurisdictions. Revenue is recognised when the State obtains control over these funds. Forecast assumption The forecast receipt of financial assistance from the Commonwealth is determined on the latest available advice from the Commonwealth at the time of preparation of the Estimated Financial Statements, taking into account the payment schedules and escalation factors relevant to each type of grant.
Forecasts of Goods and Services Tax (GST) grants are based on the latest published Commonwealth forecast of the national GST pool. Victoria's share of future GST grants is obtained using the Commonwealth's population projections and holding the Commonwealth Grants Commission's latest set of assessed relativities constant throughout the forward years.
Sale of goods and services Revenue from sale of goods is recognised when control of goods has passed to the buyer and the revenue can be reliably measured.
Revenue from rendering of services is recognised on a stage of completion basis and is measured by reference to the labour hours or as a percentage of total services to be performed. Forecast assumption Revenues arising from the sale of goods and rendering of services are forecast by taking into account all known factors, such as proposed fee increases imposed by departments and budget sector agencies in line with the Guidelines for Setting Fees and Charges (issued by the Department of Treasury and Finance) and/or indexation as provided for under the Monetary Units Act 2004. Unless government policy states otherwise, fees will be set to recover the full costs of the goods or services provided.
Fair value of assets received free of charge or for nominal consideration Revenues arising from assets received free of charge or for nominal consideration are measured at the fair value of the contribution and are recognised when the entity gains control of the contribution or the right to receive the contribution.
(H) Expenses from transactions Expenses are recognised when they are incurred, and reported in the financial year to which they relate.
24 Chapter 1 Statement of Finances 2005-06
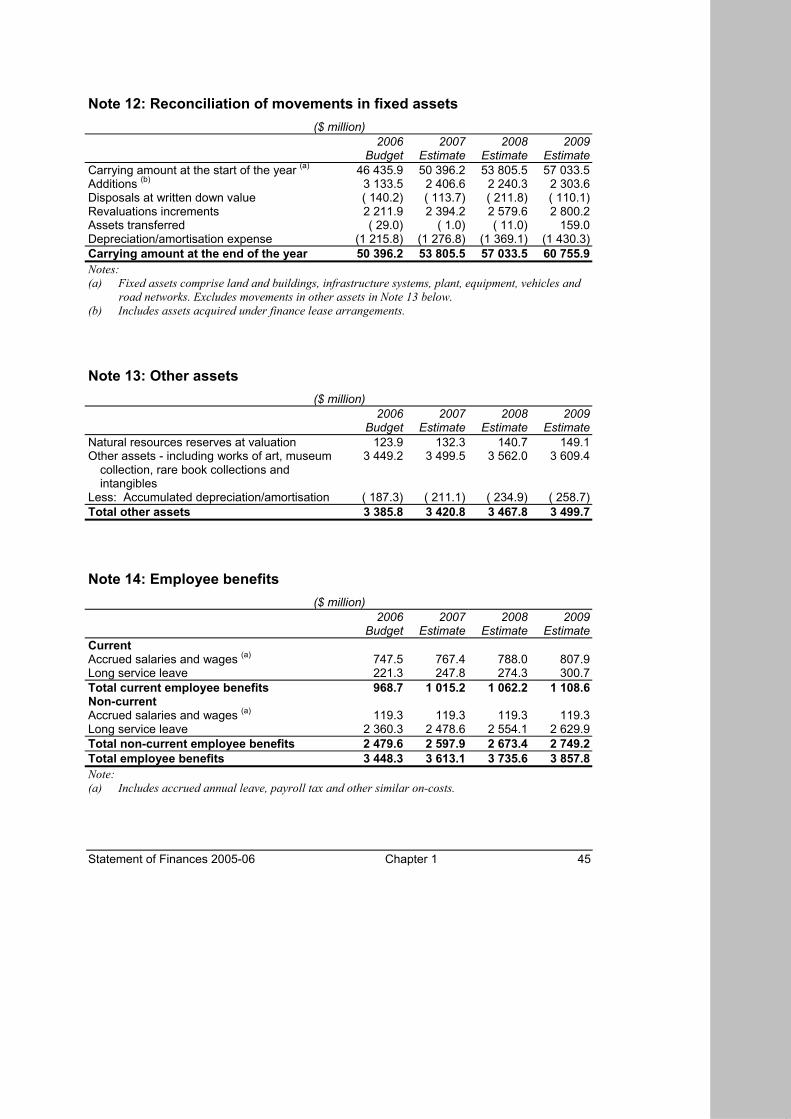
Employee benefits These expenses include all costs related to employment (other than superannuation which is accounted for separately) including wages and salaries, fringe benefits tax, leave entitlements and redundancy payments. Forecast assumption Employee benefits are forecast on the basis of staffing profiles and current salaries and conditions. For the forecast period, employee benefits are adjusted for approved wage agreements with allowance made for further changes in the future consistent with the Government’s wage policy. Under this policy, costs associated with Enterprise Bargaining Agreement outcomes beyond the maintenance of real wages (based on the normal indexation factor used to escalate departmental output revenue) are funded from real and sustainable productivity improvements, cost savings and improved service delivery.
Superannuation Superannuation expense is determined on the following basis:
• Defined contribution plans
The amount recognised as an expense reflects the State’s contribution, paid or accrued, in respect of the reporting period.
• Defined benefit plans
The amount recognised under superannuation expense for defined benefit plans reflects the estimated movement in the State’s net defined benefit superannuation liabilities during the reporting period, excluding the impact of actuarial gains and losses. Actuarial gains and losses are not classified as transactions and therefore are reported separately as superannuation expenses from other economic flows.
Forecast assumptions Future defined contribution superannuation expenses are based on assumptions regarding future salaries and rates and legislated contribution rates.
Future defined benefit superannuation expenses are based on forecast movements in the State’s net defined benefit superannuation liabilities. Refer to Note 1(K) for the forecast assumptions for the State’s net defined benefit superannuation liabilities.
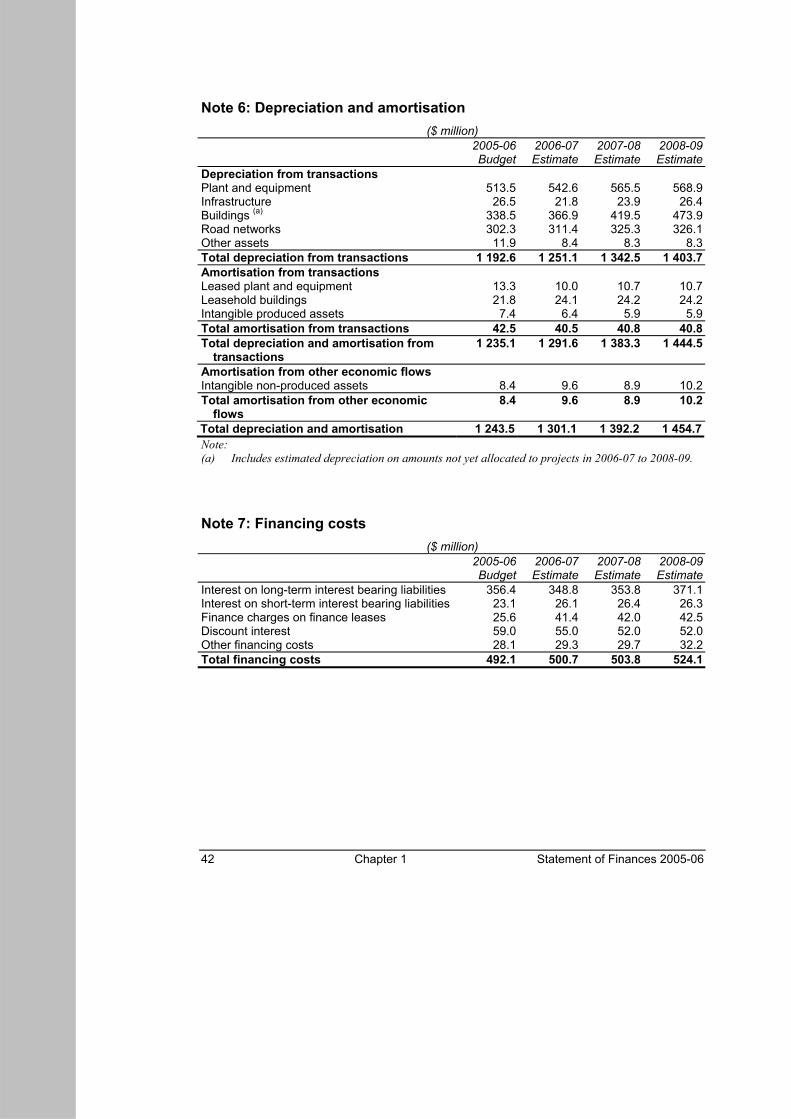
Depreciation All infrastructure, buildings, plant and equipment and other non-current physical assets (excluding items under operating leases, assets held for sale and investment properties) that have a limited useful life are depreciated. Depreciation is generally calculated on a straight-line basis, at rates that allocate the asset’s value, less any residual value, over its estimated useful life. Depreciation rates and methods are reviewed annually.
Statement of Finances 2005-06 Chapter 1 25
The following are typical estimated useful lives for the different asset classes for both current and prior years: Asset class Useful life Dwellings 40 to 50 years Other buildings 30 to 60 years Other infrastructure 10 to 32 years Road pavement 60 years Bridges 90 years Plant, equipment and vehicles 3 to 10 years Cultural assets 100 years
Land and earthworks associated with the declared road network, and core cultural assets which are considered to have an indefinite life, are not depreciated. Depreciation is not recognised in respect of these assets as their service potential has not, in any material sense, been consumed during the reporting period. Forecast assumption Depreciation is forecast on the basis of known asset profiles, asset sales programs and approved new asset investment programs. The expense is based on the assumption that there will be no change in depreciation rates over the forecast period. The estimated impact of future revaluation of assets on depreciation is also included in the expense.
Finance costs Finance costs are recognised as expenses in the period in which they are incurred, and include:
• interest on outstanding borrowings;
• amortisation of discounts or premiums relating to borrowings;
• amortisation of ancillary costs incurred in connection with the arrangement of borrowings;
• finance lease charges; and
• the increase in financial liabilities and provisions due to the unwinding of discount to reflect the passage of time.
Forecast assumption Estimates for finance costs are based on the forecast level of outstanding general government sector debt and expected changes in non-current financial liabilities and provisions. General government sector debt is expected to mainly comprise a fixed rate facility, and index-linked securities from the Treasury Corporation of Victoria. All maturities in the forecast period are assumed to be refinanced at forward interest rates.
26 Chapter 1 Statement of Finances 2005-06
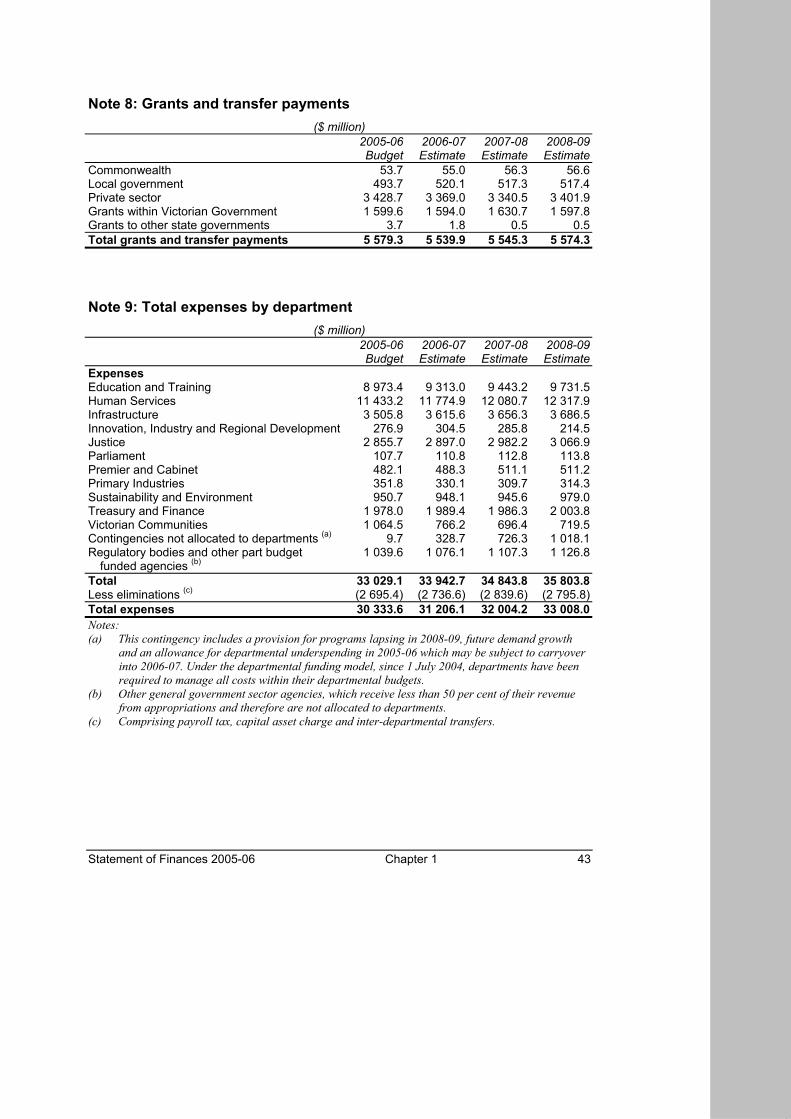
Grants and transfer payments Grants and transfer payments to third parties are recognised as an expense in the reporting period in which they are paid or payable. They include transactions such as grants, subsidies and other transfer payments made to local government, non-government schools, community groups, public non-financial corporations and public financial corporations. Forecast assumption Grants and transfer payments are forecast on the basis of known activity and adjusted by the appropriate economic parameters. Where payments are tied to third party revenue, such as Commonwealth grants for on-passing, forecasts are in line with estimated receipts.
Supplies and services Supplies and services generally represent cost of goods sold and the day-to-day running costs, including maintenance costs, incurred in the normal operation of the general government sector. These items are recognised as an expense in the reporting period in which they are incurred. The carrying amount of any inventories held for distribution are expensed when distributed. Forecast assumption Supplies and services are forecast on the basis of experience and known activity changes, including the application of government policy such as savings strategies, changes in the method of service delivery, and the application of the appropriate economic parameters.
An allowance is made for emerging demand that may arise over the forecast period.
(I) Income and expenses from other economic flows Other economic flows measure the change in volume or value of assets or liabilities that does not result from a transaction. This includes realised or unrealised gains and losses from disposals, revaluations and impairment of non-current physical assets and intangible assets; actuarial gains and losses from superannuation defined benefit plans; fair value changes of financial instruments and agricultural assets; foreign exchange gains or losses; and depletion of natural resources.
Gain (loss) from disposal of physical assets Any gain or loss on disposal of physical assets is recognised at the date of disposal and is determined after deducting from the proceeds the carrying value of the asset at that time.
Statement of Finances 2005-06 Chapter 1 27
Actuarial gains (losses) on superannuation defined benefit plans Actuarial gains or losses on superannuation defined benefit plans represents the impact on the net superannuation defined benefit liability as a result of differences between actual experience and assumptions used in estimating the net superannuation defined benefit liability. Actuarial gains or losses are recognised in the operating statement in the period in which they occur.
(J) Assets The 1 July 2005 opening balance of assets represents the audited value as at 30 June 2004, revised for estimated movements for 2004-05 and adjustments due to the adoption of A-IFRS.
Cash assets Cash assets comprise cash on hand, cash at bank, deposits at call and highly liquid investments with short periods to maturity, which are readily convertible to known amounts of cash and are subject to an insignificant risk of changes in value. Forecast assumption Cash assets are assumed to be held at levels sufficient to cover operating requirements over the forecast period.
Prepayments Prepayments represent payments in advance of receipt of goods or services or an expenditure made in one accounting period covering a term extending into the next accounting period. Forecast assumption Unless otherwise stated, prepayments for expenditure extending into the next accounting period are assumed to apply only to minor contractual obligations for goods and services.
Other financial assets Other financial assets comprise equity investments, debt securities and term deposits and are initially recognised at cost, being the fair value of the consideration given at the date of acquisition. Subsequent to initial recognition, such financial assets, other than financial assets that are intended to be held to maturity, are remeasured at fair value. Any realised or unrealised gains or losses on financial assets held at fair value are recognised in the operating statement as income or expenses from other economic flows. Financial assets intended to be held to maturity are recognised at amortised cost over the life of the investment. Any discount or premium on acquisition is amortised over the period to maturity. Gains or losses prior to maturity resulting from impairment or other derecognition of the financial asset are recognised in the operating statement as other economic flows.
28 Chapter 1 Statement of Finances 2005-06
Forecast assumption All surplus cash resources for the period 2005-06 to 2008-09 are assumed to be held as financial assets (investments) to preserve budget decision-making flexibility.
Receivables Receivables consist predominantly of debtors in relation to goods and services, taxes and fines, accrued investment income, and GST input tax credits recoverable.
Non-interest bearing loans and receivables are initially recognised at fair value. Subsequent to initial recognition, all loans and receivables are carried at amortised cost using the effective interest method subject to a test for impairment.
The effective interest method calculates the amortised cost of a financial asset or a financial liability and allocates the interest income or interest expense over the relevant period. The effective interest rate is the rate that exactly discounts estimated future cash payments or receipts through the expected life of the financial instrument or, when appropriate, a shorter period to the net carrying amount of the financial asset or financial liability.
Debt receivables are initially recognised at fair value. Subsequent to initial recognition, debt receivables that are able to be sold before maturity are remeasured at fair value and any gain or loss is recognised through profit or loss; where the entity has a positive intention and ability to hold the debt receivable to maturity, subsequent to initial recognition, the debt receivables are carried at amortised cost using the effective interest method subject to a test for impairment. An allowance for doubtful debts is made when there is evidence that the collection of the full amount is no longer probable. Bad debts are written off when identified. Forecast assumption Receivables are forecast on the basis of revenue activity levels.
Inventories Inventories include goods and other property held for distribution at no or nominal cost in the ordinary course of business operations. It excludes depreciable assets.
Inventories held for distribution are measured at the lower of cost and current replacement cost. All other inventories are measured at the lower of cost and net realisable value.
Cost is assigned to other high value, low volume inventory items on a specific identification of cost basis.
Cost for all other inventory is measured on the basis of weighted average cost. Forecast assumption Inventories forecast to be purchased are valued at the forecast cost.
Statement of Finances 2005-06 Chapter 1 29
Assets held for sale Assets held for sale include assets for which the carrying amount of the asset will be recovered principally through a sale transaction rather than through continuing use. An asset classified as held for sale is measured at the lower of its carrying amount and fair value less costs to sell. Forecast assumption Assets held for sale are forecast on the basis of experience and known asset sales programs including the application of government policy such as asset management strategies and changes in the method of output delivery.
Non-current physical assets Non-current physical assets include land and buildings, infrastructure assets, national parks, state forests and other Crown land, cultural assets and plant, equipment and vehicles.
In general, all non-current physical assets with a value over $1 000 are capitalised.
Non-current physical assets, other than plant, equipment and vehicles, are measured at fair value. Fair value is determined on the following basis:
• land and buildings are measured at the amounts for which assets could be exchanged between knowledgeable willing parties in an arm’s length transaction;
• infrastructure assets and road network assets (including earthworks of the declared road networks but excluding land under roads) are measured by reference to the assets’ depreciated replacement cost. Land under roads is not recognised;
• national parks, state forests and other Crown land are measured with regard to the property’s highest and best use after due consideration is made for any legal or constructive restrictions imposed on the asset, public announcements or commitments made in relation to the intended use of the asset. Theoretical opportunities that may be available in relation to the asset are not taken into account until it is virtually certain that the restrictions will no longer apply; and
• cultural assets and collections, including heritage assets, are those assets that the State intends to preserve because of their unique historical, cultural or environmental attributes. These assets include items such as the Royal Botanical Gardens, Herbarium, State Library, Government House, Parliament House, historic houses, monuments, certain museum exhibits, art collections, archival collections and other items of cultural significance. These assets are measured at the cost of replacing the asset less, where applicable, accumulated depreciation calculated on the basis of such cost to reflect the already consumed or expired future economic benefits of the asset.
30 Chapter 1 Statement of Finances 2005-06
Plant, equipment and vehicles comprise furniture and fittings, office equipment, general library collections, information technology systems and computer equipment, machinery, motor vehicles, musical equipment and sporting equipment, and are measured at cost. Impairment The carrying values of non-current physical assets are reviewed for impairment when events or changes in circumstances indicate the carrying value may not be recoverable.
If there is an indication of possible impairment, the assets concerned are tested as to whether their carrying value exceeds their recoverable amount. Where an asset’s carrying value exceeds its recoverable amount, the difference is written-off by a charge to the operating statement except to the extent that the write-down can be debited to an asset revaluation reserve amount applicable to that class of asset.
The recoverable amount for most assets is measured at the higher of depreciated replacement cost and fair value less costs to sell. The recoverable amount for assets held primarily to generate net cash inflows is measured at the higher of the present value of future cash flows expected to be obtained from the asset and fair value less costs to sell. It is deemed that, in the event of the loss of an asset, the future economic benefits arising from the use of the asset will be replaced unless a specific decision to the contrary has been made. Revaluations Assets other than those that are carried at cost are revalued with sufficient regularity to ensure that the carrying amount of each asset does not differ materially from its fair value. This revaluation process normally occurs every three to four years for assets with useful lives of less than 30 years, or six to eight years for assets with useful lives of 30 or more years. Revaluation increments or decrements arise from differences between an asset’s depreciated cost or deemed cost and fair value.
Revaluation increments are credited directly to equity in the revaluation reserve, except that, to the extent that an increment reverses a revaluation decrement in respect of that class of asset previously recognised as an expense in the net result, the increment is recognised as revenue in determining the net result.
Revaluation decrements are recognised immediately as expenses in the net result, except that, to the extent that a credit balance exists in the revaluation reserve in respect of the same class of assets, they are debited to the revaluation reserve.
Revaluation increments and decrements are offset against one another within the same class of non-current assets.
Revaluation reserves are not transferred to accumulated funds on derecognition of the relevant asset.
Statement of Finances 2005-06 Chapter 1 31
Restrictive nature of cultural and heritage assets, Crown land and infrastructure Certain agencies in the Victorian general government sector hold cultural assets, heritage assets, Crown land and infrastructure. Such assets are deemed worthy of preservation because of the social rather than financial benefits they provide to the community.
Consequently, there are certain limitations and restrictions imposed on their use and/or disposal. Forecast assumption The value of non-current physical assets will change during the forecast period to account for acquisitions, disposals and the impact of depreciation and revaluation.
New investments in assets are valued at the forecast purchase price or, where appropriate, recognised progressively over the estimated construction period.
The forward estimates include the estimated impact of revaluations of non-current physical assets. These estimates have been derived based on examination and extrapolation of historical trends in asset revaluations by major asset class. These estimates have been included in the forward estimates at a total general government level.
Intangible assets are recognised at cost. Costs incurred subsequent to initial acquisition are capitalised when it is expected that additional future economic benefits will flow to the entity.
Amortisation is allocated to intangible assets with finite useful lives on a systematic basis over the asset’s useful life. Amortisation commences when the asset is available for use, that is, when it is in the location and condition necessary for it to be capable of operating in the manner intended by management. The amortisation period and the amortisation method for an intangible asset with a finite useful life are reviewed at least at the end of each annual reporting period. In addition, an assessment is made at each reporting date to determine whether there are indicators that the intangible asset concerned is impaired. If so, the assets concerned are tested as to whether their carrying value exceeds their recoverable amount.
Intangible assets with indefinite useful lives are not amortised. The useful life of intangible assets that are not being amortised are reviewed each period to determine whether events and circumstances continue to support an indefinite useful life assessment for that asset. In addition, all intangible assets with indefinite useful lives are tested for impairment by comparing its recoverable amount with its carrying
32 Chapter 1 Statement of Finances 2005-06
amount annually or whenever there is an indication that the intangible asset may be impaired. Any excess of the carrying amount over the recoverable amount is recognised as an impairment loss. Forecast assumption The value of intangible assets during the forecast period will change to account for forecast acquisitions, disposals and the impact of amortisation.
Other non-current physical assets Land under roads Land under roads and road reserves has not been recognised, consistent with current accounting standards. Forecast assumption AASB 1045 Land Under Roads provides transitional relief to governments to not recognise land under roads until the reporting period ending 30 June 2007. As permitted by AASB 1045, the State has adopted an accounting policy to not recognise land under roads. Accordingly, land under roads has not been recognised during the forecast period on the assumption that the requirements for the accounting of land under roads will remain unchanged for reporting periods after 30 June 2007. Biological assets The majority of biological assets comprise commercial native forests.
Commercial native forests are measured at their fair value less estimated point-of-sale costs. The fair value is determined as the difference between the net present value of cash flows expected to be generated by the commercial native forests (discounted at a current market determined rate, which reflects the risks associated with the forests and the fair value of the land on which the trees are grown) less the fair value of the land on which the commercial native forests are growing.
The fair value of the land has been determined in accordance with an independent valuation. Forecast assumption The value of natural resources will change during the forecast period to account for acquisitions, disposals and the impact of revaluations.
Partnerships Victoria projects Infrastructure projects approved in-principle by the Government for possible delivery under the Partnerships Victoria model are initially included in the Estimated Financial Statements as non-current physical assets (with associated financing and depreciation costs). An exception to this is EastLink (formerly the Mitcham-Frankston Project), which is funded by user pay tolls.
Statement of Finances 2005-06 Chapter 1 33
A final decision on whether an infrastructure project is to proceed with a Partnerships Victoria delivery approach will be made following evaluation of bids arising from the tender process for the project and will be based on an assessment of value for money and satisfaction of the public interest. If, at the conclusion of the tender process, a decision is made to proceed with a Partnerships Victoria delivery approach, the budget treatment will be adjusted as required, to convert the budgeted asset investment, depreciation and financing flows to an appropriate stream of service payments to the private sector.
Leases A distinction is made between finance leases, which transfer substantially all the risks and benefits incidental to ownership of the leased assets from the lessor to the lessee, and operating leases, where the lessor effectively retains all such risks and benefits.
Leases are classified at their inception as either operating or finance leases based on the economic substance of the agreement so as to reflect the risks and benefits incidental to ownership.
Finance leases are recognised as assets and liabilities at amounts equal to the fair value of the lease property or, if lower, the present value of the minimum lease payment, each determined at the inception of the lease. The lease asset is depreciated over the shorter of the estimated useful life of the asset or the term of the lease. Minimum lease payments are allocated between the principal component of the lease liability, and the interest expense calculated using the interest rate implicit in the lease, and charged directly to the estimated operating statement. Contingent rentals associated with finance leases are recognised as an expense in the period in which they are incurred.
Operating lease payments, including any contingent rentals, are recognised as an expense in the estimated operating statement on a straight-line basis over the lease term unless another systematic basis is more representative of the time pattern of the benefit derived from the use of the leased asset.
The aggregate cost (or benefit) associated with operating lease incentives are recognised as a reduction of rental income (or rental expense) on a straight-line basis over the lease term.
The cost of leasehold improvements is capitalised as an asset and depreciated over the remaining term of the lease or the estimated useful life of the improvements, whichever is the shorter. Forecast assumption Unless otherwise stated, existing leases are assumed to be replaced by leases with similar terms and conditions.
34 Chapter 1 Statement of Finances 2005-06
(K) Liabilities The 1 July 2005 opening balance of liabilities represents the audited value as at 30 June 2004, revised for estimated movements for 2004-05 and opening adjustments due to the adoption of A-IFRS.
Payables Payables consist predominantly of creditors and other sundry liabilities. All payables are initially recognised at fair value. For current payables, it will be the nominal amount. Subsequent to initial recognition, all payables are carried at amortised cost using the effective interest method. Forecast assumption For the forecast period, payables are based on known movements in contractual arrangements and other outstanding payables.
Interest-bearing liabilities The State’s interest-bearing liabilities mainly represent funds raised from the following sources:
• the residual amount outstanding for loans raised in previous years by the Commonwealth Government on behalf of the State;
• public borrowings mainly raised through the Treasury Corporation of Victoria; and
• finance leases.
Interest-bearing loans and borrowings are initially recognised at fair value. Subsequent to initial recognition, the interest-bearing liabilities are remeasured at amortised cost using the effective interest method. Amortised cost is calculated by taking into account any issue costs, and any discount or premium on settlement. Forecast assumption General government sector debt is assumed to be refinanced at forward interest rates.
Employee benefits An estimate of the employee benefits provision is made in the Estimated Financial Statements mainly for benefits not taken at the end of each forecast reporting date in respect of wages and salaries, annual leave and long service leave. The provisions for employee benefits that are expected to be settled within 12 months after the end of the reporting period are measured at the amounts expected to be paid. Benefits that are expected to be settled after 12 months are measured at the present value of the estimated future cash outflows to be made in respect of services provided by employees up to each reporting date.
Statement of Finances 2005-06 Chapter 1 35
Forecast assumption Employee benefits are forecast on the basis of staffing profiles and current salaries and conditions. For the forecast period, employee benefits are adjusted for approved wage agreements with an allowance made for future movements.
Superannuation The State’s superannuation liabilities are estimated at each forward estimate reporting date based on the present value of the State’s liability to provide members’ accrued benefits under defined benefit plans less the net market value of the defined benefit plan’s assets and less any unrecognised past service costs. The Projected Unit Credit Method is used to estimate the present value of accrued benefits expected to be paid in future reporting periods, giving consideration to expected future wage and salary levels, experience of employee departures and periods of service. Expected future payments are discounted using rates of Commonwealth bonds with terms to maturity that match, as closely as possible, the estimated future cash outflows. Forecast assumptions The State’s superannuation liabilities at future balance dates are estimated in accordance with the above policy applying projections provided by the actuaries of the various defined benefit plans under a number of demographic and financial assumptions which include, in particular, an expected return on the assets of the defined benefit plans and a discount rate for determining the present value of accrued benefits. Consistent with the long-term actuarial assumptions detailed below, the expected return on assets is assumed to remain constant across the budget and forecast periods. The discount rates used are based, in accordance with the requirements for reporting under A-IFRS, on the prevailing Commonwealth bond rates and are also assumed not to vary across the forward estimates period. Actual experiences may vary significantly from the assumptions used, which may cause significant variances to the State’s superannuation liabilities with consequential impact principally on other economic flows in the operating statement.
The new A-IFRS standard AASB 119 Employee Benefits, requires increased disclosure of all the financial assumptions used in estimating the liability and the expenses to government of employee benefits. Consequently the table below provides additional information as part of the forecast assumptions for the budget and forward years for each relevant defined benefit plan.
36 Chapter 1 Statement of Finances 2005-06
Superannuation assumptions Victorian statutory superannuation funds Assumptions Per cent (a)
State Superannuation Fund/Emergency Services Expected return on assets(b) 7.50Superannuation Scheme Discount rate(c) 5.47 Wages growth 4.00 Inflation rate 2.50Constitutionally Protected Schemes Discount rate(c) 5.47 Wages growth 4.00 Inflation rate n.a.Parliamentary Contributory Superannuation Scheme (d) Expected return on assets(b) 7.60 Discount rate(c) 5.47 Wages growth 4.00 Inflation rate n.a.HealthSuper Fund Expected return on assets(b) 7.00 Discount rate(c) 5.47 Wages growth 4.00 Inflation rate 2.50Notes: (a) Wages growth in this table are actuarial assumptions and do not reflect the Government’s wages
policy. (b) The expected return on assets stated is gross of tax. This rate is adjusted in the calculation
process to reflect the assumed rate of tax payable by each scheme. For the period to 30 June 2005, further adjustment was made in the calculation process to allow for the actual investment performance of each scheme, as available at that time.
(c) In accordance with accounting standards, the discount rate is based on the 10 year Commonwealth Government bond rate. The rate stated above is an annual effective rate, gross of tax.
(d) Parliamentary salaries are determined by reference to equivalent salaries in the Commonwealth Parliament.
Outstanding insurance claims The outstanding claims liability is independently assessed by actuaries. It covers claims reported but not yet paid, claims incurred but not yet reported, and the anticipated direct and indirect costs of settling those claims. The actuaries take into account projected inflation and other factors to arrive at expected future payments. These are then discounted at the reporting date using a market-determined, risk-adjusted discount rate. Forecast assumption The level of outstanding insurance claims liability at the end of each forecast year is based on historical trends, existing actuarial valuations and projections adjusted for forecast activity levels.
Other liabilities Other liabilities consist of income tax equivalent, dividends payable, deferred tax liability, unearned/prepaid income, goods and services tax and fringe benefits tax payables, and are initially recognised at fair value and subsequently remeasured at amortised cost.
Statement of Finances 2005-06 Chapter 1 37
(L) Right to receive assets An independent private sector entity has leased land and state works from the State and has constructed the City Link network on which it charges tolls to motorists during the concession period.
The concession period has a nominal term (33.5 years) and at the end of the period, the state works, together with the constructed facilities, will be returned to the State.
There are also a number of Partnership Victoria projects, including EastLink, which may include the right of the State to receive assets in the future. This recognition of the right to receive infrastructure assets is currently being considered by the accounting profession and a cross-jurisdictional government working party, but the accounting treatment has been deferred until authoritative guidance is available.
Accordingly, the asset is not disclosed, pending authoritative guidance or the development of relevant accounting standards on the appropriate treatment in the Estimated Operating Statement and Estimated Balance Sheet.
(M) Accounting for the goods and services tax (GST) Revenues, expenses and assets are recognised net of GST, except where the amount of GST incurred is not recoverable, in which case it is recognised as part of the cost of acquisition of an asset or part of an item of expense. GST receivable from and payable to the Australian Taxation Office has been included in the Estimated Balance Sheet.
(N) Estimated statement of cash flows For the purposes of the Estimated Statement of Cash Flows, cash comprises cash on hand, cash at bank, bank overdrafts and deposits at call, and highly liquid investments that are readily convertible to known amounts of cash and are subject to an insignificant risk of changes in value.
(O) Rounding All amounts in the Estimated Financial Statements have been rounded to the nearest hundred thousand dollars unless otherwise stated. Figures in the Estimated Financial Statements may not add due to rounding.
38 Chapter 1 Statement of Finances 2005-06
Note 2: Taxation ($ million)
.. 2005-06 2006-07 2007-08 2008-09
.. Budget Estimate Estimate Estimate Payroll tax 3 179.2 3 328.6 3 487.4 3 648.8Taxes on immovable property Land tax 824.1 846.8 837.2 847.5Long-stay car parks levy 19.4 38.8 39.7 40.6Metropolitan improvement levy 92.1 95.1 98.2 101.4Property owner contributions to fire brigades 34.9 35.6 36.4 38.0Total taxes on immovable property 970.5 1 016.3 1 011.4 1 027.5Financial and capital transactions Land transfers 2 075.6 2 108.8 2 167.5 2 254.4Rental business stamp duty 57.5 43.5 .. ..Other property stamp duty 11.1 12.9 12.3 13.0Debits tax 21.5 .. .. ..Financial accommodation levy 10.2 14.1 16.6 16.8Total financial and capital transactions 2 175.9 2 179.3 2 196.4 2 284.2Levies on statutory corporations 60.4 60.4 61.6 ..Gambling taxes Private lotteries 314.7 330.0 333.4 343.4Electronic gaming machines 931.0 983.4 944.8 997.0Casino 113.5 122.5 132.7 144.3Racing 116.5 120.3 118.0 121.9Other 3.3 3.4 3.5 3.6Total gambling taxes 1 479.0 1 559.6 1 532.5 1 610.3Taxes on insurance 1 061.2 1 114.9 1 173.4 1 229.7Motor vehicle taxes (a) Vehicle registration fees 711.4 764.5 808.6 855.4Stamp duty on vehicle transfers 594.9 631.4 670.8 712.3Total motor vehicle taxes 1 306.3 1 395.9 1 479.4 1 567.7Other taxes 73.7 74.8 74.1 73.2Total taxation revenue 10 306.2 10 729.8 11 016.2 11 441.3Note: (a) Taxation has been adjusted to exclude motor drivers’ licence fees, police learner and driver fees,
and other miscellaneous motor vehicle fees, which are now classified as regulatory fees.
Statement of Finances 2005-06 Chapter 1 39
Note 3: Investment income ($ million)
.. 2005-06 2006-07 2007-08 2008-09
.. Budget Estimate Estimate Estimate Investment income from transactions .. .. .. .. Dividends 699.9 558.8 550.8 437.9 Income tax and rate equivalent revenue 203.6 217.9 225.5 241.0 Interest 361.7 339.0 313.5 313.1 Royalties 55.7 65.0 65.4 65.9 Rents 15.3 15.4 15.6 15.7 Other 61.6 64.0 64.3 64.7 Total investment income from transactions 1 397.9 1 260.2 1 235.2 1 138.3 Investment income from other economic
flows .. .. .. ..
Gain on investments 0.1 0.1 0.1 0.1 Total investment income from other
economic flows 0.1 0.1 0.1 0.1
Total investment income 1 398.0 1 260.3 1 235.3 1 138.4
Note 4: Grants income ($ million)
.. 2005-06 2006-07 2007-08 2008-09
.. Budget Estimate Estimate Estimate Operating grants .. .. .. .. General purpose grants 8 050.4 8 261.2 8 695.8 9 147.4 Specific purpose grants for on-passing 1 686.3 1 797.3 1 905.6 2 021.7 Other specific purpose grants 3 971.1 4 047.8 4 219.5 4 395.1 Total operating grants 13 707.7 14 106.3 14 820.9 15 564.2 Capital grants .. .. .. .. Specific purpose grants for on-passing 132.3 136.7 137.5 138.2 Other specific purpose grants 422.0 490.3 305.3 289.5 Total capital grants 554.3 627.0 442.8 427.8 Total grants income 14 262.1 14 733.3 15 263.7 15 992.0
40 Chapter 1 Statement of Finances 2005-06
Note 5: Superannuation The liability for employee superannuation benefits is the responsibility of the State’s public sector superannuation funds. These funds are not consolidated in the Estimated Financial Statements as they are not controlled by the State. However, the major proportion of unfunded superannuation liabilities are the responsibility of the State and are recognised accordingly.
(a) Superannuation expense recognised in the operating statement ($ million)
.. 2005-06 2006-07 2007-08 2008-09
.. Budget Estimate Estimate Estimate Defined benefit plans .. .. ..Current service cost (a) 634.5 538.8 508.9 505.6Interest cost (a) 1 401.7 1 428.9 1 449.3 1 465.8Expected return on plan assets (net of
expenses) (a) ( 958.8) ( 960.3) ( 965.2) ( 978.1)
Amortisation of past service cost (a) ( 12.0) ( 12.0) ( 12.0) ( 12.0)Actuarial (gains)/losses (b) .. .. .. ..Total expense recognised in respect of
defined benefit plans 1 065.4 995.5 981.1 981.3
Defined contribution plans .. .. .. ..Employer contributions to defined contribution
plans (a) 655.2 749.2 762.0 777.2
Other (including pensions) (a) 38.7 40.3 41.9 43.5Total expense recognised in respect of
defined contribution plans 693.9 789.5 803.9 820.7
Total superannuation expense recognised in operating statement
1 759.3 1 784.9 1 785.0 1 802.0
Notes: (a) Superannuation expense from transactions. (b) Superannuation expense from other economic flows.
(b) Reconciliation of the present value of the defined benefit obligation ($ million)
.. 2005-06 2006-07 2007-08 2008-09
.. Budget Estimate Estimate Estimate Opening balance of defined benefit
obligation 30 677.0 31 289.4 31 714.1 32 011.5
Current service cost 634.5 538.8 508.9 505.6Interest cost 1 401.7 1 428.9 1 449.3 1 465.8Contributions by plan participants 213.2 207.2 198.4 190.0Actuarial (gains)/losses .. .. .. ..Benefits paid (1 637.0) (1 750.2) (1 859.3) (1 929.6)Closing balance of defined benefit
obligation 31 289.4 31 714.1 32 011.5 32 243.3
Statement of Finances 2005-06 Chapter 1 41
(c) Reconciliation of the fair value of superannuation plan assets ($ million)
.. 2005-06 2006-07 2007-08 2008-09
.. Budget Estimate Estimate Estimate Opening balance of plan assets 13 961.5 13 913.6 13 965.4 14 178.3 Expected return on plan assets 958.8 960.3 965.2 978.1 Actuarial gains/(losses) .. .. .. .. Employer contributions 488.0 772.7 1 044.1 1 134.0 Contributions by plan participants 213.2 207.2 198.4 190.0 Benefits paid (including tax paid) (1 707.8) (1 888.5) (1 994.7) (2 073.7) Closing balance of plan assets 13 913.6 13 965.4 14 178.3 14 406.7
(d) Reconciliation of the assets and liabilities recognised in the balance sheet
($ million) .. 2005-06 2006-07 2007-08 2008-09 .. Budget Estimate Estimate Estimate State Superannuation Fund .. .. .. .. Defined benefit obligation 23 505.4 23 824.2 24 031.7 24 190.2 Plan assets (9 260.5) (9 182.5) (9 118.8) (9 084.4) Net liability/(asset) 14 244.9 14 641.7 14 912.9 15 105.9 Other funds (a) .. .. .. .. Defined benefit obligation 7 784.0 7 890.0 7 979.8 8 053.1 Plan assets (4 653.2) (4 782.9) (5 059.6) (5 322.4) Net liability/(asset) 3 130.9 3 107.1 2 920.2 2 730.7 Total unfunded superannuation .. .. .. Defined benefit obligation 31 289.4 31 714.1 32 011.5 32 243.3 Plan assets (13 913.6) (13 965.4) (14 178.3) (14 406.7) Unrecognised past service cost 43.0 31.0 19.0 7.0 Unfunded superannuation liability 17 418.8 17 779.8 17 852.2 17 843.5 Represented by: Current liability 285.0 560.0 652.0 822.0 Non-current liability 17 133.8 17 219.8 17 200.2 17 021.5 Note: (a) Other consists of Emergency Services Superannuation Fund, constitutionally protected schemes,
Parliamentary Contributory Superannuation Scheme, HealthSuper Fund and the general government element of the Local Authorities Fund.
42 Chapter 1 Statement of Finances 2005-06
Note 6: Depreciation and amortisation ($ million)
.. 2005-06 2006-07 2007-08 2008-09
.. Budget Estimate Estimate Estimate Depreciation from transactions .. .. .. ..Plant and equipment 513.5 542.6 565.5 568.9Infrastructure 26.5 21.8 23.9 26.4Buildings (a) 338.5 366.9 419.5 473.9Road networks 302.3 311.4 325.3 326.1Other assets 11.9 8.4 8.3 8.3Total depreciation from transactions 1 192.6 1 251.1 1 342.5 1 403.7Amortisation from transactions .. .. .. .. Leased plant and equipment 13.3 10.0 10.7 10.7Leasehold buildings 21.8 24.1 24.2 24.2Intangible produced assets 7.4 6.4 5.9 5.9Total amortisation from transactions 42.5 40.5 40.8 40.8Total depreciation and amortisation from
transactions 1 235.1 1 291.6 1 383.3 1 444.5
Amortisation from other economic flows .. .. .. ..Intangible non-produced assets 8.4 9.6 8.9 10.2Total amortisation from other economic
flows 8.4 9.6 8.9 10.2
Total depreciation and amortisation 1 243.5 1 301.1 1 392.2 1 454.7Note: (a) Includes estimated depreciation on amounts not yet allocated to projects in 2006-07 to 2008-09.
Total 33 029.1 33 942.7 34 843.8 35 803.8 Less eliminations (c) (2 695.4) (2 736.6) (2 839.6) (2 795.8) Total expenses 30 333.6 31 206.1 32 004.2 33 008.0 Notes: (a) This contingency includes a provision for programs lapsing in 2008-09, future demand growth
and an allowance for departmental underspending in 2005-06 which may be subject to carryover into 2006-07. Under the departmental funding model, since 1 July 2004, departments have been required to manage all costs within their departmental budgets.
(b) Other general government sector agencies, which receive less than 50 per cent of their revenue from appropriations and therefore are not allocated to departments.
(c) Comprising payroll tax, capital asset charge and inter-departmental transfers.
44 Chapter 1 Statement of Finances 2005-06
Note 10: Property, plant and equipment and infrastructure systems ($ million)
.. 2006 2007 2008 2009
.. Budget Estimate Estimate Estimate Land, national parks and other land only
Movements included in investing and financing activities
.. .. .. ..
Net revenue from sale of property, plant and equipment
( 25.7) ( 21.4) ( 9.1) ( 9.7)
Movements in assets and liabilities .. .. .. ..Increase/(decrease) in provision of doubtful
debts 65.7 61.0 51.0 45.9
Increase/(decrease) in payables ( 1.9) ( 64.6) ( 52.9) ( 45.2)Increase/(decrease) in employee benefits 246.1 164.8 122.5 122.2Increase/(decrease) in superannuation 649.4 361.0 72.5 ( 8.7)Increase/(decrease) in insurance claims
liabilities ( 5.1) ( 33.4) ( 29.9) ( 29.7)
Increase/(decrease) in other liabilities 2.5 ( 11.2) ( 16.7) ( 4.2)(Increase)/decrease in receivables 58.8 ( 172.5) ( 213.0) ( 165.2)(Increase)/decrease in other assets 46.9 39.4 28.2 33.9Net cash flows from operating activities 2 578.6 1 899.2 1 621.0 1 744.9
Note 16: Reconciliation of cash ($ million)
.. 2005-06 2006-07 2007-08 2008-09
.. Budget Estimate Estimate Estimate Cash 745.9 760.3 776.1 790.6Deposits at call 559.1 545.2 531.9 518.6Cash and deposits 1 305.0 1 305.5 1 308.1 1 309.2Bank overdraft ( 8.4) ( 8.4) ( 8.4) ( 8.4)Cash and deposits held as at 30 June 1 296.6 1 297.1 1 299.7 1 300.8
Statement of Finances 2005-06 Chapter 1 47
Note 17: Purchase of property, plant and equipment by department ($ million)
.. 2005-06 2006-07 2007-08 2008-09
.. Budget Estimate Estimate Estimate Education and Training 555.7 368.5 199.9 201.4 Human Services 773.7 537.0 274.4 115.8 Infrastructure 661.7 657.5 359.6 158.2 Innovation, Industry and Regional Development 48.9 11.6 11.7 11.7 Justice 194.1 145.0 94.1 80.5 Parliament 6.1 5.1 6.7 2.2 Premier and Cabinet 81.8 58.1 38.1 37.9 Primary Industries 4.9 5.1 5.2 5.2 Sustainability and Environment 131.9 92.1 83.7 71.2 Treasury and Finance (a) 65.8 28.7 14.0 13.9 Victorian Communities 24.2 7.3 6.3 6.2 Other general government sector agencies 105.4 118.5 84.9 85.2 Not allocated to departments (b) ( 125.0) 385.0 1 072.8 1 526.7 Total purchase of property, plant and
equipment 2 529.4 2 419.5 2 251.3 2 315.9
Notes: (a) Includes amounts under the vehicle fleet leasing facility not allocated to departments. (b) Amount available to be allocated to specific departments and projects in future budgets. This
includes an allowance for departmental underspending in 2005-06 which may be subject to carryover in 2006-07.
48 Chapter 1 Statement of Finances 2005-06
Note 18: Reconciliation of net assets as at 1 July 2004 ($ million)
Notes: (a) This table reconciles the opening balances as at 1 July 2004 restated on an A-IFRS basis. The
following notes provide explanations of material restatements. (b) Certain assets that were previously classified as inventory are now classified as assets held for
sale under A-IFRS, causing a decrease in inventories and an increase in assets held for sale. (c) The decrease in property, plant and equipment is due to the write-down of school buildings by the
Department of Education and Training as a result of impairment requirements under AASB 116 and AAS 136.
(d) The movement in employee benefits is due to a reclassification by the Department of Human Services. Consistent with reporting requirements under A-IFRS, certain employee benefits that were previously classified as current liabilities are now classified as non-current liabilities.
(e) The increase in the unfunded superannuation liability is due to a change in the method of calculating the present value of the underlying obligation under AASB 119.
Statement of Finances 2005-06 Chapter 1 49
Note 19: General government sector entities The following is a list of general government sector entities which have been consolidated for the purposes of the Estimated Financial Statements. For further details on consolidation policy, refer to Note 1 (D) ‘Basis of consolidation’ in the statement of significant accounting policies and forecast assumptions.
General government sector entities Department of Education and Training Adult Community and Further Education Board Adult Multicultural Education Services Centre for Adult Education TAFEs including: Bendigo Regional Institute of TAFE Box Hill Institute of TAFE Central Gippsland Institute of TAFE Chisholm Institute of TAFE Driver Education Centre of Australia Ltd (DECA) East Gippsland Institute of TAFE Gordon Institute of TAFE Goulburn Ovens Institute of TAFE Holmesglen Institute of TAFE Institute of Land and Food Resources (TAFE Division) International Fibre Centre Limited Kangan Batman Institute of TAFE Northern Melbourne Institute of TAFE Royal Melbourne Institute of Technology (TAFE Division) South West Institute of TAFE Sunraysia Institute of TAFE Swinburne University of Technology (TAFE Division) University of Ballarat (TAFE Division) Victoria University of Technology (TAFE Division) William Angliss Institute of TAFE Wodonga Institute of TAFE Victorian Curriculum and Assessment Authority Victorian Institute of Teaching Victorian Learning and Employment Skills Commission Victorian Qualifications Authority Department of Human Services Health Purchasing Victoria Hospitals, Health and Ambulance Services including: Alexandra District Ambulance Service Alexandra District Hospital Alpine Health Ambulance Service Victoria Metropolitan Region Austin Health Bairnsdale Regional Health Service Ballarat Health Services Barwon Health Bass Coast Regional Health
50 Chapter 1 Statement of Finances 2005-06
General government sector entities (continued) Bayside Health Beaufort and Skipton Health Service Beechworth Health Service Benalla and District Memorial Hospital Bendigo Health Care Group Boort District Hospital Casterton Memorial Hospital Central Gippsland Health Service Cobram District Hospital Cohuna District Hospital Colac Area Health Coleraine and District Health Services Dental Health Services Victoria Djerriwarrh Health Services Dunmunkle Health Services East Grampians Health Service East Wimmera Health Service Eastern Health Echuca Regional Health Edenhope and District Memorial Hospital Gippsland Southern Health Service Goulburn Valley Health Hepburn Health Service Hesse Rural Health Service Heywood Rural Health Inglewood and District Health Service Kerang and District Hospital Kilmore and District Hospital Kooweerup Regional Health Service Kyabram and District Health Services Kyneton District Health Service Latrobe Regional Hospital Lorne Community Hospital Maldon Hospital Mallee Track Health and Community Services Manangatang and District Hospital Mansfield District Hospital Maryborough District Health Service McIvor Health and Community Services Melbourne Health Moyne Health Services Mt Alexander Hospital Nathalia District Hospital Northeast Health Wangaratta Northern Health Numurkah District Health Service Omeo District Health Orbost Regional Health Otway Health and Community Services Peninsula Health
Statement of Finances 2005-06 Chapter 1 51
General government sector entities (continued) Peter MacCallum Cancer Institute Portland District Health Robinvale District Health Services Rochester and Elmore District Health Service Rural Ambulance Victoria Rural Northwest Health Seymour District Memorial Hospital South Gippsland Hospital South West Healthcare Southern Health Stawell Regional Health Swan Hill District Hospital Tallangatta Health Service Terang and Mortlake Health Service The Queen Elizabeth Centre The Royal Children's Hospital The Royal Victorian Eye and Ear Hospital The Royal Women's Hospital Timboon and District Health Care Service Tweddle Child and Family Health Service Upper Murray Health and Community Services Victorian Institute of Forensic Mental Health West Gippsland Health Care Group West Wimmera Health Service Western District Health Service Western Health Wimmera Health Care Group Wodonga Regional Health Service Yarram and District Health Service Yarrawonga District Health Service Yea and District Memorial Hospital Infertility Treatment Authority Mental Health Review Board Psychosurgery Review Board Registration Boards including: Chinese Medicine Registration Board of Victoria Chiropractors Registration Board of Victoria Dental Practice Board of Victoria Medical Practitioners Board of Victoria Nurses Board of Victoria Optometrists Registration Board of Victoria Osteopaths Registration Board of Victoria Pharmacy Board of Victoria Physiotherapists Registration Board of Victoria Podiatrists Registration Board of Victoria Psychologists Registration Board of Victoria Victorian Health Promotion Foundation Victorian Relief Committee
52 Chapter 1 Statement of Finances 2005-06
General government sector entities (continued) Department of Infrastructure Energy Safe Victoria Roads Corporation Southern and Eastern Integrated Transport Authority (SEITA) Spencer Street Station Authority Department of Innovation Industry and Regional Development Prince Henry’s Institute of Medical Research Regional Development Victoria Tourism Victoria Department of Justice Country Fire Authority Domestic Building (HIH) Indemnity Fund Emergency Communications Victoria Equal Opportunity Commission Judicial College of Victoria Legal Practice Board Liquor Licensing Panel Metropolitan Fire and Emergency Services Board Office of Public Prosecutions Office of the Legal Ombudsman Office of the Public Advocate Office of the Victorian Privacy Commissioner Sentencing Advisory Council Victoria Legal Aid Victoria Police (Office of the Chief Commissioner of Police) Victorian Commission for Gambling Regulation Victorian Electoral Commission Victorian Institute of Forensic Medicine Victorian Law Reform Commission Department of Premier and Cabinet Australian Centre for the Moving Image Film Victoria Library Board of Victoria Museums Board of Victoria National Gallery of Victoria, Council of Trustees Office of the Ombudsman State Services Authority (incorporates former Office of Public Employment) Department of Primary Industries Veterinary Practitioners Registration Board of Victoria Department of Sustainability and Environment Architects Registration Board of Victoria Building Commission Catchment Management Authorities including: Corangamite Catchment Management Authority East Gippsland Catchment Management Authority
Statement of Finances 2005-06 Chapter 1 53
General government sector entities (continued) Glenelg Hopkins Catchment Management Authority Goulburn Broken Catchment Management Authority Mallee Catchment Management Authority North Central Catchment Management Authority North East Catchment Management Authority Port Phillip and Westernport Catchment Management Authority West Gippsland Catchment Management Authority Wimmera Catchment Management Authority EcoRecycle Victoria Environment Protection Authority Heritage Council Office of the Commissioner for Environmental Sustainability Parks Victoria Plumbing Industry Commission Royal Botanic Gardens Board Surveyors Registration Board of Victoria (formerly Surveyors Board) Trust for Nature (Victoria) Department of Treasury and Finance Essential Services Commission Victorian Competition and Efficiency Commission Department for Victorian Communities 2007 World Swimming Championship Corporation Shrine of Remembrance Trustees (formerly under DSE) Victorian Institute of Sport Limited Victorian Institute of Sport Trust Parliament of Victoria Victorian Auditor-General's Office
54 Chapter 1 Statement of Finances 2005-06
Statement of Finances 2005-06 Chapter 2 55
CHAPTER 2 – DEPARTMENTAL FINANCIAL STATEMENTS
This chapter provides estimated financial reports for each department under Australian equivalents to International Financial Reporting Standards (A-IFRS). The total resources made available to a department are applied to three uses:
• the provision of outputs;
• asset investment; or
• payments on behalf of the State.
The following tables can be used to assess each department’s estimated financial performance and use of resources.
• operating statement – provides details of the department’s controlled income and expenses on an accrual basis reflecting the cost of providing its outputs;
• statement of cash flows – shows all movements of cash (cash received and paid). The cash impact of financing and investing activities on departmental resources is highlighted in this statement;
• balance sheet – shows all controlled assets and liabilities of the department. The difference between these represents the net assets position, which is an indicator of the State’s equity in the department; and
• administered items statement – provides details of the department’s administered income and expenses, and its administered assets and liabilities.
Consistent with the consolidated financial reports for the general government sector provided in Chapter 1, these estimated departmental financial statements have been prepared based on an A-IFRS basis. There are no Australian Accounting Standards (AAS) for prospective reporting by government entities, so as far as it is possible, the primary statements have been prepared consistent with AAS 29, which prescribes the form and content of general purpose financial reports of government departments. For the purposes of this budget paper, the statements have also been divided into controlled and administered items. Administered items refer to those resources over which a department cannot exercise direct control. Authority is provided through an appropriation for payments made on behalf of the State. Under the AAS 29 standard, these items would normally appear as notes to the financial statements.
56 Chapter 2 Statement of Finances 2005-06
In addition to the aforementioned statements, this chapter contains tables detailing the restatement of the balance sheet opening balance from an existing AAS basis to A-IFRS as at 1 July 2004 for controlled and administered items. The notes accompanying these tables explain the impact of transition.
Actual departmental results based on existing AAS are presented in Appendix C, Departmental Financial Statements – Revised Estimates 2004-05. The revised 2004-05 statements provide a comparison between 2003-04 actual results and the 2004-05 Budget and revised estimates under existing AAS. These statements are not comparable to the estimated financial statements under A-IFRS in this chapter.
Statement of Finances 2005-06 Education and Training 57
DEPARTMENT OF EDUCATION AND TRAINING
Operating performance The Department of Education and Training (DE&T) is estimated to have an operating surplus of $107 million for 2005-06, which is in line with the 2004-05 revised operating surplus. This is primarily generated in the schools and TAFE sectors, where state and Commonwealth funding for capital and locally raised funds are received as income in the operating statement but applied to capital expenditure (shown as an asset in the balance sheet), therefore appearing as an operating surplus.
The operating statement shows an increase in total operating income of $288 million (or 3.9 per cent) between the 2004-05 revised budget and the 2005-06 Budget. This is primarily a result of:
• funding for new initiatives announced in the 2005-06 Budget, such as increased equity funding, additional cleaning costs for schools, increased support to non-government schools and a fibre-optic data communication network connecting all government schools;
• the flow-through effect of funding for initiatives approved in previous budgets (which will have further impact in 2005-06), including the appointment of additional teachers to develop areas of specialisation, and completion bonuses for apprenticeships and trainees;
• the flow-through effect of supplementation to meet the employment costs of various enterprise bargaining outcomes (including the schools and TAFE sectors); and
• general inflation-related indexation.
Total operating expenses for DE&T in 2005-06 are budgeted to increase by $292 million (or 4.0 per cent) between the 2004-05 revised budget and the 2005-06 Budget. This expenditure reflects the application of the increased income discussed above.
Investment and financing The increased capital investment in both schools and TAFE institutes is to continually improve and add to the education infrastructure base. This investment reflects DE&T’s continuing focus on facilities to support education outcomes in line with election commitments. Increased investment reflected in the 2005-06 Budget includes:
• the modernisation of existing schools, replacement and building of new schools, classroom replacement, providing specialist facilities in secondary schools and the upgrade of teaching equipment in TAFE institutes;
58 Education and Training Statement of Finances 2005-06
• further investment in Information Technology infrastructure aimed at providing an enhanced data communication network to all government schools to improve internet access for students and the provision of more computers to government school students; and
• the consolidation of the Victorian Curriculum and Assessment Authority’s corporate leases through the modernisation of an existing building.
Commonwealth funding has also enabled increased investment in assets for the education sector.
Balance sheet performance The increase in investment discussed above has been a major contributing factor in DE&T’s net asset position which is expected to improve by $282 million, reflecting a projected increase in total assets of $332 million offset by an increase in total liabilities of $50 million.
The expected change in total liabilities reflects increases in long service leave for staff employed in the education sector arising from 2005-06 wage increases and underlying growth in years of service. Under government funding processes, this growth is also reflected in non-current receivables for the department, thus creating an increase in total assets.
Most of the $332 million increase in total assets can be attributed to an increase in property, plant and equipment, reflecting increased investment as outlined above.
Statement of administered items This statement primarily comprises grants received from the Commonwealth for government schools and grants for on-passing to non-government schools.
Total administered income is projected to increase by $127 million from the 2004-05 revised budget to the 2005-06 Budget, largely due to increased grants for government and non-government schools from the Commonwealth.
Total administered expenses are expected to increase in line with the anticipated increase in the administered income.
Statement of Finances 2005-06 Education and Training 59
Table 2.1.1: Operating statement ($ million)
2004-05 2005-06 Revised (a) Budget (a)
Income Output appropriations 6 248.9 6 515.2 Special appropriations 0.3 0.3 Resources received free of charge or for nominal consideration 0.7 0.7 Sale of goods and services 527.2 537.7 Commonwealth grants 270.8 274.8 Revenue from other parties and other income 306.6 313.8 7 354.5 7 642.5 Expenses Employee benefits 4 248.3 4 438.1 Depreciation and amortisation 285.7 302.5 Grants and other payments 590.2 612.5 Capital asset charge 762.9 801.2 Supplies and services 1 354.8 1 379.8 Financing costs 1.0 1.0 7 242.9 7 535.1 Net result for the reporting period 111.6 107.3 Net increase in asset revaluation reserve .. .. Total changes in equity other than those resulting from
transactions with the State in its capacity as owner 111.6 107.3
Source: Departments of Education and Training and Treasury and Finance
Note: (a) Presentation of 2004-05 revised estimates and 2005-06 Budget is based on A-IFRS. For the
presentation of 2003-04 actual results and 2004-05 Budget and revised estimates based on existing Australian Accounting Standards, refer to Appendix C.
60 Education and Training Statement of Finances 2005-06
Table 2.1.2: Statement of cash flows ($ million)
2004-05 2005-06 Revised Budget Cash flows from operating activities Receipts from Government 6 404.9 6 662.5Receipts from other entities 524.3 534.9Payments for supplies, grants and employees (6 156.4) (6 379.8) 772.7 817.6Interest received 30.0 31.9Capital asset charge ( 762.9) ( 801.2)Financing costs expense ( 1.0) ( 1.0)Other receipts 298.0 303.4Net cash inflow from operating activities 336.8 350.7 Cash flows from investing activities Payments for property, plant and equipment ( 437.4) ( 555.7)Proceeds from sale of property, plant and equipment 2.3 2.4Net cash (outflow) from investing activities ( 435.1) ( 553.3) Cash flows from financing activities Net proceeds from capital contribution by State Government 73.6 174.6Net proceeds from borrowings 2.0 ..Net cash inflows/(outflow) from financing activities 75.7 174.6Net increase/(decrease) in cash held ( 22.6) ( 28.1)Cash at the beginning of the financial year 520.8 498.1Cash at the end of the financial year (a) 498.1 470.0Source: Departments of Education and Training and Treasury and Finance
Note: (a) There is a difference of $2 million between cash assets in the balance sheet and cash at the end of
the financial year in the statement of cash flows. This is because the cash assets in the balance sheet does not include a payable item of $2 million, which is instead classified in the payables category.
Statement of Finances 2005-06 Education and Training 61
Table 2.1.3: Balance sheet ($ million)
Estimated as at 30 June (a)(b) 2005 2006 Revised Budget Current assets Cash assets (c) 495.9 467.8 Other financial assets 164.1 164.1 Receivables 76.0 76.1 Inventories 9.4 9.4 Prepayments 19.6 19.8 Assets held for sale 10.1 10.1 Other 1.1 1.1 Total current assets 776.2 748.3 Non-current assets Receivables 497.5 625.2 Other financial assets 12.8 12.8 Property, plant and equipment 9 740.2 9 972.1 Intangible assets 0.5 0.5 Other 11.8 11.8 Total non-current assets 10 262.8 10 622.5 Total assets 11 038.9 11 370.8 Current liabilities Payables 211.5 213.3 Interest-bearing liabilities 0.5 0.5 Employee provisions 242.8 251.6 Other 78.3 78.3 Total current liabilities 533.1 543.6 Non-current liabilities Interest-bearing liabilities 4.7 4.7 Employee provisions 836.7 876.0 Amounts owing to other departments 0.3 0.3 Total non-current liabilities 841.7 881.1 Total liabilities 1 374.8 1 424.7 Net assets 9 664.1 9 946.0 Equity Contributed capital 5 246.1 5 420.7 Reserves 4 265.3 4 265.3 Accumulated surplus 152.8 260.1 Total equity 9 664.1 9 946.0 Source: Departments of Education and Training and Treasury and Finance
Notes: (a) Presentation of 2005-06 Budget is based on A-IFRS after restating the opening balances as at
1 July 2004. See Table 2.1.6 for details of the restated amounts. (b) Actual results for 2003-04 and 2004-05 Budget and revised estimates prior to restatement to
A-IFRS are included in Appendix C. (c) There is a difference of $2 million between cash assets in the balance sheet and cash at the end of
the financial year in the statement of cash flows. This is because the cash assets in the balance sheet does not include a payable item of $2 million, which is instead classified in the payables category.
62 Education and Training Statement of Finances 2005-06
Administered income Sale of goods and services 1.7 1.5Commonwealth grants 1 878.7 2 008.4Other 12.4 9.9Total administered income 1 892.7 2 019.8 Administered expenses Grants and other payments 1 343.9 1 438.2Payments into the Consolidated Fund 548.7 581.5Total administered expenses 1 892.6 2 019.8Income less expenses 0.1 0.1 Administered assets Cash assets 0.4 0.5Receivables 16.4 16.4Other financial assets 1.3 1.3Prepayments 3.2 3.2Property, plant and equipment 10.9 10.9Total administered assets 32.2 32.2 Administered liabilities Payables 0.1 0.1Other 3.2 3.2Total administered liabilities 3.3 3.3Source: Departments of Education and Training and Treasury and Finance
Note: (a) Presentation of 2005-06 Budget is based on A-IFRS after restating the opening balances as at
1 July 2004. See Table 2.1.7 for details of restated amounts.
Statement of Finances 2005-06 Education and Training 63
Authority for resources This section provides a summary of the sources of Parliamentary authority available to the Department to fund the provision of outputs and additions to the net asset base.
Table 2.1.5: Parliamentary authority for resources ($ million)
2004-05 2005-06 Revised Budget Annual appropriations 6 132.0 6 522.4 Receipts credited to appropriations 160.4 163.1 Unapplied previous years appropriation 27.2 4.2 Gross annual appropriation 6 319.6 6 689.8 Special appropriations 0.3 0.3 Trust funds 1 686.9 1 779.8 Total Parliamentary authority 8 006.7 8 469.8 Source: Departments of Education and Training and Treasury and Finance
64 Education and Training Statement of Finances 2005-06
Table 2.1.6: Reconciliation of equity at 1 July 2004 ($ million)
(a) Assets held for sale .. 10.1 10.1 Other 1.1 .. 1.1 Total current assets 790.7 10.1 800.8 Non-current assets Receivables 382.3 .. 382.3 Other financial assets 12.8 .. 12.8
(b) Property, plant and equipment 10 453.1 ( 843.7) 9 609.4 Intangible assets 0.5 .. 0.5 Other 11.8 .. 11.8 Total non-current assets 10 860.5 ( 843.7) 10 016.8 Total assets 11 651.3 ( 833.6) 10 817.7 Current liabilities Payables 209.7 .. 209.7 Interest-bearing liabilities 0.7 .. 0.7 Employee provisions 234.0 .. 234.0 Other 78.3 .. 78.3 Total current liabilities 522.8 .. 522.8 Non-current liabilities Interest-bearing liabilities 4.7 .. 4.7 Employee provisions 811.0 .. 811.0 Amounts owing to other departments 0.3 .. 0.3 Total non-current liabilities 816.0 .. 816.0 Total liabilities 1 338.8 .. 1 338.8 Net assets 10 312.5 ( 833.6) 9 478.9 Equity
Total equity 10 312.5 ( 833.6) 9 478.9Source: Departments of Education and Training and Treasury and Finance
Notes on the reconciliation of equity at 1 July 2004: (a) Certain property, plant and equipment has been classified as assets held for sale under A-IFRS
and is carried at fair value. (b) Consistent with the A-IFRS concept of asset impairment, the value of school building has been
reduced by $814 million. In this context, ‘impairment’ represents the current level of over-supply of some school buildings due to demographic population shifts. The balance covers the correction to the carrying value of capitalised software ($20 million) and the offset for assets held for sale (See note (a)).
(c) Represents a correction to the disclosure of consolidated TAFE equity balances in line with individual TAFE institute accounts.
(d) Represents the impact on accumulated surplus of the adjustments identified in Notes (b) and (c).
Statement of Finances 2005-06 Education and Training 65
Table 2.1.7: Reconciliation of administered items at 1 July 2004 ($ million)
Source: Departments of Education and Training and Treasury and Finance
66 Human Services Statement of Finances 2005-06
DEPARTMENT OF HUMAN SERVICES
Operating performance The Department of Human Services (DHS) is expected to have an operating surplus of $27 million in 2005-06.
The operating statement shows an increase in income of $601 million from the 2004-05 revised budget to the 2005-06 Budget. These increases are largely due to:
• funding provided for government policy commitments ($210 million) including initiatives such as the Hospital Futures, Putting Children First, disability services, mental health, ambulance services, concessions and home and community care growth and the flow through effect of initiatives announced in previous budgets;
• output price increases arising from Australian Industrial Relations Commission decisions and enterprise bargaining agreements across a range of DHS outputs and price escalation ($277 million) for anticipated cost increases in 2005-06; and
• output price increases ($78 million) for depreciation, amortisation and capital asset charge associated with the approved asset investment program for 2005-06 and the impact of fixed asset revaluations; but
• offset by a reduction in income associated with one-off income received in 2004-05 in recognition of a shortfall in gaming income ($107 million).
Other income increases ($70 million) relate to increased Commonwealth payments due to the expansion of a number of programs (including highly specialised drugs, home and community care, the Department of Veteran Affairs, and the Pharmaceutical Benefits Scheme), expansion of Transport Accident Commission programs and increases in income from the sale of goods and services to other parties.
Operating expenses are budgeted to increase by $670 million between the 2004-05 revised budget and 2005-06 Budget and flow from the increases in income outlined above.
Investment and financing Cashflows from operating activities are consistent with the trends discussed in the operating performance above.
Cashflows from investing activities include payments for property, plant and equipment (totalling $774 million) reflecting the continued asset investment in the Department and hospitals, and include new initiatives to expand service capacity, enhance infrastructure and comply with regulatory requirements.
Statement of Finances 2005-06 Human Services 67
Balance sheet performance DHS’s net asset position is expected to improve by $434 million between the 2004-05 revised budget and the 2005-06 Budget, reflecting an increase in total assets of $539 million and an increase in total liabilities of $105 million.
The expected increase in assets reflects the State Government’s commitment to build new health and community facilities and other infrastructure across the State, based on modern service models and needs for the future. The movement in assets from the 2004-05 revised budget to the 2005-06 Budget reflects funding provided for the Royal Children’s Hospital, super clinics, renewal of disability shared supported accommodation, metropolitan food services redevelopment and Northern Hospital redevelopment.
The expected increase in liabilities is primarily a result of increased long service leave entitlements for staff employed in the human services sector. Under the funding arrangements, a corresponding asset matches this item.
Statement of administered items This statement includes items from the Commonwealth Government and income from the sale of goods and services collected by the Department. Total income has increased by $107 million from the 2004-05 revised budget to the 2005-06 Budget, due mainly to increased funds provided under the Australian Health Care Agreement where funds are escalated to take account of population and demand growth and cost indexation.
68 Human Services Statement of Finances 2005-06
Table 2.2.1: Operating statement ($ million)
2004-05 2005-06 Revised (a) Budget (a)
Income Output appropriations 8 541.4 9 062.3Special appropriations 1 059.1 1 112.0Sale of goods and services 900.4 931.5Commonwealth grants 85.5 97.2Revenue from other parties and other income 272.8 257.3 10 859.3 11 460.3Expenses Employee benefits 5 084.2 5 400.1Depreciation and amortisation 275.8 310.5Resources provided free of charge or for nominal consideration 0.7 ..Grants and other payments 744.5 793.9Capital asset charge 427.4 482.8Supplies and services 4 230.3 4 444.1Financing costs 0.4 1.8 10 763.3 11 433.2Net result for the reporting period 96.0 27.2Net increase in asset revaluation reserve .. ..Total changes in equity other than those resulting from
transactions with the State in its capacity as owner 96.0 27.2
Source: Departments of Human Services and Treasury and Finance
Note: (a) Presentation of 2004-05 revised estimates and 2005-06 Budget is based on A-IFRS. For the
presentation of 2003-04 actual results and 2004-05 Budget and revised estimates based on existing Australian Accounting Standards, refer to Appendix C.
Statement of Finances 2005-06 Human Services 69
Table 2.2.2: Statement of cash flows ($ million)
2004-05 2005-06 Revised Budget Cash flows from operating activities Receipts from Government 9 615.8 10 197.6 Receipts from other entities 931.0 945.8 Payments for supplies, grants and employees (9 888.4) (10 503.0) 658.4 640.4 Interest received 35.0 35.0 Capital asset charge ( 427.4) ( 482.8) Financing costs expense ( 0.4) ( 1.8) Other receipts 148.7 154.5 Net cash inflow from operating activities 414.3 345.3 Cash flows from investing activities Payments for property, plant and equipment ( 698.6) ( 773.7) Proceeds from sale of property, plant and equipment 40.0 40.0 (Repayment of) loans by other entities .. 15.3 Net cash (outflow) from investing activities ( 658.6) ( 718.4) Cash flows from financing activities Net proceeds from capital contribution by State Government 158.2 365.8 Net proceeds from borrowings 89.4 11.3 Net cash inflows/(outflow) from financing activities 247.7 377.1 Net increase/(decrease) in cash held 3.3 4.0 Cash at the beginning of the financial year 334.3 337.6 Cash at the end of the financial year 337.6 341.7 Source: Departments of Human Services and Treasury and Finance
70 Human Services Statement of Finances 2005-06
Table 2.2.3: Balance sheet ($ million)
Estimated as at 30 June (a)(b)
2005 2006 Revised Budget Current assets Cash assets 337.6 341.7 Other financial assets 368.8 368.8 Receivables 304.1 361.4 Inventories 49.7 49.7 Prepayments 15.9 15.9 Assets held for sale 18.3 18.3Total current assets 1 094.4 1 155.7Non-current assets Receivables 493.4 551.9 Other financial assets 115.9 115.9 Property, plant and equipment 5 573.3 5 992.8 Intangible assets 32.1 32.1 Other 8.0 8.0Total non-current assets 6 222.7 6 700.7Total assets 7 317.1 7 856.4Current liabilities Payables 651.7 667.5 Interest-bearing liabilities 13.8 17.4 Employee provisions 459.4 469.3 Other 186.0 190.5Total current liabilities 1 310.9 1 344.7Non-current liabilities Interest-bearing liabilities 105.9 113.6 Employee provisions 751.9 815.7 Amounts owing to other departments 4.0 4.0 Other 401.6 401.6Total non-current liabilities 1 263.4 1 334.9Total liabilities 2 574.3 2 679.6Net assets 4 742.8 5 176.8Equity Contributed capital 3 934.9 4 341.7 Reserves 1 057.0 1 057.0 Accumulated deficit ( 249.0) ( 221.9)Total equity 4 742.8 5 176.8Source: Departments of Human Services and Treasury and Finance
Notes: (a) Presentation of 2005-06 Budget is based on A-IFRS after restating the opening balances as at
1 July 2004. See Table 2.2.6 for details of the restated amounts. (b) Actual results for 2003-04 and 2004-05 Budget and revised estimates prior to restatement to
Administered income Sale of goods and services 255.3 273.0 Commonwealth grants 2 778.6 2 867.7 Fees 2.9 3.0 Other 3.8 3.8 Total administered income 3 040.6 3 147.4 Administered expenses Payments into the Consolidated Fund 3 040.6 3 147.4 Total administered expenses 3 040.6 3 147.4 Income less expenses .. .. Administered assets Cash assets 0.4 0.4 Receivables 11.0 11.0 Other financial assets 0.6 0.6 Other 103.0 103.0 Total administered assets 114.9 114.9 Administered liabilities Payables 1.6 1.6 Other 106.9 106.9 Total administered liabilities 108.5 108.5 Source: Departments of Human Services and Treasury and Finance
Note: (a) Presentation of 2005-06 Budget is based on A-IFRS after restating the opening balances as at
1 July 2004. See Table 2.2.7 for details of restated amounts.
72 Human Services Statement of Finances 2005-06
Authority for resources This section provides a summary of the sources of Parliamentary authority available to the Department to fund the provision of outputs and additions to the net asset base.
Table 2.2.5: Parliamentary authority for resources ($ million)
2004-05 2005-06 Revised Budget Annual appropriations 7 759.5 8 355.1Receipts credited to appropriations 1 051.1 1 085.0Unapplied previous years appropriation 52.8 104.5Accumulated surplus - previously applied appropriation 7.6 ..Gross annual appropriation 8 871.1 9 544.6Special appropriations 1 062.8 1 112.0Trust funds 62.6 47.1Total Parliamentary authority 9 996.4 10 703.6Source: Departments of Human Services and Treasury and Finance
Statement of Finances 2005-06 Human Services 73
Table 2.2.6: Reconciliation of equity at 1 July 2004 ($ million)
(a) Assets held for sale 6.5 11.8 18.3 Total current assets 1 017.0 11.8 1 028.8 Non-current assets Receivables 423.2 .. 423.2 Other financial assets 115.9 .. 115.9
Source: Departments of Human Services and Treasury and Finance Notes on the reconciliation of equity at 1 July 2004: (a) Certain property, plant and equipment has been classified as assets held for sale under A-IFRS
and are carried at fair value. (b) Some property, plant and equipment has been deemed to be impaired by $4 million and the
resultant losses taken to accumulated funds. A further $12 million has been classified as held for sale and $4 million as intangible assets.
(c) Certain property, plant and equipment has been classified as intangible assets under A-IFRS, whilst $1.2 million of previously revalued intangible assets not being recognised under A-IFRS and the resultant losses taken to reserves.
(d) These provisions were classified as non-current liabilities. (e) These provisions increased due to the re-classification of current employee provisions above. (f) The net increase in accumulated deficit is a result of an increase in employee provisions, a loss on
the impairment of plant and equipment and other assets not being recognised under A-IFRS.
74 Human Services Statement of Finances 2005-06
Table 2.2.7: Reconciliation of administered items at 1 July 2004 ($ million)
Existing AAS Transition impact A-IFRS Administered assets Cash assets 0.4 .. 0.4 Receivables 11.0 .. 11.0 Other financial assets 0.6 .. 0.6 Other 103.0 .. 103.0 Total administered assets 114.9 .. 114.9 Administered liabilities Payables 1.6 .. 1.6 Other 106.9 .. 106.9 Total administered liabilities 108.5 .. 108.5
Source: Departments of Human Services and Treasury and Finance
Statement of Finances 2005-06 Infrastructure 75
DEPARTMENT OF INFRASTRUCTURE
Operating performance The Department of Infrastructure (DOI) is estimated to have an operating surplus of $313 million in 2005-06. This is primarily due to the funding for Commonwealth roads projects being receipted as operating income but applied for asset investments and income received in 2005-06 to reimburse prior year expenses of VicTrack.
Total operating income is expected to increase by $607 million (19.1 per cent) in 2005-06 compared with the 2004-05 revised budget. This increase is largely the result of:
• additional funding of $126 million from the State Government to meet contracted service payments, primarily in the areas of public transport and road services and prior year initiatives such as the public transport partnership agreements;
• new output initiatives for 2005-06 totalling $29 million including the Safer Roads Infrastructure program, metropolitan bus program, motorists package and Tullamarine–Calder Freeway Interchange project;
• increases in the capital charge relating to investments in rail assets of $179 million reflecting increases in net assets held by VicTrack;
• additional funding of $152 million from the State Government to fund its road network improvement program;
• additional funding from the Commonwealth Government of $52 million for road projects; and
• one-off income of $70 million in 2005-06 to reimburse the tax liability incurred by VicTrack following the transfer to the corporation of rolling stock assets in 2003-04, and the contribution from ConnectEast for public transport improvements.
Operating expenses are estimated to increase by $36 million in 2005-06 (1.0 per cent) between the 2004-05 revised budget and the 2005-06 Budget. This increase has been largely offset by the one-off impact in 2004-05 of the contribution of land and works to ConnectEast for the construction of the EastLink project (formerly the Mitcham-Frankston project) and the transfer of Station Pier and other assets to other government agencies totalling $360 million. After discounting for this, operating expenses are estimated to increase by $396 million (11.5 per cent). The additional expenditure in 2005-06 primarily reflects the increased funding provided for public transport and road services outlined above and the additional capital charge relating to rail assets.
DOI is estimated to have an operating deficit of $258 million in 2004-05 revised budget. The primary reasons for this are the one-off contribution of assets to
76 Infrastructure Statement of Finances 2005-06
ConnectEast and the transfer of assets to other government agencies as outlined above.
Investment and financing Cash flows from operating activities are consistent with the trends discussed above.
The expected investments in new property, plant and equipment in 2005-06 reflect the approved cashflows for existing and new asset initiatives announced in the 2005-06 Budget. New initiatives include the Tullamarine–Calder Freeway Interchange of $63 million, the upgrade of the Calder Highway of $35 million, the outer metropolitan arterial road program of $21 million and the Dandenong Growth Corridor project of $12 million.
Balance sheet performance DOI’s net assets are budgeted to increase by $891 million from the 2004-05 revised budget to the 2005-06 Budget.
Major movements in total assets include an estimated revaluation of road assets of $503 million (approximately 3 per cent movement on a $17.7 billion fixed asset base) plus the impact of the construction of new roads and other infrastructure.
Statement of administered items Transactions administered by DOI on behalf of the State include the collection of road and public transport regulatory fees and fines income.
Total administered income is budgeted to increase in 2005-06 by $61 million from the 2004-05 revised budget. Additional income from vehicle registrations of $37 million and stamp duty on motor vehicle transfers of $34 million is estimated in 2005-06, together with an additional $52 million from the Commonwealth Government for roads projects. Funding for the Electricity Network Tariff Rebate Scheme will increase by $27 million following the Government’s announcement of the extension of the Scheme. These increases have been partly offset by one-off income in 2004-05 following the agreement between Transurban and the State to redeem concession notes held by the State in order to fund the construction of the Tullamarine–Calder Freeway Interchange, and income from external parties.
Administered payments are likewise affected by the items outlined above.
Statement of Finances 2005-06 Infrastructure 77
Table 2.3.1: Operating Statement ($ million)
2004-05 2005-06 Revised (a) Budget (a)
Income Output appropriations 2 778.0 3 312.5 Special appropriations 1.7 1.7 Resources received free of charge or for nominal consideration 5.0 .. Sale of goods and services 148.8 155.3 Taxes (b) 8.7 11.9 Fines and fees (b) 46.6 47.7 Revenue from other parties and other income 187.4 253.7 3 176.2 3 782.8 Expenses Employee benefits 233.8 244.5 Depreciation and amortisation 319.0 336.1 Resources provided free of charge or for nominal consideration 360.3 .. Grants and other payments 914.5 1 149.9 Capital asset charge 67.9 66.4 Supplies and services 1 532.2 1 663.1 Financing costs 5.5 10.0 Other expenses 1.1 .. 3 434.3 3 469.9 Net result for the reporting period ( 258.1) 312.9 Net increase in asset revaluation reserve 488.0 502.7 Total changes in equity other than those resulting from
transactions with the State in its capacity as owner 229.9 815.6
Source: Departments of Infrastructure and Treasury and Finance
Notes: (a) Presentation of 2004-05 revised estimates and 2005-06 Budget is based on A-IFRS. For the
presentation of 2003-04 actual results and 2004-05 Budget and revised estimates based on existing Australian Accounting Standards, refer to Appendix C.
(b) Taxation has been adjusted to exclude motor drivers’ licence fees, police learner and driver fees, and other miscellaneous motor vehicle fees, which are now classified as regulatory fees.
78 Infrastructure Statement of Finances 2005-06
Table 2.3.2: Statement of cash flows ($ million)
2004-05 2005-06 Revised Budget Cash flows from operating activities Receipts from Government 2 780.9 3 314.4Receipts from other entities 337.9 374.3Payments for supplies, grants and employees (2 747.2) (3 030.6) 371.6 658.1Interest received 0.8 0.8Capital asset charge ( 67.9) ( 66.4)Financing costs expense ( 5.5) ( 10.0)Other receipts 50.1 73.7Net cash inflow from operating activities 349.1 656.2 Cash flows from investing activities Payments for property, plant and equipment ( 435.5) ( 661.7)Proceeds from sale of property, plant and equipment 19.4 19.9Net cash (outflow) from investing activities ( 416.1) ( 641.8) Cash flows from financing activities Net proceeds from capital contribution by State Government 61.6 25.5Net proceeds from borrowings .. ( 15.3)Net cash inflows/(outflow) from financing activities 61.6 10.2Net increase/(decrease) in cash held ( 5.3) 24.6Cash at the beginning of the financial year 459.2 453.9Cash at the end of the financial year 453.9 478.5Source: Departments of Infrastructure and Treasury and Finance
Statement of Finances 2005-06 Infrastructure 79
Table 2.3.3: Balance sheet ($ million)
Estimated as at 30 June (a)(b)
2005 2006 Revised Budget Current assets Cash assets 453.9 478.5 Other financial assets 50.0 50.0 Receivables 156.1 156.1 Inventories 2.6 2.6 Prepayments 2.7 2.7 Assets held for sale 9.8 10.8 Total current assets 675.1 700.7 Non-current assets Receivables 244.2 244.0 Property, plant and equipment 17 710.6 18 537.9 Intangible assets 7.3 7.3 Total non-current assets 17 962.0 18 789.1 Total assets 18 637.1 19 489.8 Current liabilities Payables 568.0 546.7 Employee provisions 25.7 25.6 Other 11.7 11.7 Total current liabilities 605.5 584.1 Non-current liabilities Interest-bearing liabilities 15.7 0.4 Employee provisions 53.8 52.3 Other 187.7 187.7 Total non-current liabilities 257.2 240.4 Total liabilities 862.7 824.6 Net assets 17 774.4 18 665.2 Equity Contributed capital 14 801.3 14 876.5 Reserves 3 744.6 4 247.3 Accumulated deficit ( 771.4) ( 458.5) Total equity 17 774.4 18 665.2 Source: Departments of Infrastructure and Treasury and Finance
Notes: (a) Presentation of 2005-06 Budget based on A-IFRS after restating the opening balances as at
1 July 2004. See Table 2.3.7 for details of the restated amounts. (b) Actual results for 2003-04 and 2004-05 Budget and revised estimates prior to restatement to
Administered income Appropriations - Payments made on behalf of the State 9.0 35.9Sale of goods and services 2.8 2.9Commonwealth grants 182.4 234.1Taxes (b) 1 320.0 1 330.9Fines 8.0 8.2Fees (b) 87.5 87.4Other 39.8 10.7Total administered income 1 649.6 1 710.1 Administered expenses Grants and other payments 9.0 35.9Payments into the Consolidated Fund 1 546.8 1 740.6Total administered expenses 1 555.8 1 776.5Income less expenses 93.8 ( 66.3) Administered assets Cash assets 11.0 11.0Receivables 298.7 231.4Total administered assets 309.8 242.5 Administered liabilities Payables 13.1 13.1Other 89.9 89.0Total administered liabilities 103.1 102.1Source: Departments of Infrastructure and Treasury and Finance
Notes: (a) Presentation of 2005-06 Budget is based on A-IFRS after restating the opening balances as at
1 July 2004. See Table 2.3.8 for details of restated amounts. (b) Taxation has been adjusted to exclude motor drivers’ licence fees, police learner and driver fees,
and other miscellaneous motor vehicle fees, which are now classified as regulatory fees.
Statement of Finances 2005-06 Infrastructure 81
Payments on behalf of the State Payments on behalf of the State are payments made by the Department on behalf of the State Government as a whole and do not directly reflect the operations of the Department. They are usually on-passed or administered by the State.
Table 2.3.5: Payments made on behalf of the State
Accounts 2004-05 2005-06 Revised Budget Electricity Network Tariff Rebate 9.0 35.9 Total 9.0 35.9 Source: Departments of Infrastructure and Treasury and Finance
Authority for resources This section provides a summary of the sources of Parliamentary authority available to the Department to fund the provision of outputs and additions to the net asset base.
Table 2.3.6: Parliamentary authority for resources ($ million)
2004-05 2005-06 Revised Budget Annual appropriations 2 940.2 3 440.2 Receipts credited to appropriations 187.4 237.0 Unapplied previous years appropriation 77.6 24.1 Gross annual appropriation 3 205.2 3 701.3 Special appropriations 1.7 1.7 Trust funds 175.9 208.5 Total Parliamentary authority 3 382.9 3 911.5 Source: Departments of Infrastructure and Treasury and Finance
82 Infrastructure Statement of Finances 2005-06
Table 2.3.7: Reconciliation of equity at 1 July 2004 ($ million)
Source: Departments of Infrastructure and Treasury and Finance
84 Innovation, Industry and Regional Development Statement of Finances 2005-06
DEPARTMENT OF INNOVATION, INDUSTRY AND REGIONAL DEVELOPMENT
Operating performance The Department of Innovation, Industry and Regional Development (DIIRD) is expected to achieve a balanced operating net result in 2005-06. The anticipated negative operating net result of $48 million in the 2004-05 revised budget is due to the re-phasing of expenditure in the Regional Infrastructure Development Fund (RIDF).
Total operating income is projected to be $49 million less in the 2005-06 Budget compared to the 2004-05 revised budget as no carryover for the provision of outputs was included in the 2005-06 Budget. This impact however is offset by income received from government appropriations for initiatives such as:
• RIDF; and
• the Energy Technology Innovation Strategy.
Operating expenses movements for DIIRD from the 2004-05 revised budget to the 2005-06 Budget are expected to reflect the changes explained above for operating income.
Investment and financing DIIRD’s investment program contributes to the achievement of the Government’s economic vision of a dynamic, innovative and sustainable economy in which business is encouraged to grow and prosper. Net cash flows from investing activities have fallen by $15 million from the 2004-05 revised budget to the 2005-06 Budget. This is primarily due to a $22 million decrease in funding for the Australian Synchrotron and the city office accommodation projects approved in previous budgets.
Balance sheet performance In 2005-06 DIIRD’s funding for asset initiatives is $141 million including the following initiatives approved in previous budgets:
• the Australian Synchrotron;
• the Melbourne Convention Centre (MCC); and
• the city office accommodation project.
As the Melbourne Convention Centre redevelopment project is intended to be delivered under a Partnerships Victoria model, $97 million of this funding will be effectively transferred to the Melbourne Convention and Exhibition Trust (a public non-financial corporation within the DIIRD portfolio) and thus will not contribute to
Statement of Finances 2005-06 Innovation, Industry and Regional Development 85
an increase in the net asset base of the Department in 2005-06. The remaining funding for asset initiatives is reflected in property, plant and equipment balances.
Statement of administered items Payments into the Consolidated Fund are expected to decrease by $12 million compared with the 2004-05 Budget estimates. This reflects the end of the sale/divestment of surplus land/development rights related to the Melbourne Convention Centre redevelopment project.
Table 2.4.1: Operating statement ($ million)
2004-05 2005-06 Revised (a) Budget (a)
Income Output appropriations 323.5 274.2 Sale of goods and services 1.5 1.5 Revenue from other parties and other income 1.1 1.2 326.1 276.9 Expenses Employee benefits 63.7 65.4 Depreciation and amortisation 3.3 4.9 Grants and other payments 191.5 142.7 Capital asset charge 3.6 3.8 Supplies and services 112.3 60.0 374.4 276.9 Net result for the reporting period ( 48.3) .. Net increase in asset revaluation reserve 3.6 .. Total changes in equity other than those resulting from
transactions with the State in its capacity as owner ( 44.7) ..
Source: Departments of Innovation, Industry and Regional Development and Treasury and Finance
Note: (a) Presentation of 2004-05 revised estimates and 2005-06 Budget is based on A-IFRS. For the
presentation of 2003-04 actual results and 2004-05 Budget and revised estimates based on existing Australian Accounting Standards, refer to Appendix C.
86 Innovation, Industry and Regional Development Statement of Finances 2005-06
Table 2.4.2: Statement of cash flows ($ million)
2004-05 2005-06 Revised Budget Cash flows from operating activities Receipts from Government 312.7 274.4Receipts from other entities 2.6 2.7Payments for supplies, grants and employees ( 367.5) ( 268.2) ( 52.3) 8.9Capital asset charge ( 3.6) ( 3.8)Net cash inflow from operating activities ( 55.8) 5.0 Cash flows from investing activities Payments for property, plant and equipment ( 63.4) ( 48.9)Net cash (outflow) from investing activities ( 63.4) ( 48.9) Cash flows from financing activities Net proceeds from capital contribution by State Government 70.4 44.1Net proceeds from borrowings 0.8 ..Net cash inflows/(outflow) from financing activities 71.2 44.1Net increase/(decrease) in cash held ( 48.0) 0.3Cash at the beginning of the financial year 117.2 69.2Cash at the end of the financial year 69.2 69.4Source: Departments of Innovation, Industry and Regional Development and Treasury and Finance
Statement of Finances 2005-06 Innovation, Industry and Regional Development 87
Table 2.4.3: Balance sheet ($ million)
Estimated as at 30 June (a)(b)
2005 2006 Revised Budget Current assets Cash assets 69.2 69.4 Receivables 8.5 8.5 Prepayments 0.7 0.7 Total current assets 78.3 78.6 Non-current assets Receivables 37.6 37.4 Other financial assets 0.1 0.1 Property, plant and equipment 131.8 175.9 Total non-current assets 169.5 213.4 Total assets 247.8 292.0 Current liabilities Payables 20.3 20.3 Interest-bearing liabilities 1.2 1.2 Employee provisions 7.7 7.7 Other 0.4 0.4 Total current liabilities 29.6 29.6 Non-current liabilities Employee provisions 11.4 11.4 Total non-current liabilities 11.4 11.4 Total liabilities 41.0 41.0 Net assets 206.8 250.9 Equity Contributed capital 139.3 183.5 Reserves 4.0 4.0 Accumulated surplus 63.5 63.5 Total equity 206.8 250.9 Source: Departments of Innovation, Industry and Regional Development and Treasury and Finance
Notes: (a) Presentation of 2005-06 Budget is based on A-IFRS after restating the opening balances as at
1 July 2004. See Table 2.4.6 for details of the restated amounts. (b) Actual results for 2003-04 and 2004-05 Budget and revised estimates prior to restatement to
A-IFRS are included in Appendix C.
88 Innovation, Industry and Regional Development Statement of Finances 2005-06
Administered income Commonwealth grants 0.2 5.1Fines 0.2 0.2Fees 2.2 2.2Other 0.3 0.3Total administered income 2.7 7.7 Administered expenses Expenses on behalf of the State 0.1 0.1Payments into the Consolidated Fund 19.3 7.6Total administered expenses 19.3 7.7Income less expenses ( 16.6) .. Administered assets Cash assets ( 0.1) ( 0.1)Receivables 47.1 47.1Total administered assets 47.0 47.0 Administered liabilities Total administered liabilities .. ..Source: Departments of Innovation, Industry and Regional Development and Treasury and Finance
Note: (a) Presentation of 2005-06 Budget is based on A-IFRS after restating the opening balances as at
1 July 2004. See Table 2.4.7 for details of restated amounts.
Authority for resources This section provides a summary of the sources of Parliamentary authority available to the Department to fund the provision of outputs and additions to the net asset base.
Table 2.4.5: Parliamentary authority for resources ($ million)
2004-05 2005-06 Revised Budget Annual appropriations 365.3 414.8Receipts credited to appropriations 0.2 0.1Unapplied previous years appropriation 54.3 ..Gross annual appropriation 419.7 414.9Trust funds 1.1 1.2Total Parliamentary authority 420.8 416.1Source: Departments of Innovation, Industry and Regional Development and Treasury and Finance
Statement of Finances 2005-06 Innovation, Industry and Regional Development 89
Table 2.4.6: Reconciliation of equity at 1 July 2004 ($ million)
Existing AAS Transition impact A-IFRS Current assets Cash assets 117.2 .. 117.2 Receivables 8.5 .. 8.5 Prepayments 0.7 .. 0.7 Total current assets 126.4 .. 126.4 Non-current assets Receivables 26.7 .. 26.7 Other financial assets 0.1 .. 0.1 Property, plant and equipment 68.1 .. 68.1 Total non-current assets 94.9 .. 94.9 Total assets 221.3 .. 221.3 Current liabilities Payables 20.3 .. 20.3 Interest-bearing liabilities 0.4 .. 0.4 Employee provisions 7.7 .. 7.7 Other 0.4 .. 0.4 Total current liabilities 28.8 .. 28.8 Non-current liabilities Employee provisions 11.4 .. 11.4 Total non-current liabilities 11.4 .. 11.4 Total liabilities 40.2 .. 40.2 Net assets 181.1 .. 181.1 Equity Contributed capital 68.9 .. 68.9 Reserves 0.4 .. 0.4 Accumulated surplus 111.8 .. 111.8 Total equity 181.1 .. 181.1
Source: Departments of Innovation, Industry and Regional Development and Treasury and Finance
90 Innovation, Industry and Regional Development Statement of Finances 2005-06
Table 2.4.7: Reconciliation of administered items at 1 July 2004 ($ million)
Existing AAS Transition impact A-IFRS Administered assets Cash assets ( 0.1) .. ( 0.1) Receivables 47.1 .. 47.1 Total administered assets 47.0 .. 47.0 Administered liabilities Total administered liabilities .. .. ..Source: Departments of Innovation, Industry and Regional Development and Treasury and Finance
Statement of Finances 2005-06 Justice 91
DEPARTMENT OF JUSTICE
Operating performance The Department of Justice (DOJ) is estimated to achieve a 2005-06 operating surplus of $28 million, an increase of $7 million on the 2004-05 revised budget. Once again, the major influence on the operating performance is the continuing strength of industry-based trust account income that forms a significant funding source for consumer protection services.
The operating statement shows an increase in total estimated 2005-06 operating income of $325 million (or 13.6 per cent) compared to the 2004-05 revised budget. This is largely attributable to increased output appropriation funding of $280 million for existing and new output initiatives. Expenses are estimated to increase by an equivalent amount.
Major initiatives announced in the 2005-06 Budget that contribute to the increase in output appropriation in 2005-06 are:
• $9 million to commence implementation of the Putting Children First – an initiative promoting child-safe workplaces;
• $6 million to commence implementation of the Justice Statement initiatives;
• $5 million in additional resourcing for the Office of Public Prosecutions;
• $5 million to enhance Victoria Police’s capacity to fight organised crime;
• $4 million to increase the maritime security capability at Victorian ports;
• $3 million to establish and meet the ongoing costs of the Special Investigations Monitor and the Chief Examiner appointed under the Major Crime (Special Investigations Monitor) Act 2004; and
• $21 million for other 2005-06 Budget initiatives.
The balance of the increase relates to:
• the continued implementation of initiatives announced in previous budgets. These include the expansion of the State’s prison capacity (with two new prisons commencing in 2005-06) and the delivery of the Government’s commitment for an additional 600 police during its current term of office; and
• output price increases arising from enterprise bargaining outcomes, price escalation under the departmental funding model and expected carryover of 2004-05 outputs into 2005-06.
92 Justice Statement of Finances 2005-06
Investment and financing Investment activities for the 2005-06 year are budgeted at $227 million. This predominantly relates to the approved asset investment program. New asset investments for 2005-06 are highlighted in the following section. The investing activity is financed principally by a net cash inflow from operations of $113 million and a capital contribution from the State Government of $106 million. The increase in financing costs and interest-bearing liabilities represents the cost of two new public prisons developed under Partnerships Victoria.
Balance sheet performance DOJ’s net asset position in 2005-06 is estimated to improve by $133 million (or 9.9 per cent) on the 2004-05 revised budget. The increased net asset position is reflected in an estimated increase in total assets of $374 million, which is partially offset by the estimated increase in total liabilities of $240 million.
The increase in total assets mainly reflects:
• an increase in current assets of $30 million, mainly comprising of an increase in term deposits with Treasury Corporation Victoria of $29 million for the Victorian Property Fund (formerly the Estate Agents Guarantee Trust Account); and
• increases in property, plant and equipment of $321 million for new and existing assets, including the two new public prisons developed under Partnerships Victoria.
New asset investment initiatives for 2005-06 include:
• funding for a number of metropolitan and major regional centre police stations;
• continuation of the rural police stations replacement program (stages 8 and 9);
• Neighbourhood Justice Centre;
• the Integrated Courts Management System; and
• Melbourne Legal Precinct Master Plan.
The balance of the estimated increase in property, plant and equipment reflects the continued delivery of asset initiatives approved and commenced in prior financial years.
The increase in interest-bearing liabilities, both current and non-current, represents the financing of two new public prisons developed under Partnerships Victoria.
Statement of Finances 2005-06 Justice 93
Statement of administered items The major movement on the administered items statement for DOJ is an anticipated increase in income of $183 million from the 2004-05 revised budget, predominantly the result of expected growth in gaming and racing income and police and traffic fines resulting from the full implementation of road safety initiatives.
Table 2.5.1: Operating statement ($ million)
2004-05 2005-06 Revised (a) Budget (a)
Income Output appropriations 2 220.3 2 499.9 Special appropriations 66.6 75.6 Resources received free of charge or for nominal consideration 1.6 .. Sale of goods and services 0.4 .. Commonwealth grants 2.3 0.8 Fines and fees 6.9 7.8 Revenue from other parties and other income 88.8 127.5 2 386.9 2 711.5 Expenses Employee benefits 1 385.7 1 492.6 Depreciation and amortisation 72.5 81.5 Grants and other payments 131.5 133.2 Capital asset charge 105.8 109.9 Supplies and services 665.6 849.7 Financing costs 5.4 16.9 2 366.4 2 683.9 Net result for the reporting period 20.5 27.6 Net increase in asset revaluation reserve .. .. Total changes in equity other than those resulting from
transactions with the State in its capacity as owner 20.5 27.6
Source: Departments of Justice and Treasury and Finance
Note: (a) Presentation of 2004-05 revised and 2005-06 Budget is based on A-IFRS. For the presentation of
2003-04 actual results and 2004-05 Budget and revised estimates based on existing Australian Accounting Standards, refer to Appendix C.
94 Justice Statement of Finances 2005-06
Table 2.5.2: Statement of cash flows ($ million)
2004-05 2005-06 Revised Budget Cash flows from operating activities Receipts from Government 2 274.5 2 552.9Receipts from other entities 22.9 57.6Payments for supplies, grants and employees (2 156.8) (2 450.6) 140.6 160.0Interest received 60.5 64.7Capital asset charge ( 105.8) ( 109.9)Financing costs expense ( 5.4) ( 16.3)Other receipts 14.5 14.3Net cash inflow from operating activities 104.4 112.7 Cash flows from investing activities Payments for property, plant and equipment ( 211.2) ( 194.1)Net disposal (+) of investments ( 30.9) ( 32.4)Net cash (outflow) from investing activities ( 242.1) ( 226.5) Cash flows from financing activities Net proceeds from capital contribution by State Government 115.9 105.6Net proceeds from borrowings 16.8 6.1Net cash inflows/(outflow) from financing activities 132.7 111.7Net increase/(decrease) in cash held ( 5.0) ( 2.1)Cash at the beginning of the financial year 27.7 22.7Cash at the end of the financial year 22.7 20.6Source: Departments of Justice and Treasury and Finance
Statement of Finances 2005-06 Justice 95
Table 2.5.3: Balance sheet ($ million)
Estimated as at 30 June (a)(b)
2005 2006 Revised Budget Current assets Cash assets 22.7 20.6 Other financial assets 265.3 297.7 Receivables 41.8 41.8 Inventories 9.8 9.8 Prepayments 7.0 7.0 Assets held for sale 0.1 0.1 Total current assets 346.7 377.0 Non-current assets Receivables 241.3 264.7 Property, plant and equipment 1 315.6 1 636.5 Intangible assets 19.7 18.6 Other 5.2 5.2 Total non-current assets 1 581.8 1 924.9 Total assets 1 928.4 2 301.9 Current liabilities Payables 113.9 113.9 Interest-bearing liabilities 20.6 31.2 Employee provisions 85.2 111.2 Other 6.6 6.6 Total current liabilities 226.2 262.8 Non-current liabilities Interest-bearing liabilities 24.6 227.5 Employee provisions 334.6 334.7 Other .. 0.7 Total non-current liabilities 359.2 562.9 Total liabilities 585.5 825.7 Net assets 1 343.0 1 476.2 Equity Contributed capital 839.0 944.6 Reserves 169.4 169.4 Accumulated surplus 334.6 362.2 Total equity 1 343.0 1 476.2 Source: Departments of Justice and Treasury and Finance
Notes: (a) Presentation of 2005-06 Budget is based on A-IFRS after restating the opening balances as at
1 July 2004. See Table 2.5.7 for details of the restated amounts. (b) Actual results for 2003-04 and 2004-05 Budget and revised estimates prior to restatement to
Administered income Appropriations - Payments made on behalf of the State 67.2 53.3Special appropriations 32.6 33.8Sale of goods and services 87.6 89.2Commonwealth grants 47.1 46.2Taxes 1 376.0 1 479.0Fines 313.6 390.8Fees 73.2 86.8Other 53.1 53.7Total administered income 2 050.4 2 232.9 Administered expenses Expenses on behalf of the State 145.5 133.1Grants and other payments 53.0 38.0Payments into the Consolidated Fund 1 820.2 2 028.3Total administered expenses 2 018.6 2 199.4Income less expenses 31.8 33.5 Administered assets Cash assets 113.0 114.1Receivables 284.8 317.2Other financial assets 5.3 5.4Property, plant and equipment 0.1 0.1Total administered assets 403.2 436.7 Administered liabilities Payables 87.5 87.5Employee provisions 0.3 0.3Other 49.7 49.7Total administered liabilities 137.5 137.5Source: Departments of Justice and Treasury and Finance
Note: (a) Presentation of 2005-06 Budget is based on A-IFRS after restating the opening balances as at
1 July 2004. See Table 2.5.8 for details of restated amounts.
Statement of Finances 2005-06 Justice 97
Payments on behalf of the State Payments on behalf of the State are payments made by the Department on behalf of the State Government as a whole and do not directly reflect the operations of the Department. They are usually on-passed or administered by the State.
Table 2.5.5: Payments made on behalf of the State ($ million)
Accounts 2004-05 2005-06 Revised Budget Health benefit levy transitional payment to racing clubs 4.0 7.5 Grants to households and persons 19.7 .. Tattersalls duty payments to other jurisdictions 43.5 45.8 Total 67.2 53.3 Source: Departments of Justice and Treasury and Finance
Authority for resources This section provides a summary of the sources of Parliamentary authority available to the Department to fund the provision of outputs and additions to the net asset base.
Table 2.5.6: Parliamentary authority for resources ($ million)
2004-05 2005-06 Revised Budget Annual appropriations 2 308.7 2 531.0 Receipts credited to appropriations 92.6 89.6 Unapplied previous years appropriation 7.7 37.6 Accumulated surplus - previously applied appropriation 3.9 .. Gross annual appropriation 2 413.0 2 658.3 Special appropriations 99.2 109.9 Trust funds 165.0 202.0 Total Parliamentary authority 2 677.2 2 970.2 Source: Departments of Justice and Treasury and Finance
98 Justice Statement of Finances 2005-06
Table 2.5.7: Reconciliation of equity at 1 July 2004 ($ million)
Source: Departments of Justice and Treasury and Finance
Notes on the reconciliation of equity at 1 July 2004: (a) The resulting loss has been taken to accumulated funds. (b) Certain property, plant and equipment has been classified as assets held for sale under A-IFRS
and are carried at fair value. (c) Property, plant and equipment has been revalued by $5 million and the resultant losses taken to
reserves. (d) These provisions were previously classified as current liabilities. (e) This reflects the transfer of the asset revaluation reserve to accumulated funds.
Statement of Finances 2005-06 Justice 99
Table 2.5.8: Reconciliation of administered items at 1 July 2004 ($ million)
Source: Departments of Justice and Treasury and Finance
100 Premier and Cabinet Statement of Finances 2005-06
DEPARTMENT OF PREMIER AND CABINET
Operating performance The Department of Premier and Cabinet (DPC) is estimated to have an operating surplus of $15 million for 2005-06, an increase of $16 million from the 2004-05 revised budget.
The predominant cause of this increase is the expected receipt of land free of charge, estimated at $10 million.
The operating statement shows an expected increase in income of $38 million in 2005-06, compared to the 2004-05 revised budget. This is largely attributable to the $29 million increase in operational income provided by Government for existing and new output initiatives.
The significant funding increases in 2005-06 include:
• additional operating funding to cover the cost of CPI increases ($10 million);
• additional operating funding provided for the State Services Authority ($5 million);
• sustainable funding for the Australian Centre for the Moving Image ($5 million);
• establishment of the Tsunami Development Reconstruction Fund ($4 million);
• operating support for the State Library of Victoria and the National Gallery of Victoria ($3 million); and
• improving the condition of the storage facilities for the State Library of Victoria ($3 million).
Expenditure increases primarily reflect the increases in funding for activities as referred to above.
Investment and financing The statement of cash flows shows an expected increase in capital expenditure. This is reflective both of rephasing of capital expenditure in relation to the State Library of Victoria redevelopment and additional funding provided for new initiatives as set out in the next section. These expenditures are funded from additional government capital contributions.
Balance sheet performance The Department’s net asset position in 2005-06 is estimated to improve by $83 million compared to the 2004-05 revised budget. This increase is predominantly due to the $50 million increase in property, plant and equipment and the $34 million increase in non-current receivables.
Statement of Finances 2005-06 Premier and Cabinet 101
Major components of the increase in property, plant and equipment include the assets received free of charge (as noted above), the reallocation of $20 million of previously approved capital expenditure for State Library of Victoria projects, and the following initiatives:
• Melbourne Recital Centre and Melbourne Theatre Company ($17 million);
• arts and cultural facilities maintenance ($6 million);
• State Library of Victoria Storage Facility ($4 million); and
• Australian Centre for the Moving Image Strategic Works ($2 million).
The increase in the balance of the non-current receivables relates to the amount of unfunded depreciation equivalent charges incurred by the Arts Agencies from prior years that has not yet been utilised. This funding can be used by the Department to fund capital projects.
Table 2.6.1: Operating statement ($ million)
2004-05 2005-06 Revised (a) Budget (a)
Income Output appropriations 402.0 430.6 Special appropriations 5.2 5.2 Resources received free of charge or for nominal consideration 1.3 11.3 Sale of goods and services 25.5 26.0 Revenue from other parties and other income 24.7 23.6 458.6 496.7 Expenses Employee benefits 144.6 151.9 Depreciation and amortisation 45.7 44.2 Grants and other payments 51.0 55.0 Capital asset charge 86.0 89.7 Supplies and services 132.6 141.2 Financing costs 0.1 0.1 460.1 482.1 Net result for the reporting period ( 1.5) 14.6 Net increase in asset revaluation reserve .. .. Total changes in equity other than those resulting from
transactions with the State in its capacity as owner ( 1.5) 14.6
Source: Departments of Premier and Cabinet and Treasury and Finance
Note: (a) Presentation of 2004-05 revised and 2005-06 Budget estimates is based on A-IFRS. For the
presentation of 2003-04 actual results and 2004-05 Budget and revised estimates based on existing Australian Accounting Standards, refer to Appendix C.
102 Premier and Cabinet Statement of Finances 2005-06
Table 2.6.2: Statement of cash flows ($ million)
2004-05 2005-06 Revised Budget Cash flows from operating activities Receipts from Government 374.7 402.0Receipts from other entities 26.1 26.2Payments for supplies, grants and employees ( 327.1) ( 346.8) 73.7 81.5Interest received 2.4 2.4Capital asset charge ( 86.0) ( 89.7)Financing costs expense ( 0.1) ( 0.1)Other receipts 22.2 21.7Net cash inflow from operating activities 12.3 15.8 Cash flows from investing activities Payments for property, plant and equipment ( 62.6) ( 81.8)Net disposal (+) of investments ( 0.2) 0.4Net cash (outflow) from investing activities ( 62.7) ( 81.5) Cash flows from financing activities Net proceeds from capital contribution by State Government 46.9 68.6Net proceeds from borrowings ( 1.8) ( 1.8)Net cash inflows/(outflow) from financing activities 45.2 66.8Net increase/(decrease) in cash held ( 5.3) 1.1Cash at the beginning of the financial year 41.7 36.4Cash at the end of the financial year 36.4 37.5Source: Departments of Premier and Cabinet and Treasury and Finance
Statement of Finances 2005-06 Premier and Cabinet 103
Table 2.6.3: Balance sheet ($ million)
Estimated as at 30 June (a)(b)
2005 2006 Revised Budget Current assets Cash assets 36.4 37.5 Other financial assets 61.1 60.8 Receivables 20.3 20.3 Inventories 4.1 4.1 Prepayments 1.1 1.0 Total current assets 122.9 123.7 Non-current assets Receivables 68.1 101.9 Other financial assets 5.9 5.9 Property, plant and equipment 1 013.3 1 063.5 Intangible assets 0.5 0.5 Other 2 553.0 2 550.5 Total non-current assets 3 640.9 3 722.3 Total assets 3 763.8 3 845.9 Current liabilities Payables 27.5 27.6 Interest-bearing liabilities 0.4 0.4 Employee provisions 14.0 14.3 Other 17.8 17.3 Total current liabilities 59.7 59.5 Non-current liabilities Interest-bearing liabilities 5.9 4.2 Employee provisions 12.7 13.6 Total non-current liabilities 18.6 17.7 Total liabilities 78.3 77.3 Net assets 3 685.5 3 768.6 Equity Contributed capital 1 374.4 1 443.0 Reserves 2 139.8 2 139.8 Accumulated surplus 171.3 185.9 Total equity 3 685.5 3 768.6 Source: Departments of Premier and Cabinet and Treasury and Finance
Notes: (a) Presentation of 2005-06 Budget is based on A-IFRS after restating the opening balances as at
1 July 2004. See Table 2.6.6 for details of the restated amounts. (b) Actual results for 2003-04 and 2004-05 Budget and revised estimates prior to restatement to
A-IFRS are included in Appendix C.
104 Premier and Cabinet Statement of Finances 2005-06
Administered income Sale of goods and services 0.0 0.6Other 5.5 0.3Total administered income 5.6 1.0 Administered expenses Payments into the Consolidated Fund 5.6 1.0Total administered expenses 5.6 1.0Income less expenses .. .. Administered assets Receivables 5.4 3.6Total administered assets 5.3 3.6 Administered liabilities Payables 12.3 10.5Interest-bearing liabilities ( 7.0) ( 7.0)Total administered liabilities 5.3 3.5Source: Departments of Premier and Cabinet and Treasury and Finance
Note: (a) Presentation of 2005-06 Budget is based on A-IFRS after restating the opening balances as at
1 July 2004. See Table 2.6.7 for details of restated amounts.
Authority for resources This section provides a summary of the sources of Parliamentary authority available to the Department to fund the provision of outputs and additions to the net asset base.
Table 2.6.5: Parliamentary authority for resources ($ million)
2004-05 2005-06 Revised Budget Annual appropriations 420.3 501.3Receipts credited to appropriations .. 0.5Unapplied previous years appropriation 34.8 ..Gross annual appropriation 455.1 501.8Special appropriations 5.2 5.2Trust funds 9.1 4.0Total Parliamentary authority 469.4 511.0Source: Departments of Premier and Cabinet and Treasury and Finance
Statement of Finances 2005-06 Premier and Cabinet 105
Table 2.6.6: Reconciliation of equity at 1 July 2004 ($ million)
Existing AAS Transition impact A-IFRS Current assets Cash assets 41.7 .. 41.7 Other financial assets 63.8 .. 63.8 Receivables 20.2 0.0 20.2 Inventories 4.1 .. 4.1 Prepayments 1.0 .. 1.0 Total current assets 130.7 0.0 130.8 Non-current assets Receivables 35.6 .. 35.6 Other financial assets 2.9 .. 2.9 Property, plant and equipment 991.3 ( 0.5) 990.9 Intangible assets 0.5 .. 0.5 Other 2 558.7 .. 2 558.7 Total non-current assets 3 589.1 ( 0.5) 3 588.6 Total assets 3 719.8 ( 0.4) 3 719.4 Current liabilities Payables 27.6 .. 27.6 Interest-bearing liabilities 0.4 .. 0.4 Employee provisions 14.1 ( 0.5) 13.6 Other 18.3 0.1 18.3 Total current liabilities 60.4 ( 0.5) 59.9 Non-current liabilities Interest-bearing liabilities 7.7 .. 7.7 Employee provisions 11.3 0.5 11.8 Total non-current liabilities 18.9 0.5 19.5 Total liabilities 79.3 0.1 79.4 Net assets 3 640.5 ( 0.5) 3 640.0 Equity Contributed capital 1 327.5 .. 1 327.5 Reserves 2 138.7 .. 2 138.7 Accumulated surplus 174.3 ( 0.5) 173.8 Total equity 3 640.5 ( 0.5) 3 640.0
Source: Departments of Premier and Cabinet and Treasury and Finance
106 Premier and Cabinet Statement of Finances 2005-06
Table 2.6.7: Reconciliation of administered items at 1 July 2004 ($ million)
Source: Departments of Premier and Cabinet and Treasury and Finance
Statement of Finances 2005-06 Primary Industries 107
DEPARTMENT OF PRIMARY INDUSTRIES
Operating performance The Department of Primary Industries (DPI) is expected to have a balanced operating result for 2005-06.
Most of DPI’s operating income is sourced from state government appropriations and supplemented by external funding received for scientific research and extension projects. The operating income for DPI for the 2005-06 Budget is expected to be $352 million, a $4 million increase from the 2004-05 revised budget. The increase is primarily due to funding provided from Government for new initiatives such as:
• developing greenhouse abatement technologies;
• Preserving our Clean/Green Credentials: Plant Biosecurity Reform; and
• National Biosecurity Centre.
Operating expenses are anticipated to increase in line with income, reflecting expenditure on initiatives such as the ones listed above.
Investment and financing DPI serves to facilitate investment in assets and programs to promote the sustainable use of natural resources. Net cash outflows from investing activities are expected to increase from $42 million in 2004-05 revised budget to $65 million in the 2005-06 Budget. The majority of the net cash outflow of $65 million from investing activities in the 2005-06 Budget relates to investment in the redevelopment of the Melbourne Showgrounds.
The decrease in the payments for property, plant and equipment from $13 million to $5 million in the 2005-06 Budget reflects the completion of the Marine and Freshwater Research Institute at Queenscliff, and Science Innovation and Education precincts across Provincial Victoria.
Balance sheet performance DPI’s net asset position is estimated to increase by $47 million from the 2004-05 revised budget to the 2005-06 Budget. Most of the increase reflected in other financial assets relates to the investment in the redevelopment of the Melbourne Showgrounds. This increase is offset by $14 million depreciation on existing assets reflected in the property, plant and equipment balances.
108 Primary Industries Statement of Finances 2005-06
Statement of administered items Transactions administered by DPI on behalf of the State mainly represent mining royalties and contributions to agricultural research projects from rural industry research corporations. Administered income is expected to increase by $14 million from 2004-05 revised budget to the 2005-06 Budget. Estimated increases in brown coal royalties contribute largely to this increase, which is offset by an expected $3 million decrease in Commonwealth Grants mainly due to the gradual winding down of the Exceptional Circumstances Program.
Table 2.7.1: Operating statement ($ million)
2004-05 2005-06 Revised (a) Budget (a)
Income Output appropriations 309.6 314.1Sale of goods and services 29.3 27.8Taxes 4.5 5.0Fines and fees 4.3 4.3Other revenue and revenue from other parties 0.3 0.3 348.0 351.5Expenses Employee benefits 147.6 144.6Depreciation and amortisation 17.7 18.3Grants and other payments 27.5 28.2Capital asset charge 18.7 15.6Supplies and services 135.7 144.8 347.1 351.5Net result for the reporting period 0.9 ..Net increase in asset revaluation reserve .. ..Total changes in equity other than those resulting from
transactions with the State in its capacity as owner 0.9 ..
Source: Departments of Primary Industries and Treasury and Finance
Note: (a) Presentation of 2004-05 revised estimates and 2005-06 Budget is based on A-IFRS. For the
presentation of 2003-04 actual results and 2004-05 Budget and revised estimates based on existing Australian Accounting Standards, refer to Appendix C.
Statement of Finances 2005-06 Primary Industries 109
Table 2.7.2: Statement of cash flows ($ million)
2004-05 2005-06 Revised Budget Cash flows from operating activities Receipts from Government 309.5 315.0 Receipts from other entities 38.1 37.5 Payments for supplies, grants and employees ( 309.8) ( 318.8) 37.8 33.6 Interest received 0.3 0.3 Capital asset charge ( 18.7) ( 15.6) Other receipts ( 6.0) .. Net cash inflow from operating activities 13.5 18.3 Cash flows from investing activities Payments for property, plant and equipment ( 13.0) ( 4.9) Net disposal (+) of investments ( 29.1) ( 60.4) Net cash (outflow) from investing activities ( 42.1) ( 65.3) Cash flows from financing activities Net proceeds from capital contribution by State Government 29.0 46.6 Net cash inflows/(outflow) from financing activities 29.0 46.6 Net increase/(decrease) in cash held 0.4 ( 0.4) Cash at the beginning of the financial year 26.5 26.9 Cash at the end of the financial year 26.9 26.5 Source: Departments of Primary Industries and Treasury and Finance
110 Primary Industries Statement of Finances 2005-06
Table 2.7.3: Balance sheet ($ million)
Estimated as at 30 June (a)(b)
2005 2006 Revised Budget Current assets Cash assets 26.9 26.5 Other financial assets 9.0 8.7 Receivables 12.1 11.7 Inventories 3.1 3.1 Prepayments 0.1 0.1Total current assets 51.2 50.1Non-current assets Receivables 52.3 51.5 Other financial assets 40.6 101.3 Property, plant and equipment 262.0 248.6Total non-current assets 355.0 401.4Total assets 406.1 451.5Current liabilities Payables 21.1 19.4 Interest-bearing liabilities 3.2 3.2 Employee provisions 14.3 12.7 Other 0.1 0.1Total current liabilities 38.6 35.4Non-current liabilities Employee provisions 38.8 40.1 Other 1.8 1.8Total non-current liabilities 40.6 41.9Total liabilities 79.3 77.3Net assets 326.9 374.2Equity Contributed capital 293.5 340.8 Accumulated surplus 33.4 33.4Total equity 326.9 374.2Source: Departments of Primary Industries and Treasury and Finance
Notes: (a) Presentation of 2005-06 Budget is based on A-IFRS after restating the opening balances as at
1 July 2004. See Table 2.7.6 for details of the restated amounts. (b) Actual results for 2003-04 and 2004-05 Budget and revised estimates prior to restatement to
A-IFRS are included in Appendix C.
Statement of Finances 2005-06 Primary Industries 111
Administered income Sale of goods and services 40.2 43.4 Commonwealth grants 14.2 11.7 Other grants 5.7 7.7 Fees 6.6 8.1 Other 23.9 33.8 Total administered income 90.7 104.7 Administered expenses Expenses on behalf of the State .. 0.3 Payments into the Consolidated Fund 90.4 104.4 Total administered expenses 90.4 104.7 Income less expenses 0.3 .. Administered assets Cash assets 1.9 1.9 Receivables 39.7 39.7 Total administered assets 41.7 41.7 Administered liabilities Payables 0.2 0.2 Other 5.2 5.2 Total administered liabilities 5.4 5.3 Source: Departments of Primary Industries and Treasury and Finance
Note: (a) Presentation of 2005-06 Budget is based on A-IFRS after restating the opening balances as at
1 July 2004. See Table 2.7.7 for details of restated amounts.
112 Primary Industries Statement of Finances 2005-06
Authority for resources This section provides a summary of the sources of Parliamentary authority available to the Department to fund the provision of outputs and additions to the net asset base.
Table 2.7.5: Parliamentary authority for resources ($ million)
2004-05 2005-06 Revised Budget Annual appropriations 241.6 307.9Receipts credited to appropriations 49.1 62.6Unapplied previous years appropriation 40.2 15.8Gross annual appropriation 330.8 386.4Trust funds 38.7 37.7Total Parliamentary authority 369.5 424.1Source: Departments of Primary Industries and Treasury and Finance
Statement of Finances 2005-06 Primary Industries 113
Table 2.7.6: Reconciliation of equity at 1 July 2004 ($ million)
Notes Existing AAS Transition impact A-IFRS Current assets Cash assets 26.5 .. 26.5 Other financial assets 9.2 .. 9.2 Receivables 11.2 .. 11.2 Inventories 3.1 .. 3.1 Prepayments 0.1 .. 0.1 Total current assets 50.1 .. 50.1 Non-current assets Receivables 47.2 .. 47.2 Other financial assets 11.3 .. 11.3
Source: Departments of Primary Industries and Treasury and Finance
Notes on the reconciliation of equity at 1 July 2004: (a) Property, plant and equipment has decreased by $3 million due to the revaluation down of the
residual value of some assets. The resulting loss has been taken to accumulated funds. Certain property plant and equipment has been classified as assets held for sale under A-IFRS and are carried at fair value. The resulting loss has been taken to accumulated funds.
(b) The $10 million of intangible assets consists of internally generated research and development costs. This has been revalued to nil as it did not meet the IFRS criteria for intangible assets.
(c) Current employee provisions have been revalued down $0.2 million to reflect the discounted present value of the provision.
114 Primary Industries Statement of Finances 2005-06
Table 2.7.7: Reconciliation of administered items at 1 July 2004 ($ million)
Source: Departments of Primary Industries and Treasury and Finance
Statement of Finances 2005-06 Sustainability and Environment 115
DEPARTMENT OF SUSTAINABILITY AND ENVIRONMENT
Operating performance The Department of Sustainability and Environment (DSE) is estimated to have an operating surplus of $12 million for 2005-06, an improvement of $46 million on the 2004-05 revised budget. The transfer of commercial forestry activities to VicForests, as part of the New Directions for Sustainable Forestry program, resulted in a deficit in DSE’s accounts in 2004-05 due to changes in the accounting valuation of forests held for commercial purposes.
The largest part of DSE’s 2005-06 projected operating income is provided through state government appropriations. This consists of funding of new initiatives in the 2005-06 Budget (such as funding to renew, restore and upgrade assets within the parks estate, and to protect our coastal environment), and the flow-through effect funding for initiatives approved in previous budgets (including Water White Paper initiatives and Our Forests, Our Future initiatives). A further $126 million is sourced from the taxation receipts derived from the Metropolitan Parks Charge (MPC) and landfill levies. Both of these income streams are hypothecated (legislatively dedicated) to expenses relating to metropolitan parks and waste management activities.
The decrease in DSE’s overall income between the 2004-05 revised budget and 2005-06 Budget can be mainly attributed to the transfer of commercial forestry activity to VicForests, and the resultant reduction in silviculture and roading income streams.
The once-off losses on a revaluation of biological assets and a transfer of assets free of charge reported in 2004-05, again as a result of the transfer of forestry activity to VicForests, has resulted in lower expense estimates in 2005-06. These are the key reasons for the improved result.
The increases in MPC and landfill levies will result in an increase in projected taxation income from the 2004-05 revised budget to 2005-06 Budget. The additional income from the MPC will be used to further develop and manage the network of parks, gardens, trails, waterways, bays and other significant recreation and conversation assets. Landfill levies apply to municipal, commercial and industrial and prescribed wastes that are disposed to licensed landfills in Victoria. The additional income collected through landfill levies will be used for activities undertaken by a range of organisations, including regional waste management groups, EcoRecycle and Environment Protection Authority, by helping to establish waste management infrastructure, industry waste reduction programs, education programs, regulatory controls and enforcement regimes.
116 Sustainability and Environment Statement of Finances 2005-06
The $4 129 million net increase in asset revaluation reserves in the 2004-05 revised budget relates to a revaluation of Crown Land to fair value as part of DSE’s transitional valuation program developed to comply with accounting standards.
Investment and financing Cash flows from operating activities are consistent with the above trends.
The cash flows from investing activities in the 2005-06 Budget reflect DSE’s continuing investment in property, plant and equipment. This investment primarily relates to initiatives such as the Wimmera-Mallee Pipeline, the Victorian Water Trust initiatives, various bushfire recovery actions and the long-term Zoo Strategy.
Balance sheet performance DSE’s net asset position in 2005-06 is estimated to improve by $79 million on the 2004-05 revised budget. This increase is mainly attributable to the completion of the Department’s progressive asset revaluation program, and adoption of fair value methodology resulting in an increase in property, plant and equipment.
Statement of administered items Transactions administered by DSE on behalf of the State are the Murray-Darling Basin Commission contribution and the Timber Promotion Council. These payments represent Victoria’s share of agreed cost-sharing arrangements between the States and the Commonwealth for the Murray-Darling Basin Commission for the management of water flows, and quality and operating contribution to the Timber Promotion Council.
Total administered income for the 2005-06 Budget represents the collection of fees and charges for land title transactions, Crown land leases, and licences and forest royalties. DSE also collects Commonwealth specific purpose payments relating to projects under the National Action Plan for Salinity and Water Quality, Natural Heritage Trust and Forestry Industry Structural Adjustment Program.
Total administered income is projected to increase mainly due to a rise in sales of services and an increase in levies on statutory corporations.
Statement of Finances 2005-06 Sustainability and Environment 117
Table 2.8.1: Operating statement ($ million)
2004-05 2005-06 Revised (a) Budget (a)
Income Output appropriations 792.8 777.0 Resources received free of charge or for nominal consideration .. 12.0 Sale of goods and services 14.8 15.1 Taxes 120.4 125.9 Fines and fees 6.6 6.5 Revenue from other parties and other income 0.9 1.8 935.4 938.3 Expenses Employee benefits 217.3 232.8 Depreciation and amortisation 35.5 36.7 Resources provided free of charge or for nominal consideration 14.6 .. Grants and other payments 351.4 319.7 Capital asset charge 65.1 67.2 Supplies and services 265.5 268.6 Other expenses 20.3 1.6 969.7 926.6 Net result for the reporting period ( 34.3) 11.6 Net increase in asset revaluation reserve (b) 4 128.8 .. Total changes in equity other than those resulting from
transactions with the State in its capacity as owner 4 094.5 11.6
Source: Departments of Sustainability and Environment and Treasury and Finance
Notes: (a) Presentation of 2004-05 revised estimates and 2005-06 Budget is based on A-IFRS. For the
presentation of 2003-04 actual results and 2004-05 Budget and revised estimates based on existing Australian Accounting Standards, refer to Appendix C.
(b) The $4 129 million net increase in asset revaluation reserve in the 2004-05 revised budget relates to a revaluation of Crown Land required to complete the Department’s transition from cost to fair value as required under AASB 1041. As part of the transitional provisions of the standard, all assets must be valued at fair value by 30 June 2005. A transitional valuation program was developed in 2000 as required, and this is one of the final items in the asset base to be valued.
118 Sustainability and Environment Statement of Finances 2005-06
Table 2.8.2: Statement of cash flows ($ million)
2004-05 2005-06 Revised Budget Cash flows from operating activities Receipts from Government 787.9 795.8Receipts from other entities 140.6 144.9Payments for supplies, grants and employees ( 822.0) ( 812.1) 106.5 128.5Interest received 0.7 0.6Capital asset charge ( 65.1) ( 67.2)Other receipts 3.4 3.8Net cash inflow from operating activities 45.4 65.7 Cash flows from investing activities Payments for property, plant and equipment ( 62.9) ( 131.9)Net disposal (+) of investments ( 15.6) ..Net cash (outflow) from investing activities ( 78.5) ( 131.9) Cash flows from financing activities Net proceeds from capital contribution by State Government 41.8 67.5Net cash inflows/(outflow) from financing activities 41.8 67.5Net increase/(decrease) in cash held 8.7 1.2Cash at the beginning of the financial year 52.8 61.5Cash at the end of the financial year 61.5 62.7Source: Departments of Sustainability and Environment and Treasury and Finance
Statement of Finances 2005-06 Sustainability and Environment 119
Table 2.8.3: Balance sheet ($ million)
Estimated as at 30 June (a)(b)
2005 2006 Revised Budget Current assets Cash assets 61.5 62.7 Other financial assets 17.4 17.4 Receivables 46.5 48.9 Inventories 9.2 9.2 Prepayments 16.9 16.9 Assets held for sale 2.7 2.7 Total current assets 154.2 157.8 Non-current assets Receivables 74.1 55.3 Property, plant and equipment 7 292.1 7 399.9 Intangible assets 43.4 38.8 Other 109.0 109.0 Total non-current assets 7 518.5 7 603.0 Total assets 7 672.7 7 760.8 Current liabilities Payables 64.8 69.8 Interest-bearing liabilities 0.5 0.5 Employee provisions 17.3 18.3 Other 0.1 0.1 Total current liabilities 82.7 88.6 Non-current liabilities Interest-bearing liabilities 2.0 2.0 Employee provisions 53.7 56.7 Other 11.5 11.5 Total non-current liabilities 67.3 70.2 Total liabilities 150.0 158.9 Net assets 7 522.7 7 601.9 Equity Contributed capital 2 332.3 2 399.7 Reserves 5 143.9 5 143.9 Accumulated surplus 46.6 58.2 Total equity 7 522.7 7 601.9 Source: Departments of Sustainability and Environment and Treasury and Finance
Notes: (a) Presentation of 2005-06 Budget is based on A-IFRS after restating the opening balances as a
1 July 2004. See Table 2.8.7 for details of the restated amounts. (b) Actual results for 2003-04 and 2004-05 Budget and revised estimates prior to restatement to
A-IFRS are included in Appendix C.
120 Sustainability and Environment Statement of Finances 2005-06
Administered income Appropriations - Payments made on behalf of the State 26.9 25.7Sale of goods and services 193.2 206.7Commonwealth grants 55.8 55.8Taxes 44.7 60.4Fees 20.4 20.6Other 37.5 39.6Total administered income 378.5 408.7 Administered expenses Expenses on behalf of the State 1.1 1.1Grants and other payments 25.8 24.6Payments into the Consolidated Fund 351.6 383.1Total administered expenses 378.5 408.8Income less expenses .. ( 0.0) Administered assets Cash assets 2.3 2.3Receivables 23.3 23.2Other financial assets 0.1 0.1Total administered assets 25.6 25.6 Administered liabilities Payables 0.1 0.1Other 5.3 5.3Total administered liabilities 5.5 5.5Source: Departments of Sustainability and Environment and Treasury and Finance
Note: (a) Presentation of 2005-06 Budget is based on A-IFRS after restating the opening balances as at
1 July 2004. See Table 2.8.8 for details of restated amounts.
Statement of Finances 2005-06 Sustainability and Environment 121
Payments on behalf of the State Payments on behalf of the State are payments made by the Department on behalf of the State Government as a whole and do not directly reflect the operations of the Department. They are usually on-passed or administered by the State.
Table 2.8.5: Payments made on behalf of the state ($ million)
2004-05 2005-06 Revised Budget Murray-Darling Basin Contribution 25.8 24.6 Timber Promotion Council Trust Fund 1.1 1.1 Total 26.9 25.7 Source: Departments of Sustainability and Environment and Treasury and Finance
Authority for resources This section provides a summary of the sources of Parliamentary authority available to the Department to fund the provision of outputs and additions to the net asset base.
Table 2.8.6: Parliamentary authority for resources ($ million)
2004-05 2005-06 Revised Budget Annual appropriations 758.9 814.9 Receipts credited to appropriations 68.8 61.3 Unapplied previous years appropriation 43.9 .. Gross annual appropriation 871.6 876.1 Trust funds 145.9 151.7 Total Parliamentary authority 1 017.5 1 027.8 Source: Departments of Sustainability and Environment and Treasury and Finance
122 Sustainability and Environment Statement of Finances 2005-06
Table 2.8.7: Reconciliation of equity at 1 July 2004 ($ million)
Existing AAS Transition impact A-IFRS Current assets Cash assets 52.8 .. 52.8 Other financial assets 17.4 .. 17.4 Receivables 45.3 .. 45.3 Inventories 8.6 0.3 8.9 Prepayments 16.9 .. 16.9 Assets held for sale 0.5 2.2 2.7 Total current assets 141.6 2.5 144.1 Non-current assets Receivables 69.2 .. 69.2 Inventories 2.2 ( 2.2) .. Property, plant and equipment 3 134.2 ( 1.2) 3 133.1 Intangible assets 46.3 ( 0.0) 46.3 Other 143.1 .. 143.1 Total non-current assets 3 395.1 ( 3.4) 3 391.7 Total assets 3 536.7 ( 0.9) 3 535.7 Current liabilities Payables 56.0 .. 56.0 Interest-bearing liabilities 0.5 .. 0.5 Employee provisions 21.8 ( 3.1) 18.7 Other 0.3 .. 0.3 Total current liabilities 78.6 ( 3.1) 75.5 Non-current liabilities Interest-bearing liabilities 2.0 .. 2.0 Employee provisions 45.6 2.9 48.4 Other .. 7.7 7.7 Total non-current liabilities 47.6 10.6 58.2 Total liabilities 126.2 7.5 133.7 Net assets 3 410.5 ( 8.5) 3 402.1 Equity Contributed capital 2 302.0 .. 2 302.0 Reserves 1 015.1 .. 1 015.1 Accumulated surplus 93.5 ( 8.5) 85.0 Total equity 3 410.5 ( 8.5) 3 402.1
Source: Departments of Sustainability and Environment and Treasury and Finance
Statement of Finances 2005-06 Sustainability and Environment 123
Table 2.8.8: Reconciliation of administered items at 1 July 2004 ($ million)
Source: Departments of Sustainability and Environment and Treasury and Finance
124 Treasury and Finance Statement of Finances 2005-06
DEPARTMENT OF TREASURY AND FINANCE
Operating performance The Department of Treasury and Finance (DTF) anticipates a budget surplus of $4 million in 2005-06, compared to a $12 million deficit in the 2004-05 revised budget.
The changed position is mainly related to a $10 million decrease in the Crown land property sales program (the book value of properties sold is recorded as an expense in the controlled operating statement, whereas the associated sales income is classed as administered).
DTF’s total expenses will decrease from 2004-05 revised budget to 2005-06 Budget largely due to cessation of one-off information technology projects, cessation of funding for the whole-of-government stewardship of changes to the Australian Accounting Standards, and government saving initiatives.
Investment and financing The changes to DTF’s budgeted cash flows are largely associated with the changed arrangements to the whole-of-government motor vehicles lease facility. The movements in other receipts and net borrowings recognise the progressive wind up of the previous whole-of-government motor vehicle lease arrangements.
Net proceeds from capital contributions are expected to decrease by $11 million from the 2004-05 revised budget to the 2005-06 Budget, largely reflecting the one-off funding in 2004-05 for the purchase of municipal valuations used by the State Revenue Office for land tax calculation purposes. This is also reflected in the reduction in payments for property, plant and equipment.
Cash receipts from government are lower in 2005-06 due to decreased drawdowns on the annual appropriation received associated with depreciation and other non-cash expenses.
Balance sheet performance Net assets are expected to increase by $8 million between the 2004-05 revised budget and the 2005-06 Budget. This is due to the budgeted operating surplus of $4 million and capital injections of $4 million. The reduction in property, plant and equipment reflects the disposal of motor vehicles under the previous arrangements, whilst the increase in receivables reflects the financing arrangements provided to departments for the purchase of new vehicles.
Statement of Finances 2005-06 Treasury and Finance 125
Statement of administered items DTF administers a large number of transactions on behalf of the State for which it cannot exercise direct control – for example, the collection of state taxation income and administration of the State’s superannuation expenses.
Administered income is estimated to increase by $352 million between the 2004-05 revised budget and the 2005-06 Budget. Increases in GST-related Commonwealth Grants account for $493 million of this increase, reflecting growth in the total GST pool, as well as an increase in Victoria's share as determined by the Commonwealth Grants Commission. Lower special appropriations have partially offset the grants increase, due to improved superannuation investment returns.
Administered expenses have reduced in 2005-06 due to lower superannuation expense as a result of higher investment returns.
Table 2.9.1: Operating statement ($ million)
2004-05 2005-06 Revised (a) Budget (a)
Income Output appropriations 183.9 182.4 Sale of goods and services 0.3 0.3 Revenue from other parties and other income 58.2 51.1 242.5 233.8 Expenses Employee benefits 82.0 85.4 Depreciation and amortisation 39.6 32.5 Grants and other payments 5.2 6.0 Capital asset charge 21.4 21.6 Supplies and services 74.2 54.7 Financing costs 18.7 17.2 Other expenses 12.9 12.0 254.0 229.4 Net result for the reporting period ( 11.5) 4.3 Net increase in asset revaluation reserve .. .. Total changes in equity other than those resulting from
transactions with the State in its capacity as owner ( 11.5) 4.3
Source: Department of Treasury and Finance
Note: (a) Presentation of 2004-05 revised estimates and 2005-06 Budget is based on A-IFRS. For the
presentation of 2003-04 actual results and 2004-05 Budget and revised estimates based on existing Australian Accounting Standards, refer to Appendix C.
126 Treasury and Finance Statement of Finances 2005-06
Table 2.9.2: Statement of cash flows ($ million)
2004-05 2005-06 Revised Budget Cash flows from operating activities Receipts from Government 191.0 165.2Receipts from other entities 0.3 0.3Payments for supplies, grants and employees ( 175.9) ( 157.8) 15.4 7.6Interest received 5.1 12.1Capital asset charge ( 21.4) ( 21.6)Financing costs expense ( 26.8) ( 28.6)Other receipts 65.0 37.6Net cash inflow from operating activities 37.3 7.2 Cash flows from investing activities Payments for property, plant and equipment ( 34.9) ( 15.7)Net cash inflow/(outflow) from investing activities ( 34.9) ( 15.7) Cash flows from financing activities Net proceeds from capital contribution by State Government 15.0 3.7Net proceeds from borrowings ( 15.7) 4.9Net cash inflows/(outflow) from financing activities ( 0.7) 8.5Net increase/(decrease) in cash held 1.8 ..Cash at the beginning of the financial year 38.7 40.4Cash at the end of the financial year 40.4 40.4Source: Department of Treasury and Finance
Statement of Finances 2005-06 Treasury and Finance 127
Table 2.9.3: Balance sheet ($ million)
Estimated as at 30 June (a)(b)
2005 2006 Revised Budget Current assets Cash assets 40.4 40.4 Other financial assets 0.2 0.2 Receivables 11.9 11.9 Inventories 0.4 0.4 Prepayments 1.1 1.1 Assets held for sale 19.6 19.6 Total current assets 73.7 73.7 Non-current assets Receivables 197.1 287.7 Property, plant and equipment 246.4 183.8 Intangible assets 27.6 16.5 Other 68.6 66.9 Total non-current assets 539.7 555.0 Total assets 613.4 628.7 Current liabilities Payables 19.7 19.7 Interest-bearing liabilities 89.7 78.4 Employee provisions 8.7 8.2 Other 43.8 41.9 Total current liabilities 161.9 148.1 Non-current liabilities Interest-bearing liabilities 120.0 138.4 Employee provisions 13.7 16.3 Other 0.1 0.1 Total non-current liabilities 133.8 154.8 Total liabilities 295.7 302.9 Net assets 317.7 325.7 Equity Contributed capital 113.6 117.2 Reserves 116.2 116.2 Accumulated surplus 88.0 92.3 Total equity 317.7 325.7 Source: Department of Treasury and Finance
Notes: (a) Presentation of 2005-06 Budget is based on A-IFRS after restating the opening balances as at
1 July 2004. See Table 2.9.7 for details of the restated amounts. (b) Actual results for 2003-04 and 2004-05 Budget and revised estimates prior to restatement to
A-IFRS are included in Appendix C.
128 Treasury and Finance Statement of Finances 2005-06
Administered income Appropriations - Payments made on behalf of the State 1 101.8 1 321.3Special appropriations 697.2 224.4Sale of goods and services 6.4 6.4Commonwealth grants 7 569.7 8 085.6Taxes 7 495.9 7 299.9Fees 8.2 8.3Other 3 325.1 3 609.9Total administered income 20 204.3 20 555.9 Administered expenses Expenses on behalf of the State 2 186.6 1 521.4Grants and other payments 442.3 459.8Payments into the Consolidated Fund 18 790.6 19 237.4Total administered expenses 21 419.4 21 218.6Income less expenses (1 215.2) ( 662.8) Administered assets Cash assets 257.4 262.4Receivables ( 663.8) ( 285.3)Other financial assets 1 381.5 918.5Prepayments 6.3 6.3Property, plant and equipment 2.1 2.1Total administered assets 983.6 904.0 Administered liabilities Payables 76.9 76.9Interest-bearing liabilities 5 301.2 5 305.2Employee provisions 16 843.3 17 576.8Amounts owing to other departments 86.3 86.3Other 1 474.1 1 380.0Total administered liabilities 23 781.8 24 425.2Source: Department of Treasury and Finance
Note: (a) Presentation of 2005-06 Budget is based on A-IFRS after restating the opening balances as at
1 July 2004. See Table 2.9.8 for details of restated amounts.
Statement of Finances 2005-06 Treasury and Finance 129
Payments on behalf of the State Payments on behalf of the State are payments made by the Department on behalf of the State Government as a whole and do not directly reflect the operations of the Department. They are usually on-passed or administered by the State.
Table 2.9.5: Payments made on behalf of the State ($ million)
Accounts 2004-05 2005-06 Revised Budget Superannuation and pension payments 16.4 16.4 Interest 362.3 356.3 Current and capital grants 387.4 402.8 Operating supplies and consumables 146.4 429.5 Other 189.2 116.3 Total 1 101.8 1 321.3 Source: Department of Treasury and Finance
Authority for resources This section provides a summary of the sources of Parliamentary authority available to the Department to fund the provision of outputs and additions to the net asset base.
Table 2.9.6: Parliamentary authority for resources ($ million)
2004-05 2005-06 Revised Budget Annual appropriations 1 314.5 1 523.5 Receipts credited to appropriations 3.3 3.2 Unapplied previous years appropriation 2.3 .. Accumulated surplus - previously applied appropriation 5.7 .. Gross annual appropriation 1 325.9 1 526.7 Special appropriations 697.2 224.4 Trust funds 34.8 41.5 Total Parliamentary authority 2 057.8 1 792.6 Source: Department of Treasury and Finance
130 Treasury and Finance Statement of Finances 2005-06
Table 2.9.7: Reconciliation of equity at 1 July 2004 ($ million)
Other 70.3 .. 70.3 Total non-current assets 564.5 ( 19.6) 544.9 Total assets 615.7 ( 3.9) 611.8 Current liabilities Payables 19.7 .. 19.7 Interest-bearing liabilities 92.8 .. 92.8 Employee provisions 9.2 .. 9.2
(e) Other 47.5 0.1 47.6 Total current liabilities 169.2 0.1 169.2 Non-current liabilities Interest-bearing liabilities 117.1 .. 117.1 Employee provisions 11.1 .. 11.1
(e) Other .. 0.1 0.1 Total non-current liabilities 128.2 0.1 128.3 Total liabilities 297.4 0.2 297.6 Net assets 318.3 ( 4.1) 314.3 Equity Contributed capital 98.6 .. 98.6 Reserves 116.2 .. 116.2 Accumulated surplus 103.6 ( 4.1) 99.5 Total equity 318.3 ( 4.1) 314.3
Source: Department of Treasury and Finance
Notes on the reconciliation of equity at 1 July 2004: (a) Certain properties held for sale now classified as current assets (and transferred from
non-current) under AASB 5 ($26 million), partly offset by the reclassification of certain properties to property, plant and equipment ($10 million).
(b) Reclassification of certain properties as current assets. Also refer to Note (a). (c) IT development costs reclassified as intangibles in accordance with new Standard AASB 138
($17 million), IT and website development costs written off against accumulated funds under the requirements of AASB 138 ($4 million), partly offset by certain properties being reclassified from inventories ($10 million). Also refer to Note (a).
(d) IT development costs reclassified from property, plant and equipment. Also refer to Note (c). (e) Provision for make-good costs obliged under certain accommodation leases.
Statement of Finances 2005-06 Treasury and Finance 131
Table 2.9.8: Reconciliation of administered items at 1 July 2004 ($ million)
(a) Employee provisions 11 710.5 4 142.2 15 852.7 Amounts owing to other departments 87.3 .. 87.3 Other 1 559.5 .. 1 559.5 Total administered liabilities 18 505.9 4 142.2 22 648.2
Source: Department of Treasury and Finance
Note on the reconciliation of equity at 1 July 2004: (a) In estimating the State’s unfunded superannuation liability, the present value of the underlying
obligation is currently calculated using the expected long-term earning rate on scheme assets. Under AASB 119, this value is required to be calculated using government bond rates, specifically in this case the ten-year Commonwealth Government bond rate.
132 Victorian Communities Statement of Finances 2005-06
DEPARTMENT FOR VICTORIAN COMMUNITIES
Operating performance The Department for Victorian Communities (DVC) is estimated to have an operating deficit of $4 million in the 2005-06 Budget. This deficit results from the draw down of funds previously accumulated in the Community Support Fund (CSF) for community projects in the 2005-06 Budget year. The CSF itself is not in deficit as a result.
The largest component of DVC’s income is output appropriation provided by the Government. Most of this will be applied in the provision of a range of grants to external organisations. The statement also includes electronic gaming machine income for payment into the CSF.
The estimated increase in income and expenses from 2004-05 is largely due to the running of the Melbourne 2006 Commonwealth Games in 2005-06, as well as other new output initiatives announced in the 2005-06 Budget, including the Aboriginal land and economic development program and Stolen Generations initiative.
Investment and financing Investing activities for the 2005-06 Budget year are budgeted at $4 million. Cash flows for investment relate to DVC’s existing capital investment program and new capital investment initiatives announced in the 2005-06 Budget, including a new home for rectangular sports and improving community sport and recreation infrastructure. A net cash outflow from operating activities offset by a capital contribution from the State Government will finance the investing activity.
Balance sheet performance DVC’s net asset position is budgeted to decrease as a result of the expected completion, and subsequent transfer of enhancements at the Melbourne Sports and Aquatic Centre to the State Sports Centres Trust. This is offset by capital asset investments within DVC, principally due to the development of the Commonwealth Games Village.
Statement of Finances 2005-06 Victorian Communities 133
Statement of administered items The budgeted increase in Commonwealth grants is as a result of the second payment from the Commonwealth in relation to the Commonwealth Games.
Transactions administered by DVC on behalf of the State include:
• Commonwealth payments to the State;
• ANZAC Day racing proceeds;
• grants to disabled sporting groups;
• births, deaths and marriages regulatory fees; and
• proceeds from sales of assets.
Table 2.10.1: Operating statement ($ million)
2004-05 2005-06 Revised (a) Budget (a)
Income Output appropriations 378.1 559.6 Special appropriations 90.5 98.3 Revenue from other parties and other income 27.6 4.6 496.3 662.5 Expenses Employee benefits 48.8 53.3 Depreciation and amortisation 8.5 9.1 Grants and other payments 397.4 450.9 Capital asset charge 6.1 6.3 Supplies and services 50.4 146.4 511.2 666.0 Net result for the reporting period ( 15.0) ( 3.5) Net increase in asset revaluation reserve .. .. Total changes in equity other than those resulting from
transactions with the State in its capacity as owner ( 15.0) ( 3.5)
Source: Department for Victorian Communities and Department of Treasury and Finance
Note: (a) Presentation of 2004-05 revised estimates and 2005-06 Budget is based on A-IFRS. For the
presentation of 2003-04 actual results and 2004-05 Budget and revised estimates based on existing Australian Accounting Standards, refer to Appendix C.
134 Victorian Communities Statement of Finances 2005-06
Table 2.10.2: Statement of cash flows ($ million)
2004-05 2005-06 Revised Budget Cash flows from operating activities Receipts from Government 462.8 658.0Receipts from other entities 22.8 0.5Payments for supplies, grants and employees ( 546.2) ( 662.9) ( 60.5) ( 4.3)Interest received 4.1 4.1Capital asset charge ( 6.1) ( 6.3)Net cash inflow from operating activities ( 62.5) ( 6.5) Cash flows from investing activities Payments for property, plant and equipment ( 76.4) ( 24.2)Net disposal (+) of investments 32.2 20.0Net cash (outflow) from investing activities ( 44.2) ( 4.2) Cash flows from financing activities Net proceeds from capital contribution by State Government 124.1 27.4Net cash inflows/(outflow) from financing activities 124.1 27.4Net increase/(decrease) in cash held 17.4 16.6Cash at the beginning of the financial year 13.3 30.8Cash at the end of the financial year 30.8 47.4Source: Department for Victorian Communities and Department of Treasury and Finance
Statement of Finances 2005-06 Victorian Communities 135
Table 2.10.3: Balance sheet ($ million)
Estimated as at 30 June (a)(b)
2005 2006 Revised Budget Current assets Cash assets 30.8 47.4 Other financial assets 56.8 36.7 Receivables 16.0 16.0 Inventories 0.7 0.7 Other 6.0 6.0 Total current assets 110.3 106.9 Non-current assets Receivables 33.1 33.0 Property, plant and equipment 157.5 124.3 Intangible assets 0.8 0.8 Other 221.6 232.2 Total non-current assets 413.0 390.3 Total assets 523.3 497.2 Current liabilities Payables 67.0 74.8 Employee provisions 4.2 4.2 Other 0.2 0.2 Total current liabilities 71.5 79.3 Non-current liabilities Interest-bearing liabilities 0.1 0.1 Employee provisions 7.5 7.5 Total non-current liabilities 7.6 7.6 Total liabilities 79.1 86.9 Net assets 444.2 410.3 Equity Contributed capital 458.1 427.7 Reserves 42.4 42.4 Accumulated deficit ( 56.3) ( 59.9) Total equity 444.2 410.3 Source: Department for Victorian Communities and Department of Treasury and Finance
Notes: (a) Presentation of 2005-06 Budget is based on A-IFRS after restating the opening balances as at
1 July 2004. See Table 2.10.7 for details of the restated amounts. (b) Actual results for 2003-04 and 2004-05 Budget and revised estimates prior to restatement to
A-IFRS are included in Appendix C.
136 Victorian Communities Statement of Finances 2005-06
Administered income Appropriations - Payments made on behalf of the State 18.5 18.0Sale of goods and services 5.9 6.1Commonwealth grants 361.1 442.8Fees 4.1 7.7Other .. 6.0Total administered income 389.7 480.5 Administered expenses Grants and other payments 379.4 398.4Payments into the Consolidated Fund 10.3 82.0Total administered expenses 389.7 480.5Income less expenses .. .. Administered assets Receivables 0.3 0.3Total administered assets 0.3 0.3 Administered liabilities Other 0.1 0.1Total administered liabilities 0.1 0.1Source: Department for Victorian Communities and Department of Treasury and Finance Note: (a) Presentation of 2005-06 Budget is based on A-IFRS after restating the opening balances as at
1 July 2004. See table 2.10.8 for details of restated amounts.
Statement of Finances 2005-06 Victorian Communities 137
Table 2.10.5: Payments made on behalf of the State ($ million)
2004-05 2005-06 Revised Budget Current grants 18.1 17.6 Anzac Day administered trust 0.4 0.4 Total 18.5 18.0 Source: Department for Victorian Communities and Department of Treasury and Finance
Authority for resources This section provides a summary of the sources of Parliamentary authority available to the Department to fund the provision of outputs and additions to the net asset base.
Table 2.10.6: Parliamentary authority for resources ($ million)
2004-05 2005-06 Revised Budget Annual appropriations 413.8 595.9 Receipts credited to appropriations 4.0 4.1 Unapplied previous years appropriation 59.6 8.5 Gross annual appropriation 477.4 608.5 Special appropriations 90.5 98.3 Trust funds 388.5 385.1 Total Parliamentary authority 956.4 1 091.8 Source: Department for Victorian Communities and Department of Treasury and Finance
138 Victorian Communities Statement of Finances 2005-06
Table 2.10.7: Reconciliation of equity at 1 July 2004 ($ million)
Existing AAS Transition impact A-IFRS Current assets Cash assets 13.3 .. 13.3 Other financial assets 89.0 .. 89.0 Receivables 16.0 .. 16.0 Inventories 0.7 .. 0.7 Other 6.0 .. 6.0 Total current assets 125.1 .. 125.1 Non-current assets Receivables 27.3 .. 27.3 Property, plant and equipment 90.7 .. 90.7 Intangible assets 0.8 .. 0.8 Other 173.3 .. 173.3 Total non-current assets 292.2 .. 292.2 Total assets 417.3 .. 417.3 Current liabilities Payables 23.6 .. 23.6 Employee provisions 4.1 .. 4.1 Other 0.2 .. 0.2 Total current liabilities 28.0 .. 28.0 Non-current liabilities Interest-bearing liabilities 0.1 .. 0.1 Employee provisions 7.3 .. 7.3 Total non-current liabilities 7.4 .. 7.4 Total liabilities 35.4 .. 35.4 Net assets 382.0 .. 382.0 Equity Contributed capital 380.9 .. 380.9 Reserves 42.4 .. 42.4 Accumulated deficit ( 41.3) .. ( 41.3) Total equity 382.0 .. 382.0
Source: Department for Victorian Communities and Department of Treasury and Finance
Table 2.10.8: Reconciliation of administered items at 1 July 2004 ($ million)
Existing AAS Transition impact A-IFRS Administered assets Receivables 0.3 .. 0.3 Total administered assets 0.3 .. 0.3 Administered liabilities Other 0.1 .. 0.1 Total administered liabilities 0.1 .. 0.1
Source: Department for Victorian Communities and Department of Treasury and Finance
Statement of Finances 2005-06 Parliament 139
PARLIAMENT OF VICTORIA
Operating performance The Parliament, including the Victorian Auditor-General’s Office (VAGO), is estimated to have a balanced operating result for 2005-06, the same as the 2004-05 revised budget.
The operating statement shows a decrease in total operating income of $14 million (or 11.7 per cent), between the 2004-05 revised budget and the 2005-06 Budget. The decrease in special appropriation income is due to the cessation of funding, in accordance with the Parliamentary Salaries and Superannuation Act 1968, for the Parliamentary Contributory Superannuation Fund, which amounted to $16 million in 2004-05. This has also resulted in reduced expenditure on employee benefits. The decrease in special appropriation income is partially offset by additional output appropriation from the Government, including funding for:
• increased operating costs of the Parliament; and
• celebrations to mark the 150th anniversary of democratic government in Victoria.
The budget of VAGO is incorporated into the financial statements of the Parliament.
VAGO will continue to access a receipts retention agreement under Section 29 of the Financial Management Act 1994 to meet costs associated with the output, audit reports on financial statements.
Investment and financing Cash flows from investing and financing activities are expected to remain substantially unchanged in 2005-06. Payments for property, plant and equipment in 2005-06 include funding provided for the following asset initiatives in the 2005-06 Budget:
• the Parliament House Heritage Asset Strategy; and
• the development of a new financial audit application for VAGO.
Balance sheet performance The net asset position in 2005-06 is estimated to improve by $4 million compared with the 2004-05 revised budget. This is primarily a result of the additional asset funding noted above and previously funded capital works at Parliament House.
Statement of administered items VAGO administers certain resources on behalf of the State. These resources predominantly comprise financial statement audit fees collected from audited agencies under the authority of the Audit Act 1994.
140 Parliament Statement of Finances 2005-06
Table 2.11.1: Operating statement ($ million)
2004-05 2005-06 Revised (a) Budget (a)
Income Output appropriations 87.5 88.8Special appropriations 34.4 18.9 121.9 107.7Expenses Employee benefits 73.2 56.7Depreciation and amortisation 5.1 5.3Grants and other payments 0.5 0.5Capital asset charge 1.2 1.4Supplies and services 41.9 43.9 121.9 107.7Net result for the reporting period .. ..Net increase in asset revaluation reserve .. ..Total changes in equity other than those resulting from
transactions with the State in its capacity as owner .. ..
Source: Parliament of Victoria and Department of Treasury and Finance
Note: (a) Presentation of 2004-05 revised estimates and 2005-06 Budget is based on A-IFRS. For the
presentation of 2003-04 actual results and 2004-05 Budget and revised estimates based on existing Australian Accounting Standards, refer to Appendix C.
Table 2.11.2: Statement of cash flows ($ million)
2004-05 2005-06 Revised Budget Cash flows from operating activities Receipts from Government 118.7 104.1Payments for supplies, grants and employees ( 115.4) ( 100.8) 3.4 3.4Capital asset charge ( 1.2) ( 1.4)Net cash inflow from operating activities 2.2 2.0 Cash flows from investing activities Payments for property, plant and equipment ( 6.2) ( 6.1)Net cash (outflow) from investing activities ( 6.2) ( 6.1) Cash flows from financing activities Net proceeds from capital contribution by State Government 4.1 4.1Net cash inflows/(outflow) from financing activities 4.1 4.1Net increase/(decrease) in cash held .. ..Cash at the beginning of the financial year .. ..Cash at the end of the financial year .. ..Source: Parliament of Victoria and Department of Treasury and Finance
Statement of Finances 2005-06 Parliament 141
Table 2.11.3: Balance sheet ($ million)
Estimated as at 30 June (a)(b)
2005 2006 Revised Budget Current assets Receivables 0.8 0.8 Inventories 0.1 0.1 Prepayments 0.8 0.8 Total current assets 1.7 1.7 Non-current assets Receivables 27.4 30.9 Property, plant and equipment 183.3 184.1 Other 11.4 11.4 Total non-current assets 222.1 226.4 Total assets 223.7 228.1 Current liabilities Payables 2.3 2.3 Interest-bearing liabilities 1.3 1.3 Employee provisions 4.1 4.1 Other 0.4 0.4 Total current liabilities 8.2 8.2 Non-current liabilities Interest-bearing liabilities 0.8 0.8 Employee provisions 4.3 4.5 Total non-current liabilities 5.1 5.3 Total liabilities 13.3 13.5 Net assets 210.4 214.5 Equity Contributed capital 151.6 155.7 Reserves 47.3 47.3 Accumulated surplus 11.6 11.6 Total equity 210.4 214.5 Source: Parliament of Victoria and Department of Treasury and Finance
Notes: (a) Presentation of 2005-06 Budget is based on A-IFRS after restating the opening balances as at
1 July 2004. See Table 2.11.6 for details of the restated amounts. (b) Actual results for 2003-04 and 2004-05 Budget and revised estimates prior to restatement to
Administered income Sale of goods and services 14.6 15.1Total administered income 14.6 15.1 Administered expenses Payments into the Consolidated Fund 14.6 15.1Total administered expenses 14.6 15.1Income less expenses .. .. Administered assets Receivables 2.7 2.7Total administered assets 2.7 2.7 Administered liabilities Total administered liabilities .. ..Source: Parliament of Victoria and Department of Treasury and Finance
Note: (a) Presentation of 2005-06 Budget is based on A-IFRS after restating the opening balances as at
1 July 2004. See Table 2.11.7 for details of restated amounts.
Authority for resources This section provides a summary of the sources of Parliamentary authority available to the Department to fund the provision of outputs and additions to the net asset base.
Table 2.11.5: Parliamentary authority for resources ($ million)
2004-05 2005-06 Revised Budget Annual appropriations 74.6 77.8Receipts credited to appropriations 14.8 15.1Unapplied previous years appropriation 2.1 ..Accumulated surplus - previously applied appropriation 0.5 0.5Gross annual appropriation 92.1 93.3Special appropriations 34.4 18.9Total Parliamentary authority 126.5 112.3Source: Parliament of Victoria and Department of Treasury and Finance
Statement of Finances 2005-06 Parliament 143
Table 2.11.6: Reconciliation of equity at 1 July 2004 ($ million)
Existing AAS Transition impact A-IFRS Current assets Receivables 0.8 .. 0.8 Inventories 0.1 .. 0.1 Prepayments 0.8 .. 0.8 Total current assets 1.7 .. 1.7 Non-current assets Receivables 24.2 .. 24.2 Property, plant and equipment 182.2 .. 182.2 Other 11.4 .. 11.4 Total non-current assets 217.8 .. 217.8 Total assets 219.5 .. 219.5 Current liabilities Payables 2.3 .. 2.3 Interest-bearing liabilities 1.3 .. 1.3 Employee provisions 4.1 .. 4.1 Other 0.4 .. 0.4 Total current liabilities 8.2 .. 8.2 Non-current liabilities Interest-bearing liabilities 0.8 .. 0.8 Employee provisions 4.1 .. 4.1 Total non-current liabilities 4.9 .. 4.9 Total liabilities 13.1 .. 13.1 Net assets 206.4 .. 206.4 Equity Contributed capital 147.6 .. 147.6 Reserves 47.3 .. 47.3 Accumulated surplus 11.6 .. 11.6 Total equity 206.4 .. 206.4
Source: Parliament of Victoria and Department of Treasury and Finance
144 Parliament Statement of Finances 2005-06
Table 2.11.7: Reconciliation of administered items at 1 July 2004 ($ million)
Source: Parliament of Victoria and Department of Treasury and Finance
Statement of Finances 2005-06 Chapter 3 145
CHAPTER 3 – STATE REVENUE
SUMMARY OF GENERAL GOVERNMENT SECTOR REVENUE This chapter describes the major categories of revenue, comprising both state-sourced revenue and Commonwealth grants, and examines the expected movement in revenue between the 2004-05 revised estimates and the 2005-06 Budget estimates.
Total revenue comprises revenue from transactions and revenue from economic flows. Revenue from transactions represents the majority of total revenue in the 2005-06 Budget estimates.
As shown in Table 3.1, general government sector revenue and grants received are expected to increase by 4.3 per cent to $30 658 million in 2005-06.
Table 3.1: General government sector revenue and grants received ($ million)
2004-05 2004-05 2005-06 Change (a)
Budget (b) Revised Budget % Revenue from transactions Taxation 10 271.8 10 355.6 10 306.2 - 0.5 Fines and regulatory fees 729.4 627.8 726.9 15.8 Sale of goods and services 2 231.3 2 313.1 2 397.1 3.6 Investment income 1 225.5 1 323.0 1 397.9 5.7 Other revenue 1 426.2 1 368.6 1 533.4 12.0 Grants received 13 080.5 13 365.7 14 262.1 6.7 Total revenue from transactions 28 964.7 29 353.7 30 623.6 4.3 Revenue from other economic flows Investment revenue - 0.1 0.6 0.1 - 81.9 Other revenue 20.3 43.6 34.1 - 22.0 Total revenue from economic flows 20.2 44.2 34.2 - 22.7 Total revenue 28 984.9 29 397.9 30 657.7 4.3 Source: Department of Treasury and Finance
Note: (a) Change between 2004-05 Revised and 2005-06 Budget. (b) Taxation has been adjusted to exclude motor drivers’ licence fees, police learner and driver fees,
and other miscellaneous motor vehicle fees, which are now classified as regulatory fees.
146 Chapter 3 Statement of Finances 2005-06
Taxation revenue is projected to decrease by 0.5 per cent in 2005-06 relative to the revised estimate for 2004-05. The decrease in revenue reflects several factors, including:
• an expected continuing moderation in property market activity, through a softening of house prices and reduction in the volume of sales;
• the package of land tax changes announced in the 2005-06 Budget including increasing the tax free threshold, restructuring and simplifying the rate scale and bringing forward by one year the scheduled reduction in the top rate;
• the full-year effect of the abolition of mortgage duty from 1 July 2004;
• the abolition of debits tax from 1 July 2005; and
• the one-off impact of the 2004-05 agreement between Transurban and the State to redeem concession notes held by the State to construct the Tullamarine-Calder interchange.
These reductions in taxation revenue are partly offset by increases resulting from:
• additional compliance activity;
• introduction of a special land tax on trusts where the tax rate is less progressive than the ordinary marginal rate;
• the imposition of a long-stay car park levy on the owners of non-residential, long-stay, off-street car parking spaces in the Melbourne central business district and adjacent highly congested areas; and
• the increase in the annual health benefit levy by $1 500 on each electronic gaming machine.
Fines and regulatory fees revenue is expected to increase by 15.8 per cent to $727 million in 2005-06 compared to 2004-05, largely reflecting the net impact of lower than expected revenue from traffic infringements in 2004-05 arising from the identification of issues associated with the fixed road safety cameras, together with a progressive roll-out of these cameras during 2005-06 as part of the Government’s road safety initiative. From 1 July 2005, receipts collected from traffic camera and on-the-spot speeding fines will be channelled into improving Victoria's roads through the Better Roads Victoria Trust Account. This will establish a transparent link between traffic fines and Government's expenditure on roads, road safety and road maintenance programs.
From 1 January 2006, drivers who have not received any demerit points in the previous three years will receive a 25 per cent discount when they renew their drivers’ licence. This initiative will reward motorists displaying consistent safe driving behaviour and lead to improved road safety throughout the State.
Statement of Finances 2005-06 Chapter 3 147
Proceeds from the sale of goods and services are expected to increase by $84 million (or 3.6 per cent) to $2 397 million in 2005-06 compared to 2004-05. The increase reflects annual indexation of a range of fees, expected higher hospitals revenue from third parties, and increases in mortgage registration and discharge fees to be more in line with fee levels applying in other states, and to ensure sufficient cost recovery of the service.
Investment revenue from transactions is expected to increase by 5.7 per cent to $1 398 million in 2005-06 compared to 2004-05. Dividend revenue is expected to rise in 2005-06, driven by the re-commencement of dividend payments from the State Electricity Commission of Victoria and higher dividends from the water sector. The increase is substantially offset by lower income tax equivalent revenue from the public financial corporations sector. In addition, from 1 January 2006, the brown coal royalty rate will be increased to better reflect the environmental costs associated with the extraction of a natural resource.
Other revenue from transactions is expected to increase by 12.0 per cent ($165 million) compared to the 2004-05 revised estimate. The increase in other revenue largely reflects a rise in the inter-sector capital asset charge reflecting an increase in the net assets of Victorian Rail Track.
Commonwealth grants are expected to rise by $896 million (6.7 per cent) in 2005-06 compared to 2004-05. General purpose grants are forecast to increase by $486 million (6.4 per cent). The increase is higher than the estimated growth of 5.2 per cent in the estimated total GST pool because Victoria’s share of the GST revenue pool has been revised upward in the Commonwealth Grants Commission’s 2005 Update of State Revenue Sharing Relativities.
Specific purpose own use grants are expected to increase by $266 million (6.8 per cent) due to higher funding for education, human services, roads and the Commonwealth contribution to the Melbourne 2006 Commonwealth Games.
Grants for on-passing are forecast to increase by $114 million (6.7 per cent), largely because of increases in Commonwealth assistance to non-government schools.
STATE SOURCED REVENUE Taxation Taxation revenue in 2005-06 is estimated to be $10 306 million, which is $49 million (0.5 per cent) lower than the 2004-05 revised estimate (Table 3.2).
Note: (a) Change between 2004-05 Revised and 2005-06 Budget. (b) Taxation has been adjusted to exclude motor drivers’ licence fees, police learner and driver fees,
and other miscellaneous motor vehicle fees, which are now classified as regulatory fees.
Statement of Finances 2005-06 Chapter 3 149
Payroll tax Payroll tax is levied on taxable wages, which are defined to include salaries and wages, commissions, bonuses, allowances, remunerations, employer superannuation contributions, fringe benefits, and payments to some contractors. Payroll tax of 5.25 per cent is applicable to the payments of taxable wages in excess of the annual tax-free threshold of $550 000.
Payroll tax revenue for 2004-05 has been revised up significantly ($101 million) since the 2004-05 Budget Update as a result of strong actual revenue, robust employment growth and, to a lesser extent, an increase in average hours worked.
In 2005-06, revenue is expected to be $3 179 million, an increase of $185 million (6.2 per cent) over the 2004-05 revised estimate. The projected growth in 2005-06 primarily reflects expectations of modest increases in wages growth and, to a lesser degree, employment growth.
Taxes on property
Land tax Land tax is an annual tax assessed on the aggregated unimproved site value of taxable land owned by a landowner. There are several land tax exemptions, including land owned by charitable institutions, land used for primary production, and land that is used as the landowner’s principal place of residence.
The Government will be providing further substantial land tax relief worth around $823 million over five years. The major focus of these measures is to provide targeted relief to those taxpayers that have experienced large increases in their land tax liabilities in recent years as a result of rising property values, particularly for property in premium locations.
Under the reforms, around $573 million over four years will be spent on significantly reducing the middle land tax rates that apply to property holdings valued between $750 000 and $2.7 million, which is where the current land tax scale is the steepest. Cuts will be made to the 1.0 per cent rate (starting at $750 000), which will be cut to 0.5 per cent; the 1.75 per cent rate (starting at $900 000) will be cut to 1.0 per cent; the 2.75 per cent rate (starting at $1.19 million) will be cut to 1.5 per cent; and the current 3 per cent rate (starting at $1.62 million) will be cut to 2.25 per cent.
Also under these new reforms, the tax-free threshold will be increased by $25 000 to $200 000 from 2005-06. In addition, the timing of the reduction in the top marginal rate announced in the 2004-05 Budget will be brought forward by one year, at a cost of around $107 million over three years, so that the top rate will be 3.5 per cent in 2005-06, 3.25 per cent in 2006-07 and 3 per cent in 2007-08.
The Government will also be providing a general land tax rebate in 2004-05. The rebate will be based on recalculating land taxpayers’ 2004-05 land tax liability as if
150 Chapter 3 Statement of Finances 2005-06
the middle rate cuts and bracket adjustments scheduled for 2005-06 were provided in 2004-05. Under this initiative, land taxpayers will receive 50 per cent of the potential savings in the form of a land tax rebate, costing around $59 million in 2004-05.
The 2005-06 Budget also contains funding for the capping of increases in land tax liabilities in 2005-06. Under this measure, no land taxpayer will experience an increase in their land tax liability greater than 50 per cent for the 2006 land tax year with respect to land tax on the same properties in 2005.
Table 3.3 shows the rates that applied to land tax assessments in 2004-05 prior to the introduction of these initiatives and the rates that will apply in 2005-06 (2006 land tax year).
Table 3.3: Land tax rates in 2004-05 and 2005-06(a) In 2004-05 Value of property Land tax payable Up to $174 999 Nil $175 000 - $199 999 $175 plus 0.1% for each dollar over $175 000 $200 000 - $539 999 $200 plus 0.2% for each dollar over $200 000 $540 000 - $709 999 $880 plus 0.5% for each dollar over $540 000 $710 000 - $849 999 $1 730 plus 1.0% for each dollar over $750 000 $850 000 - $1 129 999 $3 130 plus 1.75% for each dollar over $900 000 $1 130 000 - $1 619 999 $8 030 plus 2.75% for each dollar over $1 190 000 $1 620 000 - $2 699 999 $21 505 plus 3.0% for each dollar over $1 620 000 $2 700 000 and over $53 905 plus 4.0% for each dollar over $2 700 000 In 2005-06 Value of property Land tax payable Up to $199 999 Nil $200 000 - $539 999 $200 plus 0.20% for each dollar over $200 000 $540 000 - $899 999 $880 plus 0.50% for each dollar over $540 000 $900 000 - $1 189 999 $2 680 plus 1.00% for each dollar over $900 000 $1 190 000 - $1 619 999 $5 580 plus 1.50% for each dollar over $1 190 000 $1 620 000 - $2 699 999 $12 030 plus 2.25% for each dollar over $1 620 000 $2 700 000 and over $36 330 plus 3.50% for each dollar over $2 700 000 Source: Department of Treasury and Finance
Note: (a) The top rate will drop to 3.25 per cent in 2006-07 and 3.0 per cent in 2007-08.
A special land tax will be levied on trusts. This involves setting a ‘special’ rate for trustees from the 2006 land tax year, that is less progressive than the ordinary marginal rate. This will help clarify the law, reduce the number of disputes, and limit the ability of taxpayers to minimise tax by disaggregating their landholdings through trusts. Revenue is projected to increase by $20 million a year under this special rate, which will compensate (to some extent) for erosion of revenue that has occurred until now.
Statement of Finances 2005-06 Chapter 3 151
From 1 January 2005, the Government has provided a full land tax exemption to all owners of private caravan parks in Victoria that supply low-cost holiday and residential accommodation. This initiative will cost around $3 million each year. Where land ceases to be exempt from land tax through a change in its use, a special land tax at the rate of 5 per cent of the unimproved value of the land will be payable. Land can cease to be exempt from land tax if it is sold for an alternative use, or if the current owner wishes to use the land for a different purpose. The valuation used to calculate the special land tax is the one that would have been used to assess land tax if the exemption had not applied.
All aged care facilities, supported resident services (SRSs) and rooming houses have been exempt from land tax from 1 January 2004. Where land ceases to be exempt from land tax through a change in its use, a special land tax at the rate of 5 per cent of the unimproved value of the land will be payable. A refund will be available to any aged care facility, SRS or rooming house that has already paid land tax during 2004 or 2005. The combined cost of these exemptions will be $13 million in 2004-05 and then $6.5 million a year thereafter.
Long-stay car parks levy From 1 January 2006, a long-stay car park levy will be imposed on the owners of non-residential, long-stay, off-street car parking spaces in the Melbourne central business district and adjacent highly congested areas such as Southbank, Docklands and the St Kilda Road precincts. Exemptions will apply to short-stay parking spaces and certain other parking, such as for ambulances and charitable institutions. The revenue raised will be used for metropolitan transport initiatives. The Government will also be providing the Melbourne City Council with $5 million a year to fund urban and transport improvements in the central business district.
Duty on financial and capital transactions
Duty on land transfers Duty is payable on instruments of transfer involved in the change of ownership of land.
In 2005-06, land transfer duty revenue is expected to be $2 076 million, a decline of $160 million (7.2 per cent) from the 2004-05 revised estimate and $370 million (15.1 per cent) below the level recorded in 2003-04.
While it is clear that the number of land transfer transactions have fallen, the majority of property market analysts indicate that the Melbourne median house price remained broadly flat.
From 2006-07 onwards, it is expected that modest growth in volumes and house prices will return, as conveyancing revenue begins to pick up again. However, it is
152 Chapter 3 Statement of Finances 2005-06
anticipated that even by 2008-09, conveyancing revenue will still be lower than the revenue recorded during the peak of the Victorian property market boom in 2003-04.
As a share of gross state product (GSP), conveyance duty is expected to decline over the projection period. Chart 3.1 shows the level and share of GSP of conveyance duty revenue, including estimates for the period 2004-05 to 2008-09.
Conveyance duty (LHS) as a percentage of nominal GSP (RHS)
Source: Department of Treasury and Finance
The rates of conveyancing duty are shown in Table 3.4.
Table 3.4: Duty on land transfers
Value of property transferred Duty payable Up to $20 000 1.4% of the value of the property $20 001 - $115 000 $280 plus 2.4% of the value in excess of $20 000 $115 001 - $870 000 $2 560 plus 6.0% of the value in excess of $115 000 $870 001 and over 5.5% of the value of the property Source: Duties Act 2000
The Victorian Government’s First Home Bonus scheme will continue for an additional two years. Victorian first homebuyers who qualify for the Government’s current $7 000 First Home Owner Grant for contracts entered into on or after 1 May 2004 can now qualify for the Victorian Government’s $5 000 First Home Bonus until 31 December 2005 (subject to a price cap of $500 000). For purchases made on or after 1 January 2006, Victorian first homebuyers can apply for a
Statement of Finances 2005-06 Chapter 3 153
$3 000 First Home Bonus for homes valued up to $500 000. The $3 000 Bonus will be available until 30 June 2007, and will continue to replace the previous stamp duty exemptions for first homebuyers with families.
Concession cardholders remain eligible for a full stamp duty exemption for purchases of homes valued at up to $250 000 and a partial exemption up to $350 000.
Duty on rental business Any rental business that receives rental revenue in excess of $6 000 in any month must register and pay rental business duty. The rate of duty is 0.75 per cent of gross rental revenue. Hire purchase agreements are also subject to rental business duty.
Following a review under the 1999 Intergovernmental Agreement on the Reform of Commonwealth-State Financial Relations (IGA), the Government has decided to remove rental business duty from 1 January 2007. This is in addition to the abolition of debits tax from 1 July 2005, which was announced in the 2004-05 Budget. Both of these measures will ensure the Government has met all of its commitments under the IGA and the subsequent agreement between the Commonwealth and a majority of state and territories to abolish additional taxes scheduled for review under that agreement.
Debits tax
Debits tax is levied on debits to accounts with a cheque facility. The duty is imposed on all debits of $1 or more to such accounts, not simply debits made by way of a cheque. As foreshadowed under the IGA and as confirmed at the Commonwealth-State Ministerial Council on Financial Relations on 26 March 2004, debits tax will cease to apply from 1 July 2005.
Metropolitan improvement levy The rate of the levy is set each year with regard to expected disbursements from the Parks and Reserves Trust Account, taking into account the inflation rate. The revenue is earmarked by the Department of Sustainability and Environment for expenditure on metropolitan parks, gardens and waterways.
Property owners’ contribution to fire brigades Municipal councils whose districts are within or partly within the metropolitan area serviced by the metropolitan fire brigade are required by legislation to contribute 12.5 per cent of the Metropolitan Fire Brigade’s statutory contribution budget allocation.
In addition, non-residential property owners, who choose to either self-insure or insure off-shore, are required by legislation to pay a contribution.
154 Chapter 3 Statement of Finances 2005-06
Levies on statutory corporations Water authorities are required to pay an annual environmental contribution to fund water-related initiatives that seek to promote the sustainable management of water and to improve environmental performance. It is anticipated that approximately $227 million will be raised from contributions over the period 1 October 2004 to 30 June 2008, with all of this revenue being used to fund water-related initiatives.
Gambling taxes Gambling taxes are imposed on private lotteries, electronic gaming machines (EGMs), the Casino, the racing industry, and some other minor forms of gambling. Most government revenue from these forms of gambling are transferred by standing appropriation to the Hospitals and Charities Fund and the Community Support Fund. In 2005-06, it is estimated that 84.3 per cent of total gambling taxation revenue will be transferred by standing appropriation to these funds.
Between June 2000 and September 2002, total player loss (the difference between the amounts bet and the amounts paid out as prizes) on gambling activities averaged 3.8 per cent of household final consumption expenditure. In 2002-03, the latest year for which comparative data are available for all States and Territories, player loss as a percentage of household final consumption expenditure in Victoria was 0.3 percentage points lower than that in New South Wales and was only 0.2 percentage points higher than the Australian average (see Chart 3.2).
Sources: The Tasmanian Gaming Commission Australian Gambling Statistics 2004; Department of Treasury and Finance
Statement of Finances 2005-06 Chapter 3 155
On 1 September 2002, the Government introduced smoking bans in gaming venues. Since the introduction of the bans, there has been a substantial decline in EGM gambling activity and, to a lesser extent, the Casino. Total player loss has declined to 3.3 per cent of household final consumption expenditure.
The 2005-06 Budget estimates assume that gambling behaviour has now adjusted to the impact of the smoking ban, with gambling player loss, and consequently gambling taxation revenue, remaining permanently lower as a result of the smoking ban.
The Government has announced the introduction of a complete smoking ban within enclosed licensed premises (with some exceptions) from 1 July 2007. The estimated impact of the complete smoking ban is to reduce total gambling player loss to 3.0 per cent of household financial consumption expenditure, a total decrease of some 21 per cent since the initial smoking ban was introduced in September 2002.
In particular, in 2004-05, it is estimated that the loss of revenue due to the impact of the smoking ban is around $250 million. Furthermore, the estimated total impact of the smoking bans over the forecast period is around $1 330 million.
Gambling taxes are expected to grow by 7.5 per cent ($103 million) in 2005-06 compared to the 2004-05 revised estimate. The main contributor to growth will be an increase in revenue from EGMs ($88 million or 10.5 per cent), in accordance with estimated growth in household final consumption expenditure and the increase in the annual health benefit levy by $1 500 per machine. The new health benefit levy of $3 033.33 on each electronic gaming machine will raise an additional $45 million each year which will be transferred into the Hospitals and Charities Fund.
Over the forward estimates period from 2006-07 to 2008-09, aggregate gambling taxation revenue is expected to grow in line with estimated growth in household final consumption expenditure, with revenue growth in the latter two years adversely affected by the introduction of the complete smoking ban within enclosed licensed premises.
Taxes on insurance
Non-life insurance Duty is payable on the value of GST-inclusive premiums at a rate of 10 per cent on general insurance business conducted in or outside Victoria, which relates to any property, risk, contingency or event in the State.
Non-life insurance revenue is expected to increase by $15 million (2.7 per cent) in 2005-06, mainly reflecting weaker premium growth than seen in recent years. Large premium falls have occurred in some classes of insurance recently and premiums are anticipated to show weak growth in 2005-06.
156 Chapter 3 Statement of Finances 2005-06
Over the forward estimates period from 2006-07 to 2008-09, revenue is forecast to grow in line with GSP growth combined with a strengthening in premium growth as a result of the expected upturn in the national pricing cycle.
Duty on compulsory third party premiums Duty is payable on the value of compulsory third party premiums at a rate of 10 per cent.
Insurance contributions to fire brigades Insurance companies are required to make contributions towards the operating costs of the two fire services in Victoria. Insurance companies generally recover their contributions through an insurance industry fire services levy imposed on premiums from policyholders.
In 2005-06, revenue from insurance contributions to fire services is anticipated to increase by $19 million (6.0 per cent) compared to the 2004-05 revised estimate. The increase includes necessary significant investment in fire-fighting vehicles, land and building infrastructure, and additional fire-fighters to ensure enhanced operational capacity and the active engagement of local government and the community.
Motor vehicle taxes Motor vehicle taxes comprise registration fees and motor vehicle duty. Other motor vehicle taxes, including drivers’ licences, have been reclassified from taxation to regulatory fees, in line with Government Finance Statistics reporting standards.
In 2005-06, aggregate motor vehicle taxation revenue is expected to grow by $74 million (6.0 per cent) compared to the 2004-05 revised estimate. The growth in revenue is due to increased vehicle registration fee revenue ($41 million, 6.0 per cent) and duty on vehicle transfers and registrations ($34 million, 6.0 per cent).
Growth in motor vehicle registration revenue is expected to arise from continued population growth and increasing motor vehicle ownership, combined with the indexation of registration fees according to the consumer price index. In addition, improved compliance measures, which were deferred in 2004-05, will be implemented in 2005-06 to ensure that concession card validity is checked electronically.
Revenue from duty on vehicle transfers and registrations is expected to grow as a result of higher transactions volumes, which are assumed to grow with gross state product. This is combined with forecast increases in car prices consistent with increases in consumer prices, resulting in increased duty per transaction.
Statement of Finances 2005-06 Chapter 3 157
Other taxes on the use of goods and services The items in this category are the landfill levy, which is aimed at reducing the volume of non-recyclable waste disposed of at Victorian landfills, concession fees payable by Transurban in respect of Melbourne City Link, and minor liquor licence fees.
Total other taxation revenue is expected to decrease by $58 million (44.2 per cent) in 2005-06 compared to the 2004-05 revised estimate. This largely reflects the impact in 2004-05 of the agreement between Transurban and the State to redeem concession notes held by the State to construct the Tullamarine-Calder interchange.
Fines and regulatory fees Fines revenue comprises revenue from traffic infringement notices, the operations of the Traffic Camera Office and payment of penalties imposed by the courts.
Fees from regulatory services are levies that are associated with the granting of a permit to engage in a particular activity or to regulate that activity.
Revenue from fines and regulatory fees is expected to increase by 15.8 per cent to $727 million in 2005-06. The increase between 2004-05 and 2005-06 largely reflects the net impact of lower than expected revenue from traffic infringements in 2004-05 arising from the identification of issues associated with the fixed road safety cameras, together with a progressive roll-out of these cameras during 2005-06 as part of the Government’s road safety initiative.
From 1 July 2005, receipts collected from traffic camera and on-the-spot speeding fines will be channelled into improving Victoria's roads through the Better Roads Victoria Trust Account. This will establish a transparent link between traffic fines and Government's expenditure on roads, road safety and road maintenance programs.
From 1 January 2006, drivers who have not received any demerit points in the previous three years will receive a 25 per cent discount when they renew their driver’s licence. This initiative will reward motorists displaying consistent safe driving behaviour and lead to improved road safety throughout the State.
158 Chapter 3 Statement of Finances 2005-06
Table 3.5: Fines and regulatory fees ($ million)
2004-05 2004-05 2005-06 Change (a)
Budget Revised Budget % Fines Police fines 350.5 247.2 324.2 31.2Court and other fines 76.4 78.5 77.2 - 1.6Total fines 426.9 325.7 401.4 23.2 Regulatory fees 302.5 302.0 325.4 7.7Total 729.4 627.8 726.9 15.8Source: Department of Treasury and Finance
Note: (a) Change between 2004-05 Revised and 2005-06 Budget.
Sale of goods and services As reported in Table 3.1, revenue from the sale of goods and services is estimated to increase by $84 million (3.6 per cent) in 2005-06, compared to the revised estimate of $2 313 million for 2004-05.
Major factors contributing to this increase are:
• the effects of annual indexation of a range of fees and charges; and
• forecast increases in hospitals revenue from other parties, including commercial and private practice arrangements, ambulance services and aged care residential services, which provide funding for the health sector. The expected revenue also includes increased Commonwealth fees received for the provision of hospital services to veterans.
The registration and discharge of a mortgage incurs a fee whenever a mortgage over property is registered or discharged on a land title. Mortgage registration and discharge fees will increase from the current $45 to $75 in 2005-06 to align them with fee levels applying in other states.
Investment revenue Investment revenue includes interest, royalties, dividends and other investment revenue. Dividends and other investment revenue consists primarily of the dividends and income tax and rate equivalent payments made to the State by government business enterprises.
Statement of Finances 2005-06 Chapter 3 159
Table 3.6: Investment revenue ($ million)
2004-05 2004-05 2005-06 Change (a)
Budget Revised Budget % Revenue from transactions Dividends 478.1 512.1 699.9 36.7 Income tax and rate equivalent revenue 186.5 332.8 203.6 - 38.8 Interest 435.4 356.4 361.7 1.5 Royalties 43.3 43.3 55.7 28.5 Rents 15.6 15.2 15.3 0.7 Other 66.5 63.1 61.6 - 2.4 Total revenue from transactions 1 225.5 1 323.0 1 397.9 5.7 Revenue from other economic flows Gain on investments - 0.1 0.6 0.1 - 81.9 Total revenue from transactions 1 225.4 1 323.5 1 398.0 5.6 Source: Department of Treasury and Finance
Note: (a) Change between 2004-05 Revised and 2005-06 Budget.
In 2005-06, total investment revenue is estimated to increase by $75 million (5.6 per cent) compared to the 2004-05 revised estimate.
Dividend revenue is expected to increase in 2005-06 chiefly reflecting the re-commencement of dividend payments from the SECV and higher dividends from the water sector. In addition, the payment by Treasury Corporation of Victoria of a special dividend in 2005-06 will contribute to higher dividend payments in 2005-06 compared to 2004-05.
The effect of this increase is substantially offset by lower tax equivalent revenue from the public financial corporations sector in 2005-06 based on higher claims costs forecasts, and the fact that income tax equivalent revenue in 2004-05 was boosted by some unanticipated revenue associated with the previous year. In addition, the announced 10 per cent reduction in the average premium rate will result in reduced revenue from the Victorian WorkCover Authority.
From 1 January 2006, the brown coal royalty rate will be increased to 5.88 cents per gigajoule unit of coal. The new rate will better reflect the environmental costs associated with the extraction of a natural resource, and will ensure that the State receives a fairer share of the returns to the industry from extracting brown coal. It is estimated that additional revenue of $8 million will be recognised in 2005-06 with full year additional revenue of $17 million each year.
Other revenue In 2005-06, total other revenue is expected to increase by 11.0 per cent ($155 million) compared to the 2004-05 revised estimate.
160 Chapter 3 Statement of Finances 2005-06
Table 3.7: Other revenue ($ million)
2004-05 2004-05 2005-06 Change (a)
Budget Revised Budget % Revenue from transactions Fair value of assets received free of charge .. 1.6 22.0 1 290.6Inter sector capital assets charge 587.5 599.4 778.8 29.9Other revenue 838.7 767.6 732.6 - 4.6Other revenue from transactions 1 426.2 1 368.6 1 533.4 12.0Revenue from other economic flows Gain/(loss) from disposal of physical assets 11.9 35.2 25.7 - 27.2Other revenue 8.4 8.4 8.4 ..Other revenue from economic flows 20.3 43.6 34.1 - 22.0Other revenue 1 446.4 1 412.2 1 567.4 11.0Source: Department of Treasury and Finance
Note: (a) Change between 2004-05 Revised and 2005-06 Budget.
The increases in other revenue between 2004-05 and 2005-06 largely reflects an rise in the inter-sector capital charge reflecting an increase in net assets of Victorian Rail Track.
GRANTS Summary information on the amounts budgeted to be received under the various grant categories in 2004-05 and 2005-06 is shown in Table 3.8.
General purpose grants General purpose grants to Victoria are made up of GST grants and National Competition Policy payments. Revenue in 2005-06 is expected to increase by $486 million (6.4 per cent) compared to the 2004-05 revised estimate.
Statement of Finances 2005-06 Chapter 3 161
Table 3.8: Grants ($ million)
2004-05 2004-05 2005-06 Change (a)
Budget Revised Budget % Current grants GST grants 7 078.6 7 362.4 7 854.9 6.7 National Competition Policy 203.1 201.6 195.5 - 3.0 General purpose grants 7 281.7 7 564.0 8 050.4 6.4 Commonwealth specific purpose grants 3 486.6 3 577.4 3 844.4 7.5 Specific purpose grants for on-passing 1 561.5 1 577.8 1 686.3 6.9 Other current grants 167.3 115.4 126.7 9.8 Total current grants 12 497.2 12 834.7 13 707.7 6.8 Capital grants Commonwealth specific purpose grants 455.0 342.2 341.7 - 0.2 Specific purpose grants for on-passing 127.9 126.9 132.3 4.3 Other capital grants 0.4 62.0 80.3 29.6 Total capital grants 583.4 531.0 554.3 4.4 Total grants 13 080.5 13 365.7 14 262.1 6.7 Source: Department of Treasury and Finance
Note: (a) Change between 2004-05 Revised and 2005-06 Budget.
In accordance with the IGA, the States and Territories receive all GST revenue. The GST grant distributions between States and Territories are determined by the GST relativities that are recommended by the Commonwealth Grants Commission (CGC) to the Commonwealth Government.
In 2005-06, GST grants are expected to increase by $493 million (6.7 per cent) compared to the 2004-05 revised estimate. This compares with an estimated growth of 5.2 per cent in the estimated total GST pool. Victoria’s share of GST growth is higher than overall GST growth because Victoria’s share of the GST revenue pool has been revised upward in the CGC 2005 Update of State Revenue Sharing Relativities.
The Agreement to Implement National Competition Policy and Related Reforms 1995 provided for a series of competition payments to States and Territories from the Commonwealth. The competition payments were in exchange for implementation of reform commitments contained in this and other agreements that were collectively known as the National Competition Policy (NCP) Agreements. The criteria for receipt of the full amount of competition payments by the States and Territories related to satisfactory progress in implementing these commitments.
The competition payments were designed to return to States and Territories the benefits of their reforms that are disproportionately realised by the Commonwealth through revenue effects on the Commonwealth Budget.
162 Chapter 3 Statement of Finances 2005-06
The Commonwealth Government has decided to cease making NCP payments to the States and Territories from 2006-07 at an annual cost to Victoria of over $200 million each year.
In 2005-06, NCP payments to Victoria will decrease by $6 million (3.0 per cent) compared to the 2004-05 revised estimate. The decrease reflects the non-recurring Commonwealth decision to pay Victoria in 2004-05 the amount it withheld from the State in 2003-04.
Specific purpose grants Table 3.9 through to Table 3.13 shows a breakdown by agency of the specific purpose grants.
Specific purpose own use grants are expected to increase by $266 million (6.8 per cent) due to higher funding for education, human services, roads and the Commonwealth contribution to the Melbourne 2006 Commonwealth Games.
Specific purpose grants for on-passing are forecast to increase by $114 million (6.7 per cent), largely because of increases in Commonwealth assistance to non-government schools.
The detailed estimates provided in this chapter represent the latest information available to the Victorian Government. However, the Commonwealth budget is not due to be brought down until 10 May 2005 and, as a result, there may be variations to some of the information published in this chapter.
Education and training Commonwealth funding is provided for a range of Commonwealth and state programs for government and non-government schools, and for vocational education and training. Funds are also provided to support Victoria’s participation in national priority programs.
For school programs, the Commonwealth legislates funding allocations quadrennially without predicting likely cost movements over time. Supplementary funding is then provided retrospectively through regulation to meet any changes in costs that have occurred over the period.
Statement of Finances 2005-06 Chapter 3 163
Table 3.9: Department of Education and Training – Commonwealth specific purpose grants
($ million) 2004-05 2004-05 2005-06 Change (a)
Budget Revised Budget % Current grants Assistance to government schools 385.8 387.8 417.9 7.8 Commonwealth TAFE 221.7 221.7 225.7 1.8 Strategic assistance for improving student
outcomes 61.3 64.1 66.8 4.2
Special learning needs - ESL new arrivals 13.0 13.4 14.1 4.5 Special Commonwealth projects 6.6 6.6 6.6 .. All other current grants 10.5 10.5 11.2 6.6 Total current grants 698.9 704.2 742.3 5.4 Capital grants Government schools 58.9 58.9 60.4 2.4 Commonwealth TAFE 42.5 42.5 42.5 .. Total capital grants 101.4 101.4 102.9 1.4 Total specific purpose grants 800.3 805.7 845.1 4.9 Source: Department of Treasury and Finance
Note: (a) Change between 2004-05 Revised and 2005-06 Budget.
Current funding to schools is supplemented according to changes in actual per student costs in government schools (known as the Average Government School Recurrent Cost Index). Capital funding is supplemented in accordance with movements in the Building Price Index.
Commonwealth financial assistance for schools is appropriated through the Schools Assistance (Learning Together – Achievement Through Choice and Opportunity) Act 2004 (which replaces the State Grants (Primary and Secondary Education Assistance) Act 2000). Funding conditions are specified in detail in the Quadrennial Funding Agreement and associated administrative guidelines and regulations. The new Quadrennial Funding Agreement is yet to be approved by the State, subject to the finalisation of accountability requirements. The forward estimates have been adjusted to reflect the expected funding allocations, but the program titles for the previous quadrennium have been retained in the absence of a finalised Quadrennial Funding Agreement for January 2005 to December 2008.
Commonwealth funding for vocational education and training is appropriated and distributed under the Australian National Training Authority Act 1992 (Commonwealth). How the funds are utilised is subject to an annual Agreement with the Australian National Training Authority (ANTA) Ministerial Council, of which Victoria is a member along with the other States and Territories and the Commonwealth.
164 Chapter 3 Statement of Finances 2005-06
Assistance to government schools is provided under the Commonwealth Government’s Schools Assistance (Learning Together – Achievement Through Choice and Opportunity) Act 2004 which helps government schools with the recurrent costs of school education.
In 2005-06, assistance to government schools is estimated to be $418 million, an increase of $30 million (7.8 per cent) compared to the revised 2004-05 funding.
Human Services The Department receives a large number of specific purpose payments from the Commonwealth for various programs. Specific purpose grants in 2005-06 are expected to increase by $89 million (3.2 per cent), compared to the 2004-05 revised estimate.
Statement of Finances 2005-06 Chapter 3 165
Table 3.10: Department of Human Services – Commonwealth specific purpose grants
($ million) 2004-05 2004-05 2005-06 Change (a)
Budget Revised Budget % Current grants Health care grant 1 903.4 1 902.9 2 003.7 5.3 Home and community care 201.3 201.2 214.5 6.6 Disability services 127.9 128.0 131.9 3.1 Commonwealth-State Housing Agreement -
other public housing 115.7 151.3 195.6 29.3
Highly specialised drugs program 100.0 98.0 108.0 10.2 Public health outcome funding agreement 70.2 36.7 38.6 5.1 Compensation for extension of pensioner
Special education program 6.5 7.2 7.4 1.8 All other current grants 8.9 24.3 7.7 - 68.3 Total current grants 2 652.5 2 712.8 2 855.5 5.3 Capital grants Commonwealth State Housing Agreement -
untied grants 78.6 42.4 0.0 - 100.0
Pathways Home 20.0 14.7 3.4 - 76.8 Commonwealth radiology funding 2.6 6.0 6.0 .. Commonwealth State Housing Agreement -
Indigenous housing 3.1 2.8 2.8 0.7
Total capital grants 104.3 65.8 12.2 - 81.4 Total specific purpose grants 2 756.8 2 778.6 2 867.7 3.2 Source: Department of Treasury and Finance
Note: (a) Change between 2004-05 Revised and 2005-06 Budget.
Health care grant This grant is provided through the Australian Health Care Agreement to assist Victoria to meet the cost of providing public hospital services to eligible persons, including admitted and non-admitted patients and those requiring emergency care. In 2005-06, this grant is expected to increase by $100 million (5.3 per cent) due to allowance for population growth and ageing, demand growth and cost indexation.
166 Chapter 3 Statement of Finances 2005-06
Commonwealth-State Housing Agreement
The Commonwealth-State Housing Agreement provides funding for the provision of housing assistance, including the public, community and Indigenous housing sectors, to low income Victorians.
The agreement focuses on improving workforce incentives and attracting investment from the non-government sector. Opportunities to ensure housing assistance links are effectively made with other programs are also featured in the agreement.
The presentation of Commonwealth funding through the agreement has been amended for 2005-06 to reflect a revised definition of ‘contributed capital’ for the Office of Housing based on annual additions to housing stock funded from State appropriations (excluding stock acquisitions funded through tied Commonwealth grants). Overall funding will be maintained in accordance with the agreement.
Australian Immunisation Agreement The Australian Immunisation Agreement provides funding and accountability mechanisms to enable Victoria and the Commonwealth to work cooperatively to prevent major vaccine preventable diseases. This is achieved through the provision of free immunisation of eligible cohorts and minimisation of vaccine wastage.
In 2005-06, this grant is expected to decrease by $19 million (44.0 per cent), reflecting a reduction in the Commonwealth Meningococcal C vaccination program, and a change in indexation provided by the Commonwealth.
Capital grants - Pathways Home program This five-year program, which is part of the Australian Health Care Agreement 2003-2008, is aimed at providing greater focus on the care and services provided to support the transition of patients from hospital to home. In 2005-06, capital funding for this program is expected to decrease by $11 million (76.8 per cent), reflecting the requirements in 2005-06 to deliver this five year project.
Current specific purpose grants – all other departments Current specific purpose grants for all other departments in 2005-06 are expected to increase by $86 million (53.8 per cent), compared to the 2004-05 revised estimate.
Statement of Finances 2005-06 Chapter 3 167
Table 3.11: All other departments – Commonwealth current specific purpose grants
($ million) 2004-05 2004-05 2005-06 Change (a)
Budget Revised Budget % Infrastructure Interstate road transport 9.5 9.5 9.5 .. Innovation, Industry and Regional
Development .. .. .. ..
Current grants 0.0 0.2 0.1 - 24.5 Justice Compensation for transfer of corporate
regulatory functions to Commonwealth 44.1 44.1 44.1 ..
Legal Aid 27.9 28.9 28.9 .. All other current grants 1.0 3.8 1.0 - 74.3 73.0 76.8 74.0 - 3.7 Primary industries Exceptional circumstances relief payments 10.0 10.0 8.0 - 20.0 FarmBis III 2.5 2.5 2.0 - 20.0 Domestic Animals Act – municipal specific
purpose payments 1.7 1.7 1.7 ..
14.2 14.2 11.7 - 17.6 Sustainability and Environment National action plan – salinity and water quality 22.4 22.5 22.5 .. National heritage trust – Envirofund 10.0 25.0 25.0 .. All other current grants 0.1 6.3 6.3 .. 32.5 53.8 53.8 .. Treasury and Finance Borrowing cost compensation 5.0 5.0 34.9 599.3 All other 1.1 0.7 0.3 - 61.7 6.0 5.7 35.2 521.5 Victorian Communities Commonwealth contribution – Melbourne 2006
Commonwealth games 0.0 0.0 62.3 (n.a)
All other 0.0 0.3 0.0 - 91.4 0.0 0.3 62.3 (n.a) Total 135.2 160.4 246.6 53.7 Source: Department of Treasury and Finance
Note: (a) Change between 2004-05 Revised and 2005-06 Budget.
168 Chapter 3 Statement of Finances 2005-06
Major variations to current specific purpose grants between 2004-05 and 2005-06 are:
• exceptional circumstances relief payments (Primary Industries): these grants represent the Commonwealth’s share of interest rate subsidies for Victorian farms in municipalities enduring hardship resulting from a range of conditions, including drought. The requirement for these grants is expected to decline by $2.0 million in 2005-06 compared to 2004-05 due to projected improvement within drought affected areas throughout Victoria;
• borrowing cost compensation (Treasury and Finance): the basis of compensation to Victoria is set out in an agreement between the Commonwealth and Victoria, referred to in section 10 of the Schedule to the Financial Agreement Act 1994. The significant increase in the debt redemption assistance payment to Victoria in 2005-06 is due to a final balloon payment coinciding with the cessation of the debt arrangements between the Commonwealth and Victoria. This final payment represents a net present value of the annual compensation payments out to 2039-40; and
• Commonwealth contribution – Melbourne 2006 Commonwealth Games (Victorian Communities): the timing of the Commonwealth contribution towards the Melbourne 2006 Commonwealth Games, announced in the Commonwealth 2004-05 Budget, provided for a bringing forward of $40 million of funding in 2003-04, with $62 million to be provided in 2005-06.
Capital specific purpose grants – all other departments Capital specific purpose grants for all other departments in 2005-06 are expected to increase by $52 million (29.6 per cent), compared to the 2004-05 revised estimate (see Table 3.12).
Table 3.12: All other departments – Commonwealth capital specific purpose grants
($ million) 2004-05 2004-05 2005-06 Change (a)
Budget Revised Budget % Infrastructure Roads 247.3 172.9 224.6 29.9 Sustainability and Environment National heritage trust - Wimmera-Mallee
pipeline 2.0 2.0 2.0 ..
Total 249.3 174.9 226.6 29.6Source: Department of Treasury and Finance
Note: (a) Change between 2004-05 Revised and 2005-06 Budget.
Statement of Finances 2005-06 Chapter 3 169
The Commonwealth contributes roads funding through AusLink, the new integrated approach to road and rail development launched in June 2004. AusLink provides for funding to key road and rail links throughout Australia that are of national significance. Through AusLink, the Commonwealth has committed over $1.5 billion over five years to the development of Victorian road and rail infrastructure that are part of the AusLink national network. The State and Commonwealth, however, are yet to complete the AusLink bilateral agreement.
Major roads included in the AusLink national network are the Hume Highway, Western Highway, Princes Freeway, Monash Freeway and Calder Freeway. Rail links between Geelong and Mildura, Melbourne, Sydney and Adelaide are also included in the national network.
In 2005-06, roads grants are estimated to be $225 million, an increase of $52 million (or 29.9 per cent) compared to revised 2004-05 funding. The increase is the result of rephasing of revenue received from the Commonwealth for a number of road projects, such as works being conducted on the Hume and Goulburn Valley Highways, and to progress current projects, including construction of the Albury/Wodonga Bypass.
Specific purpose grants for on-passing The State also receives specific purpose grants which are ‘on-passed’ to various bodies such as non-government schools and local government authorities. In such cases, the State simply acts as the vehicle for distributing the Commonwealth funds.
Specific purpose grants for on-passing in 2005-06 are estimated to be $1 819 million, an increase of some $114 million on the 2004-05 revised estimate.
Table 3.13: Commonwealth specific purpose grants for on-passing ($ million)
2004-05 2004-05 2005-06 Change (a)
Budget Revised Budget % Current grants Assistance to non-government schools 1 234.7 1 250.9 1 343.6 7.4 Financial assistance grants to local government 268.3 263.3 278.0 5.6 Targetted programs for non-government
schools 58.6 63.6 64.7 1.7
Total current grants 1 561.5 1 577.8 1 686.3 6.9 Capital grants Identified local roads grants to local
government 98.9 97.6 102.5 5.0
Non-government schools 29.0 29.3 29.9 2.0 Total capital grants 127.9 126.9 132.3 4.3 Total specific purpose grants 1 689.5 1 704.7 1 818.6 6.7
Source: Department of Treasury and Finance
Note: (a) Change between 2004-05 Revised and 2005-06 Budget.
170 Chapter 3 Statement of Finances 2005-06
Assistance for non-government schools Assistance is provided to non-government schools for operating and capital costs of school education. It is a major revenue source for a large proportion of non-government schools. Under the Commonwealth’s socio-economic status (SES) of school communities model, the minimum funding entitlement on a per student basis is set at 13.7 per cent of the Average Government School Recurrent Costs (AGSRC), and payable to schools with an SES score of 130 points or more. The maximum payment is set at 70 per cent of the AGSRC and payable to schools with SES scores of 85 points or below.
Funding to non-government schools is expected to increase by $93 million (7.4 per cent) in 2005-06, compared to the 2004-05 revised estimate.
General purpose financial assistance to local government An equal per capita basis for distributing total assistance to the States and Territories occurs pursuant to the Local Government (Financial Assistance) Act 1995. These grants are estimated to increase by $15 million (5.6 per cent) between 2004-05 and 2005-06, reflecting an upwards revision of the Commonwealth’s estimates of CPI and population growth.
Statement of Finances 2005-06 Chapter 4 171
CHAPTER 4 – TAX EXPENDITURES AND CONCESSIONS
TAX EXPENDITURES Tax expenditures are tax concessions granted to certain taxpayers, activities or assets, which are a deviation from the normal taxation treatment. This includes tax-free thresholds and can also take the form of exempting or applying a lower rate, deduction or rebate of a tax for a certain class of taxpayer, activity or asset (this excludes generally applying marginal tax rates).
Table 4.1 shows aggregate tax expenditure estimates by the main categories of tax for the period 2004-05 to 2008-09. Total estimated tax expenditures are expected to increase by $103 million between 2004-05 and 2008-09. Despite some year-to-year variation, land tax expenditures are anticipated to fall slightly between 2004-05 and 2008-09. Payroll tax expenditure estimates are expected to increase steadily over the forward years, reflecting general strength in employment, wage growth and payroll tax forecasts. Estimates of gambling tax expenditures are expected to fall slightly in 2007-08, with the further implementation of smoking bans, before increasing again thereafter.
Table 4.1: Aggregate tax expenditures (excluding thresholds) by type of tax ($ million)
Table 4.2 lists the estimated individual tax expenditures that can be costed for the period 2004-05 to 2008-09 (including tax-free thresholds).
Including the estimated value of the tax-free thresholds for land and payroll tax, the total value of tax assistance provided by the Government is estimated at $3.7 billion in 2005-06, growing to $3.9 billion by 2008-09.
172 Chapter 4 Statement of Finances 2005-06
Victorian first homebuyers who qualify for the Government’s current $7 000 First Home Owner Grant for purchases made on or after 1 May 2004 also now qualify for the Victorian Government’s $5 000 First Home Bonus until 31 December 2005 (subject to a price cap of $500 000). For purchases made on or after 1 January 2006, Victorian first homebuyers can apply for a $3 000 First Home Bonus for homes valued up to $500 000. The $3 000 bonus will be available until 30 June 2007, and will continue to replace the previous stamp duty exemption for first homebuyers with families.
Several initiatives have been announced in the 2005-06 Budget, which will have implications for land tax expenditure estimates, including:
• the tax-free threshold has been increased by $25 000 to $200 000 in 2005-06;
• the 1.0 per cent rate (starting at $750 000) will be cut to 0.5 per cent; the 1.75 per cent rate (starting at $900 000) will be cut to 1.0 per cent; the 2.75 per cent rate (starting at $1.19 million) will be cut to 1.5 per cent; and the second top rate (starting at $1.62 million) will be cut to 2.25 per cent; and
• the scheduled reduction in the top rate will be brought forward by one year, so that the top rate will be reduced to 3.5 per cent in 2005-06, 3.25 per cent in 2006-07 and 3.0 per cent in 2007-08.
New land tax exemptions have also been announced in the 2005-06 Budget for all aged care facilities, supported resident services (SRSs) and rooming houses. This will apply from 1 January 2004 with a refund available to any aged care facility, SRS or rooming house that has already paid land tax during 2004 and/or 2005. Where land ceases to be exempt from land tax through a change in its use, a special land tax at the rate of 5 per cent of the unimproved value of the land will be payable.
This is in addition to the land tax exemption for caravan parks announced in the 2004-05 Budget Update. Since 1 January 2005, the Government has been providing a full land tax exemption to all owners of private caravan parks in Victoria that supply low-cost holiday and residential accommodation. Where land ceases to be exempt from land tax through a change in its use, a special land tax at the rate of 5 per cent of the unimproved value of the land will be payable. This initiative will cost $3 million per year.
As well as the effects of the new land tax exemptions and land tax reforms, improved State Revenue Office methodologies and data collection have changed estimates of several land tax expenditures. In particular, the estimates for principal place of residence and primary production have been revised upward since the 2004-05 Budget.
The estimates of several payroll tax expenditures have also been revised upward relative to last year’s budget, reflecting data and methodology enhancements. Enhanced data collection has resulted in improved estimates of potential payroll tax paid in exempt sectors, leading to higher estimates of payroll tax forgone. This has
Statement of Finances 2005-06 Chapter 4 173
caused large upward revisions to the estimated tax expenditures for non-profit, non-public schools, benevolent institutions and charities, municipal councils and public hospitals.
Also a new payroll tax exemption will be provided to government school councils backdated to 1 July 2004. This will bring government school councils into line with arrangements for non-government schools. The strength in the wage base and general employment growth has also contributed to the higher estimates for payroll tax expenditures. These factors mean that total payroll exemptions in 2005-06 are $179 million higher than estimated in the 2004-05 Budget.
Corporate reconstruction comprises the majority of tax expenditures in other stamp duties. Due to the tendency for the overall estimate to be influenced greatly by large, one-off exemptions, the actual tax expenditure can vary significantly from year to year. This means that actual exemptions may differ significantly from estimates.
Alterations to 2005-06 estimates Due to the discovery of a compilation error in the originally published 2005-06 figure for payroll tax expenditures (excluding thresholds), the previously reported $694 million for 2004-05 has been amended to $639 million. A similar amendment has been made to each of the forward estimates. The error applied to payroll tax expenditures for public hospitals and non-profit, non-public schools. This affected Tables 4.1, 4.2, 4.3 and 4.4 and associated commentary.
174 Chapter 4 Statement of Finances 2005-06
Table 4.2: Tax expenditures that can be costed (including thresholds) ($ million)
Description 2004-05 2005-06 2006-07 2007-08 2008-09 Estimate Estimate Estimate Estimate EstimateLand tax exemptions Crown Property (right of Victoria) 299 289 297 294 297Principal place of residence 424 409 421 416 421Land held in trust for public or
municipal purposes or vested in any municipality
122 117 121 119 121
Land used by a charitable institution 74 71 73 73 73Commonwealth land 86 83 85 84 85Land used for primary production 112 108 111 109 111Land vested in a public statutory
authority 77 74 76 75 76
Land used for the City Link network 12 12 12 12 12Land used for EastLink 10 10 10 10 10Assessment on a single holding basis
for land owned by a municipality 2 2 2 2 2
Partial exemption for non-profit organisations solely for social, sporting, cultural, literary purposes; or horse, pony or harness racing
17 17 17 17 17
Assessment on a single holding basis for land owned by a charity
Total gambling tax expenditures 63 67 72 69 73 Other stamp duties exemptions Stamp duty for corporate
reconstruction 106 106 106 106 106
Conveyance duty concession for family first homebuyers
.. 0 0 1 1
Conveyance duty concession for concession cardholders
25 24 24 24 25
Total other stamp duties expenditures
131 130 130 131 132
Motor vehicle tax expenditures Motor vehicle registration fee for
eligible beneficiaries 61 60 64 67 71
Registration fee for primary production vehicle (4.5 tonnes or less)
4 4 4 4 4
Registration fee concession for commercial school buses
1 1 1 1 1
Exemption for non-commercial vehicle owned by an incapacitated war service pensioner
1 1 1 1 1
Motor vehicle duty concession for incapacitated and disabled persons
.. .. .. .. ..
Total motor vehicle tax expenditures
67 66 70 73 77
Total estimated tax expenditures 3 734 3 738 3 822 3 856 3 923 Source: Department of Treasury and Finance
176 Chapter 4 Statement of Finances 2005-06
The ratio of tax expenditures to tax revenue for 2004-05 is estimated at 21 per cent (Table 4.3), compared with 19 per cent in 2003-04. The increase is mainly associated with upward revisions to land and payroll tax expenditure estimates following improvements in estimation techniques and data collection.
Table 4.3: Estimated aggregate tax expenditures (excluding thresholds) and tax revenue in 2004-05
Table 4.4 provides a grouping of estimated tax expenditures to particular persons or entities based on the legal incidence of state taxes. The increases in tax expenditures for hospitals, charitable organisations, Commonwealth and state governments and educational institutions are expected to drive the increase in tax expenditures out to 2008-09.
Table 4.4: Aggregate tax expenditures (excluding thresholds) classified by persons or entities affected
Other 11 11 11 12 13Total for items estimated 2 209 2 186 2 251 2 262 2 312Source: Department of Treasury and Finance
Statement of Finances 2005-06 Chapter 4 177
CONCESSIONS This is the second year that concessions have been reported on by the Victorian Government in a consolidated manner. The aim is to improve the transparency of an important and growing component of state assistance to disadvantaged Victorians.
Concessions are a direct budget outlay or reduction in government charges that has the effect of reducing the price of a good or service for particular groups. Certain characteristics of the consumer, such as possession of a Commonwealth pension card or a health care card, are the basis for entitlement. Concessions allow certain groups in the community to access and/or purchase important amenities like energy, education, health and transportation at a cheaper rate or zero cost.
Chart 4.1 shows the estimated expenditure on concessions by category for 2004-05. The majority of concessions are concentrated in health, accounting for 34 per cent of total concessions. Transport and energy, municipal rates, water and sewerage both represent 26 per cent of total concessions. Education comprises 12 per cent of total concessions and other concessions represent 2 per cent.
Chart 4.1: Estimated concessions by category 2004-05
Private transport15%
Public transport11%Dental and other
health17%
Ambulance17%
Other2%
Education12%Energy, municipal
rates, water and sewerage
26%
Source: Department of Treasury and Finance and Department of Human Services Concessions Unit Annual Report
Table 4.5 classifies the major concessions provided by the Victorian Government by the various categories. The estimated total value of major concessions in 2004-05 is $903 million, up from $831 million in 2003-04.
178 Chapter 4 Statement of Finances 2005-06
Table 4.5: Estimated concessions by category(a)(b) ($ million)
Description 2003-04 2004-05 2005-06 Actual Estimate Estimate
Energy, municipal rates, water and sewerage 227 248 249Education 96 110 119Health 286 304 304Hardship assistance 14 14 14Transport 208 227 246Total for items estimated 831 903 932Source: Department of Treasury and Finance and Department of Human Services Concessions Unit Annual Report
Notes: (a) These figures include the cost of administration. (b) Department of Treasury and Finance estimates have been used for some of the 2004-05 and
2005-06 figures.
The energy category mainly includes concessions for electricity and gas usage, as well as several other smaller concessions related to energy usage. Concessions are given for municipal rates and water and sewerage charges. Education concessions include the education maintenance allowance and the student transport allowance.
Health is the largest category and includes free emergency ambulance transport for concession cardholders, as well as school, community and specialist dental services and optical concessions. Health also includes the community health programs.
The hardship assistance programs category includes the utility relief and capital grant schemes and trustees services. These schemes provide one-off assistance to concession cardholders for, among other things, the upgrade of essential appliances or to pay utility bills in the event of an unforeseen financial crisis. Trustee services include the provision of administration services for people unable to manage their own financial affairs.
Transport concessions consist of a discount on Transport Accident Commission premiums for pensioners and funding for the multi-purpose taxi program, as well as public transport concessions.
Statement of Finances 2005-06 Chapter 5 179
CHAPTER 5 – PUBLIC ACCOUNT
The Public Account is the Government’s official bank account. The Public Account holds the cash balances of the Consolidated Fund and the Trust Fund.
The Public Account is maintained at one or more banks, as required by the Financial Management Act 1994 (FMA). The State’s financial transactions on the Public Account are recorded in a public ledger.
The FMA also provides for:
• temporary advances from the Public Account for a number of purposes related to the needs of the Government;
• investment of the Public Account in trustee securities; and
• temporary borrowings, should the balance in the Consolidated Fund be insufficient to meet commitments during a financial year.
CONSOLIDATED FUND The Consolidated Fund is the Government’s primary financial account, established by the FMA, and receives all Consolidated Revenue under the Constitution Act 1975 from which payments, appropriated by the Parliament, are made.
THE TRUST FUND Within the Public Account, the Trust Fund embraces a range of special purpose accounts established for funds that are not necessarily subject to State appropriation. Examples of these accounts include specific purpose payments from the Commonwealth on-passed by the State to third parties, accounts holding balances in suspense accounts for accounting purposes, working accounts for commercial and departmental service units, and accounts facilitating the receipt and disbursement of private funds held by the State in trust. Additional funds may also be established within the Trust Fund to receive State revenues hypothecated to particular purposes (e.g. lotteries revenue for hospitals and charities).
180 Chapter 5 Statement of Finances 2005-06
Table 5.1: The Consolidated Fund
Estimated receipts and payments for the year ending 30 June 2005 and for the year ending 30 June 2006.
($ million) 2004-05 2005-06 Variation Budget Budget % Receipts Taxation (a) 10 255 10 296 0.4 Fines and regulatory fees (a) 416 502 20.7 Grants received 10 929 11 945 9.3 Sales of goods and services (including Section 29 FMA
annotated) 582 641 10.3
Interest received 249 150 - 39.6 Public authority income 700 1 047 49.5 Other receipts 2 408 2 632 9.3 Total operating activities 25 538 27 214 6.6 Total cash inflows from investing and financing 66 35 - 47.4 Total receipts 25 604 27 249 6.4 Payments Special appropriations 1 477 1 571 6.3 Appropriations (b) Provision of outputs 20 646 22 383 8.4 Additions to the net asset base 1 237 1 443 16.6 Payments made on behalf of the State 1 760 1 454 - 17.4 Receipts credited to appropriation Provision of outputs 1 495 1 634 9.3 Additions to the net asset base 179 88 - 50.8 Sub total 26 795 28 572 6.6Applied appropriations remaining unspent relating to the
2004-05 appropriations - 313 - 337
Total payments 26 483 28 235 6.6Source: Department of Treasury and Finance
Notes: (a) Taxation has been adjusted to exclude motor drivers’ licence fees, police learner and driver fees,
and other miscellaneous motor vehicle fees, which are now classified as regulatory fees. (b) Includes unspent appropriations carried over from the previous year.
Statement of Finances 2005-06 Chapter 5 181
Table 5.2: Consolidated Fund receipts ($ thousand)
2004-05 2005-06 Variation Budget Budget % Operating receipts Taxation Payroll tax 3 233 802 3 554 140 9.9 Land Tax 916 672 824 260 -10.1 Long-stay car parks levy 19 400 .. Stamp duty Land transfer duty 2 249 700 2 074 616 -7.8 Stamp duties 114 054 63 600 -44.2 Financial accommodation levy 7 434 10 196 37.2 Financial transaction taxes 248 900 21 500 -91.4 Levies on Statutory Corporations (a) 60 400 .. Gambling Private lotteries 364 300 360 500 -1.0 Electronic gaming machines 827 253 931 000 12.5 Casino taxes 112 400 113 500 1.0 Racing 109 520 116 470 6.3 Other gambling 2 700 3 340 23.7 Insurance 747 400 724 000 -3.1 Motor vehicle Road Safety Act (Registration Fees) 671 800 703 300 4.7 Stamp duty on vehicle transfers 570 000 594 900 4.4 Other drivers' licences (b) 72 000 .. -100.0 Franchise fees Liquor 6 600 7 200 9.1 Energy (Electricity) .. .. .. Other taxes (c) .. 114 000 .. Total 10 254 535 10 296 322 0.4 Fines and regulatory fees Fines 281 387 343 495 22.1 Regulatory fees (b) 134 204 158 212 17.9 Total 415 591 501 707 20.7 Grants received Grants received by department Department of Education and Training 529 500 570 302 7.7 Department of Human Services 2 756 809 2 867 727 4.0 Department of Infrastructure 256 780 234 110 -8.8 Department of Innovation, Industry and Regional
Development .. 5 120 ..
Department of Justice 45 053 45 053 0.0 Department of Premier and Cabinet .. .. .. Department of Primary Industries 19 900 19 400 -2.5 Department of Sustainability and Environment 34 500 55 790 61.7 Department of Treasury and Finance 7 286 695 8 085 330 11.0 Department for Victorian Communities 23 62 323 .. Parliament .. .. .. Total 10 929 260 11 945 155 9.3
182 Chapter 5 Statement of Finances 2005-06
Table 5.2: Consolidated Fund receipts (continued) ($ thousand)
2004-05 2005-06 Variation Budget Budget % Sales of goods and services 581 807 641 474 10.3Interest received 248 789 150 384 -39.6Public authority income Public authority dividends 477 744 699 562 46.4 Public authorities income tax equivalent receipts 218 922 343 785 57.0 Public authorities local government tax equivalent
receipts 3 121 3 182 2.0
Total 699 787 1 046 529 49.5Other receipts Land rent received 15 145 14 864 -1.9 Royalties received 43 045 55 411 28.7 Other (d) 2 350 167 2 562 077 9.0 Total 2 408 357 2 632 352 9.3Total operating activities 25 538 126 27 213 923 6.6 Cash inflows from investing and financing Loans to GBEs 20 000 .. -100.0 Other loans .. 594 .. Other 45 930 34 075 -25.8 Total cash inflows from investing and financing 65 930 34 669 -47.4 Total Consolidated Funds receipts 25 604 056 27 248 592 6.4Source: Department of Treasury and Finance
Notes: (a) Levies on statutory corporations – new levy. (b) Taxation has been adjusted to exclude motor drivers’ licence fees, police learner and driver fees,
and other miscellaneous motor vehicle fees, which are now classified as regulatory fees. (c) Other taxes include concessional fees (Transurban). (d) Includes the capital asset charge.
Statement of Finances 2005-06 Chapter 5 183
Table 5.3: Consolidated Fund payments: summary ($ thousand)
2004-05 2005-06 Variation Budget Budget % Education and Training Special appropriations 250 250 .. Annual appropriations (a) 6 150 243 6 689 761 8.8 Total 6 150 493 6 690 011 8.8 Human Services Special appropriations 1 032 100 1 112 000 7.7 Annual appropriations (a) 8 780 456 9 544 556 8.7 Total 9 812 556 10 656 556 8.6 Infrastructure Special appropriations .. 1 700 .. Annual appropriations (a) 3 309 961 3 701 289 11.8 Total 3 309 961 3 702 989 11.9 Innovation, Industry and Regional Development Special appropriations .. .. Annual appropriations (a) 388 657 414 942 6.8 Total 388 657 414 942 6.8 Justice Special appropriations 98 985 109 916 11.0 Annual appropriations (a) 2 607 657 2 658 285 1.9 Total 2 706 642 2 768 201 2.3 Premier and Cabinet Special appropriations 5 004 5 195 3.8 Annual appropriations (a) 460 601 501 783 8.9 Total 465 605 506 978 8.9 Primary Industries Special appropriations .. .. .. Annual appropriations (a) 319 969 386 394 20.8 Total 319 969 386 394 20.8 Sustainability and Environment Special appropriations .. .. .. Annual appropriations (a) 806 429 876 148 8.6 Total 806 429 876 148 8.6 Treasury and Finance Special appropriations 197 561 224 424 13.6 Annual appropriations (a) 1 886 830 1 526 699 - 19.1 Total 2 084 391 1 751 123 - 16.0 Victorian Communities Special appropriations 109 100 98 254 - 9.9 Annual appropriations (a) 515 656 608 526 18.0 Total 624 756 706 780 13.1
184 Chapter 5 Statement of Finances 2005-06
Table 5.3: Consolidated Fund payments: summary (continued) ($ thousand)
2004-05 2005-06 Variation Budget Budget % Parliament Special appropriations 34 372 19 407 -43.5 Annual appropriations (a) 91 193 92 857 1.8 Total 125 565 112 264 -10.6Total special appropriations 1 477 372 1 571 146 6.3Total annual appropriations 25 317 651 27 001 240 6.6Total appropriations 26 795 023 28 572 386 6.6Source: Department of Treasury and Finance
Note: (a) Includes receipts credited to appropriations and unapplied previous year appropriations carried
over.
Statement of Finances 2005-06 Chapter 5 185
Table 5.4: Consolidated Fund payments: special appropriations ($ thousand)
2004-05 2005-06 Variation Budget Budget % Education and Training Education Act No. 6240, Section 34 - Volunteer Workers
Compensation 250 250 0.0
Total 250 250 0.0 Human Services Casino Control Act No. 47 of 1991, Section 114 - Hospitals
and Charities Fund 10 500 9 900 -5.7
Casino Control Act No. 47 of 1991, Section 114B - Hospitals and Charities Fund
3 800 7 550 98.7
Club Keno Act No. 56 of 1993, Section 7(5) - Hospitals and Charities Fund (a)
1 600 .. n.a.
Gambling Regulation Act No. 114 of 2003, Section 3.6.11 - Hospitals and Charities Fund and Mental Health Fund (a)
.. 580 900 n.a.
Gambling Regulation Act No. 114 of 2003, Sections 4.4.11 and 4.6.8 - Hospitals and Charities Fund (a)
.. 114 500 n.a.
Gambling Regulation Act No. 114 of 2003, Section 3.6.4 - Hospitals and Charities Fund (a)
.. 82 850 n.a.
Gambling Regulation Act No. 114 of 2003, Section 6.3.3 - Hospitals and Charities Fund and Mental Health Fund (a)
.. 1 600 n.a.
Gambling Regulation Act No. 114 of 2003, Section 5.4.6 - Hospitals and Charities Fund and Mental Health Fund (a)
.. 314 700 n.a.
Gaming and Betting Act No. 37 of 1994, Section 80 - Hospitals and Charities Fund (a)
109 600 .. n.a.
Gaming Machine Control Act No. 53 of 1991, Sections 137 and 138 - Hospitals and Charities Fund (a)
546 500 .. n.a.
Gaming Machine Control Act No. 53 of 1991, Section 135B - Hospitals and Charities Fund (a)
Parliamentary Salaries and Superannuation Act No. 7723 - salaries and allowances
18 240 18 240 0.0
Total 34 372 19 407 -43.5 Total special appropriations 1 477 372 1 571 146 6.3 Source: Department of Treasury and Finance
Note: (a) Reflects either machinery of government changes, classification changes, changes in legislation
or new items.
188 Chapter 5 Statement of Finances 2005-06
Table 5.5: Consolidated Fund payments – total annual appropriations
Details of total annual appropriations for 2005-06, including amounts of estimates of unspent 2004-05 appropriation carried forward pursuant to Section 32 of the Financial Management Act 1994 and receipts credited to appropriation pursuant to Section 29 of the Financial Management Act 1994. Estimates for 2005-06 Budget are in bold; estimates for 2004-05 Budget in italics.
($ thousand) Payments made on Provision Additions to behalf of of outputs net asset base the State Total .. Education and Training Appropriation (a) 6 417 384 105 025 .. 6 522 409 5 995 560 .. .. 5 995 560 Receipts credited to appropriation (b) 93 570 69 550 .. 163 120 86 547 68 136 .. 154 683 Unspent previous year appropriation 4 232 .. .. 4 232 carried over (c) .. .. .. .. Total appropriation 6 515 186 174 575 .. 6 689 761 6 082 107 68 136 .. 6 150 243 Human Services Appropriation (a) 7 933 757 421 316 .. 8 355 073 7 432 566 282 032 .. 7 714 598 Receipts credited to appropriation (b) 1 069 009 15 974 .. 1 084 983 926 514 108 044 .. 1 034 558 Unspent previous year appropriation 59 500 45 000 .. 104 500 carried over (c) 31 300 .. .. 31 300 Total appropriation 9 062 266 482 290 .. 9 544 556 8 390 380 390 076 .. 8 780 456 Infrastructure Appropriation (a) 3 054 627 349 653 35 900 3 440 180 2 713 528 303 497 .. 3 017 025 Receipts credited to appropriation (b) 236 975 .. .. 236 975 260 947 .. .. 260 947 Unspent previous year appropriation 20 928 3 206 .. 24 134 carried over (c) 2 935 29 054 .. 31 989 Total appropriation 3 312 530 352 859 35 900 3 701 289 2 977 410 332 551 .. 3 309 961 Innovation, Industry and Regional
2004-05 2005-06 Variation Budget Budget % Cash flows from operating activities Receipts Taxation 124 901 130 902 4.8 Fines and regulatory fees 41 117 41 819 1.7 Grants received 2 108 742 2 271 105 7.7 Sale of goods and services 163 964 171 246 4.4 Interest received 63 273 81 994 29.6 Other receipts (a) 7 718 005 8 150 274 5.6 10 220 002 10 847 340 6.1 Payments Employee entitlements - 64 456 - 72 607 12.6 Superannuation - 4 740 - 5 857 23.6 Interest paid - 9 162 - 12 268 33.9 Grants paid - 7 750 175 - 8 649 482 11.6 Supplies and consumables - 2 175 001 - 2 092 163 - 3.8 Other payments - 12 953 .. - 100.0 Net cash flows from operating activities 203 516 14 963 - 92.6 Cash flows from investing activities Net proceeds from/(-) purchases of investments .. .. Proceeds from sale of property, plant and equipment 192 .. - 100.0 Purchases of property, plant and equipment - 149 318 - 27 500 - 81.6 Other investing activities 12 302 - 15 593 - 226.8 Net cash flows from investing activities - 136 824 - 43 093 - 68.5 Cash flows from financing activities Net proceeds from/(repayment) of borrowings (b) .. 72 862 n.a. Other .. .. .. Net cash flow from financing activities .. 72 862 .. Net cash inflow/(-) outflow 66 692 44 732 - 32.9 Represented by: Cash and deposits held at beginning of reporting period 815 387 962 397 18.0 Cash and deposits held at end year 882 079 1 007 128 14.2 Source: Department of Treasury and Finance
Note: (a) Includes transfers between funds. (b) Relates to loans and advances.
192 Chapter 5 Statement of Finances 2005-06
Statement of Finances 2005-06 Chapter 6 193
CHAPTER 6 – UNIFORM PRESENTATION OF GOVERNMENT FINANCE STATISTICS
THE ACCRUAL GFS PRESENTATION The Government Finance Statistics (GFS) system employed by the Australian Bureau of Statistics (ABS) is designed to provide statistics relating to all Australian public sector entities. The statistics show consolidated transactions of the various institutional sectors of government from an economic viewpoint, providing details of revenue, expenses, payments, receipts, assets and liabilities. It includes only those transactions over which a government exercises control under its legislative or policy framework and excludes from the calculation of net operating balance both revaluations (holding gains or losses) arising from a change in market prices, and other changes in the volume of assets resulting from discoveries, depletion and destruction of assets.
Break in series – introduction of A-IFRS Underlying data for the respective GFS financial statements relating to the 2004-05 revised budget year are based on existing Australian Accounting Standards (AAS) whilst data relating to the years 2005-06 onwards are based on the Australian equivalents to International Financial Reporting Standards (A-IFRS). This break in the GFS series between 2004-05 and 2005-06 is denoted by a dotted line in the following tables.
Operating statement The operating statement is designed to capture the composition of GFS revenues and GFS expenses and the net cost of a government’s activities within a financial year. It shows the full cost of resources consumed by government in achieving its objectives, and how these costs are met from various revenue sources.
The GFS operating statement reports two major fiscal measures – the GFS net operating balance and GFS net lending. The GFS net operating balance is calculated as GFS revenue minus GFS expenses. GFS net lending, or fiscal balance, includes net capital expenditure but excludes depreciation, thereby giving a measure of a jurisdiction’s call on financial markets.
194 Chapter 6 Statement of Finances 2005-06
Previously, differences arose between the GFS and accounting frameworks, particularly in the operating statement. With the introduction of the Australian equivalents to the International Financial Reporting Standards (A-IFRS), the Victorian Government has adopted a transitional A-IFRS operating statement format which is closely aligned to the following GFS format and presentation of the net operating balance. It is expected that there will be further harmonisation of the two reporting formats as a consequence of the Australian Accounting Standards Board’s (AASB) GFS/GAAP convergence strategy currently being implemented. Victoria’s A-IFRS presentation distinguishes the net result from transactions from other economic flows, such as actuarial adjustments, revaluations and increases in provisions for doubtful accounts. Hence, the A-IFRS net result from transactions is equivalent to the GFS net operating balance.
Balance sheet The GFS balance sheet records a government’s stocks of financial and non-financial assets and liabilities and discloses the resources over which a government maintains control. The GFS balance sheet differs from the standard accounting presentation in that it provides information on financial and non-financial assets, and does not distinguish between current and non-current assets and liabilities.
Cash flow statement The GFS cash flow statement records a government’s cash receipts and payments and shows how a government obtains and expends cash.
The cash flow statement reports two major fiscal measures – the net increase in cash held and the cash surplus. Net increase in cash held is the sum of net cash flows from all operating, investing and financing activities. The GFS cash flow statement measures the cash surplus/deficit excluding finance leases and similar arrangements consistent with the International Monetary Fund definition. However, the Australian GFS measure continues to adjust for non-cash finance leased capital formation. This is a follow on from the old GFS cash series which ended in 1998-99. In the Australian context, this presentation of non-cash items in the cash flow statement is being reviewed as part of the GAAP/GFS harmonisation process.
INSTITUTIONAL SECTORS
General government sector The general government sector comprises all government departments, offices and other bodies engaged in providing services free of charge or at prices significantly below their cost of production. General government services include those which are mainly non-market in nature, those which are largely for collective consumption by
Statement of Finances 2005-06 Chapter 6 195
the community, and those which involve the transfer or redistribution of income. These services are financed mainly through taxes, other compulsory levies and user charges.
Public non-financial corporations sector The public non-financial corporations sector was formerly known as the public trading enterprises sector. It comprises bodies mainly engaged in the production of goods and services (of a non-financial nature) for sale in the market place at prices that aim to recover most of the costs involved (e.g. water and port authorities). In general, public non-financial corporations are legally distinguishable from the governments which own them.
Non-financial public sector The non-financial public sector represents the consolidated transactions and assets and liabilities of the general government and public non-financial corporations sectors. In compiling statistics for the non-financial public sector, transactions and debtor-creditor relationships between sub-sectors are eliminated to avoid double counting.
Public financial corporations Public financial corporations are bodies primarily engaged in the provision of financial intermediation services or auxiliary financial services. They are able to incur financial liabilities on their own account (e.g. taking deposits, issuing securities or providing insurance services). The public financial corporations sector includes the Treasury Corporation of Victoria and the Transport Accident Commission. Estimates are not published for the public financial corporations sector.
196 Chapter 6 Statement of Finances 2005-06
UNIFORM PRESENTATION FRAMEWORK TABLES
Table 6.1: General government sector operating statement ($ million)
Sales of non-financial assets - 72 - 134 - 143 - 209 - 120Less: Depreciation 1 169 1 235 1 292 1 383 1 445Plus: Change in inventories 1 0 1 1 1Plus: Other movements in
non-financial assets - 373 637 .. - 10 160
Total net acquisition of non-financial assets
584 1 798 986 650 912
GFS net lending (+) / borrowing (-)
- 209 -1 433 - 667 - 337 - 361
Source: Department of Treasury and Finance Notes: (a) Underlying data for 2004-05 revised estimates are on the basis of existing Australian Accounting
Standards. (b) 2005-06 to 2008-09 Budget estimates are based on underlying A-IFRS data. (c) Under A-IFRS, superannuation interest is an actuarial calculation. It is lower than prior years,
substantially offset by the recognition of employer service cost on unfunded superannuation liability not classified as interest.
Statement of Finances 2005-06 Chapter 6 197
Table 6.2: Public non-financial corporations sector operating statement ($ million)
2004-05 (a) 2005-06 (b)
Revised Estimate GFS revenue Sales of goods and services 3 023 3 403 Current grants and subsidies 1 105 1 335 Capital grants 225 259 Interest income 126 113 Other 663 466 Total revenue 5 142 5 575 GFS expenses Employee expenses 596 618 Depreciation 753 839 Other operating expenses 2 695 3 183 Property expenses 669 882 Current transfers 84 176 Capital transfers 13 5 Total expenses 4 810 5 703 GFS net operating balance 333 - 128 Less: Net acquisition of non-financial assets Purchases of non-financial assets 1 965 1 870 Sales of non-financial assets - 83 - 78 Less: Depreciation 753 839 Plus: Change in inventories 1 2 Plus: Other movements in non-financial assets 225 164 Total net acquisition of non-financial assets 1 355 1 118 GFS net lending (+) / borrowing (-) -1 022 -1 246 Source: Department of Treasury and Finance
Notes: (a) Underlying data for 2004-05 revised estimates are on the basis of existing Australian Accounting
Standards. (b) 2005-06 Budget estimates are based on underlying A-IFRS data.
198 Chapter 6 Statement of Finances 2005-06
Table 6.3: Non-financial public sector operating statement ($ million)
2004-05 (a) 2005-06 (b)
Revised Estimate GFS revenue Taxation revenue 10 235 10 161Current grants and subsidies 12 836 13 710Capital grants 536 555Sales of goods and services 5 705 6 190Interest income 420 415Other 2 081 2 023Total revenue 31 815 33 054 GFS expenses Employee expenses 12 470 13 342Depreciation 1 922 2 075Other operating expenses 11 039 12 026Nominal superannuation interest expense 820 443Other interest expense 717 754Other property expenses .. ..Current transfers 3 540 3 780Capital transfers 655 329Total expenses 31 162 32 748 GFS net operating balance 652 306Less: Net acquisition of non-financial assets Purchases of non-financial assets 4 162 4 399Sales of non-financial assets - 154 - 212Less: Depreciation 1 922 2 075Plus: Change in inventories 1 2Plus: Other movements in non-financial assets - 149 801Total net acquisition of non-financial assets 1 939 2 916GFS net lending (+) / borrowing (-) -1 286 -2 610Source: Department of Treasury and Finance
Notes: (a) Underlying data for 2004-05 revised estimates are on the basis of existing Australian Accounting
Standards. (b) 2005-06 Budget estimates are based on underlying A-IFRS data. Alterations to 2005–06 estimates: Due to the discovery of a compilation error in the originally published 2005-06 figure for other
movements in non-financial assets in the table above, the previously reported $186 million has been amended to $801 million. As a consequences, the total net acquisition of non-financial assets (previously $2 301 million) and GFS net lending/borrowing (previously -$1 995 million) have also been corrected. No other figures or tables are affected by this alteration.
Statement of Finances 2005-06 Chapter 6 199
Table 6.4: General government sector balance sheet ($ million)
as at 30 June 2004 (a) 2005 (a) 2006 (b) 2007 (b) 2008 (b) 2009 (b)
Other non-equity liabilities 3 402 3 346 3 346 3 272 3 206 3 146 Total liabilities 24 804 24 544 31 886 32 312 32 705 33 235 Net worth 60 196 67 262 63 872 66 605 69 513 72 891 Net financial worth (c) 15 461 16 406 9 843 9 130 8 761 8 382 Net debt (d) 1 403 1 923 2 939 3 854 4 494 5 018 Source: Department of Treasury and Finance
Notes: (a) Balances shown for 2004 and the 2005 revised estimates are prior to restatement to A-IFRS. (b) Presentation of 2006 to 2009 estimates are based on A-IFRS data after restating the opening
balances as at 1 July 2004 (not shown). (c) Net financial worth equals total financial assets minus total liabilities. (d) Net debt equals the sum of deposits held, advances received and borrowings, minus the sum of
cash and deposits, advances paid, and investments, loans and placements.
200 Chapter 6 Statement of Finances 2005-06
Table 6.5: Public non-financial corporations sector balance sheet ($ million)
Notes: (a) Balances shown for 2004 and the 2005 revised estimates are prior to restatement to A-IFRS. (b) Presentation of 2006 estimates are based on A-IFRS data after restating the opening balances as
at 1 July 2004 (not shown). (c) Net debt equals the sum of deposits held, advances received and borrowings, minus the sum of
cash and deposits, advances paid, and investments, loans and placements.
Statement of Finances 2005-06 Chapter 6 201
Table 6.6: Non-financial public sector balance sheet ($ million)
as at 30 June 2004 (a) 2005 (a) 2006 (b)
Opening Revised Estimate Assets Financial assets Cash and deposits 1 736 1 762 1 759 Advances paid 278 239 193 Investments, loans and placements 4 182 3 984 3 346 Other non-equity assets 2 202 2 526 2 269 Equity 1 783 1 803 1 822 Total financial assets 10 182 10 314 9 390 Non-financial assets Land and fixed assets 78 695 86 461 91 947 Other non-financial assets 1 530 1 577 1 537 Total non-financial assets 80 224 88 037 93 483 Total assets 90 406 98 352 102 873 Liabilities Deposits held 525 516 519 Advances received 35 75 51 Borrowing 9 096 9 778 11 069 Superannuation liability 11 760 11 011 17 462 Other employee entitlements and provisions 5 201 5 408 5 730 Other non-equity liabilities 2 699 2 767 2 846 Total liabilities 29 317 29 556 37 677 Net worth 61 090 68 795 65 197 Net financial worth -19 135 -19 242 -28 286 Net debt (c) 3 460 4 385 6 340 Source: Department of Treasury and Finance
Notes: (a) Balances shown for 2004 and the 2005 revised estimates are prior to restatement to A-IFRS. (b) Presentation of 2006 estimates are based on A-IFRS data after restating the opening balances as
at 1 July 2004 (not shown). (c) Net debt equals the sum of deposits held, advances received and borrowings, minus the sum of
cash and deposits, advances paid, and investments, loans and placements.
202 Chapter 6 Statement of Finances 2005-06
Table 6.7: General government sector cash flow statement ($ million)
2004-05 2005-06 Revised Budget Cash receipts from operating activities Receipts from sales of goods and services 3 004 3 346 Grants/subsidies received 1 446 1 668 Other receipts 457 408 Total receipts 4 908 5 422 Cash payments from operating activities Payment for goods and services -2 530 -2 862 Grants and subsidies paid - 44 - 114 Interest paid - 323 - 328 Other payments - 814 -1 005 Total payments -3 711 -4 309 Net cash flows from operating activities 1 197 1 113 Net cash flows from investing in non-financial assets Sales of non-financial assets 83 78 Purchases of non-financial assets -1 965 -1 870 Total cash flows from investing in non-financial assets -1 882 -1 792 Net cash flows from investments in financial assets for policy
purposes 539 575
Net cash flows from investments in financial assets for liquidity purposes
113 267
Net cash flows from financing activities Advances received (net) - 22 - 2 Borrowings (net) 436 328 Deposits received (net) - 19 - 9 Distributions paid - 346 - 477 Other financing (net) 0 .. Total net cash flows from financing activities 49 - 160 Net increase in cash held 15 3 Surplus (+) /deficit (-) excluding acquisitions under finance
leases (a) -1 032 -1 156
Acquisition of assets under finance leases and similar arrangements .. ..
Surplus (+) /deficit (-) including finance leases -1 032 -1 156 Source: Department of Treasury and Finance
Note: (a) Net cash flows from operating activities less investments in non-financial assets.
204 Chapter 6 Statement of Finances 2005-06
Table 6.9: Non-financial public sector cash flow statement ($ million)
2004-05 2005-06 Revised Budget Cash receipts from operating activities Taxes received 10 155 10 242Receipts from sales of goods and services 5 605 6 058Grants/subsidies received 13 370 14 264Other receipts 2 325 2 369Total receipts 31 455 32 933Cash payments from operating activities Payment for goods and services -23 689 -24 831Grants and subsidies paid -3 252 -3 456Interest paid - 726 - 744Other payments - 690 - 688Total payments -28 358 -29 719Net cash flows from operating activities 3 098 3 214Net cash flows from investing in non-financial assets Sales of non-financial assets 154 212Purchases of non-financial assets -4 162 -4 399Total cash flows from investing in non-financial assets -4 008 -4 187 Net cash flows from investments in financial assets for policy
purposes 25 6
Net cash flows from investments in financial assets for liquidity purposes
220 638
Net cash flows from financing activities Advances received (net) 40 - 3Borrowings (net) 668 337Deposits received (net) - 19 - 9Other financing (net) 0 0Total net cash flows from financing activities 689 325Net increase in cash held 24 - 4Surplus (+) /deficit (-) excluding acquisitions under finance
leases (a) - 910 - 973
Acquisition of assets under finance leases and similar arrangements .. 615 Surplus (+) /deficit (-) including finance leases - 910 -1 588Source: Department of Treasury and Finance
Note: (a) Net cash flows from operating activities less investments in non-financial assets.
Statement of Finances 2005-06 Chapter 6 205
Table 6.10: General government sector expenses by function ($ million)
2004-05 (a) 2005-06 (b)
Revised Budget General public services 2 165 2 448 Public order and safety 2 610 2 912 Education 7 784 8 119 Health 7 581 7 998 Social security and welfare 2 247 2 378 Housing and community amenities 1 352 1 413 Recreation and culture 775 942 Fuel and energy 39 49 Agriculture, forestry, fishing, and hunting 479 155 Mining, manufacturing, and construction 20 0 Transport and communications 3 348 3 395 Other economic affairs 406 284 Other purposes 172 165 Total GFS expenses 28 977 30 259 Source: Department of Treasury and Finance
Notes: (a) Underlying data for 2004-05 revised estimates are on the basis of existing Australian Accounting
Standards. (b) 2005-06 Budget estimates are based on underlying A-IFRS data.
206 Chapter 6 Statement of Finances 2005-06
Table 6.11: General government sector taxation ($ million)
2004-05 2005-06 2006-07 2007-08 2008-09 Revised Budget Estimate Estimate Estimate Taxes on employers' payroll and
labour force 2 994 3 179 3 329 3 487 3 649
Taxes on property Land taxes 855 824 847 837 848Stamp duties on financial and capital
transactions 2 325 2 154 2 179 2 196 2 284
Financial institutions' transaction taxes 257 22 .. .. ..Other 120 146 170 174 180Total 3 557 3 146 3 196 3 208 3 312Taxes on the provision of goods
and services
Excises and levies 45 60 60 62 ..Taxes on gambling 1 376 1 479 1 560 1 532 1 610Taxes on insurance 1 020 1 061 1 115 1 173 1 230Total 2 441 2 601 2 735 2 767 2 840Taxes on the use of goods and
between operating statement, including nominal interest, and cash flow statement)
758 649 361 72 - 9
Acquisitions under finance leases .. 615 .. .. .. Other non-cash items - 428 - 263 - 72 - 157 - 81 GFS cash surplus(+)/deficit(-) 122 - 432 - 378 - 422 - 451 Less: Net contributions to other
sectors of government 641 584 538 218 73
Decrease in general government net debt
- 520 -1 016 - 916 - 640 - 524
Source: Department of Treasury and Finance
Note: (a) Existing Australian Accounting Standards basis (see Appendix B, Table B.1: Comparison of
operating statement for 2004-05 Revised outcome under existing Australian Accounting Standards (AAS) and A-IFRS).
208 Chapter 6 Statement of Finances 2005-06
VICTORIA’S 2005-06 LOAN COUNCIL ALLOCATION As required under the Uniform Presentation Framework, Victoria is required to publish the Loan Council Allocation (LCA) estimates. The LCA is a measure of each government’s net call on financial markets in a given financial year to meet its budget obligations. The method of public release is the responsibility of each individual jurisdiction. Victoria discloses its LCA information through the Annual Financial Statement, Budget Paper and Budget Update.
Table 6.13 compares Victoria’s 2005-06 LCA based on the 2004-05 Budget Update estimates and approved by Loan Council in March 2005, with the revised LCA based on 2005-06 Budget estimates.
Table 6.13: Loan Council Allocation 2005-06
($ million) 2005-06
Nomination 2005-06 Revised
General government sector cash (+) deficit / (-) surplus (a) - 46 432Public non-financial corporation sector cash (+) deficit / (-) surplus (a) 761 1 156Non-financial public sector cash (+) deficit / (-) surplus (a) 715 1 588Less: Net cash flows from investments in financial assets for policy
purposes (b) 9 6
Plus: Memorandum items (c) 440 440Loan Council Allocation 1 146 2 022Tolerance limit (2 per cent of non-financial public sector cash receipts
from operating activities) (d) 642 642
Source: Department of Treasury and Finance
Notes: (a) The sum of the surplus/deficit of the general government and public non-financial corporation
sector does not directly equal the non-financial public sector surplus due to intersectoral transfers, which are netted out in the calculation of the non-financial public sector figure. Surplus (+)/deficit(-) includes finance lease acquisitions.
(b) The non-financial public sector surplus/deficit relating to 2005-06 includes net cash flows from investments in financial assets for policy purposes.
(c) Memorandum items are used to adjust the ABS deficit to include in LCAs certain transactions, such as operating leases, that have many of the characteristics of public sector borrowings but do not constitute formal borrowings. They are also used, where appropriate, to deduct from the ABS deficit certain transactions that Loan Council has agreed should not be included in LCAs (e.g. the over/under funding of employers’ emerging costs under public sector superannuation schemes, or borrowings by entities such as statutory marketing authorities).
(d) A tolerance limit equal to 2 per cent of ‘total non-financial public sector cash receipts from operating activities’ (2004-05 Budget Update) applies to jurisdictions’ LCA nomination and revised LCA at budget time, and between the budget time LCA and LCA outcome. The tolerance limit applying to Victoria in 2005-06 is $642 million (2 per cent of $32 094 million – sourced from 2004-05 Budget Update).
Statement of Finances 2005-06 Chapter 6 209
As part of the Loan Council arrangements, Loan Council has agreed that if at any time a jurisdiction finds that it is likely to exceed its tolerance limit, in either direction, it is required to provide an explanation to Loan Council and, in line with the emphasis of increased transparency, to make the explanation public. The 2005-06 revised LCA exceeded the tolerance limit by $234 million. The change of $876 million in the LCA between 2004-05 Budget Update and 2005-06 Budget is mainly due to:
• a revision in the general government sector cash position from $46 million surplus to $432 million deficit primarily reflecting a significant increase in contribution to other government sectors ($328 million) for infrastructure development and a moderate increase in investments in non-financial assets ($236 million); and
• an increase in the public non-financial corporations sector infrastructure investment ($348 million), which is primarily funded by an increase in contribution from the general government sector.
Infrastructure projects In the interests of transparency, the State is required to disclose the details of infrastructure projects with private sector involvement and to report full contingent exposure, if any. Exposure is to be measured by the Government’s termination liabilities in a case of private sector default and disclosed as a footnote to, rather than a component of, LCAs.
It is expected that the Melbourne Convention Centre redevelopment contract with private sector involvement will be signed in 2005-06. As the following project is still in development stages, full details about the extent and nature of actual payments, forward commitments and contingent liabilities associated with the project cannot be provided at this stage.
Melbourne Convention Centre redevelopment This redevelopment will be the largest of its kind in Australia. The redevelopment will integrate a convention centre, which will include a 5 000 seat plenary hall, with the existing exhibition centre and broader Southbank site.
The Government allocated $367 million to the Melbourne Convention Centre redevelopment in the 2004-05 Budget.
210 Chapter 6 Statement of Finances 2005-06
Statement of Finances 2005-06 Appendix A 211
APPENDIX A – HISTORICAL AND FORWARD ESTIMATES TABLES
In this appendix, historical data up to and including the revised 2004-05 Budget have been prepared under existing AAS, while the forward estimates data have been prepared in accordance with Australian equivalents to International Financial Reporting Standards (A-IFRS).
Table A.1 shows the trends in general government sector aggregate cash flows over the period 1986-87 to 2008-09. This table of historical data has been compiled as far as possible on existing Australian Accounting Standards (AAS) basis and is consistent with the cash flow statement included in Chapter 1, Estimated Financial Statements and Notes.
The data from 1997-98 include the transactions of government schools and the arts institutions on a gross operating basis, as well as the full trading operations of TAFE institutes and hospitals, nursing homes and ambulances. Although this expanded coverage does not materially influence the net operating result for the general government sector, it does significantly increase the inflows and outflows presented in the cash flow statement.
Table A.2 shows the general government operating result, based on existing AAS, following the introduction of accrual accounting in 1996-97. As a result of changes to accounting standards operative from 2000-01, the statement of financial performance no longer recognises abnormal items as a separate item. Table A.2 has been adjusted to conform to this new reporting standard. Details of previously reported abnormal items associated with operating results up to 1999-2000 are shown in Table A.3.
Table A.4 presents general government sector operating expenditure, sourced from Australian Bureau of Statistics historical data, classified by function. The classifications conform to the standards for presenting cash expenditure by government purpose on a Government Finance Statistics (GFS) basis up to 1998-99, when this series ceased with the introduction of accrual GFS. The absence of accrual information for these years means that it is not possible to convert or compare these tables with the current series of accrual GFS information included in Table A.5, Table A.6 and in Chapter 6, Uniform Presentation of Government Finance Statistics, Table 6.1.
From 1999-2000, the new GFS accruals series of expenses classified by purpose is included as Table A.5.
212 Appendix A Statement of Finances 2005-06
Table A.1: General government cash flow statement – historical series ($ million)
1986-87 1987-88 1988-89 1989-90 Actual Actual Actual Actual Cash flows from operating activities . . . .Receipts Taxation (a)(b)(d) 3 867 4 420 5 004 5 302Fines and regulatory fees (d) 143 150 147 168Grants (b)(c) 4 665 4 857 5 011 5 240Sales of goods and services 646 724 811 907Interest received 189 155 162 144Dividends received 251 296 354 399Other receipts 483 493 487 484Total receipts 10 245 11 094 11 975 12 645Payments Employee benefits (e) (4 457) (4 808) (5 110) (5 471)Superannuation ( 367) ( 416) ( 519) ( 586)Interest paid (1 079) (1 163) (1 254) (1 423)Grants and transfer payments (e)(f) (2 463) (2 533) (2 788) (2 834)Supplies and services (2 138) (2 327) (2 530) (2 869)Total payments (10 505) (11 247) (12 200) (13 184)Net cash flows from operating activities ( 260) ( 152) ( 225) ( 538)Cash flows from investing activities . . . .Purchase of property, plant and equipment ( 953) (1 031) (1 042) (1 085)Proceeds from sale of property, plant and
equipment 104 207 189 168
Net (purchases)/disposal of investments 77 77 99 111Net customer loans (granted)/repaid .. .. .. ..Net privatisation proceeds and other
abnormals (g) 35 35 35 35
Net cash flows from investing activities ( 737) ( 712) ( 720) ( 771)Cash flows from financing activities . . . .Net borrowings 1 038 973 852 1 233Net cash flows from financing activities 1 038 973 852 1 233Net increase in cash and deposits held 42 109 ( 93) ( 76)Cash and deposits at beginning of reporting
period 841 883 992 898
Cash and deposits at end of reporting period
883 992 898 823
Statement of Finances 2005-06 Appendix A 213
Table A.1: General government cash flow statement – historical series (continued)
($ million) 1990-91 1991-92 1992-93 1993-94 Actual Actual Actual Actual Cash flows from operating activities . . . . Receipts Taxation (a)(b)(d) 5 641 5 968 6 498 7 342 Fines and regulatory fees (d) 201 263 260 284 Grants (b)(c) 5 676 5 921 6 138 6 215 Sales of goods and services 963 1 038 1 006 1 004 Interest received 152 121 95 94 Dividends received 327 566 581 815 Other receipts 326 308 251 323 Total receipts 13 287 14 185 14 830 16 076 Payments Employee benefits (e) (5 855) (6 337) (6 846) (7 184) Superannuation ( 685) ( 782) ( 853) ( 493) Interest paid (1 602) (1 787) (2 064) (2 195) Grants and transfer payments (e)(f) (2 807) (3 134) (3 501) (3 893) Supplies and services (2 885) (2 943) (3 024) (2 148) Total payments (13 834) (14 983) (16 288) (15 912) Net cash flows from operating activities ( 547) ( 798) (1 458) 164 Cash flows from investing activities . . . . Purchase of property, plant and equipment (1 129) (1 066) (1 068) ( 980) Proceeds from sale of property, plant and
equipment 114 103 132 189
Net (purchases)/disposal of investments 186 143 ( 261) ( 501) Net customer loans (granted)/repaid .. .. .. .. Net privatisation proceeds and other
abnormals (g) 1 292 6 304 498
Net cash flows from investing activities 464 ( 815) ( 892) ( 793) Cash flows from financing activities . . . . Net borrowings 410 1 506 2 315 841 Net cash flows from financing activities 410 1 506 2 315 841 Net increase in cash and deposits held 327 ( 107) ( 36) 211 Cash and deposits at beginning of reporting
period 823 1 149 1 043 1 007
Cash and deposits at end of reporting period
1 149 1 043 1 007 1 219
214 Appendix A Statement of Finances 2005-06
Table A.1: General government cash flow statement – historical series (continued)
($ million) 1994-95 1995-96 1996-97 1997-98 1998-99 Actual Actual Actual Actual (h) Actual (i)
Cash flows from investing activities . . . . .Purchase of property, plant and
equipment (2 197) (2 529) (2 420) (2 251) (2 316)
Proceeds from sale of property, plant and equipment
72 134 143 209 120
Net (purchases)/disposal of investments
107 370 905 346 17
Net customer loans (granted)/repaid 11 1 3 3 3Net contribution to other sectors of
government ( 514) ( 570) ( 534) ( 218) ( 57)
Net cash flows from investing activities
(2 522) (2 594) (1 904) (1 912) (2 232)
Cash flows from financing activities . . . . .Net borrowings 283 8 5 293 489Net cash flows from financing
activities 283 8 5 293 489
Net increase in cash and deposits held
9 ( 7) 1 3 1
Cash and deposits at beginning of reporting period
1 295 1 304 1 297 1 297 1 300
Cash and deposits at end of reporting period
1 304 1 297 1 297 1 300 1 301
Source: Department of Treasury and Finance
Statement of Finances 2005-06 Appendix A 217
NOTES Receipts from operating activities (a) State deficit levy commenced in 1992-93 ($173 million), and ceased in 1994-95
($180 million).
(b) Includes the effect of GST grants from 2000-01 onwards. However, the GST collected on sales of goods and services and the GST paid on purchases of supplies and services has not been included in this cash flow statement since this amount is recouped in full from the Australian Taxation Office.
(c) Includes significant offshore petroleum compensation grants from the Commonwealth in 1990-91 ($178 million) and 1991-92 ($191 million, including $60 million rent resource tax compensation).
The works (capital) grant from the Commonwealth ceased in 1993-94 ($68 million a year).
(d) For all years, taxation has been adjusted to exclude motor drivers’ licence fees, police learner and driver fees, and other miscellaneous motor vehicle fees, which are now classified as regulatory fees.
Payments from operating activities (e) Separation payments up to 1989-90, mainly for early retirement and enhanced
resignation packages to the Public Transport Corporation, are included under ‘grants’. Payments in later years were for voluntary redundancy and targeted separation packages across the general government sector and are included under ‘employee entitlements’.
(f) Operating subsidy payments to Tricontinental Corporation commenced in 1991-92 subsequent to the sale of the State Bank. Significant payments were in 1991-92 ($150 million), 1992-93 ($123 million), 1993-94 ($53 million), and 1994-95 ($39 million).
Major annual subsidy payments to the State Electricity Commission of Victoria (SECV) for electricity supplied by the agency to the Portland and Point Henry smelters under flexible tariff agreements with the State commenced in 1992-93 and ceased in 1997-98. The liability has again been taken up by the general government sector in 2003-04 as an operating subsidy to the SECV following the discontinuation of the Smelter Reduction Amount in that year. However, cash payments are not scheduled to re-commence until 2006-07.
Includes the cost of restructure of the Accelerated Infrastructure Program in 1994-95 ($200 million).
218 Appendix A Statement of Finances 2005-06
Investing activities (g) Privatisation and other abnormal items to the general government sector
include:
• 1986-87 to 1990-91: payments received from the former Melbourne and Metropolitan Board of Works regarding the transfer of ownership of the Thomson-Cardinia Dam of $35 million a year;
• 1990-91: net proceeds from the sale of the State Bank ($1 257 million);
• 1992-93: sale of the State Insurance Office ($140 million);
• 1993-94: recall of capital from the Transport Accident Commission ($1 200 million), wind-up of the Victorian Equity Trust ($437 million), casino licence fee ($200 million), offset by a special payment to the State Superannuation Fund ($1 399 million);
• 1994-95: sale of Totalisator Agency Board ($609 million);
• 1995-96: sale of electricity sector businesses ($4 641 million), 1996-97 ($4 262 million), and 1997-98 ($2 101 million) offset by a special payment to the State Superannuation Fund ($490 million); and
• 1998-99: sale of the remainder of the electricity businesses ($361 million), gas businesses ($4 690 million), Victorian Plantations Corporation ($550 million), Aluvic ($401 million), V/Line Freight ($20 million), offset by a special payment to reduce the State’s unfunded superannuation liabilities ($2 574 million).
The above proceeds from the sale of government businesses are the amounts paid in cash (net) to the Consolidated Fund and are not necessarily the total proceeds of sale. Other (h) From 1997-98, includes school own-purpose receipts and payments and
equivalent receipts from public non-financial corporations and public financial corporations.
(i) From 1998-99, other receipts includes a capital asset charge receipt from the public non-financial corporations sector.
(j) Sales of goods and services and purchases supplies and services do not include the GST component following its introduction in 1999-2000.
Statement of Finances 2005-06 Appendix A 219
Chart A.1: Total receipts from operating activities (in real terms)
Total .. 1 174.1 2 039.7 1 836.2Total changes in equity other than
contributions to other sectors by the State in its capacity as owner
5 232.3 4 466.2 9 982.4 3 003.6
Statement of Finances 2005-06 Appendix A 221
Table A.2: General government sector statement of financial performance – historical series (continued)
($ million) 2000-01 2001-02 2002-03 2003-04 2004-05 Actual Actual Actual Actual Revised Revenue from ordinary activities Taxation (a) 8 515.9 8 757.8 9 250.5 10 043.4 10 355.6 Fines and regulatory fees (a) 455.6 520.7 667.5 616.7 627.8 Investment revenue 1 476.8 1 002.4 1 205.7 1 057.6 1 345.9 Grants 10 365.5 11 873.2 12 103.2 12 628.4 13 364.5 Sale of goods and services 1 992.1 2 168.1 2 224.0 2 265.4 2 313.1 Gain/(loss) on disposal of physical
assets 21.4 - 97.5 - 336.1 - 44.8 12.9
Fair value of assets received free of charge or for nominal consideration
69.4 95.5 85.8 374.0 1.6
Inter-sector capital asset charge 477.0 489.0 501.0 564.0 599.4 Other revenue 422.6 553.7 929.0 839.0 776.0 Total revenue 23 796.3 25 363.0 26 630.5 28 343.8 29 396.7 Expenses from ordinary activities Employee benefits 8 170.2 8 893.7 9 542.9 9 988.4 10 625.3 Superannuation 1 437.7 2 595.2 2 612.2 300.2 780.0 Depreciation 799.3 859.5 947.1 1 006.9 1 112.3 Amortisation 39.1 78.2 90.0 86.7 56.6 Financing costs 605.3 472.8 501.8 493.9 482.2 Grants and transfer payments 3 793.0 4 175.5 4 038.0 5 843.3 5 196.6 Supplies and services 7 486.1 7 816.0 8 465.9 9 318.9 9 633.4 Other expenses 249.4 198.8 196.7 315.4 228.8 Total expenses 22 580.1 25 089.6 26 394.6 27 353.7 28 115.2 Net result from ordinary activities 1 216.2 273.4 235.9 990.1 1 281.5 Movement in asset revaluation reserve 815.8 2 967.9 2 453.2 2 182.2 5 577.0 Other adjustments other than
contributions by owner (b) 46.6 .. 178.1 .. ..
Total 862.4 2 967.9 2 631.3 2 182.2 5 577.0 Total changes in equity other than
contributions to other sectors by the State in its capacity as owner
2 078.6 3 241.3 2 867.2 3 172.3 6 858.6
222 Appendix A Statement of Finances 2005-06
Table A.2: General government sector statement of financial performance – historical series (continued)
($ million) 2005-06 2006-07 2007-08 2008-09 Budget Estimate Estimate Estimate Income from transactions Taxation (a) 10 306.2 10 729.8 11 016.2 11 441.3Fines and regulatory fees (a) 726.9 772.3 757.1 763.7Investment income 1 397.9 1 260.2 1 235.2 1 138.3Grants income 14 262.1 14 733.3 15 263.7 15 992.0Sales of goods and services 2 397.1 2 449.8 2 490.8 2 521.6Fair value of assets received free of charge or
for nominal consideration 22.0 .. .. 160.0
Inter-sector capital assets charge 778.8 777.7 768.7 755.6Other income 732.6 731.4 725.2 729.9Total income from transactions 30 623.6 31 454.5 32 257.0 33 502.4Expenses from transactions Employee benefits 11 201.5 11 552.7 11 887.8 12 191.8Superannuation 1 759.3 1 784.9 1 785.0 1 802.0Depreciation and amortisation 1 235.1 1 291.6 1 383.3 1 444.5Financing costs 492.1 500.7 503.8 524.1Grants and transfer payments 5 579.3 5 539.9 5 545.3 5 574.3Supplies and services 9 991.2 10 465.0 10 838.4 11 414.4Other expenses 0.4 0.4 0.4 0.4Total expenses from transactions 30 258.9 31 135.2 31 944.0 32 951.5Net result from transactions 364.7 319.3 313.0 550.8 Income/(expenses) from other economic
flows . . . .
Net gain/(loss) from disposal of physical assets 25.7 21.4 9.1 9.7Other income from other economic flows 8.5 8.5 8.5 8.5Actuarial gains/(losses) on superannuation
defined benefit plans .. .. .. ..
Other expenses from other economic flows - 74.8 - 70.9 - 60.3 - 56.5Net result from other economic flows - 40.6 - 41.0 - 42.6 - 38.3Net result 324.1 278.2 270.3 512.6 .. Gain/(loss) on revaluation of properties 2 276.0 2 460.1 2 647.2 2 870.5Total changes in equity other than
contributions to other sectors by the State in its capacity as owner
2 600.1 2 738.3 2 917.6 3 383.1
Source: Department of Treasury and Finance
Notes: (a) Taxation has been adjusted to exclude motor drivers’ licence fees, police learner and driver fees,
and other miscellaneous motor vehicle fees, which are now classified as regulatory fees. (b) Transitional adjustments consequent to the introduction of accrual - ceased from 1 July 2001.
Statement of Finances 2005-06 Appendix A 223
Table A.3: Abnormal items – historical series ($ million)
1996-97 1997-98 1998-99 Actual Actual Actual Revenue from ordinary activities Taxation - Business asset sales (a) 468.9 16.0 295.7 Investment income - Business asset sales (a) 3 820.3 1 880.2 5 722.9 - Gascor disaggregation - assumption of debt .. 391.7 .. Other revenue - Business asset sales (a) 87.5 60.2 234.5 - Reversal of Flexible Tariff Management Unit Trust
liability .. 1 275.2 ..
- Forgiveness of debt owed to Department of Treasury and Finance by SEMCL
.. .. 106.7
Expenses from ordinary activities Supplies and services - Business asset sales (a) - 55.7 - 49.5 - 100.8 Other expenses - Forgiveness of debt owed by Director of Housing to
Department of Treasury and Finance .. - 1 086.8 ..
- Loss on revaluation of water sector debt .. - 334.4 .. - Diminution of VAIP bonds .. .. - 122.0 Total abnormal items 4 321.0 2 152.6 6 136.9 Source: Department of Treasury and Finance
Note: (a) Total business asset sales.
224 Appendix A Statement of Finances 2005-06
Table A.4: General government operating expenditure by purpose 1961-62 to 1997-98 – historical series
($ million) 1961-62 1962-63 1963-64 1964-65 Actual Actual Actual Actual General public services 21 20 20 22Public order and safety 29 31 33 35 Primary and secondary 67 76 86 93 University 20 25 29 33 Technical and further education 0 0 0 0 Other tertiary 0 0 0 0 Other 9 10 11 12Education 98 111 126 138 Acute care institutions 28 30 31 33 Other health institutions 15 15 16 17 Community health services 2 2 2 2 Pharmaceutical 3 3 4 4 Other 3 4 4 5Health 51 55 57 61 Social security 0 0 0 0 Welfare services 1 1 1 1 Other 7 7 7 8Social security and welfare 8 8 8 9 Housing and community development 1 1 1 1 Water supply 0 0 0 0 Sanitation and protection of the environment 1 0 1 0 Other community amenities 0 0 0 0Housing and community amenities 1 1 2 1 Recreational facilities and services 2 2 2 2 Cultural facilities and services 2 2 2 2 Broadcasting and film production 0 0 0 0 Other recreation and culture 0 0 0 0Recreation and culture 4 4 4 5Fuel and energy 0 0 0 0Agriculture, forestry and fishing 11 11 15 15Mining, manufacturing and construction 2 2 2 2 Road transport 16 17 18 20 Water transport 1 1 2 1 Rail transport 15 16 16 15 Air transport 0 0 0 0 Communications and other transport 18 18 19 20Transport and communications 50 52 55 56Other economic affairs 5 6 6 6Nominal interest on superannuation 0 0 0 0Public debt transactions 69 74 79 86Other -2 -2 -3 -3Total GFS expenditure (a) 346 371 405 433
Statement of Finances 2005-06 Appendix A 225
Table A.4: General government operating expenditure by purpose 1961-62 to 1997-98 – historical series (continued)
Table A.4: General government operating expenditure by purpose 1961-62 to 1997-98 – historical series (continued)
($ million) 1973-74 1974-75 1975-76 1976-77 Actual Actual Actual Actual General public services 51 464 572 656Public order and safety 101 134 166 193 Primary and secondary 364 497 628 751 University 199 286 306 344 Technical and further education 18 26 34 42 Other tertiary 0 0 1 1 Other 37 64 81 98Education 619 873 1 050 1 237 Acute care institutions 135 183 366 422 Other health institutions 44 60 77 91 Community health services 7 12 17 22 Pharmaceutical 13 13 6 2 Other 18 24 36 44Health 217 292 502 581 Social security 6 3 9 6 Welfare services 9 13 18 21 Other 20 30 41 54Social security and welfare 34 47 68 81 Housing and community development 12 23 29 29 Water supply 1 1 4 3 Sanitation and protection of the environment 6 17 19 15 Other community amenities 0 0 0 0Housing and community amenities 18 41 52 47 Recreational facilities and services 8 13 20 21 Cultural facilities and services 9 13 17 21 Broadcasting and film production 0 0 0 0 Other recreation and culture 0 1 1 2Recreation and culture 17 27 38 44Fuel and energy 0 0 0 0Agriculture, forestry and fishing 41 51 65 70Mining, manufacturing and construction 3 4 6 7 Road transport 69 62 73 112 Water transport 3 3 4 5 Rail transport 97 152 170 192 Air transport 0 0 0 0 Communications and other transport 28 53 60 71Transport and communications 197 270 307 379Other economic affairs 18 23 28 34Nominal interest on superannuation 0 0 0 0Public debt transactions 172 268 306 373Other 1 23 26 37Total GFS expenditure (a) 1 488 2 517 3 186 3 739
Statement of Finances 2005-06 Appendix A 227
Table A.4: General government operating expenditure by purpose 1961-62 to 1997-98 – historical series (continued)
Table A.4: General government operating expenditure by purpose 1961-62 to 1997-98 – historical series (continued)
($ million) 1985-86 1986-87 1987-88 1988-89 1989-90 Actual Actual Actual Actual Actual General public services 1 745 1 952 2 088 2 220 2 317Public order and safety 632 678 729 830 978 Primary and secondary 1 994 2 089 2 188 2 451 2 564 University 654 673 760 726 736 Technical and further education 259 288 305 343 372 Other tertiary 17 23 4 5 7 Other 260 293 345 306 331Education 3 186 3 366 3 601 3 833 4 010 Acute care institutions 1 382 1 572 1 726 1 881 2 025 Other health institutions 243 267 323 356 387 Community health services 114 119 159 161 174 Pharmaceutical 1 2 2 0 0 Other 263 274 332 415 467Health 2 003 2 234 2 542 2 813 3 052 Social security 88 93 97 105 111 Welfare services 246 327 329 396 442 Other 1 1 0 0 0Social security and welfare 334 421 426 501 554 Housing and community development 210 218 222 262 359 Water supply 65 31 32 33 39 Sanitation and protection of the
environment 23 18 18 18 23
Other community amenities 0 0 1 0 0Housing and community amenities 299 268 274 313 421 Recreational facilities and services 82 87 96 138 154 Cultural facilities and services 62 67 69 83 92 Broadcasting and film production 4 4 4 4 4 Other recreation and culture 3 1 0 0 0Recreation and culture 152 159 170 225 250Fuel and energy 32 32 22 8 20Agriculture, forestry and fishing 168 193 207 215 229Mining, manufacturing and
construction 94 64 66 46 47
Road transport 362 334 376 421 431 Water transport 14 20 17 15 9 Rail transport 274 374 307 317 1 Air transport 0 0 0 0 0 Communications and other transport 249 478 326 323 675Transport and communications 899 1 206 1 027 1 076 1 116Other economic affairs 251 198 189 173 184Nominal interest on superannuation 0 0 0 0 0Public debt transactions 1 361 1 528 1 876 2 156 1 514Other 147 153 167 170 176Total GFS expenditure (a) 11 302 12 450 13 384 14 579 14 868
Statement of Finances 2005-06 Appendix A 229
Table A.4: General government operating expenditure by purpose 1961-62 to 1997-98 – historical series (continued)
Revised Budget Estimate Estimate Estimate General public services 2 165 2 448 2 688 2 804 3 097 Public order and safety 2 610 2 912 2 953 3 079 3 163 Education 7 784 8 119 8 436 8 555 8 848 Health 7 581 7 998 8 255 8 471 8 631 Social security and welfare 2 247 2 378 2 438 2 498 2 560 Housing and community amenities 1 352 1 413 1 389 1 386 1 396 Recreation and culture 775 942 669 637 660 Fuel and energy 39 49 51 48 39 Agriculture, forestry, fishing, and
hunting 479 155 155 159 166
Mining, manufacturing, and construction
20 0 0 0 0
Transport and communications 3 348 3 395 3 486 3 541 3 597 Other economic affairs 406 284 312 285 233 Other purposes (c) 172 165 304 481 562 Total GFS expenses (d) 28 977 30 259 31 135 31 944 32 952 Source: Department of Treasury and Finance
Notes: (a) Presentation of 2004-05 revised estimates are based on underlying existing AAS data. (b) Presentation of the 2005-06 to 2008-09 Budget estimates are based on A-IFRS data. (c) Includes nominal superannuation interest expense. (d) Expenses by purpose – Accrual GFS basis.
232 Appendix A Statement of Finances 2005-06
Statement of Finances 2005-06 Appendix B 233
APPENDIX B – REVISED 2004-05 BUDGET OUTCOME
This appendix provides revised estimates of the budget outcome for the 2004-05 financial year. The revised 2004-05 estimates take into account government policy decisions and economic developments impacting on both revenues and expenses since the presentation of the 2004-05 Budget to the Parliament in May 2004.
In order to provide a basis for comparison with the 2005-06 Budget which is presented on an Australian equivalents to the International Financial Reporting Standards (A-IFRS) basis, information on 2004-05 revised estimates has been presented on an A-IFRS basis. However, as A-IFRS does not come into effect until 1 July 2005, this appendix also presents 2004-05 revised estimates based on existing Australian Accounting Standards to enable comparison of the revised outcome with the 2004-05 published Budget.
PRESENTATION OF 2004-05 REVISED OUTCOME ON A-IFRS BASIS As discussed in the Introduction to this budget paper, the transition to A-IFRS has resulted in changes to accounting standards, and to the format in which the operating statement will be presented.
In order to assist in understanding how the budget estimates are affected by the implementation of A-IFRS, two tables have been included in this appendix showing the impact of the transition on the 2004-05 revised outcome.
Operating statement
Change to accounting standards under A-IFRS Table B.1 compares 2004-05 revised estimates prepared under the existing Australian Accounting Standards with those under A-IFRS. The Variance column in this table shows the differences in income and expenses recorded that are attributable to the implementation of A-IFRS.
The major difference under A-IFRS relates to superannuation. The variance to superannuation expense is primarily due to the fact that under A-IFRS the discount rate applied to value superannuation liabilities is different from that applied under the existing Australian Accounting Standards.
234 Appendix B Statement of Finances 2005-06
Table B.1: Comparison of operating statement for 2004-05 Revised outcome under existing Australian Accounting Standards (AAS) and A-IFRS
Income from transactions .. ..Taxation 10 355.6 .. 10 355.6Fines and regulatory fees 627.8 .. 627.8Investment income 1 323.0 .. 1 323.0Grants income 13 364.5 1.2 13 365.7Sales of goods and services 2 313.1 .. 2 313.1Fair value of assets received free of charge or for
nominal consideration 1.6 .. 1.6
Inter-sector capital asset charge 599.4 .. 599.4Other income 767.6 .. 767.6Total income from transactions 29 352.5 1.2 29 353.7Expenses from transactions .. ..Employee benefits 10 625.3 .. 10 625.3Superannuation 1 870.3 ( 199.7) 1 670.6Depreciation and amortisation 1 169.0 ( 1.8) 1 167.2Financing costs 482.2 .. 482.2Grants and transfer payments 5 196.6 .. 5 196.6Supplies and services 9 633.4 ( 0.1) 9 633.3Other expenses 0.4 .. 0.4Total expenses from transactions 28 977.1 ( 201.6) 28 775.5Net result from transactions 375.4 202.8 578.2.. .. ..Income/(expenses) from other economic flows .. ..Net gain/(loss) from disposal of physical assets 12.9 22.4 35.2Other income from other economic flows 31.3 ( 22.4) 9.0Actuarial gains/(losses) on superannuation defined
benefit plans 1 090.3 (1 863.2) ( 772.9)
Other expenses from other economic flows ( 228.4) .. ( 228.4)Net result from other economic flows 906.1 (1 863.2) ( 957.1)Net result 1 281.5 (1 660.4) ( 378.9)Source: Department of Treasury and Finance
Reporting format under A-IFRS Table B.1 has been presented in the reporting format that is used under A-IFRS, where movements have been separated into those relating to transactions (i.e. items over which government exercises control), and those from other economic flows (i.e. items that the government cannot control). The data upon which the 2004-05 Revised Existing AAS column is based are exactly the same as that shown in Table B.3, 2004-05 Statement of Financial Performance, but has been reclassified to reflect the new reporting format.
Statement of Finances 2005-06 Appendix B 235
Under the new reporting format, superannuation expenses are split between transactions and other economic flows:
• superannuation expenses relating to service cost (the cost of employer financed benefits that are expected to accrue in respect of defined benefit scheme members over the reporting period), interest cost, and the expected return on assets, are included as part of the net result from transactions; and
• any variations between actual experience and the actuarial assumptions used to calculate the superannuation expense reported in the net result from transactions, are reported as actuarial gains or losses and included in the net result from other economic flows.
Analysis has shown that actuarial gains and losses on superannuation are highly volatile, with potentially large movements in this item arising from month-to-month as a result of changes in financial market conditions.
As the estimated financial statements published in the Budget Papers are based on the best estimate at the time of market conditions, there is no forecast actuarial gain or loss on superannuation. However, Department of Treasury and Finance analysis shows that the impact of market conditions on actuarial movements measured under A-IFRS can be significant. For example, between December 2004 and January 2005 there was an actuarial loss on superannuation of approximately $100 million, and between January and February 2005 a gain of approximately $600 million. A further gain of approximately $74 million has been estimated for March 2005.
As shown in the sensitivity analysis in Chapter 7, Statement of Risks in Budget Paper No 2, even small movements in the bond rate have significant implications. A 1 per cent increase in the rate would increase the net result by about $2.9 billion. As the net result is significantly impacted by market movements on superannuation liabilities, over which the government has no control, it is not considered a measure of the government’s financial management. As net result from transactions is a more robust measure of the government’s management of the State’s finances, this is now the operating surplus target.
Table B.1 shows that on an A-IFRS basis, the 2004-05 revised net result from transactions is $578 million, which is consistent with the government’s target of an operating surplus of at least $100 million in each year. While the net result recorded in Table B.1 is negative, this results from economic flows beyond the control of government, primarily market-driven changes in superannuation expenses.
236 Appendix B Statement of Finances 2005-06
Balance sheet Table B.2 provides a comparison of the balance sheet prepared under the existing Australian accounting standards and A-IFRS, noting that there has been no change to the format of the balance sheet following the transition to A-IFRS. This table shows that the impact of the introduction of A-IFRS is a reduction of $6 678 million in general government net assets. This primarily reflects:
• an increase in superannuation liabilities of $5 806 million. This reflects the requirement under A-IFRS to use a long-term bond rate, rather than the expected long-term earning rate on scheme assets, as the discount rate. The adjustment of $5 806 million comprises an opening balance adjustment of $4 092 million on 1 July 2004 and a further movement of $1 714 million since that time, being primarily due to a change in the bond rate during the year. The measurement of superannuation liabilities under A-IFRS is discussed in more detail in Chapter 4, Balance Sheet Management and Outlook in Budget Paper No. 2; and
• a reduction in property, plant, equipment and infrastructure systems assets of $881 million, mainly as a result of the application of an impairment test under A-IFRS by the Department of Education and Training, where the carrying value of assets has decreased to reflect changing service capacity due to demographic shifts.
There has also been a reclassification of employee benefits by the Department of Human Services. Consistent with reporting requirements under A-IFRS, certain employee benefits that were previously classified as current liabilities are now classified as non-current liabilities.
Statement of Finances 2005-06 Appendix B 237
Table B.2: Comparison of balance sheet for 2004-05 revised outcome under existing Australian accounting standards and A-IFRS
REVISED 2004-05 STATEMENT OF FINANCIAL PERFORMANCE UNDER EXISTING AUSTRALIAN ACCOUNTING STANDARDS The 2004-05 statement of financial performance based on existing Australian Accounting Standards presented in Table B.3 shows the revised general government sector operating result for 2004-05 is a surplus of $1 282 million, $737 million higher than the original budget estimate. The major variance between the 2004-05 Budget and 2004-05 revised outcome is due to the impact of investment markets on unfunded superannuation. Better than expected asset investment returns on superannuation scheme assets, which were driven primarily by strong domestic equity markets, reduced the superannuation expense.
However, as noted above, under the A-IFRS reporting format, movements in superannuation expenses due to changed equity or financial market conditions are not included in the government’s target measure of net result from transactions. This is due to the fact that the government does not have control over movements in superannuation expense that result from changed market conditions. The illustrative presentation of the 2004-05 revised outcome under existing Australian accounting standards shows the net result from transactions as $375 million in Table B.1.
Operating revenue Total estimated operating revenue for 2004-05 has been revised upward by $412 million, or 1.4 per cent, from the original budget estimate of $28 985 million. This is mainly driven by an increase in grants revenue, reflecting an increase in the national GST pool, with Victoria’s share remaining constant. The change is also partly attributable to increases in payroll taxation, which is underpinned by strong employment growth during 2004-05.
Statement of Finances 2005-06 Appendix B 239
Table B.3: 2004-05 Statement of financial performance ($ million)
2004-05 2004-05 Change Change Budget Revised .. % Revenue from ordinary activities Taxation (a) 10 271.8 10 355.6 83.9 0.8 Fines and regulatory fees (a) 729.4 627.8 ( 101.6) (13.9) Investment revenue 1 225.4 1 345.9 120.5 9.8 Grants revenue 13 080.5 13 364.5 283.9 2.2 Sale of goods and services 2 231.3 2 313.1 81.8 3.7 Gain/(loss) from disposal of physical assets 11.9 12.9 1.0 8.5 Fair value of assets received free of charge or
for nominal consideration .. 1.6 1.6 ..
Inter-sector capital asset charge 587.5 599.4 11.9 2.0 Other revenue 847.1 776.0 ( 71.1) (8.4) Total revenue 28 984.9 29 396.7 411.9 1.4 Expenses from ordinary activities Employee benefits 10 480.5 10 625.3 144.8 1.4 Superannuation 1 789.2 780.0 (1 009.3) (56.4) Depreciation 1 142.7 1 112.3 ( 30.4) (2.7) Amortisation 67.0 56.6 ( 10.4) (15.5) Financing costs 476.2 482.2 6.0 1.3 Grants and transfer payments 5 087.7 5 196.6 108.9 2.1 Supplies and services 9 311.0 9 633.4 322.3 3.5 Other expenses 85.4 228.8 143.3 167.8 Total expenses 28 439.9 28 115.2 ( 324.7) (1.1) Net result 545.0 1 281.5 736.6 135.2 Source: Department of Treasury and Finance
Note: (a) Taxation has been adjusted to exclude motor drivers’ licence fees, police learner and driver fees,
and other miscellaneous motor vehicle fees, which are now classified as regulatory fees.
Taxation In 2004-05, taxation revenue is expected to total $10 356 million, $84 million or 0.8 per cent higher than the 2004-05 Budget estimate (see Table B.4). This increase is primarily the result of an increase in payroll taxation revenue. This increase is partly offset by a reduction in taxation revenue from insurance.
240 Appendix B Statement of Finances 2005-06
Table B.4: 2004-05 Taxation ($ million)
2004-05 2004-05 Change Change Budget Revised %
Payroll tax 2 875.5 2 994.0 118.5 4.1Taxes on immovable property Land tax 916.5 854.6 ( 61.9) (6.8)Metropolitan improvement levy 88.4 88.4 .. ..Property owner contributions to fire brigades 32.1 32.0 ( 0.1) (0.2)Total taxes on immovable property 1 036.9 975.0 ( 61.9) (6.0)Financial and capital transactions Land transfers 2 235.7 2 235.7 .. ..Stamp duty on mortgages 54.4 13.6 ( 40.8) (75.0)Rental business stamp duty 57.0 54.5 ( 2.5) (4.4)Other property stamp duty 7.2 10.5 3.3 46.7Debits tax 248.9 256.8 7.9 3.2Financial accommodation levy 7.4 10.9 3.5 46.9Total financial and capital transactions 2 610.6 2 582.0 ( 28.6) (1.1)Levies on statutory corporations .. 44.7 44.7 ..Gambling taxes Private lotteries 318.3 307.8 ( 10.5) (3.3)Electronic gaming machines 828.8 842.6 13.8 1.7Casino 112.4 109.8 ( 2.6) (2.3)Racing 109.5 112.5 3.0 2.7Other 2.7 3.3 0.6 20.4Total gambling taxes 1 371.7 1 376.0 4.2 0.3Taxes on insurance 1 060.7 1 019.9 ( 40.8) (3.9)Motor vehicle taxes (a) Vehicle registration fees 672.8 670.9 ( 1.8) (0.3)Stamp duty on vehicle transfers 570.0 561.0 ( 9.0) (1.6)Total motor vehicle taxes 1 242.8 1 231.9 ( 10.8) (0.9)Other taxes 73.5 132.1 58.6 79.7Total taxation revenue 10 271.8 10 355.6 83.9 0.8Source: Department of Treasury and Finance
Note: (a) Taxation has been adjusted to exclude motor drivers’ licence fees, police learner and driver fees,
and other miscellaneous motor vehicle fees, which are now classified as regulatory fees.
Payroll tax revenue in 2004-05 has been revised up 4.1 per cent or $119 million since the 2004-05 Budget to $2 994 million. The increase in revenue is mainly due to strong employment growth during 2004-05.
Taxes on immovable property in 2004-05 are estimated to total $975 million in 2004-05, a decrease of $62 million since the 2004-05 Budget. The decrease largely reflects the general land tax rebate announced in the 2005-06 Budget.
Total taxes on financial and capital transactions in 2004-05 are estimated to generate $2 582 million, $29 million or 1.1 per cent lower than the 2004-05 Budget estimate. The decrease reflects lower than anticipated flow-on revenue in 2004-05 following the abolition of mortgage duty from 1 July 2004.
Statement of Finances 2005-06 Appendix B 241
Total tax revenue from insurance taxes is estimated to be $1 020 million, $41 million or 3.9 per cent lower that the 2004-05 Budget estimate. The downward revision since the 2004-05 Budget principally generally reflects softening in the non-life insurance market and particularly in the area of commercial insurance.
Motor vehicle taxation revenue in aggregate has been revised downwards by $11 million (or 0.9 per cent) since the 2004-05 Budget to $1 232 million, reflecting:
• lower than expected new motor vehicle registrations; and
• lower transaction volumes and average duty per transaction.
The increase in other taxes relates to an agreement between the State and Transurban to redeem the concession notes held by the State to construct the Tullamarine-Calder interchange. Due to different valuation methodologies of the notes being applied by the State and Transurban, this transaction has resulted in increasing taxation receivables from original budget by $47 million. In addition, the State has also recognised an $11 million payment from Transurban for the additional traffic that will be attracted onto City Link as a result of the construction of the interchange.
Fines and regulatory fees Fines and regulatory fees are estimated to be $628 million, $102 million or 13.9 per cent lower than the 2004-05 original budget estimate. The downward revision largely reflects the identification of issues associated with the fixed digital safety camera system, which has resulted in delays in the implementation of a number of safety initiatives.
Investment revenue Total investment revenue is expected to be $1 346 million. This is $121 million (or 9.8 per cent) higher than forecast in the 2004-05 Budget (see Table B.5). This primarily reflects higher than expected dividends and tax equivalent payments. This increase is offset by a reduction in estimated interest revenue.
Table B.5: 2004-05 Investment revenue ($ million)
2004-05 2004-05 Change Change Budget Revised % Dividends 478.1 512.1 34.1 7.1 Income tax and rate equivalent revenue 186.5 332.8 146.2 78.4 Interest 435.5 355.8 ( 79.7) (18.3) Royalties 43.3 43.3 .. .. Rents 15.6 15.2 ( 0.4) (2.6) Other 66.3 86.6 20.3 30.7 Total investment revenue 1 225.4 1 345.9 120.5 9.8 Source: Department of Treasury and Finance
242 Appendix B Statement of Finances 2005-06
Grants revenue As highlighted in Table B.6, total grants received are now expected to be $284 million (or 2.2 per cent) higher than the 2004-05 Budget forecast.
Table B.6: 2004-05 Grants revenue ($ million)
2004-05 2004-05 Change Change Budget Revised % Operating grants General purpose grants 7 281.7 7 564.0 282.3 3.9Specific purpose grants for on-passing 1 561.5 1 577.8 16.3 1.0Other specific purpose grants 3 653.9 3 691.6 37.7 1.0Total operating grants 12 497.2 12 833.4 336.3 2.7Capital grants Specific purpose grants for on-passing 127.9 126.9 ( 1.1) (0.8)Other specific purpose grants 455.4 404.2 ( 51.3) (11.3)Total capital grants 583.4 531.0 ( 52.3) (9.0)Total grants revenue 13 080.5 13 364.5 283.9 2.2Source: Department of Treasury and Finance
General purpose grants, including GST grants, have been revised upwards by $282 million (or 3.9 per cent) compared to the 2004-05 Budget. The increase reflects an increase in the national GST pool, with Victoria's share remaining constant.
Specific purpose payments, including specific purpose grants for on-passing, have in aggregate been revised upwards by $2 million since the original 2004-05 Budget estimates.
Other revenue
The 2004-05 revised estimate for other revenue (comprising sales of goods and services, assets received free of charge, gains/(loss) from disposal of physical assets, inter-sector capital asset charge and other revenue) totals $3 703 million. This is $25 million (or 0.7 per cent) higher than the original budget estimate.
Operating expenses As shown in Table B.3, general government sector operating expenses for 2004-05 are now projected to be $28 115 million, $325 million lower that the original budget estimate of $28 440 million.
The major variation within operating expenses is attributable to a significant downward revision of superannuation expense. Superannuation expense reflects employer contributions to superannuation schemes and the net movement in unfunded superannuation liabilities. The revision is a result of higher than expected investment returns on superannuation scheme assets in 2004-05, which is largely due to improvements in domestic equity markets.
Statement of Finances 2005-06 Appendix B 243
As a result of the improved equity market performance for the 2004-05 year, the State Superannuation Fund is expected to return 13.2 per cent for the year compared to the original 2004-05 Budget expected return of 7.5 per cent.
Superannuation expenses for 2004-05 are now estimated to total $780 million, $1 009 million (or 56.4 per cent) lower than the budget estimate.
The State’s superannuation schemes have substantial holdings of domestic equities. Equity market performance therefore has a significant impact on the State’s superannuation expense and unfunded superannuation liability.
Other major drivers include employee benefits and supplies and services:
• there was an increase in the revised estimate for employee benefits of $145 million to $10 625 million. This represents a variation of 1.4 per cent from the budget estimate of $10 481 million. The change reflects the Government’s continuing commitment to improve services including health, education and justice; and
• supplies and services are now estimated to be $9 633 million, or 3.5 per cent higher than the original budget of $9 311 million. This mainly reflects the write-off of land provided by the State for infrastructure projects.
Most other revised expense categories were largely in line with the original budget. The revised estimate for grants and transfer payments is $5 197 million, $109 million (or 2.1 per cent) higher than the original budget of $5 088 million.
REVISED 2004-05 CASH FLOW STATEMENT Table B.7 provides the revised cash flow statement for 2004-05. Table B.8 provides a summary of cash generated through the operations of Victorian government departments and other general government sector agencies during the year, and how that cash is applied to infrastructure investment and financing activities. Table B.8 also provides a reconciliation of the projected budget operating surplus to the projected change in general government net debt.
Net cash flow from operating activities is now expected to be $2 247 million compared with the published estimate of $2 541 million. The $293 million variation reflects the impact of a $409 million increase in operating receipts offset by a $702 million increase in payments in relation to operating activities.
The expected increase in receipts is generally attributable to the factors that form the basis of the increase in operating revenue. General purpose grants have been revised upwards to reflect an increase in the national GST pool, with Victoria’s share constant. Taxation has also been revised upwards and this has been partially driven by strong employment growth during 2004-05. These factors have been discussed in greater detail earlier in this chapter under Operating revenue. The increase in the
244 Appendix B Statement of Finances 2005-06
revised operating payments generally reflects the increase in the cash related operating expense items and an increase in the level of payments made to the State’s superannuation schemes.
2004-05 2004-05 Change Change Budget Revised % Cash flows from operating activities Receipts Taxation (a) 10 249.3 10 275.2 25.9 0.3Fines and regulatory fees (a) 610.3 518.9 ( 91.4) (15.0)Grants 13 080.0 13 362.2 282.1 2.2Sale of goods and services 2 230.2 2 312.4 82.2 3.7Interest received 434.8 355.5 ( 79.4) (18.2)Dividends received 478.1 512.1 34.1 7.1Capital asset charge received 587.5 599.4 11.9 2.0Other receipts 1 119.7 1 263.4 143.7 12.8Total receipts 28 789.9 29 199.0 409.2 1.4Payments Employee benefits (10 283.1) (10 399.3) ( 116.2) 1.1Superannuation (1 121.8) (1 527.0) ( 405.2) 36.1Interest paid ( 483.5) ( 423.0) 60.4 (12.5)Grants and transfer payments (5 030.6) (5 298.3) ( 267.6) 5.3Supplies and services (9 330.3) (9 304.0) 26.3 (0.3)Total payments (26 249.3) (26 951.7) ( 702.4) 2.7Net cash flows from operating activities 2 540.6 2 247.4 ( 293.2) (11.5)Cash flows from investing activities .. .. ..Purchase of property, plant and equipment (2 470.9) (2 197.5) 273.4 (11.1)Proceeds from sale of property, plant and
equipment 80.9 71.6 ( 9.3) (11.5)
Net (purchase)/disposal of investments 173.6 107.5 ( 66.2) (38.1)Net customer loans (granted)/repaid 20.0 10.6 ( 9.4) (47.2)Net contribution to other sectors of government ( 481.6) ( 514.2) ( 32.6) 6.8Net cash flows from investing activities (2 677.9) (2 522.0) 155.9 (5.8)Cash flows from financing activities Net borrowings 213.6 283.3 69.8 32.7Net cash flows from financing activities 213.6 283.3 69.8 32.7Net increase/(decrease) in cash and
deposits held 76.2 8.7 ( 67.6) (88.6)
Cash and deposits at beginning of reporting period
1 295.2 1 295.2 .. ..
Cash and deposits at end of reporting period
1 371.4 1 303.9 ( 67.6) (4.9)
Source: Department of Treasury and Finance
Note: (a) Taxation has been adjusted to exclude motor drivers’ licence fees, police learner and driver fees,
and other miscellaneous motor vehicle fees, which are now classified as regulatory fees.
Statement of Finances 2005-06 Appendix B 245
Table B.8: Application of cash resources ($ million)
2004-05 2004-05 Budget Revised Operating surplus 545.0 1 281.5 Add back: Non-cash revenue and expenses (net) (a) 1 995.6 965.8 Net cash flow from operating activities 2 540.6 2 247.4 Plus: Net drawdown of Growing Victoria infrastructure reserve 185.6 196.6 Total cash available for asset investment 2 726.2 2 443.9 Less: Net investment in fixed assets Purchase of property, plant and equipment 2 470.9 2 197.5 Proceeds from sale of property, plant and equipment ( 80.9) ( 71.6) Net contribution to other sectors of government 481.6 514.2 Total net investment in fixed assets 2 871.6 2 640.0 Other investment activities (net) ( 1.9) 127.0 Decrease/(increase) in net debt (excluding Growing Victoria) ( 143.4) ( 323.1) Source: Department of Treasury and Finance
Note: (a) Includes depreciation and movements in the unfunded superannuation liability and liability for
employee benefits.
As shown in Table B.8, the $2 247 million cash surplus from operating activities will be the main source of financing for the 2004-05 net infrastructure investment program. There is also a $197 million drawdown from the Growing Victoria infrastructure reserve.
The purchase of property, plant and equipment has been revised to $2 198 million for 2004-05. The variation from the 2004-05 Budget amount of $2 471 million reflects the conversion of the correctional facilities project to a Partnerships Victoria initiative, with operating payments commencing in 2005-06. The original 2004-05 Budget included the project as a state-built asset. The revised amount also reflects the rephasing of various road projects between 2004-05 and 2005-06.
Net debt (excluding Growing Victoria) is expected to increase by $323 million in 2004-05. This contrasts with the original budget estimate of a $143 million increase. This reflects increased payments to superannuation schemes to decrease the unfunded superannuation liability.
REVISED 2004-05 STATEMENT OF FINANCIAL POSITION The estimated 2004-05 statement of financial position is presented in Table B.9. Net assets are now projected to increase from $26 279 million at 30 June 2004 to a revised estimate of $32 643 million at 30 June 2005. This represents an increase of $6 364 million (or 24.2 per cent) over the course of 2004-05.
246 Appendix B Statement of Finances 2005-06
The projected increase in total assets of $6 105 million between the actual 2003-04 result and the revised 2004-05 result largely comprises of an increase in total non-current assets of $6 164 million. This increase largely reflects the revaluation of crown land by the Department of Sustainability and Environment. The revaluation of land is required to complete the Department’s transition from cost to fair value as required under AASB 1041. As part of the transitional provisions of the standard, all assets must be valued at fair value by 30 June 2005.
Non-current assets largely comprise buildings and land, infrastructure systems, plant and equipment, road networks and associated accumulated depreciation.
Total liabilities in 2004-05 are estimated to be $24 545 million compared to the original budget of $25 899 million. The revision of $1 355 million is largely influenced by the reduction in the current and non-current unfunded superannuation liability, which is in turn driven primarily by strong domestic equity markets. This has been marginally offset by an increase in non-current interest bearing liabilities and employee benefits.
Statement of Finances 2005-06 Appendix B 247
Table B.9: 2004-05 Statement of financial position as at 30 June ($ million)
Notes: (a) 2004-05 Budget is based on actual opening balances as at 1 July 2004 plus 2004-05 Budget
movement. (b) The change reflects the difference between 2004-05 revised and 2003-04 actuals.
248 Appendix B Statement of Finances 2005-06
Statement of Finances 2005-06 Appendix C 249
APPENDIX C – DEPARTMENTAL FINANCIAL STATEMENTS – REVISED ESTIMATES 2004-05
Appendix C provides financial reports for each department based on existing Australian Accounting Standards (AAS).
The revised 2004-05 departmental financial estimates provide a comparison between 2003-04 actual results and the 2004-05 Budget and revised estimate prior to restatement to Australian equivalents to International Financial Reporting Standards (A-IFRS). They are presented in the format consistent with the AAS 29 accounting standard. Consistent with Chapter 2, Departmental Financial Statements, the statements have been divided into controlled and administered items. Administered items refer to those resources over which a department cannot exercise direct control. Authority is provided through an appropriation for payments made on behalf of the State. Under the AAS 29 standard, these items would normally appear as notes to the financial statements.
For the presentation of departmental financial reports for 2004-05 revised and 2005-06 Budget estimates prepared under A-IFRS, refer to Chapter 2, Departmental Financial Statements. These statements are not comparable to the estimated financial statements prepared on the basis of existing AAS in this appendix.
250 Appendix C Statement of Finances 2005-06
Statement of Finances 2005-06 Education and Training 251
DEPARTMENT OF EDUCATION AND TRAINING
Table C.1.1: Statement of financial performance ($ million)
2003-04 2004-05 2004-05 Actual Budget Revised Revenue from ordinary activities Output appropriations 5 756.8 6 082.1 6 248.9 Special appropriations 0.3 0.3 0.3 Resources received free of charge or for nominal
consideration .. 0.7 0.7
Sale of goods and services 506.4 499.1 527.2 Commonwealth grants 296.6 270.8 270.8 Other revenue and revenue from other parties 319.2 365.7 306.6 6 879.4 7 218.7 7 354.5 Expenses from ordinary activities Employee benefits 4 120.4 4 135.0 4 248.3 Depreciation and amortisation 280.2 291.2 287.1 Grants and other payments 553.5 582.7 590.2 Capital asset charge 666.8 764.6 762.9 Supplies and services 1 180.9 1 292.7 1 354.8 Financing costs 0.7 0.9 1.0 Other expenses from ordinary activities 5.0 .. .. 6 807.6 7 067.1 7 244.4 Net result for the reporting period 71.8 151.6 110.2 Net increase in asset revaluation reserve 1 165.9 .. .. Total changes in equity other than those resulting from
transactions with the State in its capacity as owner 1 237.7 151.6 110.2
Source: Departments of Education and Training and Treasury and Finance
252 Education and Training Statement of Finances 2005-06
Table C.1.2: Statement of cash flows ($ million)
2003-04 2004-05 2004-05 Actual Budget Revised Cash flows from operating activities Receipts from Government 5 996.3 6 301.5 6 404.9Receipts from other entities 487.8 494.7 524.3Payments for supplies, grants and employees (5 765.8) (5 999.4) (6 156.4) 718.3 796.8 772.7Interest received 35.4 30.1 30.0Capital asset charge ( 666.8) ( 764.6) ( 762.9)Financing costs expense ( 0.7) ( 0.9) ( 1.0)Other receipts 312.1 364.7 298.0Net cash inflow from operating activities 398.2 426.2 336.8 Cash flows from investing activities Payments for property, plant and equipment ( 494.3) ( 471.2) ( 437.4)Proceeds from sale of property, plant and equipment 8.8 1.5 2.3Net disposal (+) of investments ( 11.9) .. ..(Repayment of) loans by other entities ( 0.2) .. ..Net cash (outflow) from investing activities ( 497.5) ( 469.7) ( 435.1) Cash flows from financing activities Net proceeds from capital contribution by State
Government 74.8 68.1 73.6
Net proceeds from borrowings 0.5 .. 2.0Net cash inflows/(outflow) from financing activities 75.3 68.1 75.7Net increase/(decrease) in cash held ( 24.0) 24.6 ( 22.6)Cash at the beginning of the financial year 544.7 520.8 520.8Cash at the end of the financial year 520.8 545.4 498.1Source: Departments of Education and Training and Treasury and Finance
Statement of Finances 2005-06 Education and Training 253
Table C.1.3: Statement of financial position ($ million)
Estimated as at 30 June . 2004 2005 2005 Actual Budget Revised Current assets Cash assets 520.8 545.4 495.9 Other financial assets 164.1 164.1 164.1 Receivables 76.0 76.0 76.0 Inventories 9.4 9.4 9.4 Prepayments 19.5 19.6 19.6 Other 1.1 1.1 1.1 Total current assets 790.7 815.5 766.1 Non-current assets Receivables 382.3 434.0 497.5 Other financial assets 12.8 12.8 12.8 Property, plant and equipment 10 453.1 10 606.7 10 582.4 Intangible assets 0.5 0.5 0.5 Other 11.8 11.8 11.8 Total non-current assets 10 860.5 11 065.8 11 105.0 Total assets 11 651.3 11 881.4 11 871.1 Current liabilities Payables 209.7 211.5 211.5 Interest-bearing liabilities 0.7 0.7 0.5 Employee provisions 234.0 242.8 242.8 Other 78.3 78.3 78.3 Total current liabilities 522.8 533.3 533.1 Non-current liabilities Interest-bearing liabilities 4.7 4.7 4.7 Employee provisions 811.0 810.8 836.7 Amounts owing to other departments 0.3 0.3 0.3 Total non-current liabilities 816.0 815.8 841.7 Total liabilities 1 338.8 1 349.1 1 374.8 Net assets 10 312.5 10 532.2 10 496.3 Equity Contributed capital 5 909.9 5 978.0 5 983.5 Reserves 3 874.3 3 874.3 3 874.3 Accumulated surplus 528.3 679.9 638.5 Total equity 10 312.5 10 532.2 10 496.3 Source: Departments of Education and Training and Treasury and Finance
254 Education and Training Statement of Finances 2005-06
2003-04 2004-05 2004-05 Actual Budget Revised Administered revenue Sale of goods and services 1.8 1.7 1.7Commonwealth grants 1 700.6 1 851.8 1 878.7Other ( 8.1) 9.9 12.4Total administered revenue 1 694.3 1 863.4 1 892.7 Administered expenses Grants and other payments 1 203.7 1 322.4 1 343.9Payments into the Consolidated Fund 500.9 540.9 548.7Total administered expenses 1 704.6 1 863.3 1 892.6Revenue less expenses ( 10.3) 0.1 0.1 Administered assets Cash assets 0.4 0.4 0.4Receivables 16.4 16.4 16.4Other financial assets 1.3 1.3 1.3Prepayments 3.2 3.2 3.2Property, plant and equipment 10.9 10.9 10.9Total administered assets 32.1 32.2 32.2 Administered liabilities Payables 0.1 0.1 0.1Other 3.2 3.2 3.2Total administered liabilities 3.3 3.3 3.3Source: Departments of Education and Training and Treasury and Finance
Statement of Finances 2005-06 Human Services 255
DEPARTMENT OF HUMAN SERVICES
Table C.2.1: Statement of financial performance ($ million)
2003-04 2004-05 2004-05 Actual Budget Revised Revenue from ordinary activities Output appropriations 7 581.7 8 390.4 8 541.4 Special appropriations 1 030.1 1 032.1 1 059.1 Resources received free of charge or for nominal
consideration 0.8 .. ..
Sale of goods and services 859.7 895.2 900.4 Commonwealth grants 87.4 74.4 85.5 Other revenue and revenue from other parties 343.5 269.1 272.8 9 903.3 10 661.1 10 859.3 Expenses from ordinary activities Employee benefits 4 739.5 4 929.6 5 084.2 Depreciation and amortisation 252.4 275.9 275.8 Resources provided free of charge or for nominal
consideration .. .. 0.7
Grants and other payments 665.8 737.3 744.5 Capital asset charge 372.3 427.5 427.4 Supplies and services 3 871.9 4 159.8 4 230.3 Financing costs 2.1 0.4 0.4 Other expenses from ordinary activities 27.3 .. .. 9 931.3 10 530.5 10 763.3 Net result for the reporting period ( 28.1) 130.6 96.0 Net increase in asset revaluation reserve 159.9 .. .. Total changes in equity other than those resulting from
transactions with the State in its capacity as owner 131.8 130.6 96.0
Source: Departments of Human Services and Treasury and Finance
256 Human Services Statement of Finances 2005-06
Table C.2.2: Statement of cash flows ($ million)
2003-04 2004-05 2004-05 Actual Budget Revised Cash flows from operating activities Receipts from Government 8 633.8 9 419.1 9 615.8Receipts from other entities 871.5 925.6 931.0Payments for supplies, grants and employees (9 082.4) (9 695.2) (9 888.4) 422.8 649.5 658.4Interest received 35.4 35.0 35.0Capital asset charge ( 372.3) ( 427.5) ( 427.4)Financing costs expense ( 2.0) ( 0.4) ( 0.4)Other receipts 286.3 151.6 148.7Net cash inflow from operating activities 370.2 408.2 414.3 Cash flows from investing activities Payments for property, plant and equipment ( 544.4) ( 664.7) ( 698.6)Proceeds from sale of property, plant and equipment 38.7 .. 40.0Net disposal (+) of investments 86.4 .. ..(Repayment of) loans by other entities ( 0.5) .. ..Net cash (outflow) from investing activities ( 419.8) ( 664.7) ( 658.6) Cash flows from financing activities Net proceeds from capital contribution by State
Government 113.9 171.1 158.2
Net proceeds from borrowings 16.8 89.4 89.4Net cash inflows/(outflow) from financing activities 130.7 260.5 247.7Net increase/(decrease) in cash held 81.1 4.0 3.3Cash at the beginning of the financial year 253.2 334.3 334.3Cash at the end of the financial year 334.3 338.3 337.6Source: Departments of Human Services and Treasury and Finance
Statement of Finances 2005-06 Human Services 257
Table C.2.3: Statement of financial position ($ million)
Estimated as at 30 June 2004 2004 2005 Actual Budget Revised Current assets Cash assets 334.3 338.3 337.6 Other financial assets 368.8 368.8 368.8 Receivables 241.8 297.6 304.1 Inventories 49.7 49.7 49.7 Prepayments 15.9 15.9 15.9 Other 6.5 6.5 6.5 Total current assets 1 017.0 1 076.8 1 082.6 Non-current assets Receivables 423.2 501.0 493.4 Other financial assets 115.9 115.9 115.9 Property, plant and equipment 5 218.7 5 603.8 5 593.5 Intangible assets 24.3 24.3 27.9 Other 8.0 8.0 8.0 Total non-current assets 5 790.1 6 252.9 6 238.7 Total assets 6 807.1 7 329.8 7 321.3 Current liabilities Payables 697.2 645.2 651.7 Interest-bearing liabilities 9.7 13.8 13.8 Employee provisions 547.5 557.3 557.2 Other 172.8 177.3 186.0 Total current liabilities 1 427.1 1 393.7 1 408.7 Non-current liabilities Interest-bearing liabilities 20.6 105.9 105.9 Employee provisions 583.1 645.0 651.3 Amounts owing to other departments 4.0 4.0 4.0 Other 383.9 383.9 401.6 Total non-current liabilities 991.6 1 138.8 1 162.8 Total liabilities 2 418.8 2 532.4 2 571.5 Net assets 4 388.3 4 797.3 4 749.8 Equity Contributed capital 3 669.3 3 947.7 3 934.9 Reserves 1 058.7 1 058.7 1 058.7 Accumulated deficit ( 339.7) ( 209.1) ( 243.8) Total equity 4 388.3 4 797.3 4 749.8 Source: Departments of Human Services and Treasury and Finance
2003-04 2004-05 2004-05 Actual Budget Revised Administered revenue Sale of goods and services 250.7 232.7 255.3Commonwealth grants 2 616.1 2 756.8 2 778.6Other grants 2.1 .. ..Fees 2.4 2.9 2.9Other 10.1 3.8 3.8Total administered revenue 2 881.4 2 996.2 3 040.6 Administered expenses Expenses on behalf of the State 1.0 .. ..Grants and other payments 2.1 .. ..Payments into the Consolidated Fund 2 880.8 2 996.2 3 040.6Total administered expenses 2 883.9 2 996.2 3 040.6Revenue less expenses ( 2.5) .. .. Administered assets Cash assets 0.4 0.4 0.4Receivables 11.0 11.0 11.0Other financial assets 0.6 0.6 0.6Other 103.0 103.0 103.0Total administered assets 114.9 114.9 114.9 Administered liabilities Payables 1.6 1.6 1.6Other 106.9 106.9 106.9Total administered liabilities 108.5 108.5 108.5Source: Departments of Human Services and Treasury and Finance
Statement of Finances 2005-06 Infrastructure 259
DEPARTMENT OF INFRASTRUCTURE
Table C.3.1: Statement of financial performance ($ million)
2003-04 2004-05 2004-05 Actual Budget Revised Revenue from ordinary activities Output appropriations 2 504.0 2 977.4 2 778.0 Special appropriations 0.1 .. 1.7 Resources received free of charge or for nominal
consideration 371.5 5.0 5.0
Sale of goods and services 136.0 129.9 148.8 Commonwealth grants 0.1 .. .. Taxes (a) 8.0 4.3 8.7 Fines and fees (a) 46.8 45.8 46.6 Other revenue and revenue from other parties 109.0 218.0 187.4 3 175.5 3 380.4 3 176.2 Expenses from ordinary activities Employee benefits ( 258.1) 221.3 233.8 Depreciation and amortisation 296.7 340.0 319.0 Resources provided free of charge or for nominal
consideration 449.7 .. 360.3
Grants and other payments 802.7 769.1 914.5 Capital asset charge 62.2 78.5 67.9 Supplies and services 1 761.6 1 647.6 1 532.2 Financing costs 6.6 6.5 5.5 Other expenses from ordinary activities 2.1 .. 1.1 3 123.4 3 063.0 3 434.3 Net result for the reporting period 52.1 317.4 ( 258.1) Net increase in asset revaluation reserve 453.0 .. 488.0 Total changes in equity other than those resulting from
transactions with the State in its capacity as owner 505.1 317.4 229.9
Source: Departments of Infrastructure and Treasury and Finance
Note: (a) Taxation has been adjusted to exclude motor drivers’ licence fees, police learner and driver fees,
and other miscellaneous motor vehicle fees, which are now classified as regulatory fees.
260 Infrastructure Statement of Finances 2005-06
Table C.3.2: Statement of cash flows ($ million)
2003-04 2004-05 2004-05 Actual Budget Revised Cash flows from operating activities Receipts from Government 2 435.0 2 977.7 2 780.9Receipts from other entities 219.2 344.9 337.9Payments for supplies, grants and employees (2 356.0) (2 647.0) (2 748.9) 298.2 675.6 369.9Interest received 7.8 0.4 0.8Capital asset charge ( 62.2) ( 78.5) ( 67.9)Financing costs expense ( 6.6) ( 6.5) ( 5.5)Other receipts 19.5 46.5 50.1Net cash inflow from operating activities 256.7 637.5 347.4 Cash flows from investing activities Payments for property, plant and equipment (a) ( 437.2) ( 614.6) ( 433.8)Proceeds from sale of property, plant and equipment 15.0 6.2 19.4Payments for investments 0.5 .. ..Net disposal (+) of investments 14.0 Net cash (outflow) from investing activities ( 407.8) ( 608.4) ( 414.3) Cash flows from financing activities Net proceeds from capital contribution by State
Government (a) 132.7 82.8 61.6
Net proceeds from borrowings 0.5 .. ..Net cash inflows/(outflow) from financing activities 133.2 82.8 61.6Net increase/(decrease) in cash held ( 17.9) 111.9 ( 5.3)Cash at the beginning of the financial year 477.1 459.2 459.2Cash at the end of the financial year 459.2 571.1 453.9Source: Departments of Infrastructure and Treasury and Finance
Note: (a) Comparative data for 2003-04 actual and 2004-05 Budget have been adjusted to reflect the
changed accounting treatment for capital contributions to other sectors of government.
Statement of Finances 2005-06 Infrastructure 261
Table C.3.3: Statement of financial position ($ million)
Estimated as at 30 June 2004 2005 2005 Actual Budget Revised Current assets Cash assets 459.2 571.1 453.9 Other financial assets 50.0 50.0 50.0 Receivables 156.1 156.1 156.1 Inventories 2.6 2.6 2.6 Prepayments 2.7 2.7 2.7 Other 4.8 4.8 4.8 Total current assets 675.5 787.3 670.1 Non-current assets Receivables 245.5 245.2 244.2 Inventories 3.3 3.3 5.1 Property, plant and equipment 17 480.6 17 760.2 17 710.3 Intangible assets 7.3 7.3 7.3 Total non-current assets 17 736.6 18 016.0 17 966.8 Total assets 18 412.1 18 803.3 18 636.9 Current liabilities Payables 583.4 576.1 568.0 Employee provisions 26.3 26.3 26.3 Other 11.7 11.7 11.7 Total current liabilities 621.5 614.2 606.1 Non-current liabilities Interest-bearing liabilities 15.7 15.7 15.7 Employee provisions 54.2 52.7 52.7 Other 187.4 187.4 187.4 Total non-current liabilities 257.4 255.9 255.9 Total liabilities 878.9 870.0 861.9 Net assets 17 533.1 17 933.3 17 775.0 Equity Contributed capital 14 789.4 14 872.1 14 801.3 Reserves 3 256.5 3 256.5 3 744.6 Accumulated deficit ( 512.8) ( 195.4) ( 770.9) Total equity 17 533.1 17 933.3 17 775.0 Source: Departments of Infrastructure and Treasury and Finance
2003-04 2004-05 2004-05 Actual Budget Revised Administered revenue Appropriations - Payments made on behalf of the State 87.5 .. 9.0Sale of goods and services 0.1 0.0 2.8Commonwealth grants 131.7 256.8 182.4Other grants 1.9 .. ..Taxes (a) 1 147.7 1 276.7 1 320.0Fines 6.4 6.5 8.0Fees (a) 83.5 86.2 87.5Other 153.3 23.4 39.8Total administered revenue 1 612.1 1 649.6 1 649.6 Administered expenses Grants and other payments 89.4 .. 9.0Payments into the Consolidated Fund 1 355.5 1 613.7 1 546.8Total administered expenses 1 445.0 1 613.7 1 555.8Revenue less expenses 167.2 35.8 93.8 Administered assets Cash assets 11.0 11.0 11.0Receivables 205.8 240.7 298.7Total administered assets 216.8 251.8 309.8 Administered liabilities Payables 13.1 13.1 13.1Other 90.8 89.9 89.9Total administered liabilities 104.0 103.1 103.1Source: Departments of Infrastructure and Treasury and Finance
Note: (a) Taxation has been adjusted to exclude motor drivers’ licence fees, police learner and driver fees,
and other miscellaneous motor vehicle fees, which are now classified as regulatory fees.
Statement of Finances 2005-06 Innovation, Industry and Regional Development 263
DEPARTMENT OF INNOVATION, INDUSTRY AND REGIONAL DEVELOPMENT
Table C.4.1: Statement of financial performance ($ million)
2003-04 2004-05 2004-05 Actual Budget Revised Revenue from ordinary activities Output appropriations 293.4 298.1 323.5 Special appropriations 0.2 .. .. Sale of goods and services .. 1.5 1.5 Other revenue and revenue from other parties 13.0 1.1 1.1 306.6 300.7 326.1 Expenses from ordinary activities Employee benefits 61.2 67.1 63.7 Depreciation and amortisation 3.1 3.9 3.3 Grants and other payments 181.5 202.1 191.5 Capital asset charge 1.8 4.5 3.6 Supplies and services 69.8 71.4 112.3 317.5 349.0 374.4 Net result for the reporting period ( 10.9) ( 48.3) ( 48.3) Net increase in asset revaluation reserve 0.4 .. 3.6 Total changes in equity other than those resulting from
transactions with the State in its capacity as owner ( 10.5) ( 48.3) ( 44.7)
Source: Departments of Innovation, Industry and Regional Development and Treasury and Finance
264 Innovation, Industry and Regional Development Statement of Finances 2005-06
Table C.4.2: Statement of cash flows ($ million)
2003-04 2004-05 2004-05 Actual Budget Revised Cash flows from operating activities Receipts from Government 276.3 300.8 312.7Receipts from other entities 4.1 2.6 2.6Payments for supplies, grants and employees ( 299.0) ( 340.6) ( 367.5) ( 18.6) ( 37.2) ( 52.3)Interest received 0.6 .. ..Capital asset charge ( 1.8) ( 4.5) ( 3.6)Other receipts 8.7 .. ..Net cash inflow from operating activities ( 11.2) ( 41.7) ( 55.8) Cash flows from investing activities Payments for property, plant and equipment ( 53.9) ( 73.1) ( 63.4)Net cash (outflow) from investing activities ( 53.9) ( 73.1) ( 63.4) Cash flows from financing activities Net proceeds from capital contribution by State
Government 47.4 66.7 70.4
Net proceeds of borrowings 0.4 .. 0.8Net cash inflows / (outflow) from financing activities 47.8 66.7 71.2Net increase / (decrease) in cash held ( 17.2) ( 48.0) ( 48.0)Cash at the beginning of the financial year 134.4 117.2 117.2Cash at the end of the financial year 117.2 69.2 69.2Source: Departments of Innovation, Industry and Regional Development and Treasury and Finance
Statement of Finances 2005-06 Innovation, Industry and Regional Development 265
Table C.4.3: Statement of financial position ($ million)
Estimated as at 30 June 2004 2004 2005 Actual Budget Revised Current assets Cash assets 117.2 69.2 69.2 Receivables 8.5 20.9 8.5 Prepayments 0.7 0.7 0.7 Total current assets 126.4 90.8 78.3 Non-current assets Receivables 26.7 11.5 37.6 Other financial assets 0.1 0.1 0.1 Property, plant and equipment 68.1 137.3 131.8 Total non-current assets 94.9 148.9 169.5 Total assets 221.3 239.7 247.8 Current liabilities Payables 20.3 20.3 20.3 Interest-bearing liabilities 0.4 0.4 1.2 Employee provisions 7.7 7.7 7.7 Other 0.4 0.4 0.4 Total current liabilities 28.8 28.8 29.6 Non-current liabilities Employee provisions 11.4 11.4 11.4 Total non-current liabilities 11.4 11.4 11.4 Total liabilities 40.2 40.2 41.0 Net assets 181.1 199.5 206.8 Equity Contributed capital 68.9 135.7 139.3 Reserves 0.4 0.4 4.0 Accumulated surplus 111.8 63.5 63.5 Total equity 181.1 199.5 206.8 Source: Departments of Innovation, Industry and Regional Development and Treasury and Finance
266 Innovation, Industry and Regional Development Statement of Finances 2005-06
2003-04 2004-05 2004-05 Actual Budget Revised Administered revenue Sale of goods and services 0.3 .. ..Commonwealth grants 0.4 .. 0.2Fines .. 0.2 0.2Fees .. 2.2 2.2Other 4.2 0.3 0.3Total administered revenue 4.9 2.6 2.7 Administered expenses Expenses on behalf of the State ( 0.4) 0.1 0.1Payments into the Consolidated Fund 4.8 19.1 19.3Total administered expenses 4.4 19.2 19.3Revenue less expenses 0.5 ( 16.6) ( 16.6) Administered assets Cash assets ( 0.1) ( 0.1) ( 0.1)Receivables 47.1 47.1 47.1Total administered assets 47.0 47.0 47.0 Administered liabilities Total administered liabilities .. .. ..Source: Departments of Innovation, Industry and Regional Development and Treasury and Finance
Statement of Finances 2005-06 Justice 267
DEPARTMENT OF JUSTICE
Table C.5.1: Statement of financial performance ($ million)
2003-04 2004-05 2004-05 Actual Budget Revised Revenue from ordinary activities Output appropriations 2 073.4 2 274.7 2 220.3 Special appropriations 78.4 66.1 66.6 Resources received free of charge or for nominal
consideration 0.5 .. 1.6
Sale of goods and services 0.3 .. 0.4 Commonwealth grants 2.0 0.8 2.3 Fines and fees 6.3 7.2 6.9 Other revenue and revenue from other parties 86.3 74.5 88.8 2 247.1 2 423.1 2 386.9 Expenses from ordinary activities Employee benefits 1 300.2 1 364.0 1 385.7 Depreciation and amortisation 52.9 65.5 72.5 Resources provided free of charge or for nominal
consideration 2.2 .. ..
Grants and other payments 118.8 135.9 131.5 Capital asset charge 78.4 113.0 105.8 Supplies and services 650.1 727.8 666.3 Financing costs 2.6 3.3 5.4 Other expenses from ordinary activities 12.0 0.3 ( 0.8) 2 217.1 2 409.8 2 366.4 Net result for the reporting period 30.0 13.4 20.5 Net increase in asset revaluation reserve 143.0 .. .. Total changes in equity other than those resulting from
transactions with the State in its capacity as owner 173.0 13.4 20.5
Source: Departments of Justice and Treasury and Finance
268 Justice Statement of Finances 2005-06
Table C.5.2: Statement of cash flows ($ million)
2003-04 2004-05 2004-05 Actual Budget Revised Cash flows from operating activities Receipts from Government 2 124.6 2 318.9 2 274.5Receipts from other entities 23.5 14.1 22.9Payments for supplies, grants and employees (2 043.8) (2 202.7) (2 156.8) 104.3 130.2 140.6Interest received 57.7 53.4 60.5Capital asset charge ( 78.4) ( 113.0) ( 105.8)Financing costs expense ( 2.6) ( 3.3) ( 5.4)Other receipts 10.4 14.4 14.5Net cash inflow from operating activities 91.4 81.8 104.4 Cash flows from investing activities Payments for property, plant and equipment ( 186.2) ( 339.3) ( 211.2)Net disposal (+) of investments ( 34.1) ( 22.1) ( 30.9)(Repayment of) loans by other entities ( 5.1) .. ..Net cash (outflow) from investing activities ( 225.4) ( 361.4) ( 242.1) Cash flows from financing activities Net proceeds from capital contribution by State
Government 111.8 279.3 115.9
Net proceeds from borrowings 19.5 ( 1.8) 16.8Net cash inflows/(outflow) from financing activities 131.3 277.5 132.7Net increase/(decrease) in cash held ( 2.7) ( 2.1) ( 5.0)Cash at the beginning of the financial year 30.4 27.7 27.7Cash at the end of the financial year 27.7 25.6 22.7Source: Departments of Justice and Treasury and Finance
Statement of Finances 2005-06 Justice 269
Table C.5.3: Statement of financial position ($ million)
Estimated as at 30 June 2004 2005 2005 Actual Budget Revised Current assets Cash assets 27.7 25.6 22.7 Other financial assets 234.4 256.5 265.3 Receivables 41.8 41.8 41.8 Inventories 9.9 9.9 9.9 Prepayments 7.0 7.0 7.0 Total current assets 320.8 340.8 346.7 Non-current assets Receivables 226.6 249.3 241.3 Property, plant and equipment 1 180.1 1 454.8 1 320.8 Intangible assets 21.4 20.2 20.2 Other 5.2 5.2 5.2 Total non-current assets 1 433.3 1 729.5 1 587.6 Total assets 1 754.1 2 070.3 1 934.3 Current liabilities Payables 113.9 113.9 113.9 Interest-bearing liabilities 10.2 10.2 20.6 Employee provisions 82.3 107.5 90.4 Other 6.6 6.6 6.6 Total current liabilities 212.9 238.2 231.4 Non-current liabilities Interest-bearing liabilities 18.2 16.4 24.6 Employee provisions 310.6 310.7 329.5 Total non-current liabilities 328.8 327.1 354.1 Total liabilities 541.7 565.3 585.6 Net assets 1 212.3 1 505.0 1 348.7 Equity Contributed capital 723.1 1 002.4 839.0 Reserves 241.5 241.5 241.5 Accumulated surplus 247.7 261.1 268.2 Total equity 1 212.3 1 505.0 1 348.7 Source: Departments of Justice and Treasury and Finance
2003-04 2004-05 2004-05 Actual Budget Revised Administered revenue Appropriations - Payments made on behalf of the State 45.2 54.0 67.2Special appropriations 29.4 32.6 32.6Sale of goods and services 88.5 87.4 87.6Commonwealth grants 70.4 46.2 47.1Other grants 5.7 .. ..Taxes 1 324.2 1 371.7 1 376.0Fines 304.0 416.9 313.6Fees 79.4 73.2 73.2Other 59.7 46.1 53.1Total administered revenue 2 006.5 2 128.2 2 050.4 Administered expenses Expenses on behalf of the State 165.9 150.9 145.5Grants and other payments 38.8 36.6 53.0Payments into the Consolidated Fund 1 785.8 1 905.4 1 820.2Total administered expenses 1 990.5 2 092.9 2 018.6Revenue less expenses 16.0 35.3 31.8 Administered assets Cash assets 112.7 113.8 113.0Receivables 253.9 288.1 284.8Other financial assets 4.6 4.7 5.3Property, plant and equipment 0.1 .. 0.1Total administered assets 371.4 406.6 403.2 Administered liabilities Payables 87.5 87.5 87.5Employee provisions 0.2 0.3 0.3Other 49.6 49.6 49.7Total administered liabilities 137.4 137.4 137.5Source: Departments of Justice and Treasury and Finance
Note: (a) Taxation has been adjusted to exclude motor drivers’ licence fees, police learner and driver fees,
and other miscellaneous motor vehicle fees, which are now classified as regulatory fees.
Statement of Finances 2005-06 Premier and Cabinet 271
DEPARTMENT OF PREMIER AND CABINET
Table C.6.1: Statement of financial performance ($ million)
2003-04 2004-05 2004-05 Actual Budget Revised Revenue from ordinary activities Output appropriations 351.4 387.8 402.0 Special appropriations 5.3 5.0 5.2 Resources received free of charge or for nominal
consideration 0.6 1.3 1.3
Sale of goods and services 23.7 24.5 25.5 Commonwealth grants 3.4 .. .. Other revenue and revenue from other parties 67.3 25.9 24.7 451.7 444.5 458.6 Expenses from ordinary activities Employee benefits 132.9 135.1 144.6 Depreciation and amortisation 39.1 41.2 45.7 Resources provided free of charge or for nominal
consideration 0.6 .. ..
Grants and other payments 53.7 43.5 51.0 Capital asset charge 77.9 83.7 86.0 Supplies and services 123.5 137.5 132.6 Financing costs 0.2 0.1 0.1 Other expenses from ordinary activities 0.3 .. .. 428.3 440.9 460.1 Net result for the reporting period 23.4 3.6 ( 1.5) Net increase in asset revaluation reserve 28.3 .. .. Total changes in equity other than those resulting from
transactions with the State in its capacity as owner 51.8 3.6 ( 1.5)
Source: Departments of Premier and Cabinet and Treasury and Finance
272 Premier and Cabinet Statement of Finances 2005-06
Table C.6.2: Statement of cash flows ($ million)
2003-04 2004-05 2004-05 Actual Budget Revised Cash flows from operating activities Receipts from Government 356.2 360.7 374.7Receipts from other entities 40.4 24.8 26.1Payments for supplies, grants and employees ( 297.3) ( 314.9) ( 327.1) 99.4 70.6 73.7Interest received 5.5 1.8 2.4Capital asset charge ( 77.9) ( 83.7) ( 86.0)Financing costs expense ( 0.2) ( 0.1) ( 0.1)Other receipts 45.0 24.8 22.2Net cash inflow from operating activities 71.8 13.4 12.3 Cash flows from investing activities Payments for property, plant and equipment ( 81.1) ( 78.4) ( 62.6)Net disposal (+) of investments 0.5 2.2 ( 0.2)Net cash (outflow) from investing activities ( 80.5) ( 76.2) ( 62.7) Cash flows from financing activities Net proceeds from capital contribution by State
Government 2.7 66.6 46.9
Net proceeds from borrowings ( 0.9) ( 1.8) ( 1.8)Net cash inflows/(outflow) from financing activities 1.8 64.8 45.2Net increase/(decrease) in cash held ( 7.0) 2.1 ( 5.3)Cash at the beginning of the financial year 48.6 41.7 41.7Cash at the end of the financial year 41.7 43.8 36.4Source: Departments of Premier and Cabinet and Treasury and Finance
Statement of Finances 2005-06 Premier and Cabinet 273
Table C.6.3: Statement of financial position ($ million)
Estimated as at 30 June 2004 2005 2005 Actual Budget Revised Current assets Cash assets 41.7 43.8 36.4 Other financial assets 63.8 61.5 61.1 Receivables 20.2 20.2 20.2 Inventories 4.1 4.1 4.1 Prepayments 1.0 1.1 1.1 Total current assets 130.7 130.6 122.9 Non-current assets Receivables 35.6 67.7 68.1 Other financial assets 2.9 2.9 5.9 Property, plant and equipment 991.3 1 034.8 1 013.8 Intangible assets 0.5 0.5 0.5 Other 2 558.7 2 552.4 2 553.0 Total non-current assets 3 589.1 3 658.4 3 641.3 Total assets 3 719.8 3 789.0 3 764.2 Current liabilities Payables 27.6 27.7 27.5 Interest-bearing liabilities 0.4 0.4 0.4 Employee provisions 14.1 14.4 14.5 Other 18.3 17.8 17.7 Total current liabilities 60.4 60.2 60.1 Non-current liabilities Interest-bearing liabilities 7.7 5.9 5.9 Employee provisions 11.3 12.2 12.2 Total non-current liabilities 18.9 18.1 18.1 Total liabilities 79.3 78.3 78.2 Net assets 3 640.5 3 710.7 3 686.0 Equity Contributed capital 1 327.5 1 394.1 1 374.4 Reserves 2 138.7 2 138.7 2 139.8 Accumulated surplus 174.3 177.9 171.8 Total equity 3 640.5 3 710.7 3 686.0 Source: Departments of Premier and Cabinet and Treasury and Finance
274 Premier and Cabinet Statement of Finances 2005-06
2003-04 2004-05 2004-05 Actual Budget Revised Administered revenue Appropriations - Payments made on behalf of the State 19.7 .. ..Other 0.2 5.5 5.5Total administered revenue 20.0 5.5 5.5 Administered expenses Payments into the Consolidated Fund 0.4 5.6 5.6Total administered expenses 0.4 5.6 5.6Revenue less expenses 19.6 .. .. Administered assets Receivables 0.1 ( 1.7) 5.4Total administered assets 0.1 ( 1.7) 5.4 Administered liabilities Payables 7.0 5.2 12.3Interest-bearing liabilities ( 7.0) ( 7.0) ( 7.0)Total administered liabilities .. ( 1.8) 5.3Source: Departments of Premier and Cabinet and Treasury and Finance
Statement of Finances 2005-06 Primary Industries 275
DEPARTMENT OF PRIMARY INDUSTRIES
Table C.7.1: Statement of financial performance ($ million)
2003-04 2004-05 2004-05 Actual Budget Revised Revenue from ordinary activities Output appropriations 282.4 305.4 309.6 Special appropriations 4.2 .. .. Sale of goods and services 27.4 29.3 29.3 Taxes 3.9 4.5 4.5 Fines and fees 4.2 4.3 4.3 Other revenue and revenue from other parties 4.3 0.3 0.3 326.3 343.8 348.0 Expenses from ordinary activities Employee benefits 131.6 140.7 147.6 Depreciation and amortisation 8.6 17.7 17.7 Grants and other payments 45.2 32.0 27.5 Capital asset charge 13.2 18.7 18.7 Supplies and services 110.4 133.9 135.7 Borrowing costs 0.1 .. .. Other expenses from ordinary activities 2.4 .. .. 311.5 342.9 347.1 Net result for the reporting period 14.9 0.9 0.9 Net increase in asset revaluation reserve .. .. .. Total changes in equity other than those resulting from
transactions with the State in its capacity as owner 14.9 0.9 0.9
Source: Departments of Primary Industries and Treasury and Finance
276 Primary Industries Statement of Finances 2005-06
Table C.7.2: Statement of cash flows ($ million)
2003-04 2004-05 2004-05 Actual Budget Revised Cash flows from operating activities Receipts from Government 274.9 305.4 309.5Receipts from other entities 34.7 38.1 38.1Payments for supplies, grants and employees ( 268.4) ( 306.6) ( 309.8) 41.2 36.9 37.8Interest received 0.5 0.3 0.3Capital asset charge ( 13.2) ( 18.7) ( 18.7)Financing costs expense ( 0.1) .. ..Other receipts 4.2 .. ( 6.0)Net cash inflow from operating activities 32.5 18.6 13.5 Cash flows from investing activities Payments for property, plant and equipment ( 51.5) ( 6.3) ( 13.0)Proceeds from sale of property, plant and equipment 0.3 .. ..Net disposal (+) of investments ( 8.7) ( 25.9) ( 29.1)Net cash (outflow) from investing activities ( 59.9) ( 32.2) ( 42.1) Cash flows from financing activities Net proceeds from capital contribution by State
Government 23.8 13.8 29.0
Net proceeds from borrowings 3.2 .. ..Net cash inflows/(outflow) from financing activities 27.0 13.8 29.0Net increase/(decrease) in cash held ( 0.3) 0.2 0.4Cash at the beginning of the financial year 26.8 26.5 26.5Cash at the end of the financial year 26.5 26.7 26.9Source: Departments of Primary Industries and Treasury and Finance
Statement of Finances 2005-06 Primary Industries 277
Table C.7.3: Statement of financial position ($ million)
Estimated as at 30 June 2004 2005 2005 Actual Budget Revised Current assets Cash assets 26.5 26.7 26.9 Other financial assets 9.2 9.2 9.0 Receivables 11.2 11.2 12.1 Inventories 3.1 3.1 3.1 Prepayments 0.1 0.1 0.1 Total current assets 50.1 50.3 51.2 Non-current assets Receivables 47.2 47.2 52.3 Other financial assets 11.3 37.2 40.6 Property, plant and equipment 246.3 234.0 265.1 Intangible assets 10.2 11.2 10.2 Total non-current assets 315.1 329.6 368.3 Total assets 365.2 379.9 419.4 Current liabilities Payables 21.8 21.1 21.1 Interest-bearing liabilities 3.2 3.2 3.2 Employee provisions 14.5 14.5 14.5 Other ( 0.8) ( 0.8) 0.1 Total current liabilities 38.7 38.0 38.9 Non-current liabilities Employee provisions 38.8 38.8 38.8 Other 1.8 1.8 1.8 Total non-current liabilities 40.6 40.6 40.6 Total liabilities 79.3 78.6 79.5 Net assets 285.9 301.3 340.0 Equity Contributed capital 240.3 254.8 293.5 Accumulated surplus 45.6 46.5 46.5 Total equity 285.9 301.3 340.0 Source: Departments of Primary Industries and Treasury and Finance
278 Primary Industries Statement of Finances 2005-06
2003-04 2004-05 2004-05 Actual Budget Revised Administered revenue Sale of goods and services 66.5 40.2 40.2Commonwealth grants 21.7 14.2 14.2Other grants .. 5.7 5.7Fees 6.1 9.0 6.6Other 29.8 24.3 23.9Total administered revenue 124.0 93.5 90.7 Administered expenses Expenses on behalf of the State 4.5 .. ..Payments into the Consolidated Fund 107.4 93.2 90.4Total administered expenses 111.9 93.2 90.4Revenue less expenses 12.1 0.3 0.3 Administered assets Cash assets 1.7 1.9 1.9Receivables 39.7 39.7 39.7Total administered assets 41.4 41.7 41.7 Administered liabilities Payables 0.2 0.2 0.2Other 5.2 5.2 5.2Total administered liabilities 5.4 5.4 5.4Source: Departments of Primary Industries and Treasury and Finance
Statement of Finances 2005-06 Sustainability and Environment 279
DEPARTMENT OF SUSTAINABILITY AND ENVIRONMENT
Table C.8.1: Statement of financial performance ($ million)
2003-04 2004-05 2004-05 Actual Budget Revised Revenue from ordinary activities Output appropriations 828.9 729.6 792.8 Special appropriations 0.2 .. .. Resources received free of charge or for nominal
consideration 5.3 .. ..
Sale of goods and services 27.2 9.3 14.8 Commonwealth grants 16.9 .. .. Taxes 109.0 120.4 120.4 Fines and fees 9.7 6.6 6.6 Other revenue and revenue from other parties 19.2 0.9 0.9 1 016.3 866.7 935.4 Expenses from ordinary activities Employee benefits 211.6 219.9 217.3 Depreciation and amortisation 27.3 35.2 35.2 Resources provided free of charge or for nominal
consideration 1.8 .. 14.6
Grants and other payments 391.1 303.6 351.4 Capital asset charge 58.0 65.1 65.1 Supplies and services 274.9 239.5 265.5 Financing costs 0.2 0.0 0.0 Other expenses from ordinary activities 145.8 0.8 20.3 1 110.6 864.1 969.4 Net result for the reporting period ( 94.2) 2.6 ( 34.0) Net increase in asset revaluation reserve (a) ( 17.1) .. 4 128.8 Total changes in equity other than those resulting from
transactions with the State in its capacity as owner ( 111.3) 2.6 4 094.8
Source: Departments of Sustainability and Environment and Treasury and Finance
Note: (a) The net increase in asset revaluation reserve in the 2004-05 revised budget relates to a
$4 128.8 million revaluation of Crown land required to complete the Department’s transition from cost to fair value as required under AASB 1041. As part of the transitional provisions of the standard, all assets must be valued at fair value by 30 June 2005. A transitional valuation program was developed in 2000 as required, and this is one of the final items in the asset base to be valued.
280 Sustainability and Environment Statement of Finances 2005-06
Table C.8.2: Statement of cash flows ($ million)
2003-04 2004-05 2004-05 Actual Budget Revised Cash flows from operating activities Receipts from Government 810.6 724.7 787.9Receipts from other entities 140.6 136.3 140.6Payments for supplies, grants and employees ( 861.2) ( 759.1) ( 821.7) 90.0 101.9 106.8Interest received 2.1 0.7 0.7Capital asset charge ( 58.0) ( 65.1) ( 65.1)Financing costs expense ( 0.2) .. ..Other receipts 2.1 3.4 3.4Net cash inflow from operating activities 36.1 40.8 45.7 Cash flows from investing activities Payments for property, plant and equipment ( 68.7) ( 69.0) ( 67.3)Proceeds from sale of property, plant and equipment 1.2 .. ..Net disposal (+) of investments 0.6 ( 15.6) ( 15.6)(Repayment of) loans by other entities ( 0.7) .. ..Net cash (outflow) from investing activities ( 67.6) ( 84.6) ( 82.9) Cash flows from financing activities Net proceeds from capital contribution by State
Government 30.2 43.9 45.9
Net proceeds from borrowings 2.5 .. ..Net cash inflows/(outflow) from financing activities 32.7 43.9 45.9Net increase/(decrease) in cash held 1.1 0.1 8.7Cash at the beginning of the financial year 51.7 52.8 52.8Cash at the end of the financial year 52.8 52.9 61.5Source: Departments of Sustainability and Environment and Treasury and Finance
Statement of Finances 2005-06 Sustainability and Environment 281
Table C.8.3: Statement of financial position ($ million)
Estimated as at 30 June 2003-04 2004-05 2005 Actual Budget Revised Current assets Cash assets 52.8 52.9 61.5 Other financial assets 17.4 17.4 17.4 Receivables 45.3 45.3 46.5 Inventories 8.6 8.6 8.6 Prepayments 16.9 16.9 16.9 Other 0.5 0.5 0.5 Total current assets 141.6 141.7 151.4 Non-current assets Receivables 69.2 74.1 74.1 Inventories 2.2 2.2 2.2 Property, plant and equipment (a) 3 134.2 3 166.8 7 294.1 Intangible assets 46.3 43.7 43.4 Other 143.1 143.1 109.0 Total non-current assets 3 395.1 3 429.9 7 522.9 Total assets 3 536.7 3 571.5 7 674.3 Current liabilities Payables 56.0 56.0 64.8 Interest-bearing liabilities 0.5 0.5 0.5 Employee provisions 21.8 22.8 22.8 Other 0.3 0.3 0.1 Total current liabilities 78.6 79.6 88.2 Non-current liabilities Interest-bearing liabilities 2.0 2.0 2.0 Employee provisions 45.6 48.5 48.5 Total non-current liabilities 47.6 50.5 50.5 Total liabilities 126.2 130.1 138.7 Net assets 3 410.5 3 441.5 7 535.6 Equity Contributed capital 2 302.0 2 330.3 2 332.3 Reserves (a) 1 015.1 1 015.1 5 143.9 Accumulated surplus 93.5 96.1 59.5 Total equity 3 410.5 3 441.5 7 535.6 Source: Departments of Sustainability and Environment and Treasury and Finance
Note: (a) Property, plant and equipment includes a $4 128.8 million revaluation of Crown land required to
complete the Department’s transition from cost to fair value as required under AASB 1041. As part of the transitional provisions of the standard, all assets must be valued at fair value by 30 June 2005. A transitional valuation program was developed in 2000 as required, and this is one of the final items in the asset base to be valued.
282 Sustainability and Environment Statement of Finances 2005-06
2003-04 2004-05 2004-05 Actual Budget Revised Administered revenue Appropriations - Payments made on behalf of the State 26.1 26.9 26.9Sale of goods and services 216.6 195.2 193.2Commonwealth grants 49.5 34.5 54.6Taxes .. .. 44.7Fines 0.3 .. ..Fees 18.7 20.4 20.4Other 60.2 46.5 37.5Total administered revenue 371.3 323.5 377.3 Administered expenses Expenses on behalf of the State 0.1 1.1 1.1Grants and other payments 26.3 25.8 25.8Payments into the Consolidated Fund 347.9 296.6 350.4Total administered expenses 374.2 323.5 377.3Revenue less expenses ( 2.9) .. .. Administered assets Cash assets 2.3 2.3 2.3Receivables 23.3 23.3 23.3Other financial assets 0.1 0.1 0.1Total administered assets 25.6 25.6 25.6 Administered liabilities Payables 0.1 0.1 0.1Other 5.3 5.3 5.3Total administered liabilities 5.5 5.5 5.5Source: Departments of Sustainability and Environment and Treasury and Finance
Statement of Finances 2005-06 Treasury and Finance 283
DEPARTMENT OF TREASURY AND FINANCE
Table C.9.1: Statement of financial performance ($ million)
2003-04 2004-05 2004-05 Actual Budget Revised Revenue from ordinary activities Output appropriations 180.4 185.4 183.9 Sale of goods and services .. 0.3 0.3 Other revenue and revenue from other parties 86.9 53.1 58.2 267.3 238.8 242.5 Expenses from ordinary activities Employee benefits 73.6 78.4 82.0 Depreciation and amortisation 69.0 50.7 40.3 Grants and other payments 5.9 5.2 5.2 Capital asset charge 15.7 17.6 21.4 Supplies and services 64.4 68.8 74.2 Financing costs 17.5 12.5 18.7 Other expenses from ordinary activities 15.2 12.9 12.9 261.3 246.1 254.8 Net result for the reporting period 6.0 ( 7.3) ( 12.3) Net increase in asset revaluation reserve 62.1 .. .. Total changes in equity other than those resulting from
transactions with the State in its capacity as owner 68.1 ( 7.3) ( 12.3)
Source: Department of Treasury and Finance
284 Treasury and Finance Statement of Finances 2005-06
Table C.9.2: Statement of cash flows ($ million)
2003-04 2004-05 2004-05 Actual Budget Revised Cash flows from operating activities Receipts from Government 177.6 172.9 191.0Receipts from other entities ( 3.9) 0.3 0.3Payments for supplies, grants and employees ( 156.3) ( 169.0) ( 176.0) 17.3 4.3 15.4Interest received 0.0 .. 5.1Capital asset charge ( 15.7) ( 17.6) ( 21.4)Financing costs expense ( 26.6) ( 20.6) ( 26.8)Other receipts 106.9 65.0 65.0Net cash inflow from operating activities 81.9 31.1 37.3 Cash flows from investing activities Payments for property, plant and equipment ( 8.2) 34.0 ( 34.8)Proceeds from sale of property, plant and equipment 0.3 .. ..Net disposal (+) of investments 0.1 .. ..Net cash (outflow) from investing activities ( 7.8) 34.0 ( 34.8) Cash flows from financing activities Net proceeds from capital contribution by State
Government ( 0.6) 20.3 15.0
Net proceeds from borrowings ( 49.9) ( 85.4) ( 15.7)Net cash inflows/(outflow) from financing activities ( 50.6) ( 65.1) ( 0.7)Net increase/(decrease) in cash held 23.5 .. 1.8Cash at the beginning of the financial year 10.2 33.7 38.7Cash at the end of the financial year 33.7 33.7 40.4Source: Department of Treasury and Finance
Statement of Finances 2005-06 Treasury and Finance 285
Table C.9.3: Statement of financial position ($ million)
Estimated as at 30 June 2004 2005 2005 Actual Budget Revised Current assets Cash assets 33.7 33.7 40.4 Other financial assets 0.2 0.2 0.2 Receivables 11.9 11.9 11.9 Inventories 0.4 0.4 0.4 Prepayments 1.1 1.1 1.1 Other 3.9 3.9 3.9 Total current assets 51.2 51.2 58.0 Non-current assets Receivables 117.9 130.4 197.1 Inventories 25.7 25.7 25.7 Property, plant and equipment 350.5 247.7 251.5 Intangible assets .. 7.2 15.7 Other 70.3 69.3 68.6 Total non-current assets 564.5 480.4 558.6 Total assets 615.7 531.6 616.6 Current liabilities Payables 19.7 19.7 19.7 Interest-bearing liabilities 92.8 84.7 89.7 Employee provisions 9.2 7.9 8.7 Other 47.5 43.8 43.8 Total current liabilities 169.2 156.1 161.9 Non-current liabilities Interest-bearing liabilities 117.1 31.8 120.0 Employee provisions 11.1 12.4 13.7 Total non-current liabilities 128.2 44.1 133.7 Total liabilities 297.4 200.2 295.5 Net assets 318.3 331.4 321.0 Equity Contributed capital 98.6 118.9 113.6 Reserves 116.2 116.2 116.2 Accumulated surplus 103.6 96.3 91.3 Total equity 318.3 331.4 321.0 Source: Department of Treasury and Finance
286 Treasury and Finance Statement of Finances 2005-06
2003-04 2004-05 2004-05 Actual Budget Revised Administered revenue Appropriations - Payments made on behalf of the State 798.2 1 661.7 1 101.8Special appropriations 1 897.1 197.6 697.2Sale of goods and services 6.5 7.1 6.4Commonwealth grants 7 185.7 7 287.7 7 569.7Taxes 7 466.7 7 510.6 7 495.9Fees 8.3 8.2 8.2Other 2 784.8 3 389.2 3 325.1Total administered revenue 20 147.2 20 062.1 20 204.3 Administered expenses Expenses on behalf of the State 482.8 2 039.7 523.0Grants and other payments 1 505.2 462.2 442.3Payments into the Consolidated Fund 17 203.5 18 255.7 18 790.6Total administered expenses 19 191.5 20 757.5 19 755.9Revenue less expenses 955.7 ( 695.4) 448.4 Administered assets Cash assets 257.0 335.4 257.4Receivables ( 690.7) ( 369.1) ( 662.6)Other financial assets 1 491.5 1 294.8 1 380.3Prepayments 6.3 6.3 6.3Property, plant and equipment 0.8 87.5 2.1Total administered assets 1 064.8 1 354.9 983.6 Administered liabilities Payables 76.9 76.9 76.9Interest-bearing liabilities 5 071.8 5 383.1 5 301.2Employee provisions 11 710.5 12 452.0 11 037.5Amounts owing to other departments 87.3 86.3 86.3Other 1 559.5 1 528.9 1 474.1Total administered liabilities 18 505.9 19 527.2 17 976.0Source: Department of Treasury and Finance
Statement of Finances 2005-06 Victorian Communities 287
DEPARTMENT FOR VICTORIAN COMMUNITIES
Table C.10.1: Statement of financial performance ($ million)
2003-04 2004-05 2004-05 Actual Budget Revised Revenue from ordinary activities Output appropriations 278.6 423.4 378.1 Special appropriations 40.0 .. 90.5 Sale of goods and services 1.7 .. .. Other revenue and revenue from other parties 144.9 117.2 27.6 465.2 540.6 496.3 Expenses from ordinary activities Employee benefits 40.7 47.8 48.8 Depreciation and amortisation 4.9 9.0 8.5 Grants and other payments 383.3 435.7 397.4 Capital asset charge 5.1 6.1 6.1 Supplies and services 47.6 60.0 50.4 Financing costs 0.1 .. .. Other expenses from ordinary activities 4.5 .. .. 486.2 558.6 511.2 Net result for the reporting period ( 21.0) ( 17.9) ( 15.0) Net increase in asset revaluation reserve 36.6 .. .. Total changes in equity other than those resulting from
transactions with the State in its capacity as owner 15.6 ( 17.9) ( 15.0)
Source: Department for Victorian Communities and Department of Treasury and Finance
288 Victorian Communities Statement of Finances 2005-06
Table C.10.2: Statement of cash flows ($ million)
2003-04 2004-05 2004-05 Actual Budget Revised Cash flows from operating activities Receipts from Government 296.7 418.1 462.8Receipts from other entities 42.9 4.0 22.8Payments for supplies, grants and employees ( 378.8) ( 434.4) ( 546.2) ( 39.2) ( 12.3) ( 60.5)Interest received 6.3 4.1 4.1Capital asset charge ( 5.1) ( 6.1) ( 6.1)Financing costs expense ( 0.1) .. ..Other receipts ( 12.9) .. ..Net cash inflow from operating activities ( 50.9) ( 14.2) ( 62.5) Cash flows from investing activities Payments for property, plant and equipment ( 8.1) ( 57.0) ( 76.4)Net disposal (+) of investments 10.0 34.5 32.2Net cash (outflow) from investing activities 1.9 ( 22.4) ( 44.2) Cash flows from financing activities Net proceeds from capital contribution by State
Government 26.7 53.4 124.1
Net proceeds from borrowings 0.1 .. ..Net cash inflows/(outflow) from financing activities 26.9 53.4 124.1Net increase/(decrease) in cash held ( 22.2) 16.7 17.4Cash at the beginning of the financial year 35.5 13.3 13.3Cash at the end of the financial year 13.3 30.1 30.8Source: Department for Victorian Communities and Department of Treasury and Finance
Statement of Finances 2005-06 Victorian Communities 289
Table C.10.3: Statement of financial position ($ million)
Estimated as at 30 June 2004 2005 2005 Actual Budget Revised Current assets Cash assets 13.3 30.1 30.8 Other financial assets 89.0 54.5 56.8 Receivables 16.0 16.0 16.0 Inventories 0.7 0.7 0.7 Other 6.0 6.0 6.0 Total current assets 125.1 107.3 110.3 Non-current assets Receivables 27.3 32.7 33.1 Property, plant and equipment 90.7 140.4 157.5 Intangible assets 0.8 0.8 0.8 Other 173.3 171.7 221.6 Total non-current assets 292.2 345.5 413.0 Total assets 417.3 452.8 523.3 Current liabilities Payables 23.6 23.6 67.0 Employee provisions 4.1 4.1 4.2 Other 0.2 0.2 0.2 Total current liabilities 28.0 28.0 71.5 Non-current liabilities Interest-bearing liabilities 0.1 0.1 0.1 Employee provisions 7.3 7.3 7.5 Total non-current liabilities 7.4 7.4 7.6 Total liabilities 35.4 35.4 79.1 Net assets 382.0 417.5 444.2 Equity Contributed capital 380.9 434.3 458.1 Reserves 42.4 42.4 42.4 Accumulated deficit ( 41.3) ( 59.3) ( 56.3) Total equity 382.0 417.4 444.2 Source: Department for Victorian Communities and Department of Treasury and Finance
290 Victorian Communities Statement of Finances 2005-06
2003-04 2004-05 2004-05 Actual Budget Revised Administered revenue Appropriations - Payments made on behalf of the State 16.5 17.8 18.5Special appropriations 100.7 109.1 ..Sale of goods and services 5.4 5.9 5.9Commonwealth grants 396.2 417.2 361.1Other grants 2.8 .. ..Fees 4.5 4.1 4.1Total administered revenue 526.1 554.2 389.7 Administered expenses Expenses on behalf of the State 100.7 109.1 ..Grants and other payments 372.4 385.0 379.4Payments into the Consolidated Fund 52.9 60.1 10.3Total administered expenses 526.0 554.2 389.7Revenue less expenses 0.2 .. .. Administered assets Receivables 0.3 0.3 0.3Total administered assets 0.3 0.3 0.3 Administered liabilities Other 0.1 0.1 0.1Total administered liabilities 0.1 0.1 0.1Source Department for Victorian Communities and Department of Treasury and Finance
Statement of Finances 2005-06 Parliament 291
PARLIAMENT OF VICTORIA
Table C.11.1: Statement of financial performance ($ million)
2003-04 2004-05 2004-05 Actual Budget Revised Revenue from ordinary activities Output appropriations 84.2 87.1 87.5 Special appropriations 32.1 34.4 34.4 Sale of goods and services 1.4 .. .. Other revenue and revenue from other parties 0.2 .. .. 117.9 121.5 121.9 Expenses from ordinary activities Employee benefits 71.4 72.6 73.2 Depreciation and amortisation 4.8 5.1 5.1 Grants and other payments 0.1 0.5 0.5 Capital asset charge 0.8 1.2 1.2 Supplies and services 35.9 42.1 41.9 113.0 121.5 121.9 Net result for the reporting period 4.8 .. .. Net increase in asset revaluation reserve 6.2 .. .. Total changes in equity other than those resulting from
transactions with the State in its capacity as owner 11.0 .. ..
Source: Parliament of Victoria and Department of Treasury and Finance
292 Parliament Statement of Finances 2005-06
Table C.11.2: Statement of cash flows ($ million)
2003-04 2004-05 2004-05 Actual Budget Revised Cash flows from operating activities Receipts from Government 108.3 118.8 118.7Receipts from other entities 1.5 .. ..Payments for supplies, grants and employees ( 107.0) ( 115.0) ( 115.4) 2.8 3.9 3.4Capital asset charge ( 0.8) ( 1.2) ( 1.2)Other receipts ( 0.1) .. ..Net cash inflow from operating activities 1.9 2.7 2.2 Cash flows from investing activities Payments for property, plant and equipment ( 3.4) ( 6.7) ( 6.2)Net cash (outflow) from investing activities ( 3.4) ( 6.7) ( 6.2) Cash flows from financing activities Net proceeds from capital contribution by State
Government 0.1 4.1 4.1
Net proceeds from borrowings 1.2 .. ..Net cash inflows/(outflow) from financing activities 1.3 4.1 4.1Net increase/(decrease) in cash held ( 0.2) .. ..Cash at the beginning of the financial year 0.2 .. ..Cash at the end of the financial year .. .. ..Source: Parliament of Victoria and Department of Treasury and Finance
Statement of Finances 2005-06 Parliament 293
Table C.11.3: Statement of financial position ($ million)
Estimated as at 30 June 2004 2005 2005 Actual Budget Revised Current assets Receivables 0.8 0.8 0.8 Inventories 0.1 0.1 0.1 Prepayments 0.8 0.8 0.8 Total current assets 1.7 1.7 1.7 Non-current assets Receivables 24.2 26.9 27.4 Property, plant and equipment 182.2 183.8 183.3 Other 11.4 11.4 11.4 Total non-current assets 217.8 222.1 222.1 Total assets 219.5 223.8 223.8 Current liabilities Payables 2.3 2.3 2.3 Interest-bearing liabilities 1.3 1.3 1.3 Employee provisions 4.1 4.1 4.1 Other 0.4 0.4 0.4 Total current liabilities 8.2 8.2 8.2 Non-current liabilities Interest-bearing liabilities 0.8 0.8 0.8 Employee provisions 4.1 4.3 4.3 Total non-current liabilities 4.9 5.1 5.1 Total liabilities 13.1 13.3 13.3 Net assets 206.4 210.4 210.4 Equity Contributed capital 147.6 151.6 151.6 Reserves 47.3 47.3 47.3 Accumulated surplus 11.6 11.6 11.6 Total equity 206.4 210.4 210.4 Source: Parliament of Victoria and Department of Treasury and Finance
2003-04 2004-05 2004-05 Actual Budget Revised Administered revenue Sale of goods and services 14.2 14.6 14.6Other 0.1 .. ..Total administered revenue 14.3 14.6 14.6 Administered expenses Payments into the Consolidated Fund 15.2 14.6 14.6Total administered expenses 15.2 14.6 14.6Revenue less expenses ( 0.9) .. .. Administered assets Receivables 2.7 2.7 2.7Total administered assets 2.7 2.7 2.7 Administered liabilities Total administered liabilities .. .. ..Source: Parliament of Victoria and Department of Treasury and Finance
Statement of Finances 2005-06 Appendix D 295
APPENDIX D – QUARTERLY FINANCIAL REPORT FOR THE VICTORIAN GENERAL GOVERNMENT SECTOR
This appendix provides the quarterly financial results to March 2005 for the 2004-05 financial year. Actuals are on track to meet the revised 2004-05 estimates as presented in Appendix B, Revised 2004-05 Budget Outcome. The alternative presentation of the 2004-05 revised general government sector operating statement (refer to Table D.1) has been constructed in accordance with the format developed and presented in Appendix C of the 2004-05 Mid-Year Financial Report, to meet Australian equivalents to International Financial Reporting Standards (A-IFRS).
OPERATING STATEMENT – A-IFRS PRESENTATION Table D.1 shows the March quarter result prepared under existing accounting standards but presented in the format adopted for the purposes of A-IFRS. Under this framework, the net result from transactions for the nine months to 31 March 2005 was a surplus of $836 million. This result reflects seasonal expenditure patterns and the normal seasonal pattern of revenue.
The alternative operating statement distinguishes income and expenses relating to transactions from those relating to other economic flows in order to identify the items over which government has direct control. The key difference is in relation to superannuation. The portion of superannuation that is not within government control is recognised below the line as part of the net result from other economic flows. The net result from other economic flows in Table D.1 shows that significant superannuation gains reported in the March quarter have been driven by higher than expected returns on equity markets. However, because this is dependent on market performance, rather than government actions, it is not recognised as part of the total expenses from transactions, which is the operating surplus measure targeted by government.
Further details on the new format of the operating statement is provided in Appendix B, Revised 2004-05 Budget Outcome.
296 Appendix D Statement of Finances 2005-06
Alternative statement of financial performance presentation
Table D.1: Operating statement under A-IFRS(a) ($ million)
2004-05 Actual to Mar. Income from transactions ..Taxation 8 007.9Fines and regulatory fees 472.6Investment income 878.9Grants income 9 799.4Sales of goods and services 1 693.8Fair value of assets received free of charge or for nominal consideration 6.9Inter-sector capital asset charge 449.3Other income 588.6Total income from transactions 21 897.2Expenses from transactions ..Employee benefits 7 889.1Superannuation 1 419.9Depreciation and amortisation 838.0Financing costs 332.9Grants and transfer payments 3 771.0Supplies and services 6 807.0Other expenses 3.4Total expenses from transactions 21 061.3Net result from transactions 836.0.. .. Income/(expenses) from other economic flows ..Net gain/(loss) from disposal of physical assets 39.9Other income from other economic flows 13.2Actuarial gains/(losses) on superannuation defined benefit plans 950.0Other expenses from other economic flows ( 215.3)Net result from other economic flows 787.7Net result 1 623.7.. .. Total income 21 950.2Total expenses 20 326.6Gain/(loss) on revaluation of properties ( 10.5)Total changes in equity other than contributions to other sectors by the
State in its capacity as owner 1 613.2
Note: (a) The figures presented in this table are compiled under the existing Australian Accounting
Standards but have been re-presented in the A-IFRS operating statement format.
Statement of Finances 2005-06 Appendix D 297
QUARTERLY FINANCIAL REPORT FOR THE VICTORIAN GENERAL GOVERNMENT SECTOR As A-IFRS does not apply until 1 July 2005, the following tables have been prepared on existing accounting standards to meet legislative reporting requirements for 2004-05.
Under this framework, the net result for the nine months to 31 March 2005 was a surplus of $1 624 million, compared with the revised budget estimate for 2004-05 of $1 282 million. This result reflects seasonal expenditure patterns and the reduced superannuation expense due to better than expected returns in the equity markets.
Net assets were $27 609 million compared to the same period last year at $24 401 million. The decline in liabilities is primarily due to a reduced amount of unfunded superannuation liabilities stemming from the better than expected investment returns mentioned above.
298 Appendix D Statement of Finances 2005-06
FINANCIAL STATEMENTS FOR THE GENERAL GOVERNMENT SECTOR
Statement of financial performance for the period ended 31 March ($ million)
2003-04 2004-05 Actual Notes Actual Revised
to Mar. to Mar. Budget Revenue from ordinary activities ..
(3 499.8) Grants and transfer payments .. (4 200.5) (5 298.3)(6 260.7) Supplies and services .. (6 926.9) (9 304.0)
(18 496.8) Total payments .. (20 151.1) (26 951.7)1 644.7 Net cash flows from operating activities 13 1 646.2 2 247.4
Cash flows from investing activities .. (1 137.1) Purchase of property, plant and equipment .. (1 117.1) (2 197.5)
71.6 Proceeds from sale of property, plant and equipment
.. 74.6 71.6
113.0 Net (purchase)/disposal of investments .. 141.1 107.5( 10.8) Net customer loans (granted)/repaid .. 10.8 10.6
( 261.1) Net contributions to other sectors of government .. ( 231.9) ( 514.2)(1 224.4) Net cash flows from investing activities .. (1 122.7) (2 522.0)
Cash flows from financing activities .. ( 21.9) Net repayment of borrowings .. ( 44.6) 283.3( 21.9) Net cash flows from financing activities .. ( 44.6) 283.3 398.4 Net increase/(decrease) in cash and deposits
held .. 478.9 8.7
1 107.8 Cash and deposits at beginning of period .. 1 295.2 1 295.21 506.2 Cash and deposits at end of reporting period .. 1 774.1 1 303.9
The accompanying notes form part of the financial statements.
Statement of Finances 2005-06 Appendix D 301
NOTES TO THE FINANCIAL STATEMENTS
Note 1: Statement of significant accounting policies................................................ 302 Note 2: Taxation....................................................................................................... 303 Note 3: Investment revenue..................................................................................... 303 Note 4: Grants revenue............................................................................................ 304 Note 4: Grants revenue............................................................................................ 304 Note 5: Depreciation ................................................................................................ 304 Note 6: Total expenses from ordinary activities by department............................... 305 Note 7: Receivables ................................................................................................. 306 Note 8: Land and buildings ...................................................................................... 306 Note 9: Plant, equipment and infrastructure systems other than roads................... 307 Note 10: Road networks........................................................................................... 307 Note 11: Other assets .............................................................................................. 308 Note 12: Employee benefits ..................................................................................... 308 Note 13: Reconciliation of the operating surplus to net cash flows from operating
activities for the period ended 31 March ................................................... 309 Note 14: Public Account........................................................................................... 310 Note 15: Controlled entities...................................................................................... 312
302 Appendix D Statement of Finances 2005-06
Note 1: Statement of significant accounting policies The following summarises the significant accounting policies that have been adopted in preparing and presenting this Quarterly Financial Report.
(A) Compliance framework This report is the unaudited general-purpose consolidated financial report of the general government sector for the quarter ending 31 March 2005 and the period July 2004 to March 2005 as required by Section 26 of the Financial Management Act 1994.
The Quarterly Financial Report has been prepared in accordance with the Financial Management Act 1994, relevant Australian Accounting Standards, Urgent Issues Group Consensus Views and other authoritative pronouncements.
The accounting policies applied are consistent with those of the 2003-04 Financial Report for the State of Victoria and the 2004-05 Mid-Year Financial Report, which should be read in conjunction with this report. This quarterly report only includes explanatory notes that provide relevant information on a quarterly reporting basis.
(B) Basis of accounting and measurement The accrual basis of accounting has been employed in the preparation of this financial report whereby assets, liabilities, equity, revenues and expenses are recognised in the reporting period to which they relate, regardless of when cash will be received or paid. The opening balances of 1 July 2004 represent the actual audited values as at 30 June 2004.
(C) General government sector reporting entity The budget sector is defined as being the same as the general government sector and includes all government departments, offices and other government bodies engaged in providing services free of charge or at prices significantly below their cost of production. The services provided by these entities are financed mainly through taxes, other compulsory levies and user charges. The general government sector is not a separate entity but represents a sector within the State of Victoria reporting entity.
(D) Basis of consolidation The Quarterly Financial Report includes all reporting entities in the general government sector that are controlled by the State. Details of entities consolidated for the general government sector are included in Budget Paper No. 4, Chapter 1, Note 19.
In the process of reporting the general government sector as a single economic entity, all material transactions and balances within the sector are eliminated.
Statement of Finances 2005-06 Appendix D 303
Note 2: Taxation ($ million)
2003-04 2004-05 Actual Actual Revised
to Mar. to Mar. Budget 2 025.5 Payroll tax 2 256.9 2 994.0
Taxes on immovable property 718.8 Land tax 890.4 854.6 82.3 Metropolitan improvement levy 88.9 88.4 25.3 Property owner contributions to fire brigades 28.5 32.0
826.4 Total taxes on immovable property 1 007.7 975.0 Financial and capital transactions
1 823.8 Land transfers 1 740.9 2 235.7 180.9 Stamp duty on mortgages 13.4 13.6 38.9 Rental business stamp duty 39.0 54.5 5.8 Other property stamp duty 6.1 10.5
999.3 Total gambling taxes 1 026.7 1 376.0 717.1 Taxes on insurance 757.2 1 019.9
.. Motor vehicle taxes (a) .. .. 332.0 Vehicle registration fees 392.7 670.9 507.2 Stamp duty on vehicle transfers 512.5 561.0 839.2 Total motor vehicle taxes 905.1 1 231.9 39.8 Other taxes 50.3 132.1
7 692.3 Total taxation revenue 8 007.9 10 355.6 Note: (a) Taxation has been adjusted to exclude motor drivers’ licence fees, police learner and driver fees,
and other miscellaneous motor vehicle fees, which are now classified as regulatory fees.
Note 3: Investment revenue ($ million)
2003-04 2004-05 Actual Actual Revised
to Mar. to Mar. Budget 153.5 Dividends 431.1 512.1 259.2 Interest 238.7 355.8 ( 21.7) Investment gain/(losses) ( 1.9) 22.9
21.8 Royalties 10.0 43.3 14.3 Rents 12.3 15.2
164.5 Other investment revenue 186.6 396.5 591.7 Total investment revenue 877.0 1 345.9
304 Appendix D Statement of Finances 2005-06
Note 4: Grants revenue ($ million)
2003-04 2004-05 Actual Actual Revised
to Mar. to Mar. Budget Specific purpose grants
601.9 Education and Training 485.5 805.71 944.9 Human Services 2 071.4 2 778.6
44.4 Infrastructure 88.1 182.4 0.2 Innovation, Industry and Regional Development 0.2 0.2
57.8 Justice 37.8 47.9.. Parliament .. ..
0.3 Victorian Communities .. 0.3 2.9 Premier and Cabinet 1.3 ..
18.1 Primary Industries 8.0 14.2 36.5 Sustainability and Environment 58.0 54.6 42.4 Treasury and Finance 15.5 5.7 20.9 Regulatory bodies and other part budget funded agencies 21.4 28.9
Grants for on-passing (a) 909.5 Education and Training 1 030.0 1 343.8 266.9 Victorian Communities 270.6 360.9
3 946.7 Total specific purpose and on-passing grants 4 087.7 5 623.15 191.4 General purpose Commonwealth grants 5 569.9 7 564.0
5.8 Inter-sector grants 64.9 61.7 68.2 Other specific purpose grants (b) 76.9 115.6
9 212.0 Total grants 9 799.4 13 364.5Notes: (a) Grants for on-passing represent grants made by the Commonwealth Government to state
governments to be passed on to third parties, such as non-government schools and local governments.
(b) Specific purpose grants not allocated to departments.
Note 5: Depreciation ($ million)
2003-04 2004-05 Actual Actual Revised
to Mar. to Mar. Budget 353.0 Plant, equipment and infrastructure 334.3 485.4 218.4 Buildings 224.0 323.9 162.0 Road networks 211.0 286.8 10.6 Other assets 12.0 16.3
744.0 Total depreciation 781.3 1 112.3
Statement of Finances 2005-06 Appendix D 305
Note 6: Total expenses from ordinary activities by department ($ million)
2003-04 2004-05 Actual Actual Revised
to Mar. to Mar. Budget Expenses from ordinary activities
5 894.2 Education and Training 6 347.7 8 588.3 7 187.9 Human Services 7 885.5 10 763.3 1 560.6 Infrastructure 2 558.0 3 443.3 216.7 Innovation, Industry and Regional Development 211.8 374.5
.. Contingencies not allocated to departments (a) .. ( 51.5) 575.5 Regulatory bodies and part budget funded agencies (b) 695.9 986.0
21 538.8 Total 22 341.2 30 691.9 (1 911.9) Eliminations (c) (2 014.6) (2 576.8) 19 626.9 Total expenses from ordinary activities 20 326.6 28 115.2
Notes: (a) Departmental expenses will be supplemented for certain costs that are provided for in
contingencies. (b) Includes other general government sector agencies that receive less than 50 per cent of their
revenue from appropriations and therefore are not allocated to portfolios. (c) Mainly comprising of payroll tax, capital asset charge and inter-departmental and inter-agencies
transfers.
306 Appendix D Statement of Finances 2005-06
Note 7: Receivables ($ million)
2003-04 . 2004-05 .Actual Opening Actual Revised
31 Mar. 1 July 31 Mar. Budget Current
410.9 Sale of goods and services 403.8 538.0 429.3 813.9 Taxes receivable 463.5 1 029.0 465.0 558.8 Fines and regulatory fees 573.9 659.9 682.8 92.7 Accrued investment income 186.2 56.7 147.5 3.3 Loans 3.6 3.7 ( 8.9)
97.5 Intangibles (written down value) 113.2 127.1 128.4 258.2 Natural resource reserves at valuation 141.2 107.1 115.5 113.7 Other assets 125.0 145.5 174.8
3 289.5 Total non-current other assets 3 206.1 3 096.4 3 306.53 289.5 Total other assets 3 206.1 3 096.4 3 306.5
Note: (a) Cultural assets comprise non-current physical assets intended to be preserved because of their
unique historical, cultural or environmental attributes, such as the Royal Botanic Gardens, Government House, Parliament House, historic houses, monuments, museum exhibits, art collections and archival collections.
Note 12: Employee benefits ($ million)
2003-04 2004-05 Actual Opening Actual Revised
31 Mar. 1 July 31 Mar. Budget Current
753.4 Accrued salaries and wages, including other benefits (a)
824.5 760.7 841.7
241.5 Long service leave 186.7 276.5 195.1 994.8 Total current employee benefits 1 011.1 1 037.2 1 036.8
Non-current 5.5 Accrued salaries and wages, including other
benefits (a) 4.9 6.4 4.9
1 866.9 Long service leave 1 961.2 1 975.7 2 161.51 872.4 Total non-current employee benefits 1 966.1 1 982.1 2 166.42 867.2 Total employee benefits 2 977.2 3 019.2 3 203.2
Note: (a) Includes accrued annual leave, payroll tax and other similar on costs.
Statement of Finances 2005-06 Appendix D 309
Note 13: Reconciliation of the operating surplus to net cash flows from operating activities for the period ended 31 March
($ million) 2003-04 2004-05
Actual Actual to Mar. to Mar. 876.4 Result from ordinary activities 1 623.7
0.0 Assets received/given free of charge 353.8 ( 7.0) Assets previously not recognised ( 15.0) 13.9 Revaluation of fixed assets 22.2 20.6 Discount/premium on investments/interest bearing liabilities 4.0
.. Bad and doubtful debts from customer loans 129.3 Movements included in investing/financing activities
( 20.8) Net revenue from sale of property, plant and equipment ( 39.9) 7.5 Net revenue from sale of investments 6.5
10.5 Realised gains/(losses) on interest bearing liabilities 3.8 Movements in assets and liabilities
51.2 Increase/(decrease) in provision of doubtful debts 25.3 1 150.3 Increase/(decrease) in payables ( 177.4)
62.5 Increase/(decrease) in employee benefits 42.0 ( 666.2) Increase/(decrease) in superannuation ( 406.0)
8.7 Increase/(decrease) in insurance claims liabilities ( 3.4) 202.4 Increase/(decrease) in other liabilities 234.7
( 518.7) (Increase)/decrease in receivables ( 578.9) ( 349.8) (Increase)/decrease in other current assets ( 411.9) 1 644.7 Net cash flows from operating activities 1 646.2
310 Appendix D Statement of Finances 2005-06
Note 14: Public Account
Consolidated Fund receipts and payments ($ million)
2003-04 2004-05 Actual Actual Revised to Mar. to Mar. Budget
Receipts 7 131.8 Taxation 7 339.1 10 199.6 239.5 Fines and regulatory fees 252.3 395.1
7 670.8 Grants received 8 147.0 11 186.1 412.0 Sales of goods and services 411.6 604.7 89.3 Interest received 60.2 151.6
341.5 Public authority receipts 715.4 883.21 409.1 Other receipts 1 712.3 2 403.2
17 293.9 Total operating activities 18 637.8 25 823.5 38.3 Total inflows from investing and financing 121.9 63.8
17 332.2 Total receipts 18 759.8 25 887.3 Payments to Departments
4 382.1 Education and Training 4 667.9 6 204.76 296.9 Human Services 7 157.9 9 856.11 937.6 Infrastructure 2 288.7 3 208.2 251.5 Innovation, Industry and Regional Development 256.9 408.8
1 741.3 Justice 1 851.9 2 493.5 300.6 Premier and Cabinet 288.5 427.8 194.0 Primary Industries 238.9 330.8 606.1 Sustainability and Environment 553.5 866.7
( 32.4) Other payments .. .. (7 041.4) Total payments (7 594.7) (10 099.5)
14.1 Net cash flows from operating activities 187.2 ( 81.6) Cash flows from investing activities
( 59.1) Net proceeds from customer loans 0.0 .. 1.1 Proceeds from sale of property, plant and equipment 1.0 ..
( 2.7) Purchases of property, plant and equipment ( 31.8) ( 12.3) ( 49.8) Other investing activities ( 30.2) ( 33.8)
( 110.5) Net cash flows from investing activities ( 61.0) ( 46.1) Cash flows from financing activities
12.4 Net proceeds (repayments) from borrowings 31.3 88.6 Other financing
12.4 Net cash flows from financing activities 31.3 88.6 ( 83.9) Net cash inflow/(outflow) 157.5 ( 39.1)
312 Appendix D Statement of Finances 2005-06
Details of securities held ($ million)
2003-04 2004-05 Actual Opening Actual
Mar. 1 July 31-Mar. 594.1 Amounts invested on behalf of specific trust accounts 609.3 661.4
1.3 Amounts invested on behalf of general trust accounts 1.3 1.32 802.2 General account balances 2 008.8 1 885.23 397.6 Total Public Account 2 619.4 2 547.9
Represented by: 595.3 Stocks and securities 610.6 662.7
2 582.1 Cash and investments 1 662.2 1 690.53 177.5 Total stock, securities, cash and investments 2 272.8 2 353.2
Add cash advanced for: 220.1 Advances pursuant to sections 36 and 37 of the FMA 1994 (a) 346.6 194.7
3 397.6 Total Public Account 2 619.4 2 547.9Note: (a) Financial Management Act 1994.
Note 15: Controlled entities A list of general government entities which have been consolidated for the purposes of this Quarterly Financial Report is included in Budget Paper No. 4, Chapter 1: Estimated Financial Statements and Notes, at Note 19.
Results quarter by quarter – Victorian general government sector These quarterly financial statements should be read in conjunction with Note 1 of this appendix and the Statement of significant accounting policies and assumptions in Chapter 1, Estimated Financial Statements and Notes, at Note 1.
Statement of Finances 2005-06 Appendix D 313
Table D.2: Statement of financial performance for the past five quarters ($ million)
2003-04 2004-05 Mar. June Sept. Dec. Mar. Revenues from ordinary activities Taxation (a) 2 942.4 2 351.0 2 529.4 2 359.9 3 118.6 Fines and regulatory fees (a) 168.2 159.5 124.8 181.8 165.9 Investment revenue 164.8 465.9 157.0 600.7 119.3 Grants revenue 2 937.9 3 416.3 3 029.2 3 604.8 3 165.4 Sales of goods and services 569.7 622.2 503.3 598.4 592.2 Gain/(loss) from disposal of physical
assets 4.8 ( 65.6) 27.7 11.2 0.9
Fair value of assets received free of charge or for nominal consideration
( 0.2) 374.0 .. 1.7 5.2
Inter-sector capital asset charge 135.0 178.5 149.8 149.8 149.8 Other revenue 153.1 338.5 187.5 239.9 176.2 Total revenue 7 075.7 7 840.4 6 708.7 7 748.2 7 493.4 Expenses from ordinary activities Employee benefits 2 374.3 2 744.1 2 584.2 2 710.1 2 594.8 Superannuation ( 157.0) ( 252.4) 480.5 ( 142.4) 131.8 Depreciation 245.4 262.9 257.1 255.6 268.6 Amortisation 21.5 23.1 16.7 15.3 24.6 Financing costs 111.7 142.7 98.3 132.0 106.4 Grants and transfer payments 2 270.0 1 431.0 1 172.1 1 367.0 1 231.9 Supplies and services 2 059.3 3 161.5 2 059.8 2 177.1 2 570.1 Other expenses 43.2 213.9 15.2 25.1 174.6 Total expenses 6 968.4 7 726.8 6 684.0 6 539.8 7 102.9 Net result 107.3 113.6 24.7 1 208.4 390.5 Movement in asset revaluation reserve 130.0 2 004.9 ( 50.3) 56.8 ( 16.9) Total changes in equity other than contributions to other sectors by the State in its capacity as owner
237.4 2 118.5 ( 25.6) 1 265.2 373.6
Net contributions to other sectors by the State in its capacity as owner
( 112.8) ( 240.5) ( 17.9) ( 197.7) ( 66.8)
Total changes in equity 124.6 1 878.1 ( 43.5) 1 067.5 306.8 Source: Department of Treasury and Finance
Note: (a) Taxation has been adjusted to exclude motor drivers’ licence fees, police learner and driver fees,
and other miscellaneous motor vehicle fees, which are now classified as regulatory fees.
314 Appendix D Statement of Finances 2005-06
Table D.3: Statement of financial position as at the end of the quarter ($ million)
Proceeds from sale of property, plant and equipment
17.8 55.0 51.3 ( 2.5) 25.8
Net (purchase)/disposal investments ( 76.1) 837.8 14.7 ( 77.3) 203.6 Net customer loans (granted)/repaid ( 0.8) ( 0.7) .. ( 28.8) 39.5 Net contributions to other sectors of
government (b) ( 112.8) 102.8 ( 32.4) 7.3 ( 206.8)
Net cash flows from investing activities
( 472.5) ( 214.7) ( 303.3) ( 779.1) ( 40.2)
Cash flows from financing activities Net repayment of borrowings 18.0 ( 822.1) ( 12.3) ( 7.0) ( 25.3) Net cash flows from financing
activities 18.0 ( 822.1) ( 12.3) ( 7.0) ( 25.3)
Net increase/(decrease) in cash and deposits held
125.3 ( 211.0) ( 117.4) 513.4 82.9
Cash and deposits at beginning of period 1 380.9 1 506.2 1 295.2 1 177.8 1 691.2 Cash and deposits at end of reporting
period 1 506.2 1 295.2 1 177.8 1 691.2 1 774.1
Source: Department of Treasury and Finance Notes: (a) Taxation has been adjusted to exclude motor drivers’ licence fees, police learner and driver fees,
and other miscellaneous motor vehicle fees, which are now classified as regulatory fees. (b) June 2003-04 data have been revised from the 2003-04 Annual Financial Report to reflect a
reallocation between net contributions to other sectors of government to purchases of property, plant and equipment.