37
Statewide recreational fishing survey 2019-20 Screening Survey Technical Report July 2019

Statewide recreational fishing survey 2019-20 Screening Survey
Technical Report
July 2019

Report prepared for:
Fisheries Queensland
Department of Agriculture and Fisheries
Report prepared by:
Sebastian Misson, Dr Ben Phillips, Caitlin Rawding and Eugene Siow
The Social Research Centre
Level 9, 277 William Street
MELBOURNE VIC. 3000
Tel: (613) 9236 8500
Fax: (613) 9602 5422
www.srcentre.com.au
Version: 1

SRFS 2019/20 Screening Survey – Technical Report Prepared by the Social Research Centre 29
Contents
List of figures ..........................................................................................................................................4
List of tables ...........................................................................................................................................4
1. Introduction ..................................................................................................................................5
About this report ..............................................................................................................5
Project background .........................................................................................................5
Project overview ..............................................................................................................6
Screening survey overview ............................................................................. 6
Diary explanation survey overview .................................................................. 7
Quality assurance ...........................................................................................................8
2. Methodology .................................................................................................................................9
Sample design ................................................................................................................9
Sample generation ..........................................................................................................9
In-scope population and respondent selection ............................................................ 10
3. Response maximisation ........................................................................................................... 11
Call procedures ............................................................................................................ 11
Primary approach text message .................................................................................. 11
Voicemail ..................................................................................................................... 12
Changing outgoing telephone number......................................................................... 12
Helpdesk and 1800 number operation......................................................................... 12
4. Questionnaire Design ............................................................................................................... 13
Questionnaire overview ............................................................................................... 13
Testing and debriefing ................................................................................................. 13
5. Data Collection & Quality Control ........................................................................................... 14
Operational testing ....................................................................................................... 14
Field team briefing ....................................................................................................... 14
Fieldwork quality control procedures ........................................................................... 14
6. Response outcomes ................................................................................................................. 16
Sample generation and utilisation ................................................................................ 16
Final call outcome ........................................................................................................ 16
Allocation to region ...................................................................................................... 21
AAPOR Response and other rates .............................................................................. 23
Refusal Conversion...................................................................................................... 24
7. Data Outputs & Reporting ........................................................................................................ 25
Weighting ..................................................................................................................... 25
Design weight .............................................................................................................. 25
Non-response adjustment ............................................................................................ 26
Final calibration ............................................................................................................ 27
Data file provision ........................................................................................................ 27
References ........................................................................................................................................... 28
Appendix 1 DAF response definitions ......................................................................................... 29
Appendix 2 Calibration benchmarks ............................................................................................ 30
Electronic appendices ........................................................................................................................ 37

SRFS 2019/20 Screening Survey – Technical Report 28 Prepared by the Social Research Centre
List of figures
Figure 1 Project overview ............................................................................................................. 6
List of tables
Table 1 Screening survey key statistics ...................................................................................... 7
Table 2 Explanation survey key statistics ................................................................................... 7
Table 3 Validation by remote monitoring .................................................................................. 15
Table 4 Sample utilisation ......................................................................................................... 16
Table 5 Final detailed call outcome by sample type ................................................................. 18
Table 6 Final call outcome by region and sample type ............................................................ 20
Table 7 Final region distribution of final achieved sample by sample frame ............................ 21
Table 8 Diary recruitment performance .................................................................................... 22
Table 9 Calculation of AAPOR response rate .......................................................................... 23
Table 10 Refusal conversion summary by sample type ............................................................. 24
Table 13 Response outcomes (as done in previous surveys) for screening survey .................. 29
Table 14 Non-response reasons ................................................................................................ 29
SRFS 2019/20 Screening Survey – Technical Report Prepared by the Social Research Centre 29
1. Introduction
About this report
This report covers the data collection and methodological aspects of the screening survey for the
statewide recreational fishing survey 2019/20. The survey was conducted by the Social Research
Centre on behalf of the Department of Agriculture and Fisheries (DAF). This report aims to provide a
detailed record of the survey procedures.
The purpose of this report is to:
consolidate and summarise project information and assorted reports generated throughout
the survey period
provide analysis relating to sample characteristics and utilisation
provide a detailed record and analysis of the survey approach and procedures; and
consolidate issues for consideration relating to the improvement of the questionnaire and
refinement of the methodology for future surveys, if applicable.
Project background
The key objectives of the survey are to provide reliable and defensible statewide estimates relative to Queensland resident recreational fishers who are older than 5 years of age. These estimates include:
The number of Queensland residents who fish recreationally and the participation rate of
recreational fishing among Queensland residents by residential region, age and gender
Recreational fishing effort (days/events/hours) by Queensland residents by fishing method,
time and place.
Recreational fishing catch (harvest and release separately) by Queensland residents by
species, method, time and place.
The ability to calculate recreational fishing catch per unit effort (CPUE) by Queensland
residents per fishing day, trip and hour by species, method, time and place
Expenditure on recreational fishing for example, bait, tackle, fuel, equipment, accommodation
Recreational fishers’ attitudes and awareness of various fishing and environmental topics.
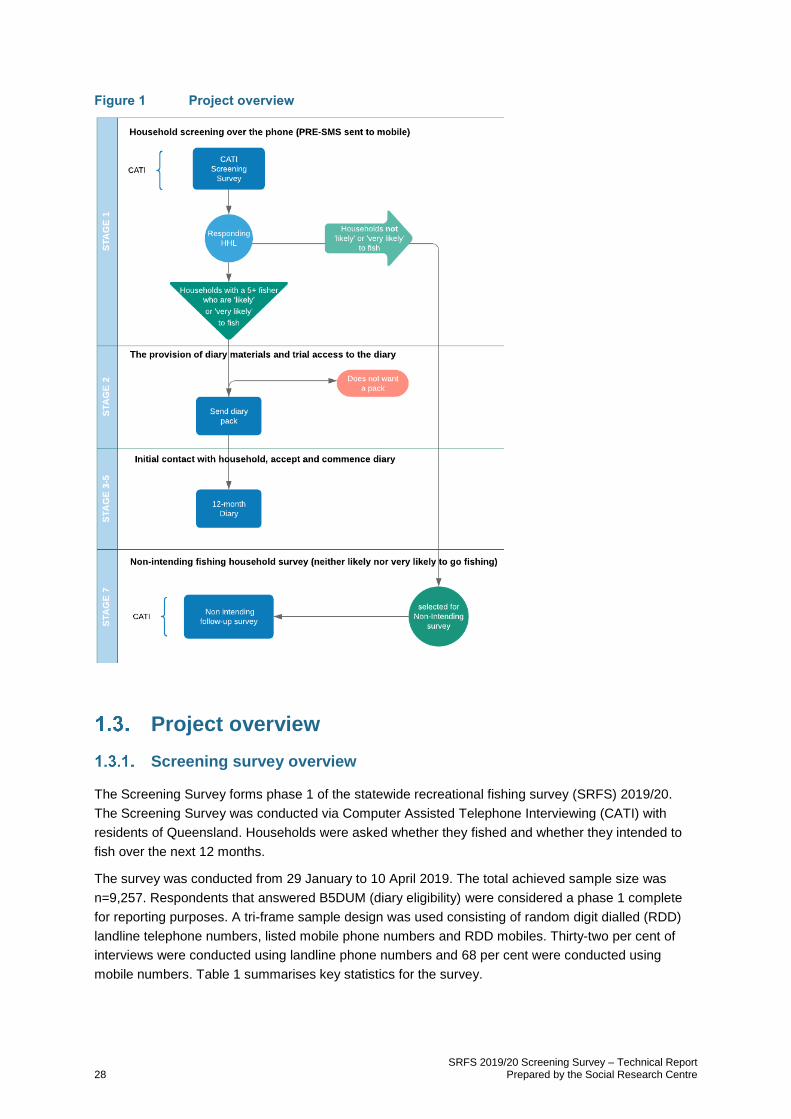
Previous studies in 2010/11 and 2013/14 were conducted which relied on predominantly telephone diary surveys. An overview of the 2019/20 study can be found in Figure 1 below.
SRFS 2019/20 Screening Survey – Technical Report 28 Prepared by the Social Research Centre
Figure 1 Project overview
Project overview
Screening survey overview
The Screening Survey forms phase 1 of the statewide recreational fishing survey (SRFS) 2019/20.
The Screening Survey was conducted via Computer Assisted Telephone Interviewing (CATI) with
residents of Queensland. Households were asked whether they fished and whether they intended to
fish over the next 12 months.
The survey was conducted from 29 January to 10 April 2019. The total achieved sample size was
n=9,257. Respondents that answered B5DUM (diary eligibility) were considered a phase 1 complete
for reporting purposes. A tri-frame sample design was used consisting of random digit dialled (RDD)
landline telephone numbers, listed mobile phone numbers and RDD mobiles. Thirty-two per cent of
interviews were conducted using landline phone numbers and 68 per cent were conducted using
mobile numbers. Table 1 summarises key statistics for the survey.

SRFS 2019/20 Screening Survey – Technical Report Prepared by the Social Research Centre 29
Respondents were asked to complete the screening survey and then, if they were a household
intending to fish in Queensland over the next 12 months, were then recruited to the 12-month diary.
The response rate (reportable completes / made contact less screen outs & other contacts) for the
screening survey was 40.5 per cent. The average interview length was 7.3 minutes, or 10.4 minutes
for intending households and 5.8 minutes for non-intending households. The diary recruitment rate
(agreed to receive the diary welcome pack / intending households) was 77.3 per cent.
Table 1 Screening survey key statistics
Key project statistics Sample Frame Fishing status
Total Landline Mobile Intending
Household Non-intending
Household
Reportable completes 9,257 3,013 6,244 3,475 5,782
Response rate (screening survey) * 40.5 39.3 41.1 - -
Response rate (diary recruitment) ^ 77.3 73.9 78.5 - -
Average interview length (mins) 7.3 6.7 7.5 10.4 5.8
*base is made contact less screen outs & other contacts ^base is fishing households with screening survey complete
Diary explanation survey overview
Households recruited for the diary received a follow up call to confirm the household’s participation in
the diary. The diary explanation survey ran from 8 April to 12 May 2019. During this call households
were asked to nominate a “diary champion” for the household who would be the person in the
household responsible for reporting the household’s fishing events. As with previous surveys, a single
contact within each household was required due to the difficulties that can arise in contacting multiple
members within a household on a single email address or phone number, it also reduced the
possibility of reporting the same event multiple times.
Table 2 summarises key statistics for the survey. In the last week of field, non-contacts were sent an
email with a one question form asking for their expected fishing frequency over the next 12 months. Of
those, 160 filled in the form and were included in Phase 2. A further 20 respondents that did not
complete the engagement survey did fill in a diary while engagement survey was still in field and were
also included in Phase 2. The remaining unresolved records were included in Phase 2 given they
didn’t refuse the diary.
Table 2 Explanation survey key statistics
Key project statistics Sample Frame
Total Landline Mobile
Households recruited for the diary 2,640 660 1,980
Households accepting diary phase 1,844 500 1,344
Response rate * 69.8 75.8 67.9
Unresolved / not refused # 642 540 102
Average interview length (mins) 5.4 5.6 5.3
* households recruited at screening / households accepting diary after follow-up # 180 of these households were unresolved in the explanation survey but were otherwise engaged with the diary

SRFS 2019/20 Screening Survey – Technical Report 28 Prepared by the Social Research Centre
Quality assurance
All data collection activities were undertaken in accordance with the Privacy Act (1988), the Australian
Privacy Principles, the Australian Market and Social Research Society’s Code of Professional
Practice, the Market and Social Research Privacy Principles, and ISO 20252 standards.

SRFS 2019/20 Screening Survey – Technical Report Prepared by the Social Research Centre 29
2. Methodology
Sample design
The survey utilised a tri-frame sample frame coverage, details of which are covered in the Sampling
Frame Report (December 2018). This sample design attempts to provide the optimum blend of
accuracy and budget, while still achieving the desired coverage benefits.
The move to a tri-frame design for the 2019/20 survey by replacing some of the landline sample frame
with listed mobile not only provides a uniform design but also provides greater coverage of the mobile
sample frame in less populous regions. The sample design includes both randomly generated
Queensland landline numbers that covers the vast majority of Queensland households with a landline,
and randomly generated mobile telephone numbers, to cover the Queensland population that own a
mobile phone. Mobile phone numbers that are not listed cannot be assigned a geographic location,
and so the inclusion of these numbers has to be balanced against the costs associated with screening
out sample members who do not reside in Queensland. Listed mobile is an effective method of
efficiently targeting specific geographic areas and achieving representation of the mobile-only
population. Its inclusion also reduces the cost of data collection and to be better able to maintain a
reasonable mix of landline and mobile interviews within sampling strata.
Sample generation
The commercial sample provider, SamplePages, provided both the landline and mobile phone
samples.
Random Digit Dialling (RDD) landline numbers are generated by SamplePages using a list-
assisted methodology. This methodology only includes residential numbers in 100-blocks
with at least one listed residential telephone number. Listed residential numbers are sourced
from a range historical and current lists. In addition, SamplePages select disproportionally
more numbers from 100-blocks with more listed numbers. This method has been
implemented to overcome inefficiencies resulting from the rapidly decreasing number of
active landlines in Australia. The landline sample was generated by assigning each phone
number a “best estimate” postcode, based on exchange district and service zone units
Random Digit Dialling (RDD) mobile numbers are generated by SamplePages and is also
based on a 100-block ‘Register of Numbers’ maintained by the Australian Communications
and Media Authority. However, due to the high degree of saturation in the mobile number
range, mobile sample is selected as a purely random sample across all blocks to provide an
efficient and an unbiased sample of mobile phone users. RDD mobile numbers generated for
the Statewide Recreational Fishing Survey that had listing information in the SamplePages
frame indicating that they were not Queensland residents were flagged as non-Queensland
numbers and were not dialled by the Social Research Centre.
Listed mobile numbers were selected at random from SamplePages’ list of mobile numbers
from in-scope postcodes. These numbers are sourced from a composite phone database
built by contributors from different organisations, including charities, telemarketing
companies and other business entities.
SRFS 2019/20 Screening Survey – Technical Report 28 Prepared by the Social Research Centre
In-scope population and respondent selection
The in-scope population for Phase 1 was Queensland residents, excluding residents of institutional
premises (prisons, nursing homes, etc) and military bases.
Other exclusions that also applied included:
persons who indicated that they were incapable of undertaking the interview due to a
physical or health condition (including too old / frail)
persons apparently under the influence of drugs or alcohol
households with no person aged 18 years or over in residence, and
mobile phone sample members where the mobile phone number called was not mainly for
personal use or the main number used for personal purposes
The in-scope population for Phase 2 was Queensland residents very likely or likely to go fishing over
the next 12 months (from 29 April 2019 to 28 April 2020 and aged 15 years or over.

SRFS 2019/20 Screening Survey – Technical Report Prepared by the Social Research Centre 29
3. Response maximisation
Procedures to maximise response for the survey included:
batched release of sample
sending a primary approach SMS to all mobile sample
leaving voicemail messages on answering machines to make initial contact with the household
using an outgoing telephone number that has a Queensland prefix
soft refusal conversion (see section 6.5)
establishing a web presence for the survey on the Social Research Centre website to address
frequently asked questions (see Appendix 4), and
use of persuasive / call tailoring techniques to overcome initial reluctance, based on briefing
materials sheet
further tailoring the introduction to ensure ‘non-fishing’ households weren’t refusing based on
the survey topic.
Call procedures
Calls are attempted over different times of day and days of the week, with up to six calls for landlines
and four calls to mobile telephone numbers to establish contact with the household and a further eight
calls to landlines or a further six calls to mobile telephone numbers to achieve an interview with the
selected person in the household (fourteen to landlines and ten calls to mobiles in total).
This call regime was adopted to improve the representativeness of the achieved sample. Previous
experience suggests that the representation of groups such as males and working persons is
improved by using an extended call cycle of this type.
Initial contact attempts were made between 4:30 pm and 8:30 pm on weekdays and between 11:00
am and 5:00 pm on Saturdays and Sundays
Primary approach text message
Mobile phone numbers selected to take part in the study were sent a pre-approach text. These
messages encourage sample members to take the call (rather than ignore a call from an ‘unknown
number’), inform them that they might be contacted for the research and offering them a way to opt
out. Research indicates that these messages increase response and cooperation rates (Dal Grande
2016; Pennay, Borg and Lavrakas 2015).
The primary approach text sent to mobile sample members was as follows:
RDD mobile sample: This is a message from the QLD Government. The Social Research Centre will call
you soon to see if you can take part in an important study [TEST DURING PILOT:
about recreational fishing]. Reply ‘1’ if you live in QLD. Reply ‘2’ if you do NOT live in
QLD or Reply ‘3’ if you live in QLD and wish to Opt Out. More info call 1800 800 996
Listed mobile sample: This is a message from the QLD Government. The Social Research Centre will call
you soon to see if you can take part in an important study TEST DURING PILOT:
about recreational fishing]. Reply STOP to opt out. For more information call 1800 800
996

SRFS 2019/20 Screening Survey – Technical Report 28 Prepared by the Social Research Centre
Voicemail
Voicemail messages were left on landline numbers if there was no contact on the first and second call
attempt. The scripted messages informed the sample member of the nature of the call, encouraged
participation and provided details of the survey hotline. The messages were as follows:
Landline sample: “Hello. My name is (…) and I’m calling on behalf of the Queensland Department of
Agriculture and Fisheries from the Social Research Centre to conduct an important
study with Queensland residents. The results will improve our understanding of how
many Queenslanders do and don’t fish and ensure Queensland’s fisheries are well
managed into the future. Please call 1800 800 996 if you would like to schedule an
appointment at a time that is convenient to you, otherwise we will try to call back at
another time. Thank you.”
Mobile sample: “Hello. My name is (…) and I’m calling on behalf of the Queensland Department of
Agriculture and Fisheries from the Social Research Centre. We’re calling mobile
phones to conduct an important study with Queensland residents. The results will
improve our understanding of how many Queenslanders do and don’t fish and ensure
Queensland’s fisheries are well managed into the future. Please call 1800 800 996 if
you would like to schedule an appointment at a time that is convenient to you,
otherwise we will try to call back at another time. Thank you.”
Changing outgoing telephone number
To increase the likelihood of respondents answering their phones, the outgoing telephone number was
changed from a Victorian ‘03’ number to a Queensland ‘07’ number. It was felt that residents of
Queensland would be more receptive to receiving a call from a ‘07’ number.
Helpdesk and 1800 number operation
The Social Research Centre operated an 1800 number throughout the survey period. The 1800
number primarily handled interview requests (such as changing appointment times), general queries
related to the survey and queries relating to the pre-notification text message. If calls were not
answered in real time (all operators currently busy, call received outside hours of operation), callers
were routed to a messaging service and were returned within 24 hours. The helpdesk operators were
fully briefed on survey background and procedures to answer a variety of queries. The helpdesk
received a total of 625 calls during the screening and explanation surveys. Most contacts were to
make an appointment (44%), to opt out of the research (18%) or to advise that they were out of scope
for the survey (29%). The helpdesk contact information was also maintained throughout the diary
stage (Phase 2) of the project.
SRFS 2019/20 Screening Survey – Technical Report Prepared by the Social Research Centre 29
4. Questionnaire Design
Questionnaire overview
The 2019 SRFS Screening Survey questionnaire was based on that used in the 2013/14 SRFS and
other similar surveys on recreational fishing prevalence. The content and structure was developed in
consultation with the Department of Agriculture and Fisheries and the Social Research Centre.
The questionnaire included the following sections:
Screening for any fishing activity and fishing activity in Queensland over the next 12 months
Household composition and individual fishing intention
o Selection of main fisher
Dual frame weighting questions (phone ownership)
Diary recruitment
o Collection of contact details
Non-intending survey recruitment
o Collection of contact details
Testing and debriefing
A debriefing session with interviewers was held following the first night of field work and several
changes were made to the questionnaire and approach to the survey, including;
Changing the way the survey was explained if the household turned out not to be a fishing
household
Providing interviewers insights on the way the data is used and the purpose / importance of
the screening survey
Some general interviewer notes to provide instruction on question delivery
Arming interviewers with an explanation as to why we ask the demographic questions of all
survey respondents
Providing feedback on the different approaches to diary recruitment.

SRFS 2019/20 Screening Survey – Technical Report 28 Prepared by the Social Research Centre
5. Data Collection & Quality Control
Operational testing
Comprehensive testing was carried out by the Social Research Centre project management team to
ensure the survey instruments were working correctly. Testing procedures included:
programming the skips and sequence instructions as per the hard copy questionnaire
rigorous checking of the questionnaire in ‘practice mode’, including checks of the on-screen
‘presentation’ of questions and response frames, and
randomly allocating dummy data to each field in the questionnaire and examining the
resultant frequency counts to check the structural integrity of the CATI script
Field team briefing
All interviewers selected to work on the survey attended a comprehensive briefing session covering
the project background, objectives and procedures; all aspects of administering the survey
questionnaire, including specific data quality issues; an overview of respondent liaison issues,
including refusal avoidance techniques; and practice interviewing.
The briefing sessions were delivered by the Social Research Centre project manager and supervisory
staff. In total 92 interviewers were briefed to work on the survey. The initial briefing session was held
on 29 January 2019.
Survey briefing notes are provided at Appendix 5.
Fieldwork quality control procedures
The in-field quality monitoring techniques applied to the survey were consistent with existing ISO
20252 procedures, and included:
monitoring (by remote listening) of each interviewer within their first three shifts, whereby the
supervisor listened in to at least 75 per cent of the interview and provided comprehensive
feedback on data quality issues and respondent liaison technique
validation via remote monitoring covering the interviewer’s approach and commitment
gaining skills, as well as the conduct of the interview
field team de-briefing after the first shift and, thereafter, whenever there was important
information to impart to the field team in relation to data quality, consistency of interview
administration, techniques to avoid refusals, appointment making conventions or project
performance
maintenance of a ‘question and answer’ log, addressing issues raised by interviewers, to
clarify survey administration and definitional issues in the questionnaire
monitoring the interview to refusal ratio by interviewer, and
an end of survey de-briefing.
There were no issues arising from validation by remote monitoring undertaken as part of quality
assurance. Table 3 shows the total number of validations completed for the survey. As per the ISO

SRFS 2019/20 Screening Survey – Technical Report Prepared by the Social Research Centre 29
20252 standard, 5 per cent of all telephone surveys completed must be validated. The minimum ISO
requirements were met for this survey.
Table 3 Validation by remote monitoring
Validations Total
Interviewers briefed on study 92
Surveys fully completed 8,388
Validations completed 454
Validations completed (%) 5.4

SRFS 2019/20 Screening Survey – Technical Report 28 Prepared by the Social Research Centre
6. Response outcomes
Sample generation and utilisation
A total of 94,993 sample records were generated and attempted for the survey (including SMS
approach), and 77,067 phone numbers were called to complete 9,257 interviews (see Table 4).
Respondents that answered B5DUM (diary eligibility) were considered a phase 1 complete for
reporting purposes. In total, 284,761 calls were placed, equating to an interview every 33.9 calls (30.8
calls per interview for landline numbers, 82.3 calls per interview for RDD mobile numbers, and 14.2
calls per interview for listed mobile numbers). The average number of calls made to each sample
record was 3.7 (4.6 calls per sample record for the landline frame, 3.4 calls per sample record for RDD
mobile and 3.5 calls per record for listed mobile).
Table 4 Sample utilisation
Total Landline RDD
Mobile Listed Mobile
All call attempts 284,761 84,900 144,901 54,960
Total sample generated and attempted 94,993 18,610 57,941 18,442
Sample initiated by telephone 77,067 18,610 42,776 15,681
Reportable completes 9,257 3,013 1,980 4,264
Average calls per interview 33.9 30.8 82.3 14.2
Average calls per sample record 3.7 4.6 3.4 3.5
Average sample records called per interview 9.2 6.8 24.3 4.0
Final call outcome

SRFS 2019/20 Screening Survey – Technical Report Prepared by the Social Research Centre 17
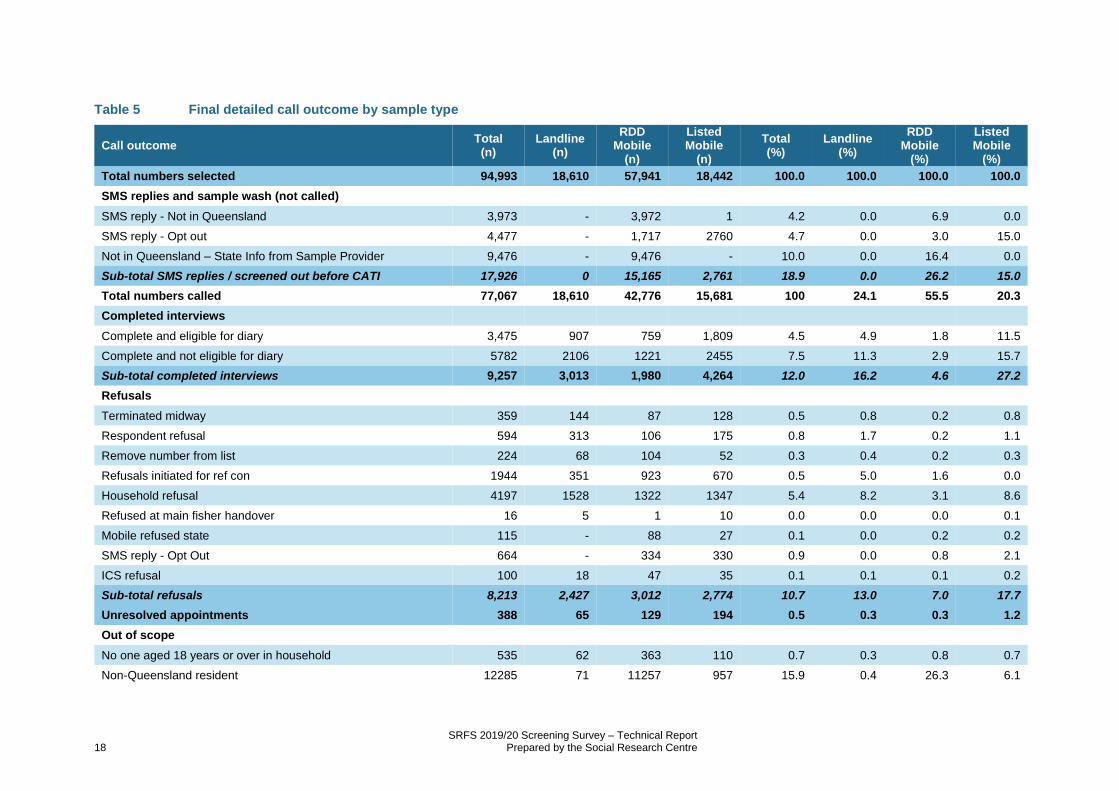
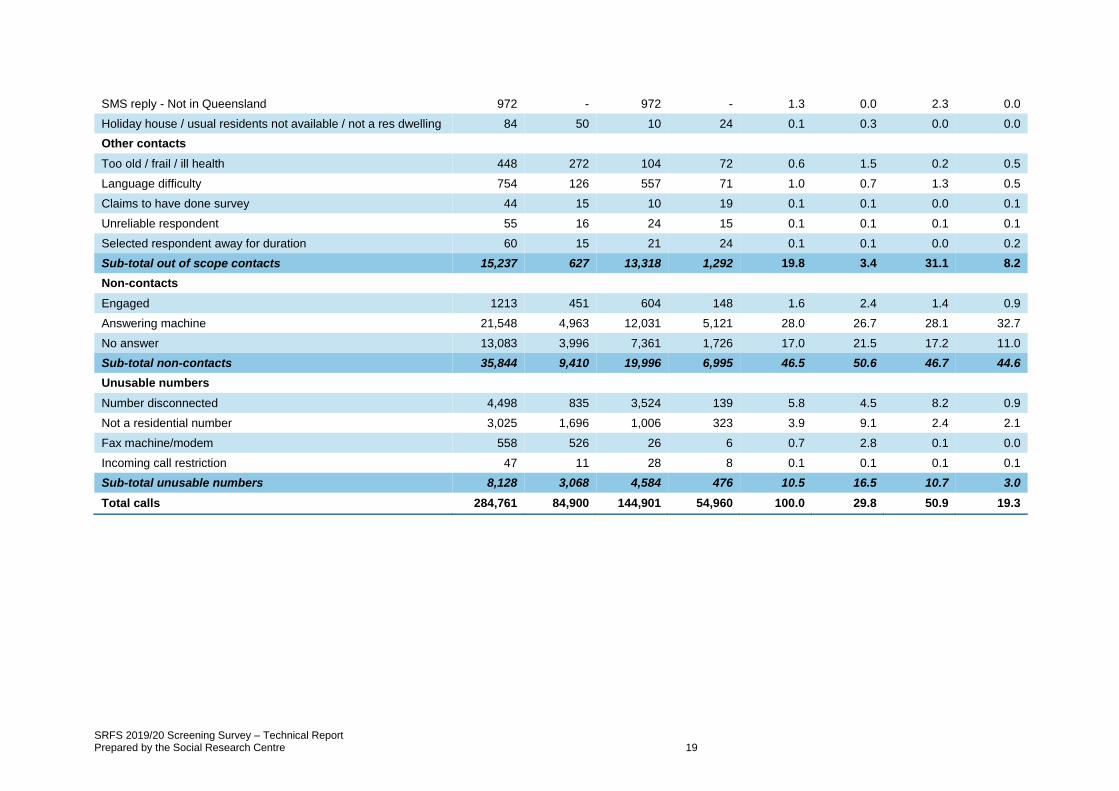
Table 5 shows the final call results for the survey. An interview was achieved from 9.7 per cent of the
94,993 numbers selected.
Of the numbers initiated, 10.5 per cent were unusable; 47.0 per cent were unresolved at the end of the
call cycle (non-contacts or unresolved appointments); and 19.8 per cent were identified as being out of
scope. Refusals (all types) were encountered at 10.7 per cent of the numbers initiated.
SRFS 2019/20 Screening Survey – Technical Report 18 Prepared by the Social Research Centre
Table 5 Final detailed call outcome by sample type
Call outcome Total
(n) Landline
(n)
RDD Mobile
(n)
Listed Mobile
(n)
Total (%)
Landline (%)
RDD Mobile
(%)
Listed Mobile
(%)
Total numbers selected 94,993 18,610 57,941 18,442 100.0 100.0 100.0 100.0
SMS replies and sample wash (not called)
SMS reply - Not in Queensland 3,973 - 3,972 1 4.2 0.0 6.9 0.0
SMS reply - Opt out 4,477 - 1,717 2760 4.7 0.0 3.0 15.0
Not in Queensland – State Info from Sample Provider 9,476 - 9,476 - 10.0 0.0 16.4 0.0
Sub-total SMS replies / screened out before CATI 17,926 0 15,165 2,761 18.9 0.0 26.2 15.0
Total numbers called 77,067 18,610 42,776 15,681 100 24.1 55.5 20.3
Completed interviews
Complete and eligible for diary 3,475 907 759 1,809 4.5 4.9 1.8 11.5
Complete and not eligible for diary 5782 2106 1221 2455 7.5 11.3 2.9 15.7
Sub-total completed interviews 9,257 3,013 1,980 4,264 12.0 16.2 4.6 27.2
Refusals
Terminated midway 359 144 87 128 0.5 0.8 0.2 0.8
Respondent refusal 594 313 106 175 0.8 1.7 0.2 1.1
Remove number from list 224 68 104 52 0.3 0.4 0.2 0.3
Refusals initiated for ref con 1944 351 923 670 0.5 5.0 1.6 0.0
Household refusal 4197 1528 1322 1347 5.4 8.2 3.1 8.6
Refused at main fisher handover 16 5 1 10 0.0 0.0 0.0 0.1
Mobile refused state 115 - 88 27 0.1 0.0 0.2 0.2
SMS reply - Opt Out 664 - 334 330 0.9 0.0 0.8 2.1
ICS refusal 100 18 47 35 0.1 0.1 0.1 0.2
Sub-total refusals 8,213 2,427 3,012 2,774 10.7 13.0 7.0 17.7
Unresolved appointments 388 65 129 194 0.5 0.3 0.3 1.2
Out of scope
No one aged 18 years or over in household 535 62 363 110 0.7 0.3 0.8 0.7
Non-Queensland resident 12285 71 11257 957 15.9 0.4 26.3 6.1
SRFS 2019/20 Screening Survey – Technical Report Prepared by the Social Research Centre 19
SMS reply - Not in Queensland 972 - 972 - 1.3 0.0 2.3 0.0
Holiday house / usual residents not available / not a res dwelling 84 50 10 24 0.1 0.3 0.0 0.0
Other contacts
Too old / frail / ill health 448 272 104 72 0.6 1.5 0.2 0.5
Language difficulty 754 126 557 71 1.0 0.7 1.3 0.5
Claims to have done survey 44 15 10 19 0.1 0.1 0.0 0.1
Unreliable respondent 55 16 24 15 0.1 0.1 0.1 0.1
Selected respondent away for duration 60 15 21 24 0.1 0.1 0.0 0.2
Sub-total out of scope contacts 15,237 627 13,318 1,292 19.8 3.4 31.1 8.2
Non-contacts
Engaged 1213 451 604 148 1.6 2.4 1.4 0.9
Answering machine 21,548 4,963 12,031 5,121 28.0 26.7 28.1 32.7
No answer 13,083 3,996 7,361 1,726 17.0 21.5 17.2 11.0
Sub-total non-contacts 35,844 9,410 19,996 6,995 46.5 50.6 46.7 44.6
Unusable numbers
Number disconnected 4,498 835 3,524 139 5.8 4.5 8.2 0.9
Not a residential number 3,025 1,696 1,006 323 3.9 9.1 2.4 2.1
Fax machine/modem 558 526 26 6 0.7 2.8 0.1 0.0
Incoming call restriction 47 11 28 8 0.1 0.1 0.1 0.1
Sub-total unusable numbers 8,128 3,068 4,584 476 10.5 16.5 10.7 3.0
Total calls 284,761 84,900 144,901 54,960 100.0 29.8 50.9 19.3
SRFS 2019/20 Screening Survey – Technical Report 20 Prepared by the Social Research Centre
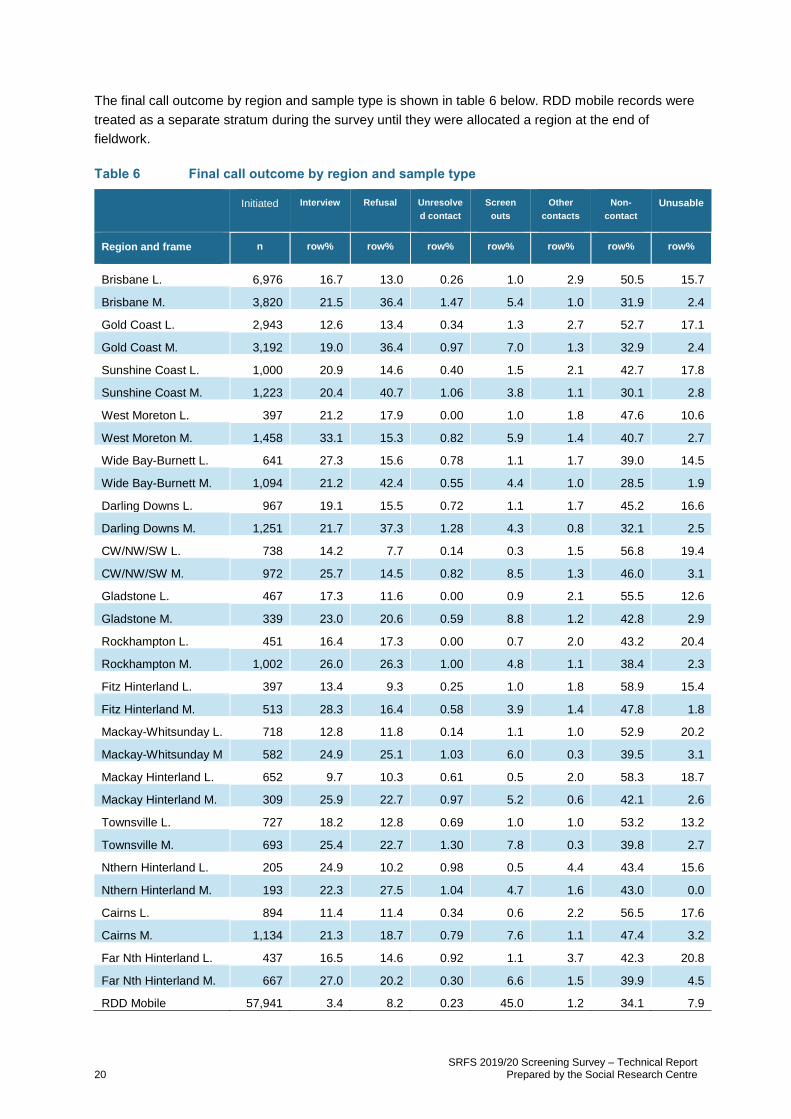
The final call outcome by region and sample type is shown in table 6 below. RDD mobile records were
treated as a separate stratum during the survey until they were allocated a region at the end of
fieldwork.
Table 6 Final call outcome by region and sample type
Initiated Interview Refusal Unresolve
d contact
Screen
outs
Other
contacts
Non-
contact
Unusable
Region and frame n row% row% row% row% row% row% row%
Brisbane L. 6,976 16.7 13.0 0.26 1.0 2.9 50.5 15.7
Brisbane M. 3,820 21.5 36.4 1.47 5.4 1.0 31.9 2.4
Gold Coast L. 2,943 12.6 13.4 0.34 1.3 2.7 52.7 17.1
Gold Coast M. 3,192 19.0 36.4 0.97 7.0 1.3 32.9 2.4
Sunshine Coast L. 1,000 20.9 14.6 0.40 1.5 2.1 42.7 17.8
Sunshine Coast M. 1,223 20.4 40.7 1.06 3.8 1.1 30.1 2.8
West Moreton L. 397 21.2 17.9 0.00 1.0 1.8 47.6 10.6
West Moreton M. 1,458 33.1 15.3 0.82 5.9 1.4 40.7 2.7
Wide Bay-Burnett L. 641 27.3 15.6 0.78 1.1 1.7 39.0 14.5
Wide Bay-Burnett M. 1,094 21.2 42.4 0.55 4.4 1.0 28.5 1.9
Darling Downs L. 967 19.1 15.5 0.72 1.1 1.7 45.2 16.6
Darling Downs M. 1,251 21.7 37.3 1.28 4.3 0.8 32.1 2.5
CW/NW/SW L. 738 14.2 7.7 0.14 0.3 1.5 56.8 19.4
CW/NW/SW M. 972 25.7 14.5 0.82 8.5 1.3 46.0 3.1
Gladstone L. 467 17.3 11.6 0.00 0.9 2.1 55.5 12.6
Gladstone M. 339 23.0 20.6 0.59 8.8 1.2 42.8 2.9
Rockhampton L. 451 16.4 17.3 0.00 0.7 2.0 43.2 20.4
Rockhampton M. 1,002 26.0 26.3 1.00 4.8 1.1 38.4 2.3
Fitz Hinterland L. 397 13.4 9.3 0.25 1.0 1.8 58.9 15.4
Fitz Hinterland M. 513 28.3 16.4 0.58 3.9 1.4 47.8 1.8
Mackay-Whitsunday L. 718 12.8 11.8 0.14 1.1 1.0 52.9 20.2
Mackay-Whitsunday M 582 24.9 25.1 1.03 6.0 0.3 39.5 3.1
Mackay Hinterland L. 652 9.7 10.3 0.61 0.5 2.0 58.3 18.7
Mackay Hinterland M. 309 25.9 22.7 0.97 5.2 0.6 42.1 2.6
Townsville L. 727 18.2 12.8 0.69 1.0 1.0 53.2 13.2
Townsville M. 693 25.4 22.7 1.30 7.8 0.3 39.8 2.7
Nthern Hinterland L. 205 24.9 10.2 0.98 0.5 4.4 43.4 15.6
Nthern Hinterland M. 193 22.3 27.5 1.04 4.7 1.6 43.0 0.0
Cairns L. 894 11.4 11.4 0.34 0.6 2.2 56.5 17.6
Cairns M. 1,134 21.3 18.7 0.79 7.6 1.1 47.4 3.2
Far Nth Hinterland L. 437 16.5 14.6 0.92 1.1 3.7 42.3 20.8
Far Nth Hinterland M. 667 27.0 20.2 0.30 6.6 1.5 39.9 4.5
RDD Mobile 57,941 3.4 8.2 0.23 45.0 1.2 34.1 7.9

SRFS 2019/20 Screening Survey – Technical Report Prepared by the Social Research Centre 21
Allocation to region
The RDD landline and mobile listed sample provided by SamplePages contained postcode
information, which allowed for random selection within each stratum. (No postcode information was
available for mobile RDD sample dialled.) Given that the a priori allocation of records to geographical
strata was approximate, the final allocation of records to geographical strata was based on postcode
and locality information as collected directly from the respondent, with reference to concordances
maintained by the Social Research Centre.
Whilst some attempt was made to keep track of the reallocation of sample records from one stratum to
another in real time, the number of interviews by geographical strata could only be finalised at the end
of data collection.
This, together with issues associated with phone number portability, re-directed numbers, holiday
houses, and telephone exchanges covering a wide geographic area (possibly straddling geographical
strata boundaries), meant that some reallocation of sample records from their a priori stratum was
expected.
The final distribution of reportable completes across the sixteen regions are provided in Table 7 below.
Table 7 Final region distribution of final achieved sample by sample frame
Region Total Landline
RDD Mobile
Listed Mobile
n n n n
Total 9,257 3,013 1,980 4,264
Brisbane 3333 1200 1051 1082
Gold Coast 1086 330 211 545
Sunshine Coast 599 209 131 259
West Moreton 397 63 38 296
Wide Bay-Burnett 529 175 98 256
Darling Downs 685 210 89 386
Central W / North W / South W 313 105 26 182
Gladstone 171 81 24 66
Rockhampton 381 84 40 257
Fitzroy Hinterland 154 47 20 87
Mackay Whitsunday 290 90 44 156
Mackay Hinterland 144 63 13 68
Townsville 400 128 86 186
Northern Hinterland 118 54 15 49
Cairns 372 102 52 218
Far North Queensland 285 72 42 171

SRFS 2019/20 Screening Survey – Technical Report 22 Prepared by the Social Research Centre
Table 8 details the number of reportable completes and diary recruitment performance. Nearly a third
(28.5%) of households screened were both eligible and accepted the invitation to participate in the
diary. The proportion of households accepting the invitation to participate in the diary was highest in
Rockhampton (86%).
Table 8 Diary recruitment performance
Region Complete
Eligible for diary
Accepted welcome
pack
Accepted welcome
pack
n n n row %
Total 9,257 3,411 2,640 75
Brisbane 3,333 1,023 765 74
Gold Coast 1,086 324 240 74
Sunshine Coast 599 227 169 83
West Moreton 397 150 125 77
Wide Bay-Burnett 529 216 166 84
Darling Downs 685 223 187 82
Central W / North W / South W 313 147 121 79
Gladstone 171 91 72 77
Rockhampton 381 175 135 86
Fitzroy Hinterland 154 63 54 76
Mackay Whitsunday 290 156 119 80
Mackay Hinterland 144 79 63 74
Townsville 400 165 122 84
Northern Hinterland 118 62 52 79
Cairns 372 169 134 82
Far North Queensland 285 141 116 75

SRFS 2019/20 Screening Survey – Technical Report Prepared by the Social Research Centre 23
AAPOR Response and other rates
The AAPOR Response Rate 3 (RR3)1 estimates the proportion of cases of unknown eligibility that
may have been eligible for the survey and includes this estimate in the denominator for the calculation
of the survey response rate. The formula for calculating RR3 is:
RR3= I (I+P+R+NC+O) + (e1xe2xUH)+(e1xUO)
Where:
I=Interviews
P=Partial interviews
R=Refusals
NC=Non-contacts
O=Other
e1=the % of known-residential cases estimated to have eligible R
e2=the % of unknown-if-residential cases that are estimated to be residential
UH=Unknown, if household / occupied
UO=Unknown, other.
As shown in Table 9 the overall AAPOR response rate (RR3) for the survey was 25.0 per cent for
landline, 22.2 per cent for RDD mobile and 26.7 per cent for listed mobile.
Table 9 Calculation of AAPOR response rate
Total phone numbers used Landline RDD
Mobile Listed Mobile
I=Complete Interviews (1.1) 3,013 1,980 4,264
R=Refusal and break off (2.1) 2,427 2,678 5,534
NC=Non-Contact (2.2) 15 21 24
O=Other (2.0, 2.3) 494 830 365
e1 the % of known-residential cases estimated to have eligible R
97.7 17.5 90.5
e2 the % of unknown-if-residential cases that are estimated to be residential
66.3 88.0 95.8
UH=Unknown Household (3.1) 9,421 19,775 6,694
UO=Unknown other [1] (3.2-3.9) 0 2,051 0
Response Rate 3
I/((I+P) + (R+NC+O) + e(UH+UO)) 25.0 22.2 26.7
Cooperation Rate 3
I/((I+P)+R)) 56.5 85.6 49.1
Refusal Rate 3
R/((I+P)+(R+NC+O)) 40.8 48.6 54.3
Contact Rate 3
(I+P)+R+O / (I+P)+R+O+NC 99.7 99.6 99.8
1 AAPOR 2016.

SRFS 2019/20 Screening Survey – Technical Report 24 Prepared by the Social Research Centre
The cooperation rates for the survey (interviews / interviews + refusals) are more typically reported
as the ‘response rate’ for Australian surveys. The cooperation rate was 56.5 per cent for landline, 85.6
per cent for RDD mobile and 49.1 per cent for listed mobile.
The refusal rate is the proportion of all cases in which a household or respondent refuse to do an
interview. The refusal rate was 40.8 per cent for landline, 48.6 per cent for RDD mobile and 54.3 per
cent for listed mobile.
The contact rate is the proportion of all cases in which some member of the housing unit was
reached by the survey. The contact rate was 99.7 per cent for landline, 99.6 for RDD mobile and 99.8
per cent for listed mobile.
Refusal Conversion
Refusal conversion is the process of identifying respondents coded as a ‘soft refusal’ upon first contact
and re-serving them at a later date, in an attempt to convert the initial soft refusal to a completed
interview. Only three types of ‘soft refusals’ were attempted: no comment / hung up, not interested or
too busy. A total of 6,629 records were identified as soft refusals and flagged for follow-up through
refusal conversion across all components. Of those selected for refusal conversion, n=644 were
converted into an interview. Table 10 provides a summary of the refusal conversion by sample type. A
proportion of the refusal conversion records were initiated to convert diary refusals, and these are also
included in the table below.
Table 10 Refusal conversion summary by sample type
Initiated for refusal conversion Converted to completed interview
n n row %
Overall refusal conversion 5,725 644 11.2
Landline sample 1,807 333 18.4
RDD Mobile sample 2,243 88 3.9
Listed mobile sample 1,675 223 13.3

SRFS 2019/20 Screening Survey – Technical Report Prepared by the Social Research Centre 25
7. Data Outputs & Reporting
Weighting
When undertaking a survey, the sample of people you reach (i.e. survey), and their associated
characteristics such as age or gender, may not reflect the broader population. As such, it is best and
common practice to account for this by weighing the survey results to reflect the properties of the
broader population.
It is usual to weight the data collected via sample surveys to:
adjust for unequal probabilities of selection;
properly combine the landline and mobile phone samples (and listed and RDD samples within
the mobile phone samples); and
compensate for the effects of non-coverage and non-response.
Weighting survey data improves the ability to draw inferences about the population based on the
sample surveyed.
The broad approach recommended for this survey is based on the work of Valliant et al. (2013) with
adjustments for dual-frame sample design and the presence of listed sample within the mobile frame.
This involved the following steps:
1) A base weight is calculated as the product of two weights:
a. A design weight, calculated to account for the probability of being sampled into the
survey (refer to Section 2 for more details); and
b. A non-response weight, accounting for the estimated chance of participation using the
subset of items collected for both respondents and refusals (refer to Section 3 for
more details).
2) The base weight is then adjusted using generalised regression so that the final weight
conforms to population benchmarks (refer to Section 4 for more details).
Design weight
The design weight is calculated as the inverse of the probability of selection into the survey. For dual
frame surveys, this probability is expressed as:
𝑝𝑠𝑒𝑙𝑒𝑐𝑡𝑖𝑜𝑛 = 𝑝𝐿𝐿 + 𝑝𝑀𝑃
where 𝑝𝐿𝐿 is the probability the respondent will be selected into the survey by landline; and
𝑝𝑀𝑃 is the probability they will be selected into the survey by mobile phone.
This formula can be further broken down into:
𝑝𝑠𝑒𝑙𝑒𝑐𝑡𝑖𝑜𝑛 =𝑆𝐿𝐿
𝑈𝐿𝐿
𝐿𝐿 +(𝑆𝑅𝑀𝑃 + 𝛼 𝑆𝐿𝑀𝑃 𝑝𝐿𝑀𝑃)
𝑈𝑀𝑃
𝑀𝑃
where 𝑆𝐿𝐿 is the number of responding households contacted by landline;
𝑈𝐿𝐿 is the population of the universe of landline numbers; 𝐿𝐿 indicates the presence of a landline (0 for no, 1 for yes);
𝑆𝑅𝑀𝑃 is the number of responding households contacted by RDD mobile;
𝑝𝐿𝑀𝑃 is the probability of the household being part of the listed mobile sample; 𝛼 is an adjustment factor to ensure that the term 𝑆𝐿𝑀𝑃𝑝𝐿𝑀𝑃 sums to the number of listed
households; 𝑆𝐿𝑀𝑃 is the number of responding households contacted by listed mobile;
SRFS 2019/20 Screening Survey – Technical Report 26 Prepared by the Social Research Centre
𝑈𝑀𝑃 is the population of the universe of mobile numbers; and 𝑀𝑃 indicates the number of mobile phones owned by adults in the household.
The sample size for the mobile phone term in the equation has been split between listed and RDD
sample types. For RDD sample, all respondents with a mobile phone (whether or not they are also
listed) have an equal chance of selection. For the listed sample, each household with a mobile phone
needs an estimated probability (𝑝𝐿𝑀𝑃) of appearing in the list. This is calculated using a logistic
regression predicting membership in the listed mobile sample using cases from the combined listed
and random mobile samples.2 The coefficients from the model were applied to landline households
with a mobile phone to give them a value for this as well.
The variables included in the regression were age category, sex, country of birth, level of education
and whether the household was a fishing household, with region acting as a control3. This model was
refitted with just the significantly related variables: age and sex, plus the control variable region, to
create a parsimonious model. The coefficients for age and sex from this model were then applied to all
cases in the data file aged 15 and over to create a probability for inclusion in the listed mobile sample.
This was then averaged across household members.
When calculating probability of selection, an adjustment factor (calculated as average probability
across all households) is used so that the 𝑆𝐿𝑀𝑃 term is not deflated and the probability of listed mobile
selections is correct relative to landline and RDD mobile selections.
For 𝑆𝐿𝐿, 𝑆𝑅𝑀𝑃 and 𝑆𝐿𝑀𝑃 the counts of complete cases were obtained by region. UMP was obtained by
getting population counts for each region and then applying the proportion of mobile phone owners
determined from ACMA/ABS data4, while 𝑈𝑀𝑃 was determined from household counts by region
multiplied by the proportion of landline owner again determined from ABS data5. More information on
determining ULL and UMP can be found in the 2210 QLD Fishing Phase 1 Weighting Process (2019).
Non-response adjustment
Where possible during data collection, persons that refused to participate in the survey were asked a
small subset of items to enable an adjustment to be made for this group, assuming they were
representative of all refusals.
A weighted logistic regression6 model was used to predict whether or not a person responded to the
survey, conditional on the subset of information available for both respondents and non-respondents.
The weight used in the model was the design weight, scaled so that the non-respondents who
answered the subset of items represented all survey refusals. The predictors used in the model were
as follows:
Whether the household was a fishing household;
Sample region (with a separate code for RDD mobiles where region was unknown);
2 Unweighted regression using “glm” function from the R “stats” package (R Core, 2019). 3 Region comes out as highly significant in the model, but this an artefact of the sample design that needs to be controlled for rather than an indication of the probability of inclusion in the listed sample. 4 This information is only available at Capital City/Rest of State level, so the Brisbane figure was known, but the Rest of Queensland figure was used for all other regions. 5 See Footnote 2. 6 Using the “surveyglm” function from the “survey” package in R.

SRFS 2019/20 Screening Survey – Technical Report Prepared by the Social Research Centre 27
Sex of respondent; and
Sample type (unlisted landline, listed landline, unlisted mobile, listed mobile).
The weight at the end of this stage was the inverse of the overall probability of participation where:
𝑝𝑝𝑎𝑟𝑡𝑖𝑐𝑖𝑝𝑎𝑡𝑖𝑜𝑛 = 𝑝𝑠𝑒𝑙𝑒𝑐𝑡𝑖𝑜𝑛 × 𝑝𝑝𝑎𝑟𝑡𝑖𝑐𝑖𝑝𝑎𝑡𝑖𝑜𝑛 | 𝑠𝑒𝑙𝑒𝑐𝑡𝑖𝑜𝑛
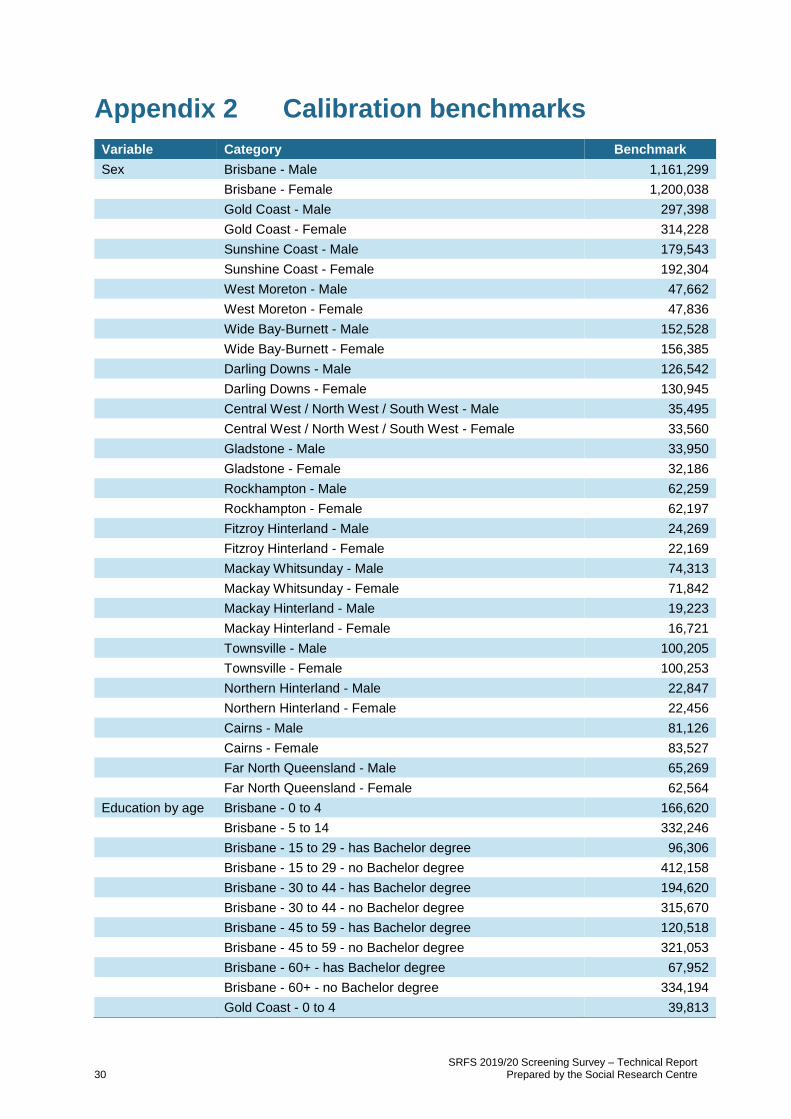
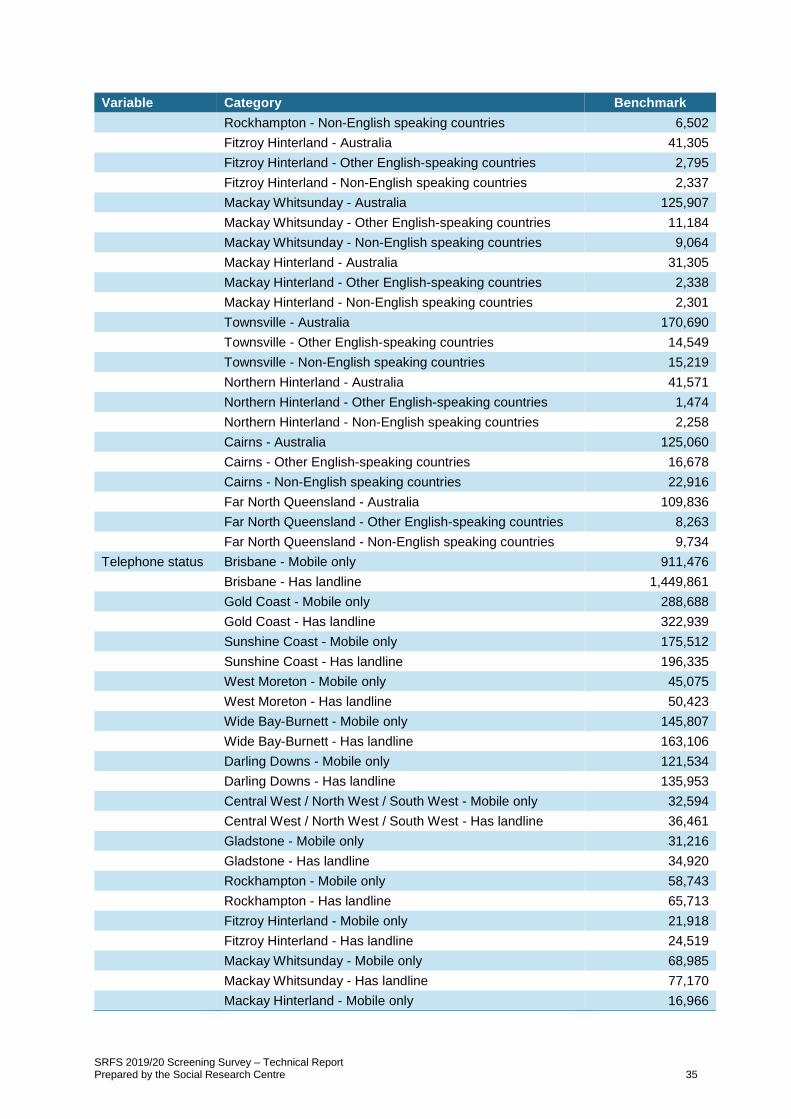
Final calibration
The final step in the weighting process involved calibration of the adjusted design weight to population
benchmarks for individuals for telephone status, age by education, sex, and country of birth all cross-
classified by region and for household benchmarks for region. This calibration gave the final weight to
all households for which a final fishing status could be confirmed.
Population counts for age by education, sex and country of birth were all aggregated to region by SA2
using Census counts. Telephone status benchmarks used the ABS National Health Survey 2013/14
for proportions of respondents with a landline, updated to 2018 using ACMA reports of the national
proportion of mobile phone only adults (ACMA, 2015, 2018).
The household region benchmark had to be a benchmark that added to the correct number of
households when one household member is selected for household level analysis, but still added to
the same population totals as the individual benchmarks. The process here was to calculate the
number of households for a region and have the ‘selected’ benchmark be the number of households
and the ‘not selected’ benchmark be the difference between individual and household benchmarks
(effectively the amount of weight to ‘filter out’ to get household estimates). For example, Brisbane has
a population of 2,200,581 individuals and 869,205 households, so the ‘Brisbane selected’ benchmark
is 869,205 and the ‘Brisbane not selected’ weight is 2,200,581 – 869,205 = 1,331,376. For this to work
correctly it is necessary that all household members be given the same weight so that no matter which
member is selected the weight always works.
All benchmarks were pro-rated to add to the latest available ABS Estimated Resident Population for
Queensland (September 2018). The method for calibrating the design weights was generalised
regression (GREG) weighting which uses non-linear optimisation to minimise the distance between
the design and calibrated weights subject to the weights meeting the benchmarks (Deville, Särndal
and Sautory, 1993; Vanderhoeft, 2001).
Data file provision
Data files for the survey were transferred through the Social Research Centre’s secure file transfer
portal, accessed at https://securesrc.sharefile.com. Individual accounts with access restrictions were
created for Department staff and the Social Research Centre in compliance with confidentiality
provisions. A Phase 1 data file was produced, output in Excel. This data file contained household level
information, demographic information for all persons, and fishing information for all people in fishing
households. This file is to be used in conjunction with the Phase 1 fishing estimates file.
SRFS 2019/20 Screening Survey – Technical Report 28 Prepared by the Social Research Centre
References
American Association for Public Opinion Research (AAPOR) (2016). Standard Definitions: Final Dispositions of Case Codes and Outcome Rates for Surveys. 9th ed. AAPOR, Oakbrook Terrace, IL, USA.
Australian Bureau of Statistics (2017). Census of Population and Housing (August 2016), TableBuilder. Findings based on use of ABS TableBuilder data.
Australian Bureau of Statistics (2019). Estimated Resident Population. Catalog number 3101.0.
Australian Communication and Media Authority (2011). Communications report 2010–11 series Report 2 – Converging communications channels: Preferences and behaviours of Australian communications users. www.acma.gov.au/webwr/_assets/.../report2-convergent_comms.pdf
Australian Communication and Media Authority (ACMA) (2015). Using mobile devices for voice, messaging and internet access. ACMA, Belconnen, ACT. http://www.acma.gov.au/theACMA/engage-blogs/engage-blogs/Research-snapshots/Australians-get-mobile.
ACMA (2019). ACMA Communications Report 2017-18. ACMA, Belconnen, ACT.
Blumberg, S. J. and J.V. Luke. (2011). Wireless substitution: Early release of estimates from the National Health Interview Survey, July–December 2011. National Center for Health Statistics. Available from: http://www.cdc.gov/nchs/nhis.htm.
Dal Grande, E., C.R. Chittleborough, S. Campostrini, M. Dollard, and A.W. Taylor (2016). Pre-survey text messages (SMS) improve participation rate in an Australian mobile telephone survey: an experimental study. PLoS ONE 11(2):e0150231.
Deville, J., C. Särndal, and O. Sautory (1993). Generalized raking procedures in survey sampling. Journal of the American Statistical Association, 88(423), 1013-1020.
Pennay, D.W., K. Borg, and P.J. Lavrakas (2016). Using advance text messages to increase response rates and improve calling efficiency. Paper presented at the 69th annual conference of the World Association for Public Opinion Research, Austin, USA, 12 May.
R Core Team (2019). R: A language and environment for statistical computing. R Foundation for Statistical Computing, Vienna, Austria. https://www.R-project.org/.
Valliant, R., J.A. Dever, and F. Kreuter (2013). Practical Tools for Designing and Weighting Sample Surveys. New York, NY, USA: Springer.
Vanderhoeft, C. (2001) Generalized Calibration at Statistics Belgium. Statistics Belgium Working
Paper No 3.

SRFS 2019/20 Screening Survey – Technical Report Prepared by the Social Research Centre 29
Appendix 1 DAF response definitions
Table 11 Response outcomes (as done in previous surveys) for screening survey
Response Households (n) Households (column %)
Sample loss 35,612 37.5
Out of scope (new code) # 26,635 28.0
Other ^ 766 0.8
Number disconnected 4,544 4.8
Business number 3,102 3.3
Fax/email line 558 0.6
Holiday home / no usual residents 7 <0.1
Non-response 50,124 52.7
Full refusal 12,387 13.0
Part refusal* 303 0.3
Full non-contact 35,994 37.9
Part non-contact* 238 0.3
Language/communication difficulties 1,202 1.3
Fully responding 9,257 9.7
Total 94,993 100
# Out of scope was a new code in 2019 due to the initial unknown eligibility of RDD mobile respondents this year
^ Examples of other outcomes include away for duration of survey, no-one in household over 18
* Part refusal and part non-contact includes those that answered the first few questions of the survey (on
household fishing activity) but subsequently refused or were a non-contact on the final call
Table 12 Non-response reasons
Response type 2019-20
Full refusal 24%
Part refusal 1%
Full non-contact 71%
Language/communication difficulties 2%
Other non-response 2%
* base for 2019 non-response is 50,124 (all responses less fully responding, out of scope and sample loss)
SRFS 2019/20 Screening Survey – Technical Report 30 Prepared by the Social Research Centre
Appendix 2 Calibration benchmarks
Variable Category Benchmark
Sex Brisbane - Male 1,161,299
Brisbane - Female 1,200,038
Gold Coast - Male 297,398
Gold Coast - Female 314,228
Sunshine Coast - Male 179,543
Sunshine Coast - Female 192,304
West Moreton - Male 47,662
West Moreton - Female 47,836
Wide Bay-Burnett - Male 152,528
Wide Bay-Burnett - Female 156,385
Darling Downs - Male 126,542
Darling Downs - Female 130,945
Central West / North West / South West - Male 35,495
Central West / North West / South West - Female 33,560
Gladstone - Male 33,950
Gladstone - Female 32,186
Rockhampton - Male 62,259
Rockhampton - Female 62,197
Fitzroy Hinterland - Male 24,269
Fitzroy Hinterland - Female 22,169
Mackay Whitsunday - Male 74,313
Mackay Whitsunday - Female 71,842
Mackay Hinterland - Male 19,223
Mackay Hinterland - Female 16,721
Townsville - Male 100,205
Townsville - Female 100,253
Northern Hinterland - Male 22,847
Northern Hinterland - Female 22,456
Cairns - Male 81,126
Cairns - Female 83,527
Far North Queensland - Male 65,269
Far North Queensland - Female 62,564
Education by age Brisbane - 0 to 4 166,620
Brisbane - 5 to 14 332,246
Brisbane - 15 to 29 - has Bachelor degree 96,306
Brisbane - 15 to 29 - no Bachelor degree 412,158
Brisbane - 30 to 44 - has Bachelor degree 194,620
Brisbane - 30 to 44 - no Bachelor degree 315,670
Brisbane - 45 to 59 - has Bachelor degree 120,518
Brisbane - 45 to 59 - no Bachelor degree 321,053
Brisbane - 60+ - has Bachelor degree 67,952
Brisbane - 60+ - no Bachelor degree 334,194
Gold Coast - 0 to 4 39,813

SRFS 2019/20 Screening Survey – Technical Report Prepared by the Social Research Centre 31
Variable Category Benchmark
Gold Coast - 5 to 14 82,664
Gold Coast - 15 to 29 - has Bachelor degree 18,564
Gold Coast - 15 to 29 - no Bachelor degree 100,115
Gold Coast - 30 to 44 - has Bachelor degree 36,278
Gold Coast - 30 to 44 - no Bachelor degree 89,550
Gold Coast - 45 to 59 - has Bachelor degree 23,985
Gold Coast - 45 to 59 - no Bachelor degree 95,456
Gold Coast - 60+ - has Bachelor degree 16,582
Gold Coast - 60+ - no Bachelor degree 108,619
Sunshine Coast - 0 to 4 20,831
Sunshine Coast - 5 to 14 51,471
Sunshine Coast - 15 to 29 - has Bachelor degree 6,097
Sunshine Coast - 15 to 29 - no Bachelor degree 52,299
Sunshine Coast - 30 to 44 - has Bachelor degree 18,397
Sunshine Coast - 30 to 44 - no Bachelor degree 47,939
Sunshine Coast - 45 to 59 - has Bachelor degree 17,198
Sunshine Coast - 45 to 59 - no Bachelor degree 61,271
Sunshine Coast - 60+ - has Bachelor degree 15,102
Sunshine Coast - 60+ - no Bachelor degree 81,241
West Moreton - 0 to 4 6,314
West Moreton - 5 to 14 14,729
West Moreton - 15 to 29 - has Bachelor degree 1,137
West Moreton - 15 to 29 - no Bachelor degree 14,965
West Moreton - 30 to 44 - has Bachelor degree 2,543
West Moreton - 30 to 44 - no Bachelor degree 13,750
West Moreton - 45 to 59 - has Bachelor degree 2,119
West Moreton - 45 to 59 - no Bachelor degree 17,632
West Moreton - 60+ - has Bachelor degree 1,901
West Moreton - 60+ - no Bachelor degree 20,408
Wide Bay-Burnett - 0 to 4 17,842
Wide Bay-Burnett - 5 to 14 43,327
Wide Bay-Burnett - 15 to 29 - has Bachelor degree 2,824
Wide Bay-Burnett - 15 to 29 - no Bachelor degree 42,838
Wide Bay-Burnett - 30 to 44 - has Bachelor degree 8,106
Wide Bay-Burnett - 30 to 44 - no Bachelor degree 39,101
Wide Bay-Burnett - 45 to 59 - has Bachelor degree 7,761
Wide Bay-Burnett - 45 to 59 - no Bachelor degree 55,389
Wide Bay-Burnett - 60+ - has Bachelor degree 7,004
Wide Bay-Burnett - 60+ - no Bachelor degree 84,721
Darling Downs - 0 to 4 18,270
Darling Downs - 5 to 14 39,558
Darling Downs - 15 to 29 - has Bachelor degree 4,993
Darling Downs - 15 to 29 - no Bachelor degree 41,972
Darling Downs - 30 to 44 - has Bachelor degree 11,234
Darling Downs - 30 to 44 - no Bachelor degree 34,221

SRFS 2019/20 Screening Survey – Technical Report 32 Prepared by the Social Research Centre
Variable Category Benchmark
Darling Downs - 45 to 59 - has Bachelor degree 8,914
Darling Downs - 45 to 59 - no Bachelor degree 40,741
Darling Downs - 60+ - has Bachelor degree 6,550
Darling Downs - 60+ - no Bachelor degree 51,034
Central West / North West / South West - 0 to 4 6,124
Central West / North West / South West - 5 to 14 10,885
Central West / North West / South West - 15 to 29 - has Bachelor degree
1,692
Central West / North West / South West - 15 to 29 - no Bachelor degree
11,481
Central West / North West / South West - 30 to 44 - has Bachelor degree
2,716
Central West / North West / South West - 30 to 44 - no Bachelor degree
10,914
Central West / North West / South West - 45 to 59 - has Bachelor degree
1,446
Central West / North West / South West - 45 to 59 - no Bachelor degree
12,298
Central West / North West / South West - 60+ - has Bachelor degree
713
Central West / North West / South West - 60+ - no Bachelor degree
10,785
Gladstone - 0 to 4 5,395
Gladstone - 5 to 14 10,953
Gladstone - 15 to 29 - has Bachelor degree 1,064
Gladstone - 15 to 29 - no Bachelor degree 11,157
Gladstone - 30 to 44 - has Bachelor degree 2,709
Gladstone - 30 to 44 - no Bachelor degree 11,273
Gladstone - 45 to 59 - has Bachelor degree 1,714
Gladstone - 45 to 59 - no Bachelor degree 12,200
Gladstone - 60+ - has Bachelor degree 759
Gladstone - 60+ - no Bachelor degree 8,913
Rockhampton - 0 to 4 8,985
Rockhampton - 5 to 14 18,915
Rockhampton - 15 to 29 - has Bachelor degree 2,024
Rockhampton - 15 to 29 - no Bachelor degree 21,972
Rockhampton - 30 to 44 - has Bachelor degree 4,905
Rockhampton - 30 to 44 - no Bachelor degree 17,848
Rockhampton - 45 to 59 - has Bachelor degree 3,917
Rockhampton - 45 to 59 - no Bachelor degree 20,854
Rockhampton - 60+ - has Bachelor degree 2,421
Rockhampton - 60+ - no Bachelor degree 22,614
Fitzroy Hinterland - 0 to 4 4,411
Fitzroy Hinterland - 5 to 14 8,173
Fitzroy Hinterland - 15 to 29 - has Bachelor degree 863
Fitzroy Hinterland - 15 to 29 - no Bachelor degree 7,527
Fitzroy Hinterland - 30 to 44 - has Bachelor degree 1,824
Fitzroy Hinterland - 30 to 44 - no Bachelor degree 8,342
Fitzroy Hinterland - 45 to 59 - has Bachelor degree 936

SRFS 2019/20 Screening Survey – Technical Report Prepared by the Social Research Centre 33
Variable Category Benchmark
Fitzroy Hinterland - 45 to 59 - no Bachelor degree 8,074
Fitzroy Hinterland - 60+ - has Bachelor degree 345
Fitzroy Hinterland - 60+ - no Bachelor degree 5,942
Mackay Whitsunday - 0 to 4 10,773
Mackay Whitsunday - 5 to 14 22,283
Mackay Whitsunday - 15 to 29 - has Bachelor degree 2,593
Mackay Whitsunday - 15 to 29 - no Bachelor degree 24,645
Mackay Whitsunday - 30 to 44 - has Bachelor degree 5,441
Mackay Whitsunday - 30 to 44 - no Bachelor degree 24,200
Mackay Whitsunday - 45 to 59 - has Bachelor degree 3,794
Mackay Whitsunday - 45 to 59 - no Bachelor degree 26,860
Mackay Whitsunday - 60+ - has Bachelor degree 1,977
Mackay Whitsunday - 60+ - no Bachelor degree 23,590
Mackay Hinterland - 0 to 4 3,513
Mackay Hinterland - 5 to 14 5,968
Mackay Hinterland - 15 to 29 - has Bachelor degree 758
Mackay Hinterland - 15 to 29 - no Bachelor degree 5,639
Mackay Hinterland - 30 to 44 - has Bachelor degree 1,373
Mackay Hinterland - 30 to 44 - no Bachelor degree 6,686
Mackay Hinterland - 45 to 59 - has Bachelor degree 518
Mackay Hinterland - 45 to 59 - no Bachelor degree 6,278
Mackay Hinterland - 60+ - has Bachelor degree 289
Mackay Hinterland - 60+ - no Bachelor degree 4,922
Townsville - 0 to 4 14,862
Townsville - 5 to 14 29,552
Townsville - 15 to 29 - has Bachelor degree 5,469
Townsville - 15 to 29 - no Bachelor degree 39,985
Townsville - 30 to 44 - has Bachelor degree 10,747
Townsville - 30 to 44 - no Bachelor degree 29,949
Townsville - 45 to 59 - has Bachelor degree 7,377
Townsville - 45 to 59 - no Bachelor degree 30,329
Townsville - 60+ - has Bachelor degree 3,987
Townsville - 60+ - no Bachelor degree 28,202
Northern Hinterland - 0 to 4 2,782
Northern Hinterland - 5 to 14 6,831
Northern Hinterland - 15 to 29 - has Bachelor degree 548
Northern Hinterland - 15 to 29 - no Bachelor degree 6,825
Northern Hinterland - 30 to 44 - has Bachelor degree 1,045
Northern Hinterland - 30 to 44 - no Bachelor degree 6,130
Northern Hinterland - 45 to 59 - has Bachelor degree 912
Northern Hinterland - 45 to 59 - no Bachelor degree 8,359
Northern Hinterland - 60+ - has Bachelor degree 628
Northern Hinterland - 60+ - no Bachelor degree 11,243
Cairns - 0 to 4 12,048
Cairns - 5 to 14 25,678

SRFS 2019/20 Screening Survey – Technical Report 34 Prepared by the Social Research Centre
Variable Category Benchmark
Cairns - 15 to 29 - has Bachelor degree 3,755
Cairns - 15 to 29 - no Bachelor degree 26,553
Cairns - 30 to 44 - has Bachelor degree 9,288
Cairns - 30 to 44 - no Bachelor degree 25,673
Cairns - 45 to 59 - has Bachelor degree 7,125
Cairns - 45 to 59 - no Bachelor degree 26,754
Cairns - 60+ - has Bachelor degree 3,748
Cairns - 60+ - no Bachelor degree 24,032
Far North Queensland - 0 to 4 9,411
Far North Queensland - 5 to 14 20,648
Far North Queensland - 15 to 29 - has Bachelor degree 1,512
Far North Queensland - 15 to 29 - no Bachelor degree 19,154
Far North Queensland - 30 to 44 - has Bachelor degree 3,678
Far North Queensland - 30 to 44 - no Bachelor degree 17,972
Far North Queensland - 45 to 59 - has Bachelor degree 3,425
Far North Queensland - 45 to 59 - no Bachelor degree 23,220
Far North Queensland - 60+ - has Bachelor degree 2,930
Far North Queensland - 60+ - no Bachelor degree 25,884
Country of birth Brisbane - Australia 1,693,393
Brisbane - Other English-speaking countries 287,887
Brisbane - Non-English speaking countries 380,058
Gold Coast - Australia 424,866
Gold Coast - Other English-speaking countries 108,042
Gold Coast - Non-English speaking countries 78,719
Sunshine Coast - Australia 292,943
Sunshine Coast - Other English-speaking countries 54,772
Sunshine Coast - Non-English speaking countries 24,132
West Moreton - Australia 83,033
West Moreton - Other English-speaking countries 6,840
West Moreton - Non-English speaking countries 5,625
Wide Bay-Burnett - Australia 268,394
Wide Bay-Burnett - Other English-speaking countries 25,189
Wide Bay-Burnett - Non-English speaking countries 15,331
Darling Downs - Australia 227,734
Darling Downs - Other English-speaking countries 13,185
Darling Downs - Non-English speaking countries 16,569
Central West / North West / South West - Australia 61,975
Central West / North West / South West - Other English-speaking countries
3,537
Central West / North West / South West - Non-English speaking countries
3,544
Gladstone - Australia 55,725
Gladstone - Other English-speaking countries 6,018
Gladstone - Non-English speaking countries 4,394
Rockhampton - Australia 111,432
Rockhampton - Other English-speaking countries 6,522
SRFS 2019/20 Screening Survey – Technical Report Prepared by the Social Research Centre 35
Variable Category Benchmark
Rockhampton - Non-English speaking countries 6,502
Fitzroy Hinterland - Australia 41,305
Fitzroy Hinterland - Other English-speaking countries 2,795
Fitzroy Hinterland - Non-English speaking countries 2,337
Mackay Whitsunday - Australia 125,907
Mackay Whitsunday - Other English-speaking countries 11,184
Mackay Whitsunday - Non-English speaking countries 9,064
Mackay Hinterland - Australia 31,305
Mackay Hinterland - Other English-speaking countries 2,338
Mackay Hinterland - Non-English speaking countries 2,301
Townsville - Australia 170,690
Townsville - Other English-speaking countries 14,549
Townsville - Non-English speaking countries 15,219
Northern Hinterland - Australia 41,571
Northern Hinterland - Other English-speaking countries 1,474
Northern Hinterland - Non-English speaking countries 2,258
Cairns - Australia 125,060
Cairns - Other English-speaking countries 16,678
Cairns - Non-English speaking countries 22,916
Far North Queensland - Australia 109,836
Far North Queensland - Other English-speaking countries 8,263
Far North Queensland - Non-English speaking countries 9,734
Telephone status Brisbane - Mobile only 911,476
Brisbane - Has landline 1,449,861
Gold Coast - Mobile only 288,688
Gold Coast - Has landline 322,939
Sunshine Coast - Mobile only 175,512
Sunshine Coast - Has landline 196,335
West Moreton - Mobile only 45,075
West Moreton - Has landline 50,423
Wide Bay-Burnett - Mobile only 145,807
Wide Bay-Burnett - Has landline 163,106
Darling Downs - Mobile only 121,534
Darling Downs - Has landline 135,953
Central West / North West / South West - Mobile only 32,594
Central West / North West / South West - Has landline 36,461
Gladstone - Mobile only 31,216
Gladstone - Has landline 34,920
Rockhampton - Mobile only 58,743
Rockhampton - Has landline 65,713
Fitzroy Hinterland - Mobile only 21,918
Fitzroy Hinterland - Has landline 24,519
Mackay Whitsunday - Mobile only 68,985
Mackay Whitsunday - Has landline 77,170
Mackay Hinterland - Mobile only 16,966

SRFS 2019/20 Screening Survey – Technical Report 36 Prepared by the Social Research Centre
Variable Category Benchmark
Mackay Hinterland - Has landline 18,978
Townsville - Mobile only 94,616
Townsville - Has landline 105,842
Northern Hinterland - Mobile only 21,383
Northern Hinterland - Has landline 23,920
Cairns - Mobile only 77,716
Cairns - Has landline 86,937
Far North Queensland - Mobile only 60,337
Far North Queensland - Has landline 67,496
Household count Brisbane - Household count 1,492,132
Brisbane - Remainder 869,205
Gold Coast - Household count 366,127
Gold Coast - Remainder 245,500
Sunshine Coast - Household count 214,560
Sunshine Coast - Remainder 157,287
West Moreton - Household count 59,237
West Moreton - Remainder 36,261
Wide Bay-Burnett - Household count 171,903
Wide Bay-Burnett - Remainder 137,010
Darling Downs - Household count 151,971
Darling Downs - Remainder 105,516
Central West / North West / South West - Household count 35,272
Central West / North West / South West - Remainder 33,783
Gladstone - Household count 37,053
Gladstone - Remainder 29,083
Rockhampton - Household count 72,946
Rockhampton - Remainder 51,510
Fitzroy Hinterland - Household count 25,225
Fitzroy Hinterland - Remainder 21,212
Mackay Whitsunday - Household count 85,878
Mackay Whitsunday - Remainder 60,277
Mackay Hinterland - Household count 18,411
Mackay Hinterland - Remainder 17,533
Townsville - Household count 123,461
Townsville - Remainder 76,997
Northern Hinterland - Household count 24,864
Northern Hinterland - Remainder 20,439
Cairns - Household count 97,438
Cairns - Remainder 67,215
Far North Queensland - Household count 71,887
Far North Queensland - Remainder 55,946

SRFS 2019/20 Screening Survey – Technical Report Prepared by the Social Research Centre 37
Electronic appendices
Supplied electronically:
Appendix 3 – AAPOR mapping to call outcomes
Appendix 4 – DAF outcome mapping to call outcomes
Appendix 5 – Final Questionnaire
Appendix 6 – Website information
Appendix 7 – Briefing notes


