university of copenhagen CHARACTERIZATION OF UPPER PALAEOZOIC ORGANIC-RICH UNITS IN SVALBARD: IMPLICATIONS FOR THE PETROLEUM SYSTEMS OF THE NORWEGIAN BARENTS SHELF Nicolaisen, J. B.; Elvebakk, G.; Ahokas, J.; Bojesen-Koefoed, J. A.; Olaussen, S.; Rinna, J.; Skeie, J. E.; Stemmerik, L. Published in: Journal of Petroleum Geology DOI: 10.1111/jpg.12724 Publication date: 2019 Document version Publisher's PDF, also known as Version of record Document license: CC BY Citation for published version (APA): Nicolaisen, J. B., Elvebakk, G., Ahokas, J., Bojesen-Koefoed, J. A., Olaussen, S., Rinna, J., ... Stemmerik, L. (2019). CHARACTERIZATION OF UPPER PALAEOZOIC ORGANIC-RICH UNITS IN SVALBARD: IMPLICATIONS FOR THE PETROLEUM SYSTEMS OF THE NORWEGIAN BARENTS SHELF. Journal of Petroleum Geology, 42(1), 59-78. https://doi.org/10.1111/jpg.12724 Download date: 29. maj. 2020
Transcript
u n i ve r s i t y o f co pe n h ag e n
CHARACTERIZATION OF UPPER PALAEOZOIC ORGANIC-RICH UNITS IN SVALBARD:IMPLICATIONS FOR THE PETROLEUM SYSTEMS OF THE NORWEGIAN BARENTSSHELF
Nicolaisen, J. B.; Elvebakk, G.; Ahokas, J.; Bojesen-Koefoed, J. A.; Olaussen, S.; Rinna, J.;Skeie, J. E.; Stemmerik, L.
Published in:Journal of Petroleum Geology
DOI:10.1111/jpg.12724
Publication date:2019
Document versionPublisher's PDF, also known as Version of record
Document license:CC BY
Citation for published version (APA):Nicolaisen, J. B., Elvebakk, G., Ahokas, J., Bojesen-Koefoed, J. A., Olaussen, S., Rinna, J., ... Stemmerik, L.(2019). CHARACTERIZATION OF UPPER PALAEOZOIC ORGANIC-RICH UNITS IN SVALBARD:IMPLICATIONS FOR THE PETROLEUM SYSTEMS OF THE NORWEGIAN BARENTS SHELF. Journal ofPetroleum Geology, 42(1), 59-78. https://doi.org/10.1111/jpg.12724
59Journal of Petroleum Geology, Vol. 42(1), January 2019, pp 59-78
CHARACTERIZATION OF UPPER PALAEOZOIC ORGANIC-RICH UNITS IN SVALBARD: IMPLICATIONS FOR THE PETROLEUM SYSTEMS OF THE NORWEGIAN BARENTS SHELF
J. B. Nicolaisena,e *, G. Elvebakkb, J. Ahokasc, J. A. Bojesen-Koefoedd, S. Olaussene, J. Rinnac, J. E. Skeiec and L. Stemmerika,e
Recent discoveries of hydrocarbons along the western margin of the Norwegian Barents Shelf have emphasised the need for a better understanding of the source rock potential of the Upper Palaeozoic succession. In this study, a comprehensive set of organic geochemical data have been collected from the Carboniferous – Permian interval outcropping on Svalbard in order to re-assess the offshore potential. Four stratigraphic levels with organic-rich facies have been identified: (i) Lower Carboniferous (Mississippian) fluvio-lacustrine intervals with TOC between 1 and 75 wt.% and a cumulative organic-rich section more than 100 m thick; (ii) Upper Carboniferous (Pennsylvanian) evaporite-associated marine shales and organic-rich carbonates with TOC up to 20 wt.%; (iii) a widespread lowermost Permian organic-rich carbonate unit, 2–10 m thick, with 1–10 wt. % TOC; and (iv) Lower Permian organic-rich marine shales with an average TOC content of 10 wt.%.
Petroleum can potentially be tied to organic-rich facies at formation level based on the gammacerane index, d13C of the aromatic fraction and/or the Pr/Ph ratio. Relatively heavy d13C values, a low gammacerane index and high Pr/Ph ratios characterize Lower Carboniferous non-marine sediments, whereas evaporite-associated facies have lighter d13C, a higher gammacerane index and lower Pr/Ph ratios.
aNatural History Museum of Denmark, University of Copenhagen, Denmark.bGeo-Moski AS, Norway.cAker BP, Norway.dGEUS, Geological Survey of Denmark and Greenland, Denmark.eUNIS, University Centre in Svalbard, Norway.* corresponding author, email: [email protected]
INTRODUCTION
The Norwegian part of the Barents Shelf covers an area of more than 300,000 km2 and is still considered a frontier petroleum province, with only 145 exploration wells drilled and two fields in production. In a recent update, the Norwegian authorities estimated that more than 60% of the undiscovered petroleum resources
on the Norwegian continental shelf are located in the Barents Sea, and that 60–80% of those are in Triassic and older stratigraphic units (NPD, 2018).
The Upper Palaeozoic succession in the western Barents Sea consists of four second-order depositional sequences, each corresponding to a group in the lithostratigraphic scheme for the Norwegian Barents Sea (Figs 1, 2; Larssen et al., 2005). The four-fold division of the succession reflects long (15–50 Ma) periods of relatively stable depositional conditions on the central Pangean shelf separated by abrupt intervals of change (Stemmerik and Worsley, 2005). The Lower Carboniferous Billefjorden Group (Fig. 2) is up to 600
60 Upper Palaeozoic organic-rich units on Svalbard
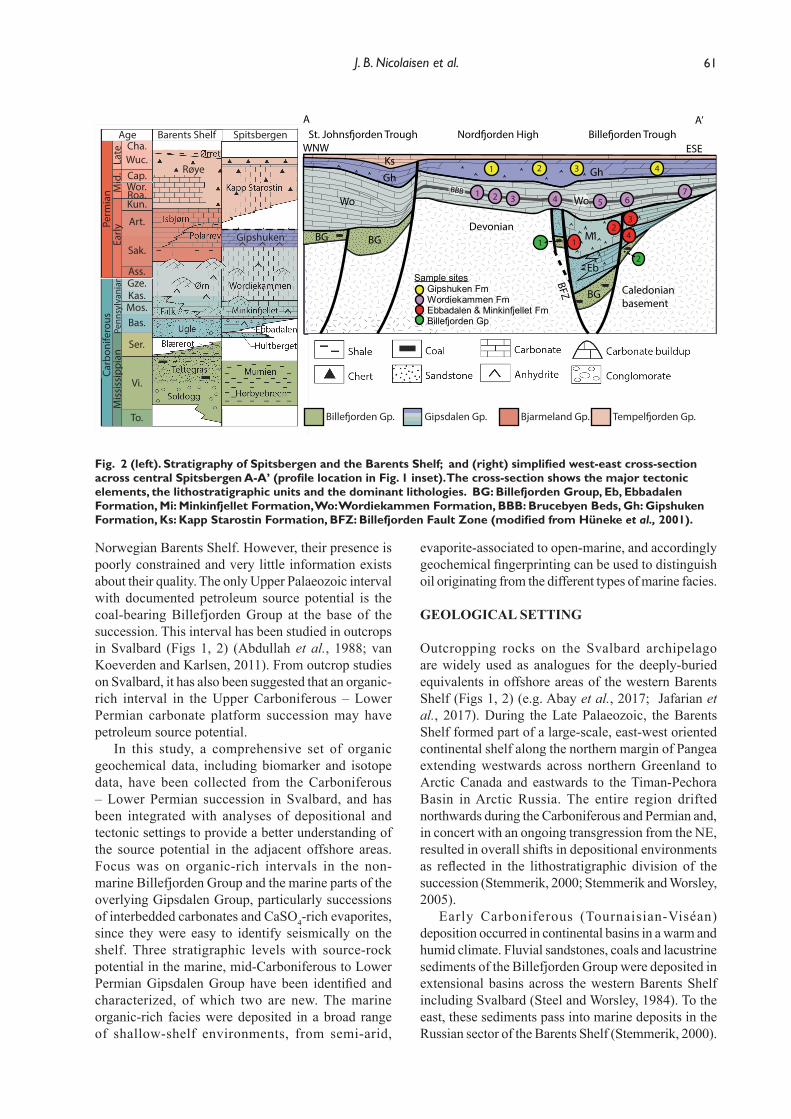
m thick and is dominated by fluvial deposits including widespread coal layers and corresponds to deposition in a humid tropical climate (van Koeverden and Karlsen, 2011). The up to 1500 m thick mid-Carboniferous – Lower Permian Gipsdalen Group consists of a lower, continental to marginal-marine syn-rift succession of coarse-grained siliciclastics and evaporites, and a regionally widespread upper interval of warm-water carbonates. Deposition took place in in a warm and arid setting (Stemmerik and Worsley, 2005). The overlying Lower Permian Bjarmeland Group is up to 500 m thick and is composed of cool-water carbonates and interbedded marine shales deposited in a temperate setting. The up to 900 m thick Lower – Upper Permian Tempelfjorden Group is characterized by spiculites and silicified limestones deposited in deeper and cooler shelfal environments (Blomeier et al., 2011).
Three generalized exploration models have been proposed for the Upper Palaeozoic succession on
the western Barents Shelf based on the integration of offshore data with studies of outcrops of the time-equivalent succession on Svalbard in the uplifted NW margin of the Barents Shelf (Fig. 1) (NPD, 2018). Models with Lower Carboniferous Billefjorden fluvial sandstones and Upper Carboniferous – Lower Permian Gipsdalen warm-water carbonates are so far unconfirmed. However, recent discoveries of petroleum in karstified Permian carbonates and spiculites in the Gohta and Alta areas along the western margin of the Norwegian Barents Shelf have confirmed the significance of these stratigraphic intervals as petroleum reservoirs, and have emphasised the need for a better understanding of the petroleum source potential of the Upper Palaeozoic succession in this part of the Arctic.
Play models with Upper Carboniferous – Permian carbonates and spiculites as reservoirs depend on the assumed presence of intra-platform source rocks in the
Fig. 1. Map of sample locations in Central Svalbard and on Bjørnøya. The Billefjorden Fault Zone (BFZ) is marked by black lines. Sample sites are marked by circles. The number of analyzed samples at each site is summarised at the bottom of the figure.
Nicolaisen.indd 60 03/12/2018 10:08:19
61J. B. Nicolaisen et al.
Norwegian Barents Shelf. However, their presence is poorly constrained and very little information exists about their quality. The only Upper Palaeozoic interval with documented petroleum source potential is the coal-bearing Billefjorden Group at the base of the succession. This interval has been studied in outcrops in Svalbard (Figs 1, 2) (Abdullah et al., 1988; van Koeverden and Karlsen, 2011). From outcrop studies on Svalbard, it has also been suggested that an organic-rich interval in the Upper Carboniferous – Lower Permian carbonate platform succession may have petroleum source potential.
In this study, a comprehensive set of organic geochemical data, including biomarker and isotope data, have been collected from the Carboniferous – Lower Permian succession in Svalbard, and has been integrated with analyses of depositional and tectonic settings to provide a better understanding of the source potential in the adjacent offshore areas. Focus was on organic-rich intervals in the non-marine Billefjorden Group and the marine parts of the overlying Gipsdalen Group, particularly successions of interbedded carbonates and CaSO4-rich evaporites, since they were easy to identify seismically on the shelf. Three stratigraphic levels with source-rock potential in the marine, mid-Carboniferous to Lower Permian Gipsdalen Group have been identifi ed and characterized, of which two are new. The marine organic-rich facies were deposited in a broad range of shallow-shelf environments, from semi-arid,
evaporite-associated to open-marine, and accordingly geochemical fi ngerprinting can be used to distinguish oil originating from the different types of marine facies.
GEOLOGICAL SETTING
Outcropping rocks on the Svalbard archipelago are widely used as analogues for the deeply-buried equivalents in offshore areas of the western Barents Shelf (Figs 1, 2) (e.g. Abay et al., 2017; Jafarian et al., 2017). During the Late Palaeozoic, the Barents Shelf formed part of a large-scale, east-west oriented continental shelf along the northern margin of Pangea extending westwards across northern Greenland to Arctic Canada and eastwards to the Timan-Pechora Basin in Arctic Russia. The entire region drifted northwards during the Carboniferous and Permian and, in concert with an ongoing transgression from the NE, resulted in overall shifts in depositional environments as refl ected in the lithostratigraphic division of the succession (Stemmerik, 2000; Stemmerik and Worsley, 2005).
Early Carboniferous (Tournaisian-Viséan) deposition occurred in continental basins in a warm and humid climate. Fluvial sandstones, coals and lacustrine sediments of the Billefjorden Group were deposited in extensional basins across the western Barents Shelf including Svalbard (Steel and Worsley, 1984). To the east, these sediments pass into marine deposits in the Russian sector of the Barents Shelf (Stemmerik, 2000).
To.
Vi.
Mis
siss
ippi
anPe
nnsy
lvan
ian
Mid
.La
te
Ser.
Bas.Mos.Kas.Gze.Ass.
Sak.
Art.
Kun.Roa.Wor.Cap.Wuc.Cha.
Carb
onife
rous
Perm
ian
Early
Age Barents Shelf Spitsbergen
RøyeE1
E2E4
Devonian
Caledonianbasement
BGBG
Wo
Mi
GhGh
Ks
BG
Eb
WoBBB
BFZ
WNW ESE
A A’
Ebbadalen & Minkinfjellet Fm
Gipshuken Fm
Billefjorden Gp
Wordiekammen Fm
Sample sites
1 2 3 4
1
2
1 2 3 4 5 67
1
24
3
Gipshuken
Gipsdalen Gp. Bjarmeland Gp.
Fig. 2 (left). Stratigraphy of Spitsbergen and the Barents Shelf; and (right) simplifi ed west-east cross-section across central Spitsbergen A-A’ (profi le location in Fig. 1 inset). The cross-section shows the major tectonic elements, the lithostratigraphic units and the dominant lithologies. BG: Billefjorden Group, Eb, Ebbadalen Formation, Mi: Minkinfjellet Formation, Wo: Wordiekammen Formation, BBB: Brucebyen Beds, Gh: Gipshuken Formation, Ks: Kapp Starostin Formation, BFZ: Billefjorden Fault Zone (modifi ed from Hüneke et al., 2001).
Nicolaisen.indd 61 03/12/2018 10:08:24
62 Upper Palaeozoic organic-rich units on Svalbard
Following early Serphukovian uplift and erosion, subsidence began in narrow half-grabens during the late Serpukhovian, and the region was transgressed in the Bashkirian. The climate was warm and arid, and the ongoing transgression, modulated by high frequency sea-level changes related to the Gondwanaland glaciations, resulted in the deposition of the Gipsdalen Group sedimentary succession (e.g. Stemmerik, 2000; Larssen et al., 2005). At the base of the succession are continental conglomerates and sandstones, followed by interbedded marine evaporites and carbonates, and ending with widespread open-marine warm-water carbonates including localized build-ups during the Late Carboniferous to Early Permian. During the middle Permian, the climate gradually became cooler and deposition of cool-water carbonates and marine shales, and then spiculites and cool-water carbonates, dominated the later parts of the Permian (e.g. Steel and Worsley, 1984; Larssen et al., 2005).
On Spitsbergen, the largest island in Svalbard, extension on north-south oriented faults resulted in a series of westwards tilted half-grabens (Figs 1, 2). The Gipsdalen Group syn-rift deposits of the Ebbadalen and Minkinfjellet Formations (Fig. 2) were deposited in the rapidly-subsiding Billefjorden and St. Johnsfjorden Troughs (Steel and Worsley, 1984). As tectonic activity ceased during the latest Carboniferous, the depositional area expanded and the overlying Wordiekammen and Gipshuken Formations (Fig. 2) are characterized by more widespread, stable platform carbonates with less thickness and facies variations.
The Carboniferous and Permian succession in central Spitsbergen has an accumulated thickness of approximately 2000 m in the troughs and 750 m on the highs (Braathen et al., 2011; Steel and Worsley, 1984; Dallmann et al., 1999). In central and eastern Spitsbergen, to the north and east of the Central Tertiary Basin, maximum burial occurred during the Early Cretaceous (Albian) with an overburden of
approximately 2000 m of Mesozoic sediments (Mørk and Worsley, 2006; Ogata et al., 2012; Marshal et al., 2015). In the West Spitsbergen fold-and-thrust belt, and in the Central Tertiary Basin, maximum burial occurred during the Oligocene, prior to the start of extension between Svalbard and Greenland (Nøttvedt et al., 1993). Approximately 2000 m of Paleogene sediments are preserved in the Central Tertiary Basin, and Marshall et al. (2015) estimated that an additional 1000 m of sediments were removed during Pliocene – Quaternary uplift of Svalbard. The present-day geothermal gradient is 33–40 °C/km in the Central Tertiary Basin (Braathen et al., 2012), and may have been up to 50 °C/km during maximum burial (e.g. Marshall et al., 2015).
MATERIALS AND METHODS
Sampling and sedimentological loggingSedimentological logging and sampling were carried out using standard techniques during winter and summer field work. Sample locations on Spitsbergen were chosen to ensure the best possible geographical and stratigraphic coverage of the Upper Palaeozoic succession, with a focus on the Billefjorden Trough and the Nordfjorden High in central Spitsbergen (Figs 1, 2).
Sampling focused on dark grey – black, fine-grained siliciclastics and carbonates. For thinner beds, the entire unit was sampled. Beds thicker than 50 cm were sampled at the top and bottom, and beds thicker than 1 m were sampled for every 50 cm, including the base and top. A total of 395 samples were analyzed using Rock-Eval pyrolysis for source rock screening, of which 110 samples were analyzed in more detail (Table 1).
Billefjorden Group (Lower Carboniferous)The majority of the analyzed samples from this stratigraphic interval (46 out of 65) were recovered
Table 1. Applied methods and number of samples analysed in the present study.
Group/Formation Rock-Eval pyrolysis
Extraction of organic material (EOM)
MS of aromatic and saturated fractions GC GC/MS PyGC
from the Hørbybreen and Mumien Formations in a ca. 260 m long section at Birger Johnsonfjellet (B, Fig. 1; logged section in Fig. 3). Additional samples from adjacent localities along Billefjorden were analyzed together with a single sample from Bjørnøya, 450 km to the south, to investigate regional variations.
Gipsdalen Group (mid-Carboniferous –Lower Permian)Material from the Bashkirian–Moscovian syn-rift succession was collected in sections in the Billefjorden
Trough (Figs 1, 2). Material from the marine Bashkirian Trikolorfjellet Member (Ebbadalen Formation) included 33 samples of laminated, organic-rich intervals within CaSO4-evaporites and thin organic-rich shales at the bases and tops of carbonate beds. This material was collected from two sections, each up to 200 m thick, in northernmost Billefjorden (E2 and E3, Fig. 1). At this locality, the Trikolorfjellet Member consists of interbedded 1–10 m thick marine carbonates and CaSO4-evaporites with rare intercalations of continental sabkha deposits (red siltstones with gypsum
100
300
HI500
Shal
eF.
sand
C. s
and
Cong
l.
40 m
70 m
60 m
50 m
100 m
90 m
80 m
130 m
120 m
110 m
0 m
160 m
150 m
140 m
190 m
180 m
170 m
220 m
210 m
200 m
240 m
230 m
250 m
260 m
Hør
byeb
reen
Fm
Mum
ien
Fm
Root
Sandstone
Shale
ZoophycosCrinoid fragment
Thalassinoides
Bioturbation index
Brachiopod fragment
Carbonate
Evaporite
PaleoaplysinaMicrocodium
Solitary coralFenestrate bryozoan
Chert nodule
Fusulinid
Brachiopod
BryozoanGastropod
Legend
TOC (wt. %)
4020 60
100
300
HI
500
TOC (wt. %)
4020 60
Fig. 3. Sedimentological log of the Hørbyebreen and Mumien Formations at Birger Johnsonfjellet showing stratigraphic distribution of screening data. Compiled using information from Gjelberg (1984). For location, see Fig. 1.
Nicolaisen.indd 63 03/12/2018 10:08:26
64 Upper Palaeozoic organic-rich units on Svalbard
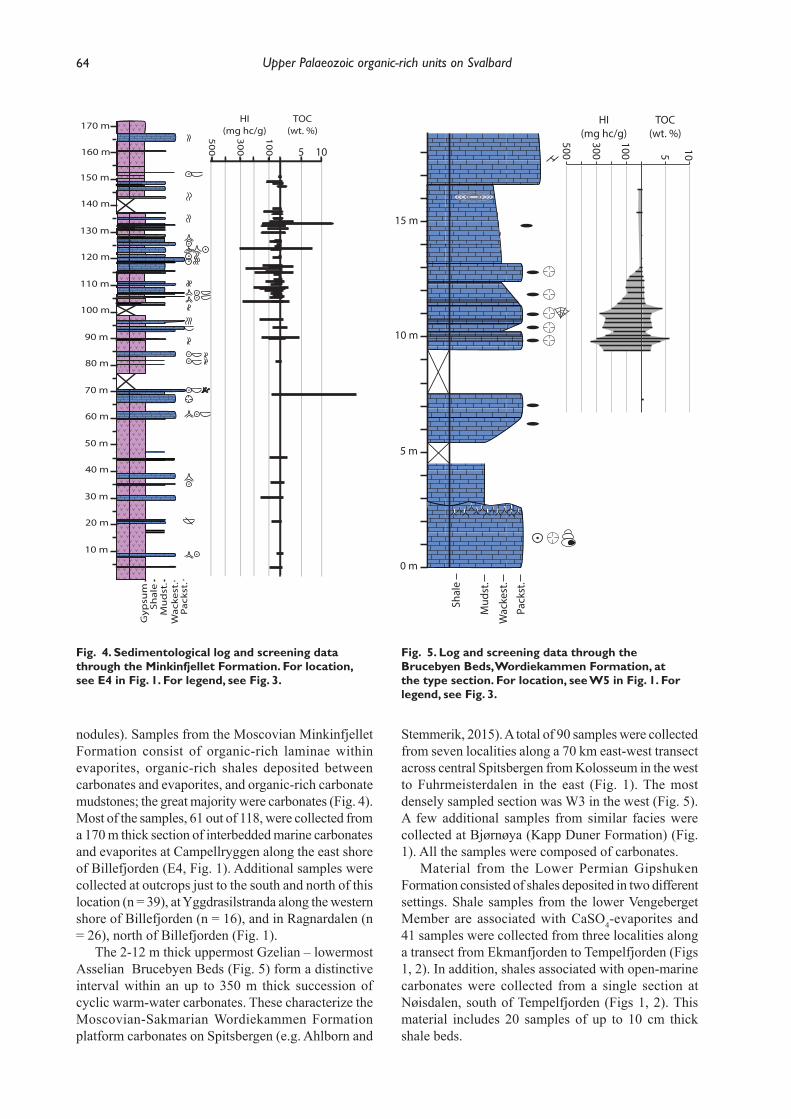
nodules). Samples from the Moscovian Minkinfjellet Formation consist of organic-rich laminae within evaporites, organic-rich shales deposited between carbonates and evaporites, and organic-rich carbonate mudstones; the great majority were carbonates (Fig. 4). Most of the samples, 61 out of 118, were collected from a 170 m thick section of interbedded marine carbonates and evaporites at Campellryggen along the east shore of Billefjorden (E4, Fig. 1). Additional samples were collected at outcrops just to the south and north of this location (n = 39), at Yggdrasilstranda along the western shore of Billefjorden (n = 16), and in Ragnardalen (n = 26), north of Billefjorden (Fig. 1).
The 2-12 m thick uppermost Gzelian – lowermost Asselian Brucebyen Beds (Fig. 5) form a distinctive interval within an up to 350 m thick succession of cyclic warm-water carbonates. These characterize the Moscovian-Sakmarian Wordiekammen Formation platform carbonates on Spitsbergen (e.g. Ahlborn and
Stemmerik, 2015). A total of 90 samples were collected from seven localities along a 70 km east-west transect across central Spitsbergen from Kolosseum in the west to Fuhrmeisterdalen in the east (Fig. 1). The most densely sampled section was W3 in the west (Fig. 5). A few additional samples from similar facies were collected at Bjørnøya (Kapp Duner Formation) (Fig. 1). All the samples were composed of carbonates.
Material from the Lower Permian Gipshuken Formation consisted of shales deposited in two different settings. Shale samples from the lower Vengeberget Member are associated with CaSO4-evaporites and 41 samples were collected from three localities along a transect from Ekmanfjorden to Tempelfjorden (Figs 1, 2). In addition, shales associated with open-marine carbonates were collected from a single section at Nøisdalen, south of Tempelfjorden (Figs 1, 2). This material includes 20 samples of up to 10 cm thick shale beds.
10 m
30 m
50 m
70 m
90 m
110 m
130 m
150 m
170 m
Wac
kest
.M
ud
st.
Pac
kst.
Shal
eG
ypsu
m
50
0 5 10
HI(mg hc/g)
TOC(wt. %)3
00
10
020 m
40 m
60 m
80 m
100 m
120 m
140 m
160 m
0 m
15 m
10 m
5 m
Mud
st.
Wac
kest
.
Pack
st.
Shal
e
HI(mg hc/g)
TOC(wt. %)500
300
100 5 10
Fig. 4. Sedimentological log and screening data through the Minkinfjellet Formation. For location, see E4 in Fig. 1. For legend, see Fig. 3.
Fig. 5. Log and screening data through the Brucebyen Beds, Wordiekammen Formation, at the type section. For location, see W5 in Fig. 1. For legend, see Fig. 3.
Nicolaisen.indd 64 03/12/2018 10:08:29
65J. B. Nicolaisen et al.
Tempelfjorden Group (Lower – Upper Permian)Twenty-five samples of dark marls from the lower part of the Kapp Starostin Formation were screened for organic content and HI. They show an average TOC content of 0.7% and HI of 67 mg HC/g TOC, indicating that the material has no source potential. The samples were not analyzed further.
Geochemical analysisGeochemical analyses were carried out at Applied Petroleum Technology (APT), Lillestrøm, Norway, in accordance with the guidelines described in Weiss et al. (2000). All samples were screened for their content of total organic matter (TOC) using a Leco SC-632 instrument, and analysed by Rock-Eval pyrolysis in order to determine the kerogen type, maturity and source potential. Samples for further analysis were chosen based on the screening results and analysed by gas chromatography (GC), gas chromatography-
mass spectrometry (GC-MS and GC-MS-MS), and for stable carbon isotope ratios of the saturated and aromatic hydrocarbon fractions. From each formation, a few samples with source potential were analyzed using pyrolysis gas chromatography (Py-GC) in order to evaluate their ability to generate petroleum. The gas-to-oil generation index (GOGI) was calculated as (C1–C5)/(C5–C36 ).
Samples for vitrinite reflectance were prepared and measured at the Geological Survey of Denmark and Greenland (GEUS) using standard procedures defined by ICCP and described in Bustin et al. (1989). Molybdenum concentrations were measured on selected samples of the Gipshuken Formation using an Innov X Alpha XRF analyser. The samples were powdered, filled in small glass vessels that were covered by plastic film and turned upside down, so that the XRF was measured trough the film. The results were evaluated for misleading results by visual comparison of the XRF spectrograms with the expected Kα and Kβ for molybdenum. Measurements lacking one of the peaks were discarded as false read-outs. Internal Innovex software was used to convert the peaks to concentrations, which were checked against a NIST-2781 standard measured every tenth sample. All standard measurements are within 3 ppm of the expected Mo concentration.
RESULTS
Billefjorden Group, Hørbybreen and Mumien Formations (Viséan)In the key section at Birger Johnsonfjellet (Fig. 3), the Hørbybreen Formation consists of a basal fluvial sandstone unit overlain by a 105 m thick heterolithic floodplain succession (c.f. Gjelberg and Steel, 1981) composed of lacustrine shales, fluvial sandstones and thin coal beds. Organic-rich shales dominate and have an accumulated thickness of approximately 70 m, whereas the coal beds have an accumulated thickness of less than 3 m. The overlying Mumien Formation consists of 50 m of stacked, fluvial channel sandstones overlain by a more than 40 m thick heterolithic interval dominated by organic-rich siltstones containing Botryococcus algae, interpreted to reflect deposition in shallow lacustrine environments (Abdullah et al., 1988).
In the analyzed material, TOC values range from 1 to 75 wt.% with most samples between 3 and 10 wt.%, and HI values range from 50 to 375 mg HC /g TOC (Fig. 7a). The most organic-rich facies occur in the middle part of the Hørbyebreen Formation (ca. 112–123 m) and the upper part of the Mumien Formation (ca. 215–260 m) (Fig. 3). Material from the Hørbyebreen Formation follows two different trend lines in a S2–TOC plot (Fig. 7b), with one population
60
HI(mg hc/g)500
TOC(wt. %)
4020
300
100
20 m
15 m
10 m
5 m
0 m
25 m
Mud
st.
Wac
kest
.
Pack
st.
Shal
e
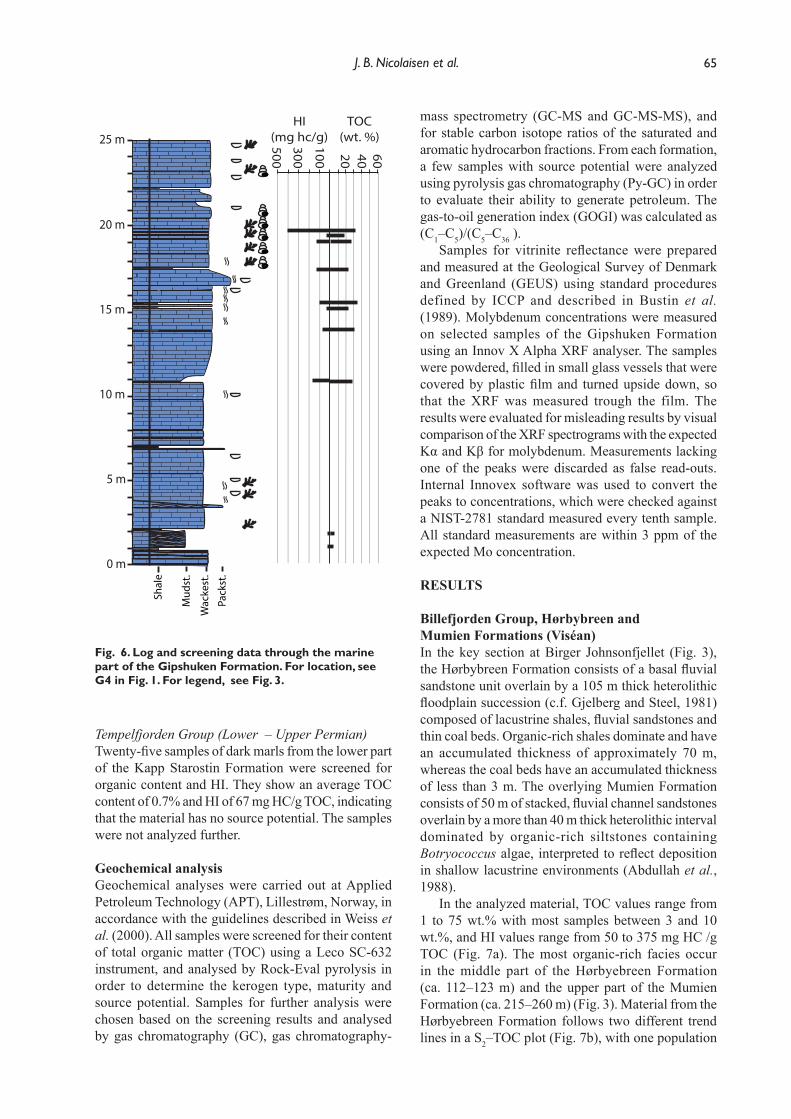
Fig. 6. Log and screening data through the marine part of the Gipshuken Formation. For location, see G4 in Fig. 1. For legend, see Fig. 3.
Nicolaisen.indd 65 03/12/2018 10:08:31
66 Upper Palaeozoic organic-rich units on Svalbard
0.1 1.0 10.0 100.0TOC (wt. %)
10
100
1000
HI (
mg/
gTO
C)
Excellent
GoodFair
Gas/Oil
Gas
0.1 1 10 100TOC (%)0.1
1
10
100
S2
(kg/
t)
HI (mg/g TOC)
500300100
PoorFair
Good
Very Good
Excellent
SampleAverage
0.01 0.1 1.0 10.0Ph/n-C18
0.01
0.1
1.0
10.0
Pr/n
-C17
Oxidising
Reducing
Terrestria
l organic m
atter
Mixed source
s
Marine organic m
atter
-32 -28 -24 -20δ13C Saturates (‰ VPDB)
-34
-30
-26
-22
-18
δ13 C
Aro
mat
ics
(‰ V
PDB
)
Non-marine
Marine
Type IIIType II
Type I
TOC (%)0.5 - 22 - 44 - 88 - 1616 - 4040 - 100
0 200 400 800HI (mg/gTOC)
400
420
440
460
480
500
520
T max
(°C
)
600
0 10 20 30 40Gammacerane index
-34
-30
-26
-22
-18
13C
Aro
mat
ic fr
actio
n (‰
VPD
B)
a b
c d
e f
g
0.6 0.7 0.8 0.9 1.0Vitrinite Reflectance (%Ro)
420
430
440
450
460
T max
(°C
)
TOC (%)3 100
h
Hørbyebreen FmMumien Fm
Birger JohnsonfjelletCarronelvaBjørnøya
0 1 2 3C27/C29 Steranes
0
1
2
3
4
5
6
Pr/P
h
Fig. 7. Geochemical cross-plots of samples from the Hørbyebreen and Mumien Formations. (A) Hydrogen index (HI) versus total organic carbon (TOC); note that all the samples are mature and that the initial quality of the samples would have been higher. (B) Cross-plot of S2 versus TOC for sampled potential source rocks in Svalbard; averages for each formation are illustrated by stars. (C) Cross-plot of pristane /(n-C17) versus phytane /(n-C18); note that samples from Birger Johnsonfjellet represent footwall locations, while the sediments at Carronelva and possibly Bjørnøya were deposited within tectonically-controlled depressions (Abdullah et al., 1988). (D) Cross-plot of d13C aromatic hydrocarbon fractions versus saturated hydrocarbon fraction in sample extracts. (E) Cross-plot of d13C of the aromatic fraction against the gammacerane index. (F) Cross-plot of C27/C29 steranes versus pristane /phytane ratio. (G) Cross-plot of HI versus Tmax showing that most samples are within the oil window. (H) Cross-plot of Tmax versus vitrinite reflectance (% Ro) of samples from Birger Johnsonfjellet and Carronelva.
Nicolaisen.indd 66 03/12/2018 10:08:32
67J. B. Nicolaisen et al.
along the HI line at 300 mg HC/g TOC and the other around the HI line at 100 mg HC/g TOC.
Most Billefjorden Group material shows a unimodal n-alkane distribution, dominated by long-chain n-alkanes (Fig. 8a); less commonly the n-alkane distribution is bimodal (Fig. 8b). The Pr/Ph ratio ranges from 0.8 to 5.5, with the highest values in samples from Birger Johnsonfjellet and lower values in samples from Carronelva (Fig. 7b), east of Birger Johnsonfjellet and Kobbebukta at Bjørnøya. C30 steranes are absent from the samples (Fig. 9). In cross-plots of pristane (Pr) versus phytane (Ph) and d13C of the aromatic versus saturated hydrocarbon fractions, the material falls mainly in the terrigenous regime (Figs 7c, 7d).
The analyzed material has been buried to conditions corresponding to the oil window, with Tmax values mainly between 430 °C and 450 °C (Fig. 7g) (cf. Peters and Cassa, 1994). Samples from Birger Johnsonfjellet at the Nordfjorden High show vitrinite reflectance
between 0.6 and 0.8% Ro and Tmax values between 430 °C and 440 °C, while samples from Carronelva in the Billefjorden Trough yielded higher vitrinite reflectance, 0.9% Ro, and Tmax of 450 °C (Fig. 7h).
Gipsdalen Group, Ebbadalen and Minkinfjellet Formations (Sepukhovian – Moscovian)The analyzed material consists of relatively thin, organic-rich shales and carbonates interbedded with much thicker, organic-lean carbonates and evaporites in both the Trikolorfjellet Member (Ebbadalen Formation) and Minkinfjellet Formation. The organic-rich laminae within the evaporites are 1–5 cm thick and occur throughout the succession, and constitute 1–5% of the evaporite beds. TOC values range between 0.5 and 1.5 wt.% and HI values are 40–275 mg HC/g TOC, with an average of 90 mg HC/g TOC (Fig. 10a). The laminated organic-rich shale facies are of similar thickness (1–5 cm) and occur in both the carbonate- and evaporite-dominated units. They constitute around 0.5% of the succession. TOC ranges from 0.5 to 60 wt.%, with most in the range 0.5–1.5 wt.%, and HI values are between 35 and 280 mg HC/g TOC with an average of 90 mg HC/g TOC (Fig. 10a). The shales plot around the HI line at 100 mg HC/g TOC (Fig. 10b).
Organic-rich carbonate facies are limited to those parts of the Minkinfjellet Formation with few evaporites and consist of mud- to wackestones interbedded with 0.5–1 m thick evaporites. The cumulative thickness of the organic-rich beds is approximately 8 m, or 3% of
4
6
8
10
12
14
16
18
10 min 20 30 40 50 60 70 80
n-C1
0
n-C1
5
n-C2
0
n-C2
5
PrPh
n-C3
0
40
120
200
280
360
440
520
10 min 20 30 40 50 60 70 80
n-C1
0
n-C1
5
n-C2
0
n-C2
5
PrPh
n-C3
0
n-C3
5
a
b
Fig. 8. (a) GC-FID chromatogram of a sample from the Mumien Formation at the Birger Johnsonfjellet site; note the bimodal n-alkane distribution, the odd predominance (CPI), and the waxy n-alkane distribution indicating a possible equally-mixed Type II/III source of organic matter. (b) GC-FID chromatogram of a sample from the Mumien Formation at the Carronelva location, with a unimodal front-end biased n-alkane distribution indicating input to the source rock system of a more uniform marine Type II/“III” source of organic matter.
Fig. 9. GC-MS ion chromatogram m/z = 191 and m/z = 217 fragmentogram of a representative sample of the Mumien Formation at Birger Johnsonfjellet.
50 min. 60 70 80 90 100 110
5.0e+6
1.0e+7
1.5e+7
2.0e+7
2.5e+7
3.0e+7
3.5e+7
4.0e+7
T20
T25 Ts
Tm
C30
Hop
ane
G
50 min. 60 70 80 90 100
1.0e+5
2.0e+5
3.0e+5
4.0e+5
5.0e+5
6.0e+5
7.0e+5
8.0e+5
9.0e+5
S R
m/z=191
C29 Sterane m/z=217
Tricyclic terpanes Homohopanes
Nicolaisen.indd 67 03/12/2018 10:08:37
68 Upper Palaeozoic organic-rich units on Svalbard
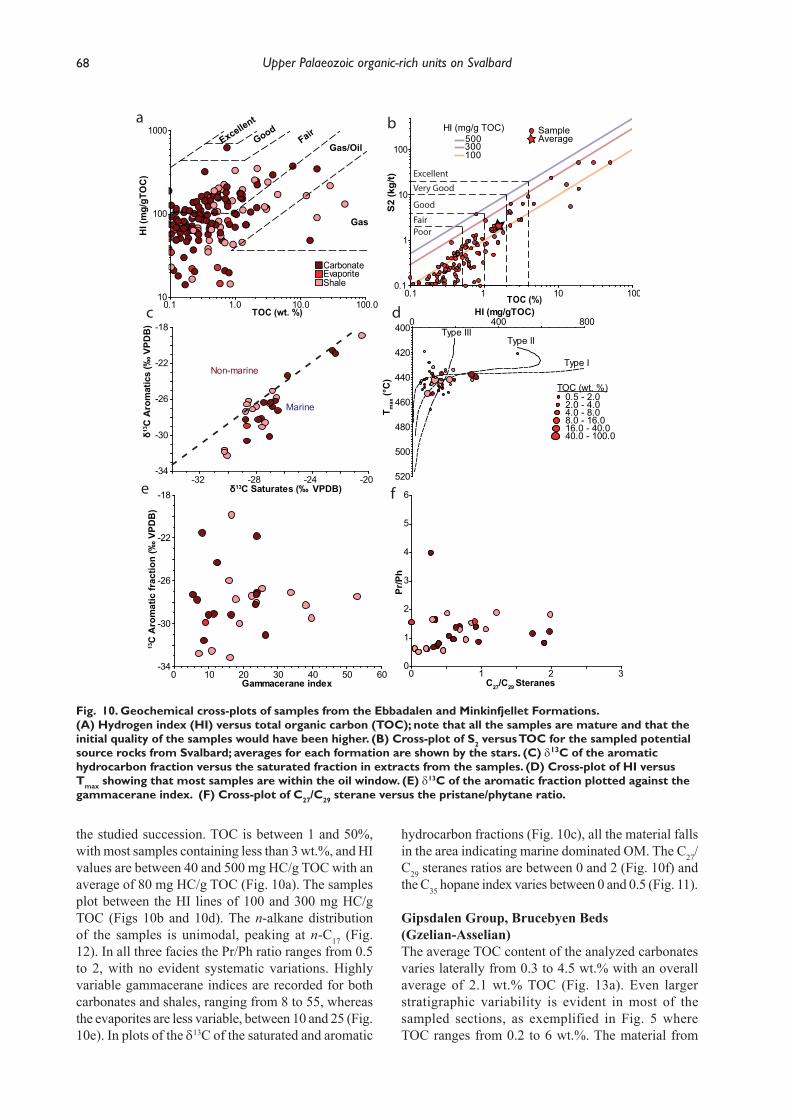
the studied succession. TOC is between 1 and 50%, with most samples containing less than 3 wt.%, and HI values are between 40 and 500 mg HC/g TOC with an average of 80 mg HC/g TOC (Fig. 10a). The samples plot between the HI lines of 100 and 300 mg HC/g TOC (Figs 10b and 10d). The n-alkane distribution of the samples is unimodal, peaking at n-C17 (Fig. 12). In all three facies the Pr/Ph ratio ranges from 0.5 to 2, with no evident systematic variations. Highly variable gammacerane indices are recorded for both carbonates and shales, ranging from 8 to 55, whereas the evaporites are less variable, between 10 and 25 (Fig. 10e). In plots of the d13C of the saturated and aromatic
hydrocarbon fractions (Fig. 10c), all the material falls in the area indicating marine dominated OM. The C27/C29 steranes ratios are between 0 and 2 (Fig. 10f) and the C35 hopane index varies between 0 and 0.5 (Fig. 11).
Gipsdalen Group, Brucebyen Beds (Gzelian-Asselian)The average TOC content of the analyzed carbonates varies laterally from 0.3 to 4.5 wt.% with an overall average of 2.1 wt.% TOC (Fig. 13a). Even larger stratigraphic variability is evident in most of the sampled sections, as exemplified in Fig. 5 where TOC ranges from 0.2 to 6 wt.%. The material from
Fig. 10. Geochemical cross-plots of samples from the Ebbadalen and Minkinfjellet Formations. (A) Hydrogen index (HI) versus total organic carbon (TOC); note that all the samples are mature and that the initial quality of the samples would have been higher. (B) Cross-plot of S2 versus TOC for the sampled potential source rocks from Svalbard; averages for each formation are shown by the stars. (C) d13C of the aromatic hydrocarbon fraction versus the saturated fraction in extracts from the samples. (D) Cross-plot of HI versus Tmax showing that most samples are within the oil window. (E) d13C of the aromatic fraction plotted against the gammacerane index. (F) Cross-plot of C27/C29 sterane versus the pristane/phytane ratio.
Nicolaisen.indd 68 03/12/2018 10:08:38
69J. B. Nicolaisen et al.
Spitsbergen has Tmax values between 430 and 460 °C, while the material from Bjørnøya has Tmax around 500 °C (Fig. 13d). On a cross-plot of S2 versus TOC, the analyzed samples plot in two populations: one around the 300 HI line, and the other around the 100 HI line. Overall, the population plotting around the HI line at 300 mg HC/g TOC contains >1 wt.% TOC, while the other population contains < 1 wt.% TOC. The average HI is 162 mg HC/g TOC, varying from 70 to 250 mg HC/g TOC (Fig. 13b).
In general, there is very little variability in the biomarker signatures. The Pr/Ph ratios are between 1 and 2, the δ13C values of the saturated fraction ranges from -28 to -31‰, with the δ13C values of the aromatic hydrocarbon fraction varying from -30 to -34‰, and the gammacerane index shows values from 6 to 12 (Figs 13c, 13e, 14). The C27/C29 sterane ratio varies between 0.2 and 1.5 (Fig. 13f) and the C35 hopane
index between 0.3 and 0.5 (Fig. 11). Most samples from Spitsbergen have C27/ C28 sterane ratios around 0.5, while the samples from Bjørnøya have ratios around 0.8 and 1.2 (Fig. 13f).
Gipsdalen Group, Gipshuken Formation (Sakmarian-Artinskian)Shales associated with evaporites contain 1–10 wt.% TOC with an average of 4.2 wt.%, and have HI values between 200 and 400 mg HC/g TOC (Figs 15a and 15b). In a cross-plot of S2 versus TOC, they plot between the HI lines of 100 and 300 mg HC/g TOC. The saturated hydrocarbon fraction of the samples ranges from δ13C -25 to -31‰, with that of the aromatic fraction showing values from -28 to -32‰ (Fig. 15c). The C27/C29 sterane ratios ranges from 0.1 to 0.9, the gammacerane index ranges from 8 and 32, and Pr/Ph ratio is around 1.5 (Figs 15d, 15f).
Hop(35/(34+35))0 0.2 0.4 0.6
Freq
uenc
y
0
10
0
10
0
10
0
10
0
10
Ebbadalen Fm and Minkinfjellet Fm
Gipshuken Fm
Hørbybreen Fm
Mumien Fm
Wordiekammen Fm
LowerUpper
ShaleEvaporiteCarbonate
AnoxicOxic Dysoxic
Fig. 11 (above). Abundance of C35 hopanes with indications of depositional environment (based on Peters and Moldowan, 1991). Note the wide range in the abundance of C35 hopanes in the Ebbadalen and Minkinfjellet Formations indicating deposition in a wide range of environments. See text for discussion.
FIg. 12 (right). GC-FID chromatogram and GC-MS ion chromatograms of the saturated fraction, m/z =191 and m/z = 217 fragmentograms of samples of the organic-rich marine carbonates of the Minkinfjellet Formation. Note “G” for gammacerane. See text for discussion.
10 min. 20 30 40 50 60 70
1.4e+5
2.8e+5
4.2e+5
5.6e+5
7.0e+5
n-C1
0
n-C1
5
PrPh
n-C2
0
n-C2
5
n-C3
0
m/z=191
50 min. 60 70 80 90 100 110
1.0e+6
2.0e+6
3.0e+6
4.0e+6
5.0e+6
6.0e+6
7.0e+6
T20
T25
TsTm
G
Tricyclic terpanes
Homohopanes
50 min. 60 70 80 90 100
2.0e+5
4.0e+5
6.0e+5
8.0e+5
1.0e+6
1.2e+6
1.4e+6
1.6e+6
1.8e+6
2.0e+6
SR
C30
Hop
ane
m/z=217C29 Sterane
Nicolaisen.indd 69 03/12/2018 10:08:40
70 Upper Palaeozoic organic-rich units on Svalbard
The shales associated with marine carbonates contain 1–90 wt.% TOC with an average of 10 wt.%, and HI is in the range from 100 to 350 mg HC/g TOC (Figs 15a and 15b). On a cross-plot of S2 versus TOC, they plot around the HI line at 300 mg HC/g TOC (Fig. 15c). The hydrocarbons are dominated by short-length n-alkanes, with a unimodal distribution peaking at n-C14 (Fig. 16). The saturated hydrocarbon fraction of the material ranges from -25 to -30‰ δ13C, and the aromatic hydrocarbon fraction from -28 to -32‰ (Fig. 15c). The C27/C29 sterane ratios vary between 0.2 and 1.25, the gammacerane index varies from 9 and 17, and Pr/Ph is around 1.5 (Figs 15d, 15f). Mo concentrations are high (17–165 ppm).
DISCUSSION
The present data-set provides a comprehensive characterization of Upper Palaeozoic organic-rich sediments in Svalbard and is summarized in Fig. 17. The analyzed material from Spitsbergen shows evidence of maturation corresponding to the oil window, with a normal distribution of Tmax values around 440 °C (Fig. 18). Thus all the analyzed organic-rich intervals have produced petroleum and accordingly have lower S1 and S2 values than samples from offshore regions. This is evident when comparing material from the Billefjorden Group from Svalbard with material of similar source type from the Barents Shelf (Fig. 19).
Fig. 13. Geochemical plots of samples from the Wordiekammen Formation. (A) Hydrogen index (HI) versus total organic carbon (TOC); note that all the samples are mature and that the initial quality of the samples would have been higher. (B) Cross-plot of S2 versus TOC for sampled potential source rocks in Svalbard; averages for each formation are shown by stars. (C) d13C of the aromatic versus the saturated fraction extracted from the samples. (D) HI versus Tmax showing that most samples are within the oil window. (E) d13C of the aromatic fraction plotted against the gammacerane index. (F) Cross-plot of C27/C29 sterane versus pristane / phytane ratio.
Nicolaisen.indd 70 03/12/2018 10:08:41
71J. B. Nicolaisen et al.
Billefjorden GroupThe combined sedimentological and geochemical data-set indicates that both lateral and stratigraphic variations in source potential and quality of the fluvio-lacustrine sediments in the Billefjorden Group are to be expected. The relatively high Pr/Ph ratios in the samples from Birger Johnsonfjellet indicate oxidizing conditions, at least locally and a more terrestrial input (c.f Peters et al., 2005) (Fig. 7c). The overall low gammacerane index indicates limited stratification within the water column (Fig. 7e). The low C27/C29 sterane ratio (Fig. 7f), the lack of C30 steranes (Fig. 9) and the low C35 hopane index (Fig. 11) are consistent with deposition in a mainly oxic fluvio-lacustrine environment.
The Hørbyebreen Formation shows larger variations of TOC and HI values than the overlying Mumien Formation in accordance with its suggested floodplain origin (Fig. 3; cf. Gjelberg and Steel, 1981). High TOC is recorded in coals deposited in peat swamps, and in lacustrine shales dominated by the colonial alga Botryococcus brauni which have higher HI values. This difference in depositional environment is reflected in the S2–HI cross-plot where the coaly facies follows the HI line at 100 mg HC/g TOC, and the lacustrine facies the HI line at 300 mg HC/g TOC (Fig. 7b); this most likely relates to facies-controlled differences in the ratio of lacustrine algal material relative to higher plant material. The HI values are highest in the Mumien Formation in accordance with suggested deposition in lacustrine-dominated environments (e.g. Abdullah et al., 1988). However, this shift in depositional environment is not detected in the biomarker data which suggests that the overall composition of the organic matter did not change over time (Fig. 7d).
The data-set indicates that lacustrine intervals in the Hørbybreen and Mumien Formations have the potential to produce both oil and gas. Pyrolysis-GC of organic material from the Birger Johnsonfjellet indicates an average present-day gas-to-oil ratio of 0.2, and suggest that both sedimentary successions are primarily gas/oil prone. The gas to oil prone nature of parts of the Lower Carboniferous shales and coals is supported by the composition of oil from a shallow onshore borehole in the inner part of Billefjorden drilled by Trust Articgul in 1992. Analyses from this borehole gave an n-alkane signature indicating sourcing from a terrigenous source rock like the Billefjorden Group (Verba, 2007). Carboniferous sediments with source rock potential have been described from offshore wells 7120/2-1, 7128/6-1 and 7281/4-1 (van Koeverden et al., 2010). In these wells, the organic material is of terrigenous origin and resembles the mixed humic and limnic material described from Birger Johnsonfjellet. It is therefore likely that organic-rich fluvio-lacustrine deposits are present over large areas of the SW Barents
Sea, providing a source for both oil and gas in areas where it is buried to sufficient depths. Eastwards, the Lower Carboniferous succession passes into marine sediments in the Russian part of the Barents Shelf with marine incursions reported to reach the easternmost Norwegian Finnmark Platform (7029/03-U-01) during the Visean (e.g. Bugge et al., 1995).
Thicker successions of Carboniferous lacustrine organic-rich shales have been described from localized lows along the down-dip margin of rotated fault blocks in the rift basins in east Greenland (Stemmerik et al., 1990; Christiansen et al., 1990). The presence of similar facies along fault blocks on the Barents Shelf may add to the Lower Carboniferous source potential.
Fig. 14. GC-FID chromatogram and GC-MS ion chromatograms m/z = 191 and m/z = 217 fragmentograms of samples of the Wordiekammen Formation.
10 min. 20 30 40 50 60 70
3.0
4.0
5.0
6.0
7.0
8.0
9.0
10.0
11.0
12.0
13.0
n-C
10
n-C
15
PrPh
n-C
20
n-C
25
n-C
30
50 min. 60 70 80 90 100 110
2.0e+5
4.0e+5
6.0e+5
8.0e+5
1.0e+6
1.2e+6
1.4e+6
1.6e+6
1.8e+6
2.0e+6
T20
T25
TsTm
C30
Hop
ane
G
50 min. 60 70 80 90 100
4.0e+4
8.0e+4
1.2e+5
1.6e+5
2.0e+5
2.4e+5
2.8e+5
3.2e+5
3.6e+5
m/z=191
Tricyclic terpanes Homohopanes
m/z=217SR
C29 Sterane
Nicolaisen.indd 71 03/12/2018 10:08:44
72 Upper Palaeozoic organic-rich units on Svalbard
However, no such deposits have been described from Svalbard, and their preservation potential is also a risk since the tops of the east Greenland successions are frequently eroded by coarse-grained alluvial and fluvial conglomerates and sandstones (Stemmerik et al., 1990).
Gipsdalen GroupThe fine-grained, organic-rich facies in the Gipsdalen Group were deposited in a range of marine shelf environments, reflecting shifts in both tectonic setting and climate over time.
The geochemical data-set derived from the evaporitic Trikolorfjellet and Minkinfjellet synrift succession indicates that all the analyzed samples are dominated by marine OM possibly with a slightly higher input of terrigenous organic material in the shales and overall better preservation of OM in the carbonate facies, as indicated by their different distributions relative to the HI trend lines. The mix of marine and terrigenous OM is also evident from the high variability in the C27/C29 steranes ratios and C35 hopane index (Figs 9 and 10f). The relatively high gammacerane index of some shales and carbonates
Fig. 15. Geochemical cross-plots of samples from the Gipshuken Formation. (A) Hydrogen index (HI) versus total organic carbon (TOC); note that all the samples are mature and that the initial quality of the samples would have been higher. (B) Cross-plot of S2 versus TOC for sampled potential source rocks in Svalbard; averages for each formation are shown by stars. (C) d13C of the aromatics versus the saturated fraction extracted from the samples. (D) HI versus Tmax showing that most samples are within the oil window. (E) d13C of the aromatic fraction plotted against the gammacerane index. (F) Cross-plot of C27/C29 sterane versus pristane / phytane ratio.
Nicolaisen.indd 72 03/12/2018 10:08:44
73J. B. Nicolaisen et al.
Lacustrine
MarineShallow
shelfRestricted
Litho-stratigraphy
Net sourcethickness (m)
TOC (wt. %)
Hydrogenindex
ContinentalFlood-plain
Gipsdalen
Tempel-
Hb
Mu
Eb
Mi
Wo
Gh
Ks
Carb
onife
rous
Perm
ian
Missis-sippian
Penn-sylvanian
Cisuralian
Guadalupian
Lopingian
1 10 102 5 10 15 100 300 50020 25 30
Fig. 16. GC-FID chromatogram and GC-MS m/z =191and m/z =217 fragmentograms, representative of the marine shales in the Gipshuken Formation at Nøisdalen (G4 in Fig. 1).
Fig. 17. Summary diagram for organic-rich deposits in Svalbard, with depositional environments, net source thicknesses, TOC ranges with average indicated, and Hydrogen Index with average indicated.
10 min. 20 30 40 50 60 70
5.0
10.0
15.0
20.0
25.0
30.0
35.0
40.0
45.0
50.0
55.0
60.0
n-C
10
n-C
15
Pr Ph
n-C
20
n-C
25
n-C
30
50 min. 60 70 80 90 100 110
1.0e+5
2.0e+5
3.0e+5
4.0e+5
5.0e+5
6.0e+5
7.0e+5
8.0e+5
9.0e+5
T20
T25
TsTm
C30
Hop
ane
G
50 min. 60 70 80 90 100
2.0e+4
4.0e+4
6.0e+4
8.0e+4
1.0e+5
1.2e+5
1.4e+5
1.6e+5
1.8e+5
SR
C29 Sterane
m/z=191
m/z=217
Tricyclic terpanes Homohopanes
Nicolaisen.indd 73 03/12/2018 10:08:47
74 Upper Palaeozoic organic-rich units on Svalbard
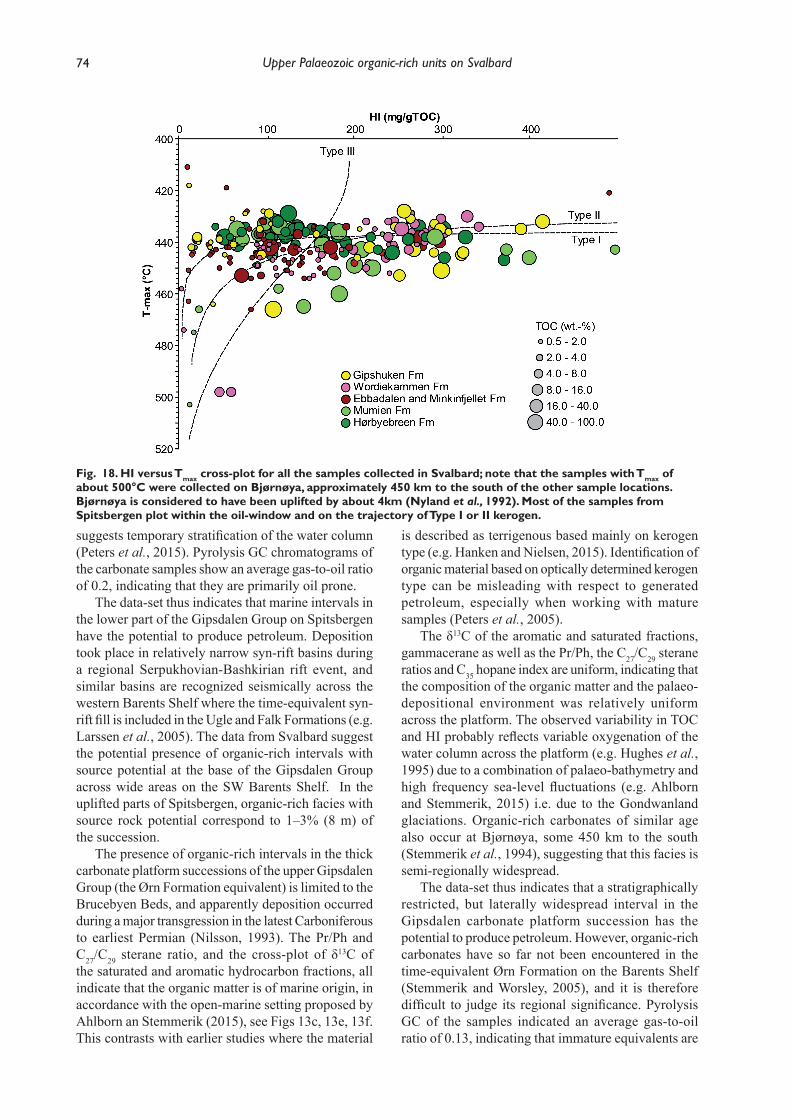
suggests temporary stratification of the water column (Peters et al., 2015). Pyrolysis GC chromatograms of the carbonate samples show an average gas-to-oil ratio of 0.2, indicating that they are primarily oil prone.
The data-set thus indicates that marine intervals in the lower part of the Gipsdalen Group on Spitsbergen have the potential to produce petroleum. Deposition took place in relatively narrow syn-rift basins during a regional Serpukhovian-Bashkirian rift event, and similar basins are recognized seismically across the western Barents Shelf where the time-equivalent syn-rift fill is included in the Ugle and Falk Formations (e.g. Larssen et al., 2005). The data from Svalbard suggest the potential presence of organic-rich intervals with source potential at the base of the Gipsdalen Group across wide areas on the SW Barents Shelf. In the uplifted parts of Spitsbergen, organic-rich facies with source rock potential correspond to 1–3% (8 m) of the succession.
The presence of organic-rich intervals in the thick carbonate platform successions of the upper Gipsdalen Group (the Ørn Formation equivalent) is limited to the Brucebyen Beds, and apparently deposition occurred during a major transgression in the latest Carboniferous to earliest Permian (Nilsson, 1993). The Pr/Ph and C27/C29 sterane ratio, and the cross-plot of δ13C of the saturated and aromatic hydrocarbon fractions, all indicate that the organic matter is of marine origin, in accordance with the open-marine setting proposed by Ahlborn an Stemmerik (2015), see Figs 13c, 13e, 13f. This contrasts with earlier studies where the material
is described as terrigenous based mainly on kerogen type (e.g. Hanken and Nielsen, 2015). Identification of organic material based on optically determined kerogen type can be misleading with respect to generated petroleum, especially when working with mature samples (Peters et al., 2005).
The δ13C of the aromatic and saturated fractions, gammacerane as well as the Pr/Ph, the C27/C29 sterane ratios and C35 hopane index are uniform, indicating that the composition of the organic matter and the palaeo-depositional environment was relatively uniform across the platform. The observed variability in TOC and HI probably reflects variable oxygenation of the water column across the platform (e.g. Hughes et al., 1995) due to a combination of palaeo-bathymetry and high frequency sea-level fluctuations (e.g. Ahlborn and Stemmerik, 2015) i.e. due to the Gondwanland glaciations. Organic-rich carbonates of similar age also occur at Bjørnøya, some 450 km to the south (Stemmerik et al., 1994), suggesting that this facies is semi-regionally widespread.
The data-set thus indicates that a stratigraphically restricted, but laterally widespread interval in the Gipsdalen carbonate platform succession has the potential to produce petroleum. However, organic-rich carbonates have so far not been encountered in the time-equivalent Ørn Formation on the Barents Shelf (Stemmerik and Worsley, 2005), and it is therefore difficult to judge its regional significance. Pyrolysis GC of the samples indicated an average gas-to-oil ratio of 0.13, indicating that immature equivalents are
Fig. 18. HI versus Tmax cross-plot for all the samples collected in Svalbard; note that the samples with Tmax of about 500°C were collected on Bjørnøya, approximately 450 km to the south of the other sample locations. Bjørnøya is considered to have been uplifted by about 4km (Nyland et al., 1992). Most of the samples from Spitsbergen plot within the oil-window and on the trajectory of Type I or II kerogen.
Nicolaisen.indd 74 03/12/2018 10:08:48
75J. B. Nicolaisen et al.
likely to be oil prone. It is noteworthy in this respect that Matapour and Karlsen (2017) and Matapour et al. (2018), studying bitumen and oil at the Alta discovery on the Loppa High, recorded a marine Palaeozoic age-specific biomarker petroleum signature, suggesting that at least some of the petroleum at Alta/Gohta is of a Palaeozoic origin.
The geochemical data-set from the lower evaporitic part of the Gipshuken Formation shows many similarities with the data-set obtained from the Trikolorfjellet-Minkinfjellet facies. This indicates that organic-rich shales dominated by marine OM were deposited in proximal evaporitic settings into the Early Permian, suggesting a potentially wider stratigraphic range for these evaporite-dominated organic-rich facies in the offshore areas, e.g. associated with the Fafner unit east of the Loppa High (Ahlborn et al., 2014).
The geochemical data-set derived from the shales associated with marine carbonates in the upper Gipshuken Formation, including the stable carbon isotopes, Pr/Ph and C27/C29 sterane ratios, indicate a marine origin of the OM in this part of the succession. This contrasts with the occasional presence of small woody fragments in the shales, indicating that part of the OM is of terrigenous origin; these woody fragments are possibly erosional products brought into the basin. The high Mo concentrations and the occasional preservation of lamination reflect deposition under anoxic conditions, and interbedding with bioturbated biogenic carbonate pack- and wackestones suggests rapidly fluctuating oxygen levels, possible in a setting close to the storm wave base (Tone Sorento Tågholt, pers. comm., 2018). Thus, anoxic conditions existed at least locally across the Barents Shelf carbonate
platform during the Early Permian, permitting thin organic-rich shales to be deposited. Pyrolysis GC results of the marine shale samples gave an average gas-to-oil ratio of 0.2, indicating that they are primarily oil-prone in the uplifted areas of Spitsbergen.
The organic-rich marine shales in the upper Gipshuken Formation have no reported offshore equivalents in the Bjarmeland Group and their importance is difficult to access. They document that organic material accumulated under anoxic conditions in cool-water, outer ramp settings, and it is possible that upwelling began to influence the shelf during Bjarmeland times.
Source-related biomarkersThe source rocks analyzed in this study represent a broad range of depositional environments and this is reflected in the biomarker signatures of the organic matter and the related oils. The different depositional environments in Svalbard can be distinguished using the gammacerane index, δ13C values of the aromatic fraction, and the C27/C29 sterane plus the Pr/Ph ratios (Table 2).
The Billefjorden Group is characterized by a combination of relatively heavy δ13C values, low gammacerane index and high Pr/Ph ratios. Hydrocarbon signatures from the Carboniferous Minkinfjellet and Ebbadalen Formations are difficult to distinguish from those of the Lower Permian Gipshuken Formation, which is not surprising since the organic-rich sediments were deposited in comparable, evaporitic-dominated environments. The Ebbadalen, Minkinfjellet and Gipshuken Formations, however, are easy to distinguish from the Billefjorden Group
0 20 40 60 80 100
TOC (wt. %)
0
50
100
150
200
250
300
350
S2 (k
g/t)
Barents SeaSvalbard
S1 (kg/t)
020
Fig. 19. Cross-plot of S2 against TOC for samples from the Billefjorden Group in Svalbard and from well 7128/6-1 and 7281/4-1 in the South Barents Sea. The dashed line indicates an HI value of 300 mg HC/g TOC.
Nicolaisen.indd 75 03/12/2018 10:08:49
76 Upper Palaeozoic organic-rich units on Svalbard
since the associated δ13C of the aromatic fraction is lighter, the gammacerane index higher, and the Pr/Ph ratio lower than in the Billefjorden Group (Table 2). The Brucebyen Beds can be distinguished from the Billefjorden Group based on the δ13C values of the aromatic hydrocarbon fractions.
CONCLUSIONS
Geochemical data from organic-rich shales and carbonates of Late Palaeozoic age outcropping in Svalbard suggests that:
(i) The fluvio-lacustrine intervals in the Mumien and Hørbyebreen Formations (Billefjorden Group) are active oil-generating source rocks in Spitsbergen. The organic material is mainly kerogen Type II, but there are indications that Type I kerogens occur in areas where lacustrine deposits are present. The TOC values range between 1 and 75 wt.%, and the organic-rich section has a cumulative thickness of more than 100 m. It can be distinguished from other Upper Palaeozoic source rocks in Svalbard by its high Pr/Ph ratios, heavy δ13C signatures and low gammacerane ratio.
(ii) The evaporitic Trikolorfjellet Member and the Minkinfjellet Formation in the lower part of the Gipsdalen Group have three potential source rock facies; shales, shales interbedded in evaporites, and organic-rich carbonates. The source rock potential is in Svalbard limited due to moderate TOC contents. The facies with the highest potential is the organic-rich carbonates with TOC up to 20 wt.%, which have a cumulative thickness of 8 m and which are confined to the deepest part of the onshore rift basins.
( i i i ) In the Ørn Format ion -equivalent Wordiekammen Formation, a widespread organic-rich unit, 2–10 m thick, contains 1–10 wt.% TOC, and pyrolysis-gas chromatography data suggest that it is oil prone. The semi-regional distribution of the Brucebyen Beds along the western margin of the Barents Shelf suggests that it is a potential source rock, at least in this part of the shelf.
(iv) The presence of organic-rich facies in the Gipshuken Formation extends the stratigraphic range of potential source rocks into sections equivalent to the offshore Bjarmeland Group, particularly the presence
of organic-rich marine shales with an average of 10 wt.% TOC and hydrogen index values of between 200 and 400 mg HC/g TOC. This facies attains very limited thicknesses onshore Svalbard, but may be thicker in more distal offshore settings. However, at present its stratigraphic and geographical ranges are unknown.
(v) The Kapp Starostin Formation (Tempelfjorden Group) has no documented source rock potential in Spitsbergen.
(vi) It is likely that petroleum in the Barents Shelf can potentially be tied to organic-rich facies at formation level based on the gammacerane index, the δ13C value of the aromatic fraction, and/or the Pr/Ph ratio.
(vii) Carboniferous strata, where present, are likely to contain an effective source rock on the Barents Shelf, especially in the eastern part where burial has not completely transformed the organic matter into (presumably) dry gas.
(viii) For the Permian succession, the potential to supply a working petroleum system is more uncertain since intervals of good to excellent source rock are thinner and less predictable. The organic-rich intervals in the Gipshuken Formation are probably the best candidates; also, primary migration may occur within the carbonate facies.
(ix) Offshore mapping, preferably with the assessment of source rock quality based on seismic attributes in combination with depositional models, will be a key to the further evaluation of the Palaeozoic petroleum systems on the Barents Shelf.
ACKNOWLEDGEMENTS
The authors thank Aker BP (former Det Norske); Alexander Hartwig (Aker BP) for valuable discussions; APT (Applied PetroleumTechnology AS) for the analyses;Tais W. Dahl for the introduction to trace element analysis and XRF supervision; Ingeborg Verstad, Ann-Christin Holme, Line Bruun Nicolaisen, Troels Frøhlke Nielsen, Aleksandra Smyrak-Sikora, Tone Sorento Tågholt; Erik P. Johannessen for indispensable help during fieldwork, data collection and preliminary discussions; and Dag Arild Karlsen for constructive review.
Table 2. Characteristic parameters for distinguishing the analyzed source rocks.
ABAY, T. B., KARLSEN, D. A., LERCH, B., OLAUSSEN, S., PEDERSEN, J. H. and BACKER-OWE, K., 2017. Migrated petroleum in outcropping Mesozoic sedimentary rocks in Spitsbergen: Organic geochemical characterization and implications for regional exploration. Journal of Petroleum Geology, 40, 5-36.
ABDULLAH, W. H., MURCHISON, D., JONES, J. M., TELNAES, N. and GJELBERG, J., 1988. Lower Carboniferous coal deposition environments on Svalbard, Svalbard. Organic Geochemistry, 13, 953-964.
AHLBORN, M., and STEMMERIK, L., 2015. Depositional evolution of the Upper Carboniferous – Lower Permian Wordiekammen carbonate platform , Nordfjorden High , central Svalbard, Arctic Norway. Norwegian Journal of Geology, 95, 91-126.
AHLBORN, M., STEMMERIK, L. and KALSTØ, T.K. 2014. 3D seismic analysis of karstified interbedded carbonates and evaporites, Lower Permian Gipsdalen Group, Loppa High, southwestern Barents Sea. Marine and Petroleum Geology, 56, 16-33.
BLOMEIER, D., DUSTIRA, A., FORKE, H. and SCHEIBNER, C., 2011. Environmental change in the Early Permian of NE Svalbard: From a warm-water carbonate platform (Gipshuken Formation) to a temperate, mixed siliciclastic-carbonate ramp (Kapp Starostin Formation). Facies, 57, 493-523.
BRAATHEN, A., BÆLUM, K., MAHER JR., H. and BUCKLEY, S. J., 2011. Influence of extensional fault growth and folding on sediment transport and depozone characteristics in an evaporite-dominated rift-basin system; the Carboniferous Billefjorden Trough, Svalbard. Norwegian Journal of Geology, 91, 137-160.
BRAATHEN, A., BAELUM, K., DAHL, T., ELVEBAKK, H., HANSEN, F., HANSSEN, T.H., JOCHMANN, M., JOHANSEN, T.A., JOHNSEN, H., LARSEN, L., MERTES, J., MØRK, A., MØRK, M. B., NEMEC, W.J., OLAUSSEN, S., RØED, K., TITLESTAD, G.O., TVERANGER, J. and OYE, V., 2012. Longyearbyen CO2 lab of Svalbard, Norway – first assessment of the sedimentary succession for CO2 storage. Norwegian Journal of Geology, 92, 353-376.
BUSTIN, R., CAMERON, A., GRIEVE, D. and KALKREUTH, W.D., 1989. Coal Petrology – Its principles, methods and applications. Geological Association of Canada, Short Course Notes, 273 pp.
CHRISTIANSEN, F. G., OLSEN, H., PIASECKI, S. and STEMMERIK, L., 1990. Organic geochemistry of Upper Palaeozoic lacustrine shales in the East Greenland basin. Organic Geochemistry, 16, 287-294.
DALLMANN, W., 1999. Lithostratigraphic Lexicon of Svalbard. Lørenskog, Norsk Polarinstitut, 320 pp.
GJELBERG, J. and STEEL, R. J., 1981. An outline of Lower-Middle Carboniferous sedimentation on Svalbard: Effects of tectonic, climatic and sea level changes in rift basin sequences. Geology of the North Atlantic Borderlands, 7, 543-561.
GJELBERG J., 1984. Early-Middle Carboniferous sedimentation on Svalbard. Unpublished Dr. scient. Thesis, Univ. of Bergen, Norway, 336 pp.
HUGHES, W. B., HOLBA, A. G. and DZOU, L. I., 1995. The ratios of dibenzothiophene to phenanthrene and pristane to phytane as indicators of depositional environment and lithology of petroleum source rocks. Geochimica et Cosmochimica Acta, 59, 3581-3598.
HÜNEKE, H., JOACHIMSKI, M., BUGGISCH, W. and LLITZNER, H., 2001. Marine Carbonate Facies in Response to Climate and Nutrient Level: The Upper Carboniferous and Permian of Central Svalbard (Svalbard). Facies, 45, 93-136.
JAFARIAN, E., KLEIPOOL, L. M., SCHEIBNER, C., BLOMEIER, D.
P. G. and REIJMER, J. J. G., 2017. Variations in petrophysical properties of Upper Palaeozoic mixed carbonate and noncarbonate deposits, Spitsbergen, Svalbard archipelago. Journal of Petroleum Geology, 40, 59-83.
van KOEVERDEN, J. H. and KARLSEN, D. A., 2011. Carboniferous non-marine source rocks from Svalbard and Bjørnøya: comparison with the Western Arctic. Journal of Petroleum Geology, 34, 53-66.
van KOEVERDEN, J. H., KARLSEN, D. A., SCHWARK, L. and CHPITSGLOUZ, A., 2010. Oil-prone Lower Carboniferous coals in the Norwegian Barents Sea: Implications for a Palaeozoic petroleum system. Journal of Petroleum Geology, 33, 155-181.
LARSSEN, G. B., ELVEBAKK, G., HENRIKSEN, L. B., NILSSON, I., SAMUELSBERG, T. J., STEMMERIK, L. and WORSLEY, D., 2005. Upper Palaeozoic lithostratigraphy of the Southern Norwegian Barents Sea. Geological Survey of Norway Bulletin, 444, 3-43.
MARSHALL, C., UGUNA, J., LARGE, D.J., MEREDITH, W., JOCHMANN, M., FRIIS, B., VANE, C., SPIRO, B.F., SNAPE, C.E. and ORHEIM, A., 2015. Geochemistry and petrology of Palaeocene coals from Spitzbergen Part 2: maturity variations and implications for local and regional burial models. International Journal of Coal Geology, 143, 1-10.
MATAPOUR, Z. and KARLSEN, D. A., 2017a. Ages of Norwegian oils and bitumen based on age-specific biomarkers. Petrol. Geosc., 24, 92-101.
MATAPOUR, Z. and KARLSEN, D. A., 2017b. Geochemical characteristics of the Skrugard oil discovery, Barents Sea, Arctic Norway: a “palaeo-biodegraded – gas reactivated” hydrocarbon accumulation. Journal of Petroleum Geology, 40 (2), 125-152.
MATAPOUR, Z., KARLSEN, D.A., LERCH, B. and BACKER-OWE, K., 2018. Petroleum occurrences in the carbonate lithologies of the Gohta and Alta discoveries in the Barents Sea, Arctic Norway. Petrol. Geosc., doi.org/10.1144/petgeo2017-085.
MØRK, A. and WORSLEY, D., 2006. Triassic of Svalbard and the Barents Shelf. In: Nakrem, H. A. & Mørk, A. (Eds.), Boreal Triassic. Longyearbyen, Svalbard, 16–19 August 2006. NGF Abstracts and Proceedings of the Geological Society of Norway 3, 149 pp.
NILSSON, I., 1993. Upper Palaeozoic Fusulinid stratigraphy of the Barents Shelf and surrounding areas. Unpublished Dr. scient. Thesis, Univ. of Tromsø, Norway, 538 pp.
NPD, Norwegian Petroleum Directorate, 2018. Petroleum resources on the Norwegian continental shelf 2018 - Exploration. Electronic document available from: http://www.npd.no/en/Publications/Resource-Reports/2018/ (accessed on September 4, 2018).
NYLAND, B., JENSEN, L.N., SKAGEN, J., SKARPNES, O., VORREN, T.O., 1992. Tertiary Uplift and Erosion in the Barents Sea: Magnitude, Timing and Consequences. In: Larsen, R.M. Brekke, H. Larsen, B.T. Talleraas, E. (Eds.), Structural and Tectonic Modelling and its Application to Petroleum Geology. Norwegian Petroleum Society Special Publications, 2, 153-162
NØTTVEDT, A., LIVBJERG, F., MIDBØE, P. S. S. and RASMUSSEN, E., 1993. Hydrocarbon potential of the Central Svalbard Basin. Norwegian Petroleum Society Special Publications, 2, 333-361.
OGATA, K., SENGER, K., BRAATHEN, A., TVERANGER, J. and OLAUSSEN, S., 2012. The importance of natural fractures in a tight reservoir for potential CO2 storage: a case study of the upper Triassic-middle Jurassic Kapp Toscana Group (Svalbard, Arctic Norway): Geological Society, London, Special Publications, 374, 395-415.
PETERS, K. E. and CASSA, M. R., 1994. Applied Source Rock Geochemistry. In: L. B. Magoon, and W. G. Dow (Eds), The petroleum system - from source to trap. AAPG Memoir,
Nicolaisen.indd 77 03/12/2018 10:08:49
78 Upper Palaeozoic organic-rich units on Svalbard
60, 93-120.PETERS, K.E. and MOLDOWAN, J.M., 1991. Effects of Source,
Thermal Maturity, and Biodegradation on the Distribution and Isomerization of Homohopanes in Petroleum. Organic Geochemistry, 17, 47-51.
PETERS, K. E., C. WALTERS and MOLDOWAN, J.M., 2005. The Biomarker Guide. Cambridge, Cambridge University Press, 704 pp.
STEEL, R. J. and WORSLEY, D., 1984. Svalbard’s post-Caledonian strata - an atlas of sedimentational patterns and palaeogeographic evolution. In: A. M. Spencer, (Ed.), Petroleum Geology of the North European Margin: London, Graham & Trotman, 109-135.
STEMMERIK, L., LARSON, P. A., LARSSEN, G. B., MØRK, A. and SIMONSEN, B. T., 1994. Depositional evolution of lower Permian Palaeoaplysina build-ups, Kapp Duner formation, Bjørnøya, Arctic Norway. Sedimentary Geology, 92, 161-174,.
STEMMERIK, L., CHRISTIANSEN, F. G. and PIASECKI, S., 1990. Carboniferous lacustrine shale in East Greenland: additional source rock in the northern North Atlantic? In: B.J. Katz (Ed.), Lacustrine basin exploration: case studies and modern analogs. AAPG Memoir, 50, 277-286.
STEMMERIK, L., 2000. Late Palaeozoic evolution of the North Atlantic margin of Pangea. Palaeogeography, Palaeoclimatology, Palaeoecology, 161, 95-126.
STEMMERIK, L. and WORSLEY, D., 2005. 30 years on – Arctic Upper Palaeozoic stratigraphy, depositional evolution and hydrocarbon prospectivity. Norwegian Journal of Geology, 85, 151-168.
VERBA, M. L., 2007. Natural hydrocarbon manifestations in the sedimentary cover of Svalbard. Petroleum Geology - Theoretical and Applied Studies, 2, 1-22.
WEISS, H.M., WILHELMS, A., MILLS, N., SCOTCHMER, J., HALL, P.B., LIND, K. and BREKKE, T., 2000. NIGOGA - The Norwegian Industry Guide to Organic Geochemical Analyses. Edition 4.0 Published by Norsk Hydro, Statoil, Geolab Nor, SINTEF Petroleum Research and the Norwegian Petroleum Directorate. 102 pp. Electronic document available from www.npd.no/engelsk/nigoga/default.htm (accessed on January 15, 2018)