International Journal of Geosciences, 2014, 5, 93-106 Published Online January 2014 (http://www.scirp.org/journal/ijg) http://dx.doi.org/10.4236/ijg.2014.51011
Static Reservoir Modeling Using Well Log and 3-D Seismic Data in a KN Field, Offshore Niger Delta, Nigeria
Lukumon Adeoti1, Njoku Onyekachi1, Olawale Olatinsu2, Julius Fatoba3, Musa Bello1 1Department of Geosciences, University of Lagos, Lagos, Nigeria
2Department of Physics, University of Lagos, Lagos, Nigeria 3Department of Earth Science, Olabisi Onabanjo University, Ago-Iwoye, Nigeria
ABSTRACT This study focuses on the application of 3D static model using 3-D seismic and well log data for proper optimiza-tion and development of hydrocarbon potential in KN field of Niger Delta Province. 3D Seismic data were used to generate the input interpreted horizon grids and fault polygons. The horizon which cut across the six wells was used for the analysis and detailed petrophysical analysis was carried out. Structural and property modeling (net to gross, porosity, permeability, water saturation and facies) were distributed stochastically within the con-structed 3D grid using Sequential Gaussian Simulation and Sequential Indicator Simulation algorithms. The reservoir structural model show system of different oriented growth faults F1 to F6. Faults 1 and Fault 4 are the major growth faults, dipping towards south-west and are quite extensive. A rollover anticline formed as a result of deformation of the sediments deposited on the downthrown block of fault F1. The other faults (2, 3, 5 and 6) are minor fault (synthetic and antithetic). The trapping mechanism is a fault assisted anticlinal closure. Results from well log analysis and petrophysical models classified sand 9 reservoir as a moderate to good reservoir in terms of facies, with good porosity, permeability, moderate net to gross and low water saturation. The volume-tric calculation of modeled sand 9 horizon reveals that the (STOIIP) value at the Downthrown and Ramp seg-ment are 15.7 MMbbl and 3.8 MMbbl respectively. This implies that the mapped horizon indicates hydrocarbon accumulation in economic quantity. This study has also demonstrated the effectiveness of 3-D static modeling technique as a tool for better understanding of spatial distribution of discrete and continuous reservoir proper-ties, hence, has provided a framework for future prediction of reservoir performance and production behavior of sand 9 reservoir. However, more horizontal wells should be drilled to enhance optimization of the reservoir. KEYWORDS Porosity; Permeability; Water Saturation; Volumetric Calculation; Facies
1. Introduction The increasing demand for petroleum products has posed a change to the search of oil and gas. This search for hy-drocarbon has developed increase with advances in greater computational technology to evaluate the proba-bility of hydrocarbon proneness of the basin thereby li-miting the risk factor associated with hydrocarbon. Gov-ernment revenue of most oil producing countries in the world depends on these products. In Nigeria, Niger Delta province has commercial accumulation of oil and gas.
The production of oil and gas is from the accumulation in the pore spaces of reservoir rock usually sandstone, li-mestone or dolomite. In Niger Delta, petroleum produc-tion is produced in sandstone and unconsolidated sand of Agbada formation. This formation is characterized by alternating sandstones and shale with rock units varying in thickness from 100 ft to 15000 ft [1]. The sand in this formation is mainly hydrocarbon reservoir with shale providing lateral and vertical seals [2]. The Niger Delta is situated in the Gulf of Guinea between the longitude 5˚E - 8˚E and Latitude 3˚N - 6˚N. The Niger Delta lo-
cated chiefly onshore and offshore of Nigeria, covers approximately 105,000 km square.
As Oil and gas deposits are found in the porous forma-tions in sedimentary basins, under normal conditions, the reservoir occurs at locations where the appropriate por-ous formation is at a higher elevation than the surround-ing region. The task of the interpreter is to locate such occurrences. The means of doing this is the proper inter-pretation of seismic data recorded for region of interest. As with any physical procedure of this nature, it becomes highly desirable to simulate the data collection process and to gain insight by the examination of known situa-tions [3]. Realistic 3D geological models are then re-quired as input to reservoir simulation programs which predict the movement of rocks under various hydrocar-bon scenarios. An actual reservoir can only be developed and produced once and mistakes can be tragic and wasteful. It is essential to model the reservoir as accu-rately as possible in order to calculate the reserves and to determine the most effective way of recovering as much of the petroleum economically as possible [4-7], hence, allows for 3D visualization of the subsurface, which en-hances understanding of reservoir heterogeneities and helps to improve recovery rates, as low recovery rates stem from inefficient sweep caused by poor knowledge of inter well-scale heterogeneities [8].
The advances in computational technology, modern reservoir models can accommodate increasingly detailed 3D data that illustrate the spatial distribution of reservoir properties. Subsurface reservoir characterization typical-ly incorporates well data augmented with seismic data to establish the geological model of the reservoir [8]. [9] worked on 3D integrated static modeling using geostatis-tical methods in Asmari reservoir, Marun oil field, Iran. In this study, he predicted future reservoir performance and production history. [10] worked on detailed facies definition and 3D static model: Reservoir management of the Eocene producing units in Block X of the Talara Ba-sin in Northwest Peru. Here, he constructed a reliable stratigraphic framework in the identification of specific association stratigraphic or depositional surfaces, defin-ing genetic units. Zones of potential reservoir connectiv-ity were built.
Applying a reservoir modeling tool effectively is af-fected by the integrity of the data used and an under-standing of the reservoir with the lithology of its host rock. The KN field in the Niger Delta had previously been difficult to describe owing to its problem of poor data quality as a result of the 2D seismic data that was used in the interpretation process, hence when wells were drilled in the field the reservoir was missed. The study was carried out to overcome this problem by incorporat-ing 3D seismic data interpretation and well data to de-velop 3D static model that would make the data more reliable.
2. Geology of the Study Area Niger Delta is a prolific hydrocarbon belt in the world. The formation of Niger Delta basin was initiated in the early Tertiary time. The Niger Delta is situated in the Gulf of Guinea and extends throughout the Niger Delta province. From the Eocene to the present, the Delta has prograded Southwest ward, forming depobelts that represent the most active portion of the Delta at each stage of its development [11].
Deposition of the three formations occurred in each of the five off lapping siliciclastic sedimentation cycles that comprise the Niger Delta. These cycles (depobelts) are 30 - 60 kilometers wide, prograde southwestward 250 kilometers over oceanic coast into the gulf of guinea, and are defined by synsedimentary faulting that occurred in response to variable rates of subsidence and sediment supply [11]. The interplay of subsidence and supply rates resulted in deposition of discrete depobelts when further crustal subsidence of the basin could no longer be ac-commodated, the focus of sediment deposition shifted seaward, forming a new depobelt. Each depobelt is a separate unit that corresponds to a break in regional dip of the delta and is bounded landward by growth faults and seaward by large counter-regional faults or the growth fault of the next seaward belt [11]. Five major depobelts are generally recognized, each with its own sedimentation, deformation and petroleum history (Figure 1).
The sedimentary wedge of the Niger Delta contains a major submarine part [13] which forms part of the com-plex continental margin intruding into the Gulf of Guinea. In the Niger delta province, the Tertiary Niger delta (Akata-Agbada) petroleum system has been identified. The Delta formed at the site of a rift triple junction re-lated to the opening of the Southern Atlantic starting in the late Jurassic from interbedded marine shale of the lowermost Agbada formation and continuing into the cretaceous. The Delta proper began developing in the Eocene, accumulating sediments that now are over 10km thick. The primary source rock is the upper Akata forma-tion, the marine-shale facies of the Delta, with possibly contribution from interbedded marine shale of the lo-wermost Agbada formation. Oil is produced from sand-stone facies within the Agbada Formation, however, tur-bidite sand in the upper Akata Formation is a potential target in deep water offshore and possibly beneath cur-rently producing intervals onshore.
The study area falls within the western margin of off-shore depobelt of Niger Delta (Figure 2). The fault pat-tern is NW- SE and the traps involved in this field are mainly structural in nature. The study area (KN field) is within the parasequence set of Agbada formation. Hence, the local geology of the area is similar to that of the Nig-er Delta. The Niger Delta area is situated in the Gulf of Guinea between longitudes 5˚ and 8˚E and latitude 3˚ and 6˚N [14].
OPEN ACCESS IJG
L. ADEOTI ET AL. 95
Figure 1. Map of Niger Delta showing the depobelts [12].
Figure 2. Location map of the study area [15].
3. Materials and Methods 3.1. Data Acquisition The data used for this research were obtained from an oil company in Nigeria.
The data provided include 3D seismic data and well log data. Six wells were drilled on KN-field and are la-belled KN-1, 2,3,4,5 and 6. Figure 3 shows the base map of the KN Field.
3.2. Data Processing and Interpretation 3.2.1. Petrophysical Interpretation and Evaluation Necessary environmental correction that aimed at re-
moving the effect of variable hole size and acquisition conditions (such as mud weight, salinity, etc.) was per-formed. Normalization was carried out at scaling the log response for various wells to a reference well (KN 4), to provide a homogeneous dataset and attenuate bias from different vintages and toolset.
A detailed petrophysical evaluation was conducted for the KN wells namely KN 3, 4, 5 and 6. The GeoGraphix software was used to carry out the petrophysical evalua-tion. The interpretation of the logs in general was per-formed using a deterministic approach and generated output curves for shale volume, net to gross, effective porosity, effective water saturation and permeability.
Paleo-front DeltaOnshore and OffshoreMain structural limits
Compressive front/belt
Mobile shale
100 km0
KN FIELD
OPEN ACCESS IJG
L. ADEOTI ET AL. 96
Figure 3. Base map of KN field.
These logs were correlated by picking shale markers to
delineate between reservoir rocks and non reservoir rocks using GR and resistivity logs. Shale volume was deter-mined from gamma ray log, Steiber and neutron - density was used for shale volume correction.
The porosity was estimated using the available poros-ity logs (Density and Neutron). The effective porosity was calculated from the total porosity corrected for shale fraction.
The apparent water resistivity was determined from calculated Rw log of a clean water bearing formation. This gave a good match with picket plot.
Permeability curve was determined using Timur model that put also effective porosity into consideration. Hence, reservoir pay summation using water saturation cut-off of 0.6; effective porosity of 0.1 - 0.4 and a vol-ume shale cut-off of 0.3 was used to constrain pay summation. Tables 1 and 2 proposed by [16] were used as guides for the classification of porosity and permeabil-ity respectively. Water saturation was estimated using Indonesia model because of the presence of shale and was determined using the formula [17] below:
Hydrocarbon saturation (Sh), movable oil saturation (MOS), Residual hydrocarbon saturation (Shr), Hydro-carbon movability index (HMI) and Water saturation of flushed zone (Sxo) [18] were evaluated as follow:
Table 1. Qualitative evaluation of porosity [16].
Percentage Porosity (%) Qualitative Evaluation
0 - 5 Negligible
5 - 10 Poor
15 - 20 Good
20 - 25 Very good
Over 30 Excellent
Table 2. Qualitative evaluation of permeability [16].
Average k-value (MD) Quantitative Description
<10.5 Poor to fair
15 - 50 Moderate
50 - 250 Good
250 - 1000 Very good
>1000 Excellent
1h wS S= − (3.1)
xo wMOS S S= − (3.2) 1 5
xo wS S= (3.3)
1hr xoS S= − (3.4)
w
xo
SHMI
S= (3.5)
3.2.2. Seismic Analysis 1) Fault Picking and Well Tie to Seismic The identification of prominent features such as major
and minor faults was carried out on the seismic sections (Figure 4). Well tie to Seismic was done using KN 4 well data and checkshot survey from KN1 to generate synthetic seismograms, hence, tying the seismic to wells Figure 5. Hence, the Top of the Sand 9 was expected to be a seismic +/− zero crossing on SEG normal polarity
OPEN ACCESS IJG
L. ADEOTI ET AL. 97
Figure 4. Picking of faults.
Figure 5. Seismic to well tie using synthetic seismogram on logs.
section. Synthetic match with seismic was quite good in KN 4. Picking of Sand 9 Top hydrocarbon sand was found to be difficult because it fell on a thin line zero crossing on seismic. Hence mapping was done on the continuous negative polarity (trough) beneath the zero crossing and bulk shifted.
2) Mapping of Seismic Horizon The mapping of the horizon was based on synthetic
process. The key seismic reflections which corresponded to top of main reservoir sands were identified on seismic data for mapping (Figure 6). The sedimentary section can be subdivided into three distinct intervals based on general seismic reflection character, regional studies and the uniformly blocky, low-value gamma-ray patterns,
some low to high amplitude, parallel and discontinuous reflection pattern, was observed [11,12,19-21], Upper Agbada section with thick shale on the sandy sequence and lower Agbada formation characterized by thick shale, parallel and high amplitude followed by sand shale in-tercalation. Although, a chaotic and low amplitude re-flections interpreted as the Akata formation was also observed.
3) Time-Depth Conversion The checkshot data was utilized for Sand 9 reservoir in
KN field. This interval represented the deepest hydro-carbon potential as established from KN wells. The sin-gle average time-depth function (Figure 7) was used.
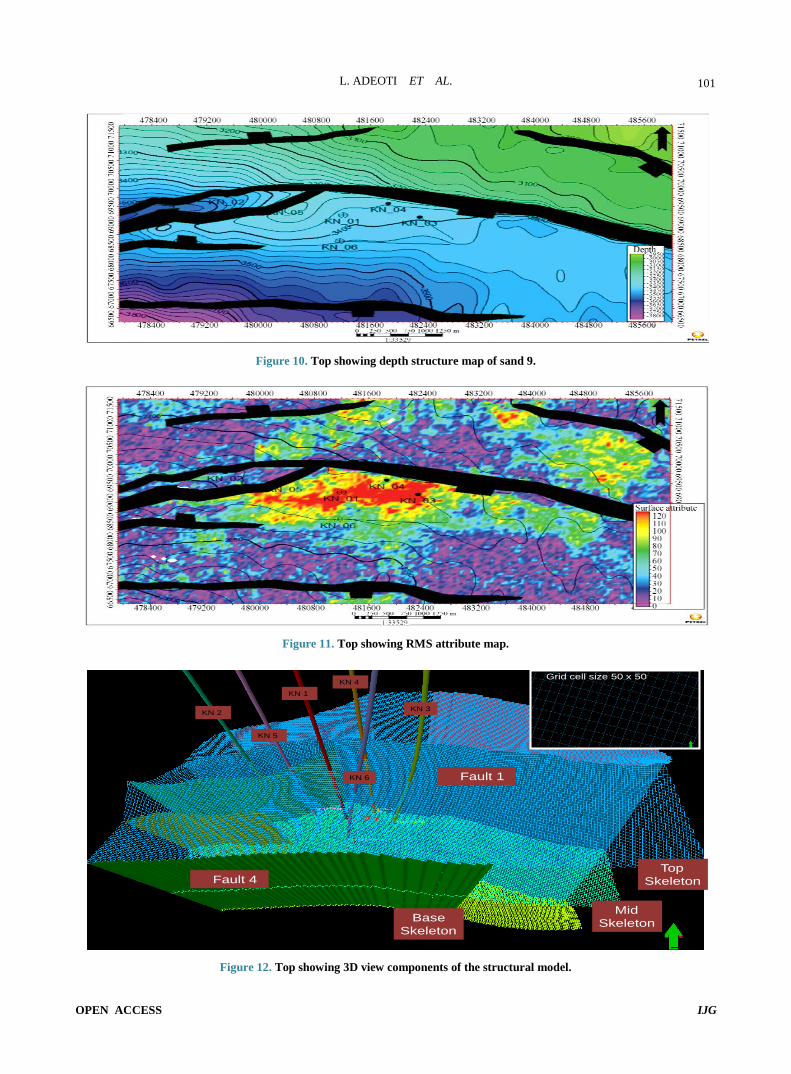
4) Seismic Attribute
OPEN ACCESS IJG
L. ADEOTI ET AL. 98
RMS amplitude was generated for sand 9 in order to extract information on reservoir characteristics, area ex-tent and influence of hydrocarbon fluids on seismic re-sponse.
3.2.3. Static Geological Model In view of the necessity of dynamic simulation process and to arrive at a final well and production behaviour, it was necessary to build a static model that represented as closely as possible the subsurface reality of the Sand 9 that have been encountered by most wells.The static geological model of Sand 9 for the entire KN Field in Lower Agbada formation was built by integrating rele-
vant sub-surface data and interpretation presented in the preceding sections. The 3D seismic structural interpreta-tion, lithological descriptions and facies interpretation, porosity, permeability and initial water saturation from log analyses were used to build the static model. The PETREL (Version 2009.1) suite was used in building the static model. The structural model and property model (net to gross, porosity, permeability, water saturation and facies) were used for the static modeling of Sand 9 which are briefly described as follows:
1) Structural Model of Sand 9 The structural model was based on the depth-con-
verted 3D seismic interpretation. The input data consist
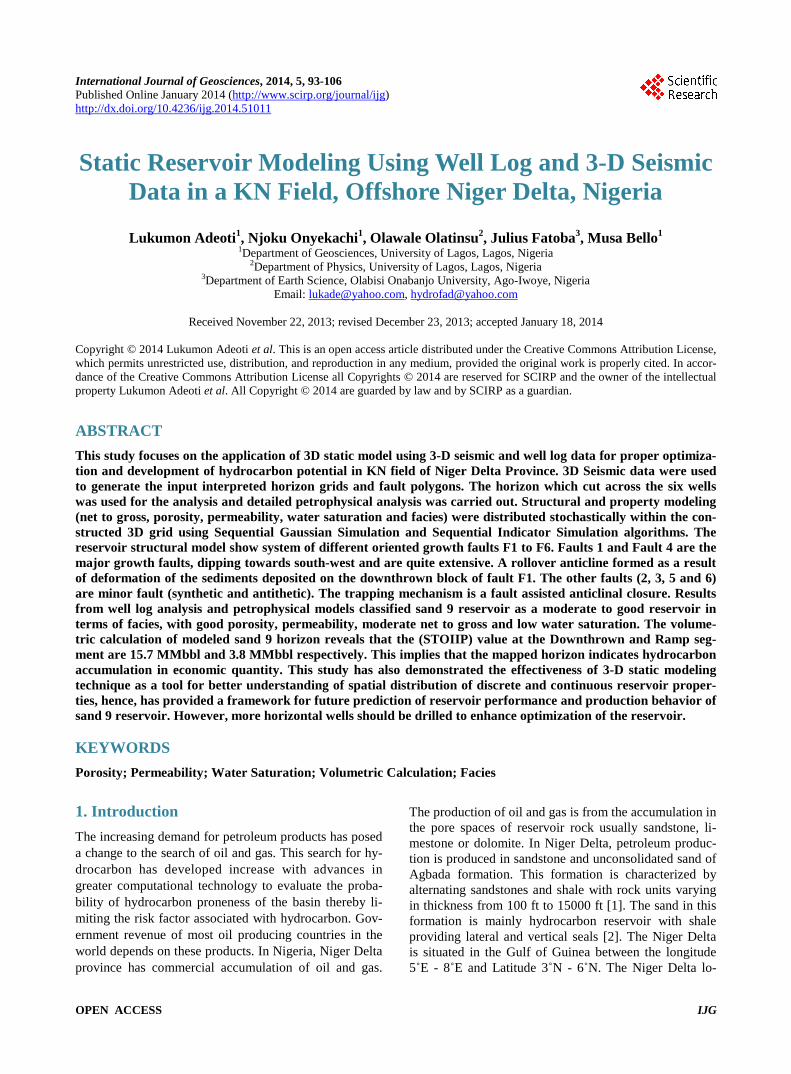
Figure 6. Top showing sand 9 horizon.
Figure 7. Time-depth function.
OPEN ACCESS IJG
L. ADEOTI ET AL. 99
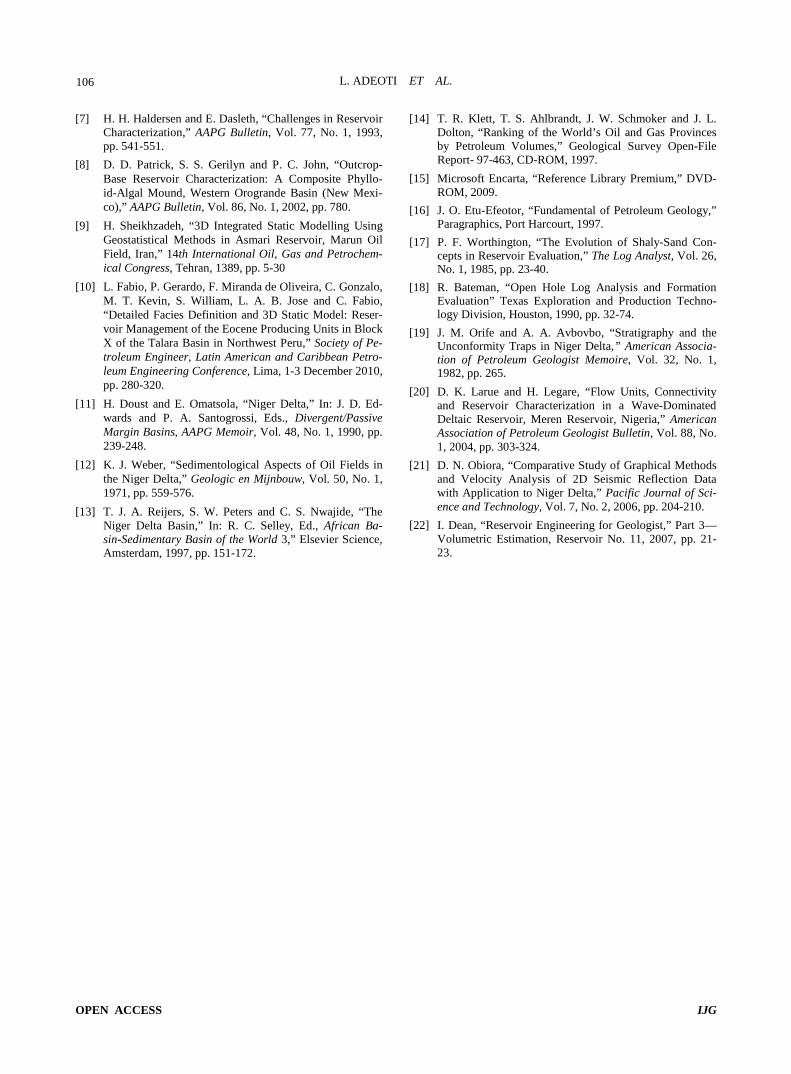
of the following: Sand 9 Top Depth surfaces, polygons and fault surfaces of interpreted faults. Fault modelling was the first step for building structural models with Pet-rel workflow tools. The process was used to create struc-turally and geometrically corrected fault representations within horizon. Pillar gridding is a way of storing XYZ locations to describe a surface which was used to gener-ate a 3-D framework. A 3-D grid divided the space up into cells within which it assumes materials were essen-tially the same. The proportional layering was aimed at capturing equal layer thickness from top of the reservoir to the base. The reservoir modelled as one major li- thostratigraphic unit. Thus the structural model was de-fined by one zone. The faults were modelled mainly from the input fault surfaces based on interpretation. The areal dimension of the grid cells was optimized at 50 × 50 m, considering the reservoir description in Sand 9 prospect. The grid was oriented parallel to the main northern boundary fault. The 3D static model contained 260,040 cells.
2) Net to Gross Model of Sand 9 The petrophysical evaluation generated a net to gross
log curve from interpretation, which was upscaled. The distribution of net to gross values was done stochastically using Sequential Gaussian Simulation (SGS) with the net to gross value of the reservoir calculated.
3) Porosity Model of Sand 9 The porosity model was based on the porosity logs
generated from petrophysical interpretation of well KN- 3, 4, 5, and 6. The logs were upscaled to the layering scheme using the facies as a controlling bias that ensured that the porosity was appropriate for the facies property of the cell. The porosity was distributed in the model using “Sequential Gaussian Simulation” (SGS) that was conditioned to the facies model and to the wells. A total porosity cut-off of 7% was applied to the model, consis-tent with the cut-offs estimated from petrophysical analysis for the reservoir facies. Multiple realizations were run on the porosity model conditioned the data to the respective facies.
4) Permeability Model of Sand 9 The permeability model was based on the permeability
logs generated. This effective in-situ permeability was distributed in the static model using Sequential Gaussian Simulation conditioned to the facies of the modelled zone. A permeability cut-off of 50 mD was applied to the model, consistent with the log observation. Multiple re-alizations were run on the permeability model condi-tioned to the respective facies and respective porosity as a secondary variable.
5) Water Saturation Model of Sand 9 In absence of core data, a deterministic average water
saturation that was derived from petrophysical interpreta-
tion was used in the model. Water saturation value of 26% was used. The model captured the in-put parameters from the petrophysical analysis.
6) Facies Model of Sand 9 Sequential Indicator Simulation (SIS) technique was
used for this Model. In Sand 9 model, no apparent trends have been used as the system net-to-gross (NTG) is low and presumably deposited in marine environment. It was considered reasonable to use stochastic method for the modeling. The method allows easy modeling of facies environments where the facies volume proportions vary vertically, laterally, or both. Facies associations have been coded at the wells based on the available log data (primarily GR) in wells.
The petrophysical non-reservoir facies was determined with GR > 75 API Units. The reservoir facies was further divided into good and moderate reservoir facies based on GR distribution. During the facies modeling process, the facies realizations were conditioned to the wells and multiple realizations were run in the facies modeling to capture the inherent heterogeneity if any.
3.2.4. Reservoir Volumetric Reservoir volumetric is the process by which the quantity of hydrocarbon in a reservoir is estimated. This is very important because it acts as a guide for field exploration and development. After a static model of a field was done, the structural model and the petrophysical model built were used to calculate the reserves [22] in terms of stock tank of original oil in place (STOOIP) of the Sand 9 under study were estimated using Equation (3.6).
( ) ( )0
7758 11 wSTOIIP STB A h SB
ϕ× −× × × ×= (3.6)
A = Area in acres, h = Net Pay Thickness in feet, ϕ = porosity, Sw = Water Saturation, B0 = Formation Vo-lume Factor, 7758 = Acre-feet conversion for oil.
4. Results and Discussion 4.1. Results Correlation of six well logs in KN field is displayed in Figure 8. The summary of the pay is shown in Table 3. Figure 9 indicates the Top of sand 9 time structure map. The display of the Top of sand 9 depth structure map is shown in Figure 10. The RMS attribute map is presented in Figure 11. Figure 12 reflects the 3D component of the structural model of Sand 9. The NTG (Net to Gross) model is displayed in Figure 13. The porosity model is presented in Figure 14. The permeability model is dis-played in Figure 15. The water saturation model is shown in Figure 16. Figure 17 shows the facies model. Volu-metric obtained after modelling is showed in Table 4.
OPEN ACCESS IJG
L. ADEOTI ET AL. 100
Figure 8. Six well logs showing structural correlation of KN field.
Figure 9. Top showing time structure map of Sand 9.
4.2.1. Petrophysical Analysis Figure 8 shows correlation of six well logs reflecting nine reservoirs with horizon 2 cutting across them. Sand 9 reservoir in KN field was picked between depth of 3385.55 m - 3414.97 m (TVDSS) in Well 1, Well 2 3486.41 m - 3454.55 m (TVDSS), Well 3 3430.9 m - 3398.38 m (TVDSS), Well 4 3414.37 m - 3376.56 m (TVDSS), Well 5 3345.82 m - 3375.04 m (TVDSS),
Well 6 3418.97 m - 3454.61 m (TVDSS). All these re-servoirs were correlated across all the wells to see their lateral continuity which gives a good description of the reservoir.
Well 03 is at a total depth of 3500 m (TVDSS) with a Kelly Bushing (KB) of 45 ft. The base of Benin forma-tion is at 2290 m. Resistivity of water (Rw) in this well was determined by considering low gamma response with low resistivity value. Rw is 0.13 Ωm which was de-termined at the depth interval 3482 m - 3495 m (TVDSS)
OPEN ACCESS IJG
L. ADEOTI ET AL. 104
with the true resistivity (Rt) of 1.5 Ωm. The total depth of this Well 03 is 3685 m (TVDSS). Well 04 is at 3487 m (TVDSS) with a Kelly Bushing (KB) of 42 ft. The base of Benin formation is at 2230 m. Resistivity of water, (Rw) is 0.08 Ωm which was determined at depth interval 3422 m - 3426 m (TVDSS) with true resistivity (Rt) of 1.0 Ωm. The total depth of Well 05 is 3566 m (TVDSS) with a Kelly Bushing (KB) of 45ft. The base of benin formation is at 2240 m. Resistivity of water, (Rw) is 0.15 at depth interval 3419 m - 3424 m (TVDSS) with true resistivity of (Rt) of 1.8 Ωm. Well 06 is at total depth of 4057 m (TVDSS) with a Kelly Bushing (KB) of 34 ft. The base of Benin formation is at 2280 m. Resistivity of water, (Rw) is 0.12 Ωm. at depth interval 3470 m - 3460 m with a true resistivity (Rt) of 1.6 Ωm. Oil/water contact (OWC) was observed at Well 03 and 01 at depth −3410 m, and −3459 m in Well 02 due to fault compartmentali-zation, Well 04 and 05 encountered an Oil-down-to (ODT) at −3415 m. Well 06 is more or less a water pool.
Therefore, porosity values 16% - 19% in the four wells as shown in Table 3 fall within good porosity (Table 1). These values indicate that the reservoir rocks in the wells have enough pore space to accommodate fluids. The permeability values (43 - 76.8 mD) in the four wells as shown in Table 3 fall within high to very high permeability.
Generally, water saturation values in the four wells vary from 27% - 32% while Hydrocarbon saturation val-ues range from 68% - 73%. This shows that the percen-tage of hydrocarbon that occupies the pore spaces is more than the percentage of formation water, hence, the prospective accumulation of hydrocarbon in the reservoir rocks.
The values of hydrocarbon movability index (Sw/Sxo) ranging from 0.35 - 0.4 are less than 0.7 in the four wells (Table 3) which indicates that hydrocarbon in the four wells will move. High movable oil saturation (0.48 - 0.5) and low residual hydrocarbon (0.2 - 0.23) suggest that higher percentage of the total hydrocarbon accumulated in the reservoir will move. Petrophysical results of the study show that the predominant fluid type in the three wells is oil. Sand 9 has an “Oil Down To” (ODT) in both wells 04 and well 05. Three reservoir sands (sand 5, 7 and 9) were delineated , but sand 9 was more promising because it was characterized by good cap rock facies, good to very good porosity values (29% - 32%), low wa-ter saturation (68% - 73%), acceptable limit of resistivity of formation water, high hydrocarbon saturation (Sh) (0.68% - 0.73%), good net pay (12 m - 30 m), low resi-dual hydrocarbon saturation (Shr), high movable hydro-carbon saturation (MOS) and favourable values of mov-able hydrocarbon index (Sw/Sxo < 0.7). Sand 9 has the highest potential due to its high net-pay of about 30 m and hydrocarbon saturation of about 78%.
4.2.2. Seismic Analysis The time and depth structure contour maps show system of different oriented growth faults F1 to F6 (Figures 9 and 10). The fault F1 lies centrally within the mapped area and extends up to 86% of the entire breath of the mapped area. A rollover anticline formed as a result of deformation of the sediments deposited on the down-thrown block of fault F1. The fault F4 is also extensive and shows sub-parallel relationship with the fault F1. This sub-parallel relationship is sustained in all the structural contour maps. The fault F1 can be interpreted as the active fault, while the F4 is inactive fault, but must have been active in the past and located in offshore di-rection of F1. The other faults are (2, 3, 5 and 6) both synthetic and antithetic faults are minor faults. The syn-thetic faults are syndepositional faults while the antithetic faults were formed as a result of tectonics after deposi-tional has stopped. It can be deduced from this study that the wells were located to target the rollover anticline formed on the downthrown side of the fault F1 which indicates structural closure in these areas.
4.2.3. Static Modeling 1) Structural Model of Sand 9 Figure 12 indicates the system of different oriented
growth faults F1 to F6. Faults 1 and Fault 4 are the major growth faults, dipping towards south-west and are quite extensive. The other faults are (2, 3, 5 and 6) which are indicative of synthetic and antithetic faults are catego-rised as minor faults. This model further buttresses the information gathered from the depth structure map.
2) Net to Gross map in Sand 9 Figure 13 reveals good net to gross which falls be-
tween 0.8 and 1 within the well area (3, 4, 5 and 6) of the KN field while the region farther away from the well location is indicative of low net to gross which oscillates between 0 and 0.1.
3) Porosity Map in Sand 9 A 3D perspective view of the porosity model is shown
in Figure 14. The map shows the prominence of good porosity distribution (0.15 - 0.20) within well area (3, 4, 5 and 6) of the KN field. This indicates the pore spaces have enough space to accommodate fluid while the re-gion farther away from the well location in the northern part and some parts in the south-west direction indicate porosity range from 0% - 2.5% which indicate poor po-rosity (Table 1).
4) Permeability Map in Sand 9 Figure 15 shows a 3D perspective view of the per-
meability model. The map underscores good permeabili-ty values which range from 50 mD to 100 mD (Table 2) within the well area (3, 4, 5 and 6) of KN field. The val-ues are reflective of good interconnectivity of pore spac-es of the sand within the well area and their ability to
OPEN ACCESS IJG
L. ADEOTI ET AL. 105
transmit fluids. In contrary, the region farther away from the well location in the northern part and some parts in the south-west direction indicate poor to fair permeability which ranges from 1 mD to 5 mD.
5) Water Saturation Map in Sand 9 Figure 16 shows a 3D perspective view of the water
saturation. The map reveals that water saturation distri-bution within the well area (3, 4, 5 and 6) of the KN field varies from 0.3 to 0.4. This is indicative of more hydro-carbon zone region. The region farther away from the well location has water saturation more than 0.75. The result shows abundant of water than hydrocarbon.
6) Facies Map in Sand 9 A 3D perspective view of the facies model is shown in
Figure 17. The map shows facies within the well area (3, 4, 5 and 6) of KN field indicate moderate to good reser-voir (sand) while the regions farther away from the well location along the north and south west directions reveal shale (poor reservoir). The Sand 9 reservoir shows clear abundance of shales deposited in a trangressive marine environment with minor influence of tides in marine condition. Poor facies are more than the good facies in the reservoir rocks which is an indication of shaliness in Sand 9. The regional depositional direction assumed is NW-SE direction.
4.2.4. Reservoir Volumetric Table 4 reveals volumetric after modeling. This shows that the downthrown segment has bulk volume, pore vo-lume, net volume, HCPV Oil and STOIIP values of 9.40 × 10⁷ m3 STB, 5.80 × 10⁷ m3 STB, 0.45 × 10⁷ m3 STB, 0.3 × 10⁷ m3 STB and 1.50 × 10⁷ m3 STB while the Ramp segment has bulk volume of 1.80 × 10⁷ m3 STB, net volume of 1.30 × 10⁷ m3 STB, pore volume of 0.11 × 10⁷ m3 STB, HCPV Oil of 0.73 × 10⁶ m3 STB and STOIIP of 3.81 × 10⁶ m3 STB. The sand 9 reservoir shows that the downthrown and ramp segment indicate hydrocarbon of commercial value thus, the Sand 9 static model could be as input for simulation and performance.
5. Conclusions This research work shows the versatility of integrating 3D seismic reflection and well log data for reservoir modeling. The results of the comprehensive petrophysi-cal analysis of the six wells show one dominant reservoir across the well 01 and 06 in the entire field at different depth intervals. This sand 9 reservoir is very promising because of its good to very good porosity values, low water saturation, high hydrocarbon saturation (Sh), high movable oil saturation (MOS), low residual hydrocarbon saturation (Shr), low values of hydrocarbon movability index (Sw/Sxo < 0.7), good permeability and moderate net to gross. Also, the mapped sand 9 horizon indicates hy-drocarbon accumulation in economic quantity. The ac-
cumulation and trapping of hydrocarbon in this field is as a result of the rollover structures due to faulting. The trapping mechanism is a fault assisted closure.
The discrete properties gave the knowledge of the fa-cies properties in the field while the continuous proper-ties gave the petrophysical properties of the field in terms of porosity, permeability, net to gross and water satura-tion. The facies analysis indicates that both good and moderate sand quality are found in the sand 9 reservoir which support the properties from petrophysics in terms of porosity, net to gross and permeability. The volume-tric calculation indicates that the downthrown segment of the reservoir has a STOIIP of 15.73 MMbbl of oil and the Ramp segment has a STOIIP of 3.81 MMbbl. This analysis will serve as a control of the reservoir during development.
The 3-D Static Modeling of the KN field has provided a better understanding of the spatial distribution of the discrete and continuous properties in the field. The study has also created a geological model for KN field that can be updated as new data acquired for field development. The model could be transferred to reservoir engineer for proper characterization during simulation. However, more horizontal wells should be drilled to enhance opti-mization of the reservoir.
Acknowledgements The authors wish to thank the Department of Petroleum Resources for authorizing one of the oil companies to release the data for this research.
REFERENCES [1] K. C. Short and A. J. Stauble, “Outline of Geology of
Niger Delta,” American Association of Petroleum Geolo- gists Bulletin, Vol. 51, No. 1, 1967, pp. 761-779.
[2] O. S. Adegoke, “High Resolution Biostratigraphy, Se- quence Stratigraphy and 3-D Modeling Indispensable Tools for E & P Activities in the New Millennium,” Ni- gerian Association of Petroleum Explorationist Bulletin, Vol. 16, No. 1, 2000, pp. 46-65.
[3] K. J. Weber and E. M. Daukoru, “Petroleum Geology of the Niger Delta,” Proceedings of the Ninth World Petro- leum Congress, Geology, Vol. 2, No. 1, 1975, pp. 210- 221.
[4] F. J. Lucia and G. E. Fogg, “Geologic/Stochastic Map- ping of Heterogeneity in a Carbonate Reservoir,” Journal of Petroleum Technology, Vol. 42, No. 1, 1990, pp. 1298- 1303.
[5] I. W. Lake, H. B. Carrol and T. C. Wesson, “Reservoir Characterization,” Academic Press, San Diego, 1991.
[6] P. F. Worthington, “Reservoir Characterization at the Me- soscopic Scale,” In: I. W. Lake, H. B. Carrol and T. C. Wesson, Eds., Reservoir characterization, Academic Press, Waltham, 1991, pp. 123-165.
OPEN ACCESS IJG
L. ADEOTI ET AL. 106
[7] H. H. Haldersen and E. Dasleth, “Challenges in Reservoir Characterization,” AAPG Bulletin, Vol. 77, No. 1, 1993, pp. 541-551.
[8] D. D. Patrick, S. S. Gerilyn and P. C. John, “Outcrop- Base Reservoir Characterization: A Composite Phyllo- id-Algal Mound, Western Orogrande Basin (New Mexi- co),” AAPG Bulletin, Vol. 86, No. 1, 2002, pp. 780.
[9] H. Sheikhzadeh, “3D Integrated Static Modelling Using Geostatistical Methods in Asmari Reservoir, Marun Oil Field, Iran,” 14th International Oil, Gas and Petrochem- ical Congress, Tehran, 1389, pp. 5-30
[10] L. Fabio, P. Gerardo, F. Miranda de Oliveira, C. Gonzalo, M. T. Kevin, S. William, L. A. B. Jose and C. Fabio, “Detailed Facies Definition and 3D Static Model: Reser-voir Management of the Eocene Producing Units in Block X of the Talara Basin in Northwest Peru,” Society of Pe-troleum Engineer, Latin American and Caribbean Petro-leum Engineering Conference, Lima, 1-3 December 2010, pp. 280-320.
[11] H. Doust and E. Omatsola, “Niger Delta,” In: J. D. Ed- wards and P. A. Santogrossi, Eds., Divergent/Passive Margin Basins, AAPG Memoir, Vol. 48, No. 1, 1990, pp. 239-248.
[12] K. J. Weber, “Sedimentological Aspects of Oil Fields in the Niger Delta,” Geologic en Mijnbouw, Vol. 50, No. 1, 1971, pp. 559-576.
[13] T. J. A. Reijers, S. W. Peters and C. S. Nwajide, “The Niger Delta Basin,” In: R. C. Selley, Ed., African Ba- sin-Sedimentary Basin of the World 3,” Elsevier Science, Amsterdam, 1997, pp. 151-172.
[14] T. R. Klett, T. S. Ahlbrandt, J. W. Schmoker and J. L. Dolton, “Ranking of the World’s Oil and Gas Provinces by Petroleum Volumes,” Geological Survey Open-File Report- 97-463, CD-ROM, 1997.
[15] Microsoft Encarta, “Reference Library Premium,” DVD- ROM, 2009.
[16] J. O. Etu-Efeotor, “Fundamental of Petroleum Geology,” Paragraphics, Port Harcourt, 1997.
[17] P. F. Worthington, “The Evolution of Shaly-Sand Con- cepts in Reservoir Evaluation,” The Log Analyst, Vol. 26, No. 1, 1985, pp. 23-40.
[18] R. Bateman, “Open Hole Log Analysis and Formation Evaluation” Texas Exploration and Production Techno- logy Division, Houston, 1990, pp. 32-74.
[19] J. M. Orife and A. A. Avbovbo, “Stratigraphy and the Unconformity Traps in Niger Delta,” American Associa- tion of Petroleum Geologist Memoire, Vol. 32, No. 1, 1982, pp. 265.
[20] D. K. Larue and H. Legare, “Flow Units, Connectivity and Reservoir Characterization in a Wave-Dominated Deltaic Reservoir, Meren Reservoir, Nigeria,” American Association of Petroleum Geologist Bulletin, Vol. 88, No. 1, 2004, pp. 303-324.
[21] D. N. Obiora, “Comparative Study of Graphical Methods and Velocity Analysis of 2D Seismic Reflection Data with Application to Niger Delta,” Pacific Journal of Sci- ence and Technology, Vol. 7, No. 2, 2006, pp. 204-210.
[22] I. Dean, “Reservoir Engineering for Geologist,” Part 3— Volumetric Estimation, Reservoir No. 11, 2007, pp. 21- 23.