The column is the only device in the high-performance liquid chromatogra-phy (HPLC) system which actually separates an injected mixture. Columnpacking materials are the “media” producing the separation, and properties ofthis media are of primary importance for successful separations.
Several thousands of different columns are commercially available, andwhen selecting a column for a particular separation the chromatographershould be able to decide whether a packed, capillary, or monolithic column isneeded and what the desired characteristics of the base material, bondedphase, and bonding density of selected column is needed. Commercial columnsof the same general type (e.g., C18) could differ widely in their separationpower among different suppliers. Basic information regarding the specificcolumn provided by the manufacturer, such as surface area, % carbon, andtype of bonded phase, usually does not allow prediction of the separation orfor the proper selection of columns with similar separation patterns.
Great varieties of different columns are currently available on the market.Four distinct characteristics could be used for column classification:
1. Type (monolithic; porous; nonporous)2. Geometry (surface area; pore volume; pore diameter; particle size and
3. Surface chemistry (type of bonded ligands; bonding density; etc.)4. Type of base material (silica; polymeric; zirconia; etc)
All these characteristics are interrelated. Variations of porosity which includepore diameter can affect both the adsorbent surface area and the bondingdensity. The type of base material affects adsorbent surface chemistry. There-fore, in our discussion we combine these characteristics in two major classes:geometry and surface chemistry.
Most geometry-related properties of packing materials are related to thecolumn efficiency and flow resistance: particle size, particle shape, particle sizedistribution, packing density, and packing uniformity. Surface-chemistry-related properties are mainly responsible for the analyte retention and sepa-ration selectivity.
Adsorbent surface area, pore volume, and pore diameter are the propertiesof significant importance. HPLC retention is generally proportional to thesurface area accessible for a given analyte (Chapter 2). Surface area accessi-bility is dependent on the analyte molecular size, adsorbent pore diameter,and pore size distribution.
The chemical nature of the ligands bonded on the surface of support mate-rial defines the main type of chemical interactions of the surface with eluentand analyte molecules. In essence, all C18-type columns should be similar withregard to their main interaction type, namely, hydrophobic interactions: Meth-ylene selectivity of all C18-type columns are virtually identical [1]. Bondedphases of the same type differ in their ability to suppress (or shield) othertypes of interactions (ionic; dipole) exerted by the base material (e.g., silica).Energy of these unwanted interactions is about 10 times greater than theenergy of dispersive interactions [2]. Due to the exponential nature of the rela-tionship between retention and interaction energy even the presence of 1%or less of these active centers in the packing material surface can significantlyaffect the analyte retention.
Bonding density is the primary parameter in evaluation of the quality ofthe bonded material. Usually the higher the bonding density, the better theshielding effect, although care should be taken in cross-evaluation of similarcolumns on the basis of their bonding density. Surface geometry can also sig-nificantly affect bonding density. Base material with smaller pores has highersurface area; however, bonding density is usually lower due to the smallerpores.
All parameters of the packing material are interrelated in their influenceon the chromatographic performance of the column. The quality of an HPLCcolumn is a subjective factor, which is dependent on the types of analytes andeven on the chromatographic conditions used for the evaluation of the overallquality.
Long-term column stability (pH and temperature) and batch-to-batchreproducibility are probably the most important quality characteristics to beconsidered in column selection in the pharmaceutical industry. Nevertheless,
76 STATIONARY PHASES
these criteria should be evaluated with caution when selecting the columnevaluation parameters. Long-term stability of retention and efficiency charac-teristics are usually different, depending on the testing conditions (mobilephase, temperature, and analyte probes). Efficiency is usually fairly stable atlow mobile-phase pH, while retention of the probe analytes may show a driftin retention. However, the retention is generally stable at high pH while effi-ciency could be deteriorated.
3.2 TYPE OF PACKING MATERIAL (POROUS, NONPOROUS, MONOLITHIC)
Majority of packing materials used in HPLC are porous particles with averagediameters between 3 and 10 μm. For most pharmaceutical applications, 3-μmparticle sizes are recommended. Porosity provides the surface area necessaryfor the analyte retention (usually between 100 and 400m2/g). Interparticlespace is large enough to allow up to 1–3mL/min flow within acceptable pres-sure range (however, the pressure drop across the column depends on the particle size, length of column, temperature of separation, and type of mobile-phase composition).
Introduction of small nonporous spherical particles in the mid-1990s [3, 4]was an attempt to increase efficiency by eliminating dual column porosity. Inthe column packed with porous particles, interparticle space is about 100-foldlarger than pores inside the particles, and liquid flow around the particles isalso faster; this leads to the significant band broadening. Unfortunately, elimi-nation of particle porosity dramatically decreases adsorbent surface area,thereby decreasing the column loading capacity. Columns packed with small(1.5μm) nonporous particles also require ultra-microinjection volumes and acorresponding increase of detector sensitivity.
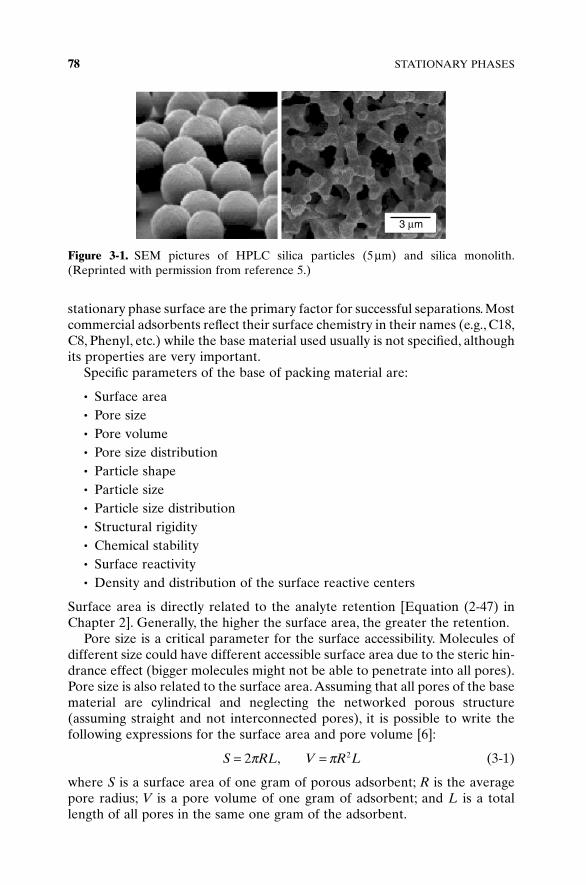
The introduction of monolithic columns in the 1990s was another and moresuccessful attempt to increase column permeability while decreasing the gapin column dual porosity. Macropores in the monolith are between 4000 and6000 Å in diameter, and they occupy almost 80% of the column volume. Com-pared to the conventional packed column with 5- or even 3-μm particles, thesilica skeleton in monolith is only approximately 1 μm thick, which facilitatesaccessibility of the adsorbent surface inside the mesopores of the skeleton(pores between 20 and 500 Å in diameter are usually called mesopores). Com-parison of the spherical packing material and monolithic silica is shown inFigure 3-1.
3.3 BASE MATERIAL (SILICA, ZIRCONIA, ALUMINA, POLYMERS)
In modern liquid chromatography, almost all reversed-phase separations areperformed on chemically modified adsorbents. Analyte interactions with the
BASE MATERIAL (SILICA, ZIRCONIA, ALUMINA, POLYMERS) 77
stationary phase surface are the primary factor for successful separations. Mostcommercial adsorbents reflect their surface chemistry in their names (e.g., C18,C8, Phenyl, etc.) while the base material used usually is not specified, althoughits properties are very important.
Specific parameters of the base of packing material are:
• Surface area• Pore size• Pore volume• Pore size distribution• Particle shape• Particle size• Particle size distribution• Structural rigidity• Chemical stability• Surface reactivity• Density and distribution of the surface reactive centers
Surface area is directly related to the analyte retention [Equation (2-47) inChapter 2]. Generally, the higher the surface area, the greater the retention.
Pore size is a critical parameter for the surface accessibility. Molecules ofdifferent size could have different accessible surface area due to the steric hin-drance effect (bigger molecules might not be able to penetrate into all pores).Pore size is also related to the surface area.Assuming that all pores of the basematerial are cylindrical and neglecting the networked porous structure(assuming straight and not interconnected pores), it is possible to write thefollowing expressions for the surface area and pore volume [6]:
(3-1)
where S is a surface area of one gram of porous adsorbent; R is the averagepore radius; V is a pore volume of one gram of adsorbent; and L is a totallength of all pores in the same one gram of the adsorbent.
S RL V R L= =2 2p p,
78 STATIONARY PHASES
Figure 3-1. SEM pictures of HPLC silica particles (5 μm) and silica monolith.(Reprinted with permission from reference 5.)
It may be interesting for the reader to estimate an approximate length of allpores in 1g of average adsorbent. Surface area of average HPLC adsorbent ison the level of 300m2/g and average pore diameter is 100 Å. One gram of silicais an approximate amount that is usually packed into the standard 15-cm-longHPLC column (4.6-mm I.D.). If you calculate the length of all pores in thiscolumn [using equation (3-1) and express it in meters or kilometers], you will geta feeling of what you are dealing with when you are using HPLC.
If we take a ratio of the above expressions, we get simple relationship betweenthese parameters:
(3-2)
K. K. Unger [6] found that in most cases, expression (3-2) shows a 15% discrepancy between measured and estimated adsorbent surface, which is very good when we take into account the above assumptions made in itsderivation.
The most commonly used base material is silica (SiO2), the most commonsubstance on the Earth and thoroughly studied in the last two centuries. Anexcellent monograph on the properties of silica was published by Iler [7].Development of modern HPLC techniques promoted advancement in poroussilica technology. Almost all silica-based HPLC packings manufactured in thetwenty-first century are very uniform spherical porous particles with narrowparticle and pore size distribution.
Silica has one significant drawback: It is soluble at high pH, although chem-ical modification with high bonding density of attached alkylsilanes extendsits stability range to over pH 10.
Another porous base material suggested in the last decade as an alterna-tive to silica is zirconia. Zirconia is stable in a very wide pH range (pH 1–14),but zirconia surface has relatively low reactivity (more difficult to bond dif-ferent functional groups to the surface), which significantly limits a selectionof available stationary phases.
Polymer-based materials have been on the market for more than 30 years.Crosslinked styrene-divinylbenzene and methylmethacrylate copolymers arethe most widely used. These materials show high pH stability and chemicalinertness. Their rigidity and resistance to the swelling in different mobilephases is dependent on the degree of crosslinkage.
Practical application of these materials for the separation of small moleculesare somewhat limited due to the presence of microporosity. Gaps betweencross-linked polymer chains are on the level of molecular size of low-molecular-weight analytes. These analytes could diffuse inside the body of a polymer-based packing material, which produce drastically different reten-tion of a small portion of injected sample than the rest of it. At the same time, polymers are the main packing material for size-exclusion chromatography.
SV R
= 2
BASE MATERIAL (SILICA, ZIRCONIA, ALUMINA, POLYMERS) 79
3.4 GEOMETRY
3.4.1 Shape (Spherical/Irregular)
Recent technological advancements made spherical particles widely availableand relatively inexpensive. Columns packed with spherical particles exhibitsignificantly higher efficiency, and columns packed with irregular particles areseldom used and are becoming nonexistent for analytical scale separations.
3.4.2 Particle Size Distribution
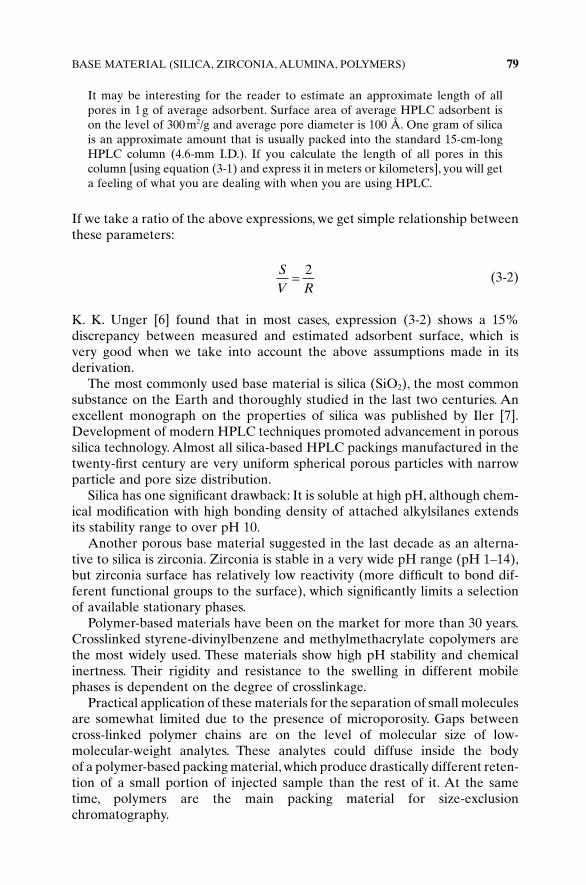
Packing materials are characterized by the average diameter of their particlesand the distribution of the particle size around the average value.
The particle size distributions shown in Figure 3-2 are for spherical pack-ing materials with nominal particle size of 10 μm. Distributions of differentbatches are symmetrical, with average width of approximately 50% of nominaldiameter. Most critical for HPLC application is the presence of very small par-ticles (fines) less than 0.5 μm. These small particles are usually fragments ofcrushed particle (porous silica is a fragile material). These fine particles willsteadily migrate in the column toward the exit frit and clog it. These particleswill eventually dramatically decrease the column efficiency, and peak distor-tion is usually observed for all peaks in the chromatogram.
Particle size distribution itself does not affect chemical behavior of HPLCadsorbent, although it is known to influence the efficiency of packed column.Packings with wide particle size distribution contain a significant amount of
80 STATIONARY PHASES
Figure 3-2. Example of cumulative particle size distribution of HPLC packing mate-rials (Waters μ-Bondapack). Average particle size is 10 μm (inflection point).(Reprinted from reference 8, with permission.)
fine particles, which increases column backpressure; a big size differencebetween particles in the column decreases overall column efficiency.
Halasz and Naefe [9] and Majors [10] suggested that if the distribution isnot wider than 40% of the mean, then acceptable flow resistance and columnefficiency can be obtained. The narrower the particle size distribution, thebetter and the more reproducibly the columns could be packed. Generallyaccepted criteria is that 95% of all particles should be within 25% regionaround the mean particle diameter [11, 12].
3.4.3 Surface Area
Surface area of HPLC adsorbents is probably the most important parameter,although it is almost never used or accounted for in everyday practical chro-matographic work. As shown in the theory chapter (see Chapter 2), HPLCretention is proportional to the adsorbent surface area. The higher the surfacearea, the greater the analyte retention, although as we discuss later, depend-ing on the surface geometry, analytes of a different molecular size could effec-tively see different surface areas on the same adsorbent.
The experimental methods for the measurement of the surface area ofporous silica is fairly well established. Nitrogen or argon adsorption isothermsat the temperature of liquid nitrogen (77K) are used in accordance with BET(Brunauer, Emmet, Teller) theory [13] for the calculation of the total surfacearea per unit of adsorbent weight.There are different variations of BET theoryavailable as well as different instrumental approaches [14] for the measure-ment of nitrogen isotherms. For proper characterization of mesoporous (porediameter is greater than 20 Å) adsorbents, the static measurement of adsorp-tion isotherm with proper equilibration at each measured point is preferable.Detailed discussion of all aspects of nitrogen adsorption isotherms and relatedtheories could be found in the classic book Adsorption, Surface Area andPorosity by Gregg and Sing [15]. Full nitrogen adsorption isotherm (adsorp-tion and desorption branches) is shown in Figure 3-3.
The region between 0.05 and 0.25 relative pressures is called the BETregion, and it is used for the determination of the so-called monolayer capac-ity—the amount of nitrogen molecules adsorbed on the sample surface in acompact monolayer fashion. The BET equation represents the dependence of amount of adsorbed nitrogen as a function of the relative equilibrium pressure (p/p0):
(3-3)
where nm is the monolayer capacity, C is energetic constant of nitrogen inter-action with the surface; p/p0 is the relative equilibrium pressure, and n is the
pp
npp
n CCn C
ppm m
0
0
01
1 1
−⎛⎝
⎞⎠
= + −( )
GEOMETRY 81
amount adsorbed. Figure 3-3 shows the experimental dependence of theamount of nitrogen adsorbed on the surface versus the relative pressure (pres-sure of nitrogen at the equilibrium in the gas phase over the adsorbent relatedto the saturation pressure at the temperature of the experiment). Equation (3-3) is the linear form of the function shown in Figure 3-3, but only in the rela-tively low pressure region between 0.05 and 0.25 where the formation ofadsorbed monolayer is complete and BET theory is valid. The plot of theexperimental points in p/p0/(1 − p/p0) versus p/p0 allows for linear minimiza-tion and calculation of C and nm values [15].
It is generally assumed that a nitrogen molecule occupies 16.4 Å2 on thepolar silica surface. The adsorbent surface area is then calculated as a productof the total amount of nitrogen in the monolayer (nm) and the nitrogen mol-ecular area (16.4 Å2).
3.4.4 Pore Volume
At higher relative pressures, above 0.7 in Figure 3-3 a fast increase of theadsorbed amount of nitrogen is observed. This region is attributed to theprocess of capillary condensation of nitrogen inside the adsorbent pores. Thisincrease is observed until the whole pore volume is filled with liquid nitrogen.When relative equilibrium pressure approaches the saturation pressure andall pores are already filled with liquid nitrogen, a small flat section on theadsorption isotherm is usually observed (amax). This section indicates the com-pletion of the pore filling with condensed nitrogen, and it could be used foraccurate determination of the adsorbent pore volume:
where VL is the molar volume of liquid nitrogen (34.7mL/mol); amax is the maxi-mum amount of nitrogen in the pores expressed in milliliters at 1atm and
25°C; P is the pressure (1atm); R is the gas constant ( ); and T is
the temperature, 298K.The desorption branch of nitrogen isotherm is typically used for the deter-
mination of the pore size distribution.The only important factor that should becarefully verified for each adsorbent is the presence of microporous structure.If the micropores (pores with diameter less than 20 Å) are present in base mate-rial, the actual surface to which HPLC analyte might be exposed will be differ-ent from the surface measured with nitrogen adsorption.This is due to the sizedifference of nitrogen molecule and practically any HPLC analyte molecule.Bigger molecules will have steric hindrance in micropores, and any interpreta-tion of the HPLC retention related to the surface area will be erroneous. Inaddition, proper chemical modification of adsorbents with micropores is essen-tially not possible. Minimum pore diameter acceptable in HPLC adsorbents isapproximately 50 Å. Adsorbent pore size provided by the manufacturer is thediameter corresponding to the maximum of the pore size distribution curve,obtained from the adsorption branch of nitrogen isotherm. The distribution ofthe pores could vary significantly as it is shown in Figure 3-4.
0 082.L atmK mol
⋅⋅
V Va PRT
Lpore = max
GEOMETRY 83
Figure 3-4. Pore size distribution of different HPLC materials. Allure Silica (Restek);Allure-PFPP (Restek), Prodigy-Silica (Phenomenex); Chromolith C18 (Merck KgaA,Germany); and research-type ordered silica with highly uniform pores of 50-Å porediameter.
3.4.5 Surface Geometry
The roughness of the silica surface could introduce the steric hindrance of thesurface accessibility similar to the effect of the micropores. In the discussionabove, we assume the ideal tubular geometry of the silica surface. The use ofdifferent probe molecules for the BET measurement of silica surface area(such as N2, Ar, Kr, benzene, etc.) leads to significant difference in the surfacearea values for the same silica sample. It was suggested that silica surfacespossess the property of fractals [16]; this essentially means that molecules ofdifferent size will see a different surface area.
The surface constructed of ridges and valleys could be considered as anexample of a fractal surface. The slopes of these ridges are also constructed bysmaller ridges, and with the higher magnification even smaller ridges arevisible. As an example, if a big ball is used to roll over this surface, it will seeonly the big ridges and thus a relatively small total surface. If, on the otherhand, a smaller ball is rolling over the same surface, it will see much more ofsmaller ridges and a lot of them, resulting in a much higher effective surfacearea. The smaller the probing ball, the finer the surface roughness it will seeand correspondingly higher surface will be detected.
Molecular nitrogen will see a significant surface area due to its small sizecomparable to the dimensions of the surface roughness, while bigger mole-cules such as pyrene will not be able to see all ridges and valleys and will seea significantly lower effective surface area. These factors have been studiedextensively [17] for silica, and authors have found fractal factors to varybetween 2 and 3, depending on the silica synthesis, treatment, and so on.
Adsorbent surface area (S) is measured as a product of molecular area (s)of a probe substance and the number of the molecules (N) in completeadsorbed monolayer. On the fractal surface the total number of molecules inthe monolayer is dependent on its roughness and could be expressed as
(3-5)
where D is a fractal number. Since S = Nσ, the adsorbent surface could beexpressed as follows:
(3-6)
On the flat surface, D is equal to 2 and only in this case the surface area is notdependent on the size of probe molecule.
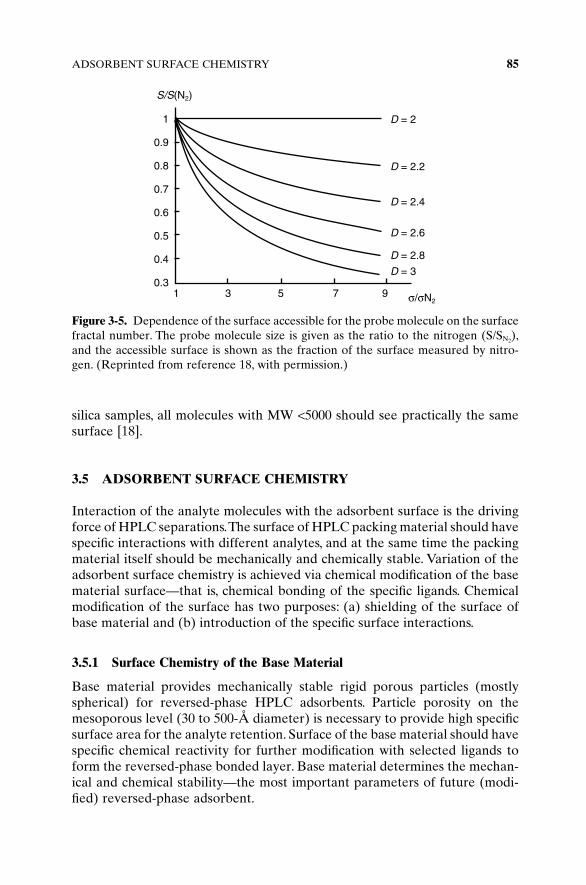
The higher the fractal number, the less accessible the surface (quasi-three-dimensional or rough surface). For silica with a pore diameter of 10nm andhigher, the fractal factor has a tendency to be between 2.05 and 2.3, which isclose to the flat surface. Figure 3-5 illustrates the apparent decrease of acces-sible silica surface in the form of a fraction of the total surface with theincrease of the fractal number of this surface (roughness). For these types of
S N D~ ~s s⋅ −( )2 2
ND
~ σ−
2
84 STATIONARY PHASES
silica samples, all molecules with MW <5000 should see practically the samesurface [18].
3.5 ADSORBENT SURFACE CHEMISTRY
Interaction of the analyte molecules with the adsorbent surface is the drivingforce of HPLC separations.The surface of HPLC packing material should havespecific interactions with different analytes, and at the same time the packingmaterial itself should be mechanically and chemically stable. Variation of theadsorbent surface chemistry is achieved via chemical modification of the basematerial surface—that is, chemical bonding of the specific ligands. Chemicalmodification of the surface has two purposes: (a) shielding of the surface ofbase material and (b) introduction of the specific surface interactions.
3.5.1 Surface Chemistry of the Base Material
Base material provides mechanically stable rigid porous particles (mostlyspherical) for reversed-phase HPLC adsorbents. Particle porosity on themesoporous level (30 to 500-Å diameter) is necessary to provide high specificsurface area for the analyte retention. Surface of the base material should havespecific chemical reactivity for further modification with selected ligands toform the reversed-phase bonded layer. Base material determines the mechan-ical and chemical stability—the most important parameters of future (modi-fied) reversed-phase adsorbent.
ADSORBENT SURFACE CHEMISTRY 85
Figure 3-5. Dependence of the surface accessible for the probe molecule on the surfacefractal number. The probe molecule size is given as the ratio to the nitrogen (S/SN2
),and the accessible surface is shown as the fraction of the surface measured by nitro-gen. (Reprinted from reference 18, with permission.)
3.5.1.1 Mechanical Stability (Rigidity). Particles of packing material aresubject to significant mechanical stress under the column packing procedureand sometimes during column operation (pressure shock, or fast release ofexcessive pressure). The rigidity of material is, to a large extent, dependent onits surface tension (or surface energy), which is a function of material surfacechemistry. Chemical modification of base material significantly alters this para-meter, and the rigidity of modified material usually is not the same as for orig-inal base silica [18].
3.5.1.2 Chemical Stability. Hydrolytic stability of base material is the mostimportant parameter because most reversed-phase HPLC separations are per-formed in water/organic eluents with controlled pH. Selection of the mobilephase pH is mainly dictated by the properties of the ionizable analytes toensure that they are in one predominate ionization state.
Chemical modification of the adsorbent surface significantly alters practi-cally all properties of the base material. Dense coverage of the adsorbentsurface with inert ligands usually expands chemical stability of the packingmaterial.
3.5.2 Silica
Silica (SiO2) is the most widely used base material for HPLC adsorbents. Themajority of HPLC packings are silica-based. The chemistry of silica, themethods of silica’s controlled synthesis, the surface structure of silica, and theproperties of silica have been studied for over two centuries. It is possible tocontrol a synthesis of ideally spherical particles with predefined pore size andpore size distribution, as well as the synthesis of monolithic silica rods. Poroussilica provides the high surface area necessary for successful separation; at thesame time, silica particles are very hard (mechanically strong), which allowthem to withstand harsh packing conditions and flow of viscous liquids. Silicais not shrinking or swelling when exposed to the different solvents. Eventhough silica has an array of advantageous properties, it has some drawbacks.The main one is its solubility in water at high pH. The other is an extremepolarity of its surface.
3.5.2.1 Synthesis of Silica. Silica used in HPLC is an amorphous, poroussolid, which could be obtained by different synthetic procedures.
Colloidal Sol–Gel Procedure. Silica sol is passed through nonaqueous media,where it forms spherical droplets, which rapidly solidify into the hydrogelbeads [19]. Solid beads are dried and calcinated at around 600–1000°C. Thissynthetic procedure usually gives spherical particles of silica with significantamount of impurities (Na, Fe, B, etc.) in the body and on the surface of mate-rial. These impurities can increase the acidity of the surface silanols, thus low-ering the pKa of the respective silanol groups.
86 STATIONARY PHASES
Polycondensation Procedure. This method is essentially the controlled poly-merization of tetraethoxysilane (TES). In the first step, TES is partiallyhydrolyzed in a viscous liquid, which then is emulsified in the mixture ofethanol and water and then undergoes further hydrolytic polycondensationwhen catalyzed.The formed solid beads of hydrogel are washed and dried intoporous silica. This procedure allows synthesis of highly pure silica particles,which is essential for HPLC.
Some recent modifications of the polycondensation process allow synthe-sis of silica with organic moieties embedded into the bulk material [20, 21],which manufacturers claim to give advantages over conventional silica interms of higher pH and temperature stability.
3.5.2.2 Surface Silanoles. The surface of amorphous silica is constructed ofseveral different terminal groups. The major portion of the silica surface iscovered with single (isolated or free) silanols. Free silanols contain a siliconatom that has three bonds in the bulk structure, and the fourth bond isattached to a single hydroxyl group.
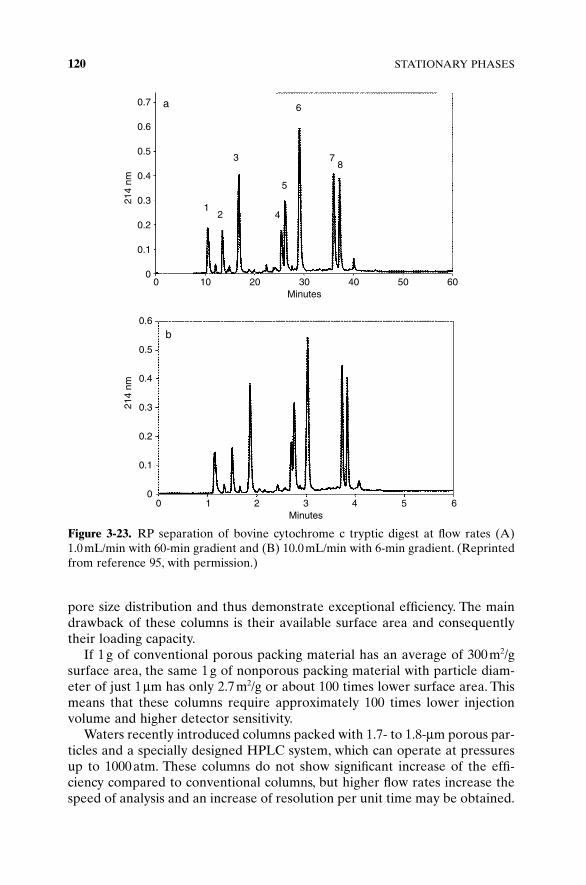
The calcination process at high temperatures (over 800°C) often removeswater molecules from adjacent silanols, leading to a formation of a siloxanebond. This process is known as dehydroxylation [18]. Dehydroxylated silica isvery inert, but it can slowly absorb water and rehydroxylate.
Some adjacent silanols can hydrogen-bond to each other, which requires rel-atively close position of silanols usually observed in the β-kristobalite form ofsilica.Typical chromatographic packing material is estimated to have not morethan 15% of its surface with β-kristobalite-type silanols arrangement.
In the chromatographic literature an additional type of surface silanols isoften mentioned [8]; the geminal silanol shown below contains two hydroxylgroups attached to one silicon atom.
Peri and Hensley [22] proposed the existence of these groups on silica surface,although their existence on the surface has not been confirmed. These groupshave only been experimentally observed on monomeric organosilicon com-pounds in solution.
ADSORBENT SURFACE CHEMISTRY 87
The density of the silanole groups on the silica surface is the most impor-tant parameter defining surface reactivity and polarity and is also claimed tohave negative effects on chromatographic properties of modified adsorbents.
Many attempts have been made to measure silanol surface density (αOH).Iler [7] estimated αOH to be equal to 8 groups/nm2 on the basis of the [100]face of β-cristobalite. However, most porous amorphous silicas show surfacesilanol concentration on the level of 4.6 to 5 groups/nm2 [6].
3.5.3 Silica Hybrid
In the last decade, several composite base packing materials were successfullyintroduced into the market [20, 21]. The primary driving force in developingthese materials was the attempt to use all benefits of well-known porous silicaand suppress its drawbacks. The two main drawbacks are solubility at high pHand high surface density of silanols.
Modification of the base silica synthesis by addition of methylthrietoxysi-lane allows the introduction of methyl groups on the silica surface.A schematicrepresentation of the expected surface is shown in Figure 3-6. Surface con-centration of methyl groups is dependent on the reagent ratio.
The position of methyl groups within the silica body is essentially random,and their appearance on the surface may not be favorable during the poly-condensation process. The presence of terminating methyl groups within silicabody may decrease the mechanical stability of base silica, and this is alsodependent on the reagent ratio. Authors claim mechanical stability compara-ble to that of regular HPLC silica [23] while the amount of surface silanols issignificantly reduced [24, 25].
Another approach to manufacturing hybrid silica (Gemini) was introducedby Phenomenex [26]. They synthesize layered hybrid silica where the core ofthe particle is regular silica and the surface is covered by the layer of organic-embedded silica. This allows better control of the porous structure because
88 STATIONARY PHASES
Figure 3-6. Schematic of the synthesis of hybrid silica. (Reprinted with permissionfrom reference 23.)
traditional synthesis of base silica is used and surface silanole concentrationis decreased while maintaining the mechanical strength of silica.
Recently, further development of hybrid materials allows the introductionof organic bridged silica (Figure 3-7). Embedded organic groups do not haveterminating function any more but actually are forming an organic bridgebetween silicon atoms. According to authors, this hybrid particle, having anempirical formula SiO2(O1.5SiCH2CH2SiO1.5)0.25, is synthesized by the co-condensation of 1,2-bis(triethoxysilyl)ethane (BTEE, 1 equiv.) with TEOS (4 equiv.) [20].The resulting hybrid material shows better pH stability becauseSi–C covalent bonds are much less prone to hydrolysis than Si–O–Si bonds.Surface energy is also significantly reduced, as estimated by comparison of C-constants of the BET equation (BET C-constant represents the energy ofnitrogen interaction with the surface [15]). Usual values for regular silica arebetween 100 and 150, while on hybrid silica a nitrogen interaction with thesurface is significantly weaker and the C-constant value drops to 49, which iscomparable to that of phenyl-modified silicas [27].
A decrease in the surface energy is associated with the decrease in thesurface silanols concentration, but this decrease is not reflected on the abilityof this material to accept surface modification. Chemical modification withoctadecilsilane ligands resulted in 3.2- to 3.3-μmol/m2 surface density, which istypical for most modern regular modified silicas [20].
3.5.4 Polymeric Packings
Variation of the mobile-phase pH is one of the most powerful tools in con-trolling the separation for ionizable analytes. The main drawback of silica-based HPLC packing materials is their narrow applicable pH range. The otherlimitations are surface activity (or polarity), which for specific applications(such as separation of proteins or biologically active compounds) could playa major role. All these factors are the driving force for the search in alterna-tive base materials for HPLC packings.
ADSORBENT SURFACE CHEMISTRY 89
Figure 3-7. Schematic of the formation of bridged hybrid silica. (Reprinted with per-mission from reference 28.)
The majority of polymer-based packing materials are polystyrene-divinylbenzene crosslinked copolymers. While PS–DVB packings have theadvantages of chemical stability at wide pH range, they suffer from the dis-advantage of yielding lower chromatographic efficiencies than silica-basedbonded phase packings of the same particle size. Even a high degree ofcrosslinkage in three-dimensional polymer structure leave sufficient spacebetween polymer chains for small analyte molecules to diffuse into the bodyof the polymer. These “micropores” cause noticeable increase in the broad-ening of chromatographic zone. In another words, column efficiency is lowerdue to a slow intraparticle sorption rate and due to slow diffusion of solutemolecules within the polymer matrix [29–36].
3.5.5 Zirconia (Metal Oxides)
Introduction of all these materials on the market is driven primarily by theirsuperior stability at high mobile-phase pH and temperature range.
There is a very limited selection of commercially available materials due tohigher inertness of the metal oxide surface, and there are almost no repro-ducible methods of chemical surface modification [37]. Most of the surfacechemistry alteration is achieved by coating and not bonding. Control of thesurface area and porosity is also limited.
The commercial availability of zirconia-based HPLC packings are mainlyrelated to the enormous extensive research of P. Carr and other workers [37,38]. They applied zirconia as the starting material for a number of differentpolymer-coated RP phases.
Carr and others have described the preparation and properties of polybu-tadiene (PBD) and polyethyleneimine (PEI), as well as aromatic polymer-coated and carbon-clad zirconia-based RP phases. The preparation ofPBD-coated zirconia and the chromatographic evaluation of these phaseshave been described extensively by Carr, McNeff, and others [39–41]. Fromthese studies, the authors conclude that at least for neutral analytes PBD zirconia-coated phases behave quite similar with respect to retention and effi-ciency compared to silica-based RP phases [42]. For polar and ionic analytes,however, substantial differences with respect to retention, selectivity, and effi-ciency have been reported [43].
3.5.6 Porous Carbon (or Carbon-Coated Phases)
For many years, different research groups attempted to create porous mater-ial with ideal graphite surface and strong enough to be used in HPLC. Theadvantage of this material would be that two main interactions can occur withanalytes: hydrophobic and π–π interactions on an essentially planar surface ofgraphite (Figure 3-8). The use of graphitized carbon black in gas chromatog-raphy had shown significant predictability of retention and specificity for theseparation of conformational isomers, and similar advantages are expected forthese adsorbents in HPLC.
90 STATIONARY PHASES
The first commercial HPLC packing material with graphitized carbonsurface was made commercially available at the end of the 1980s under thename Hypercarb [44–46]. On the atomic level, porous graphitic carbon (PGC)is composed of flat sheets of hexagonally arranged carbon atoms (about 105
atoms per sheet) [47]. Edges of graphite sheets are expected to be partially oxi-dized with the formation of hydroxyl, carbonyl, and carboxylate groups [49].
PGC-type packing material shows unique chromatographic properties,since it is more hydrophobic than conventional C18 phases and it shows sig-nificantly higher methylene selectivity [50]. This material has high chemicalstability in the wide pH range, and it has unique selectivity for the separationof polar compounds because of its high polarizability [51, 52]. This adsorbentis the primary choice if the separation of conformational isomers is required,because the planar nature of the main part of its surface provides the basis forisomeric separation (Figure 3-9).
3.6 SURFACE OF CHEMICALLY MODIFIED MATERIAL
In the preparation of reversed-phase packing material the main purpose ofchemical modification is to convert polar surface of base material into thehydrophobic surface which will exert only dispersive interactions with anyanalyte.
In porous packing materials with 10-nm average pore diameter, 99% of theavailable surface area is inside the pores. Conversion of highly polar silica withhigh silanol density (4.8 groups/nm2) [7] into the hydrophobic surface requiresdense bonding of relatively thick organic layer which can effectively shield thesurface of base silica material.
SURFACE OF CHEMICALLY MODIFIED MATERIAL 91
Figure 3-8. Atomic structure of porous graphitic carbon. (Reprinted from reference48, with permission.)
92 STATIONARY PHASES
Figure 3-9. Selectivity of porous graphitic carbon for positional and conformationalisomers under reversed-phase conditions. (Reprinted from reference 53, with permission.)
3.6.1 Limits of Surface Modification
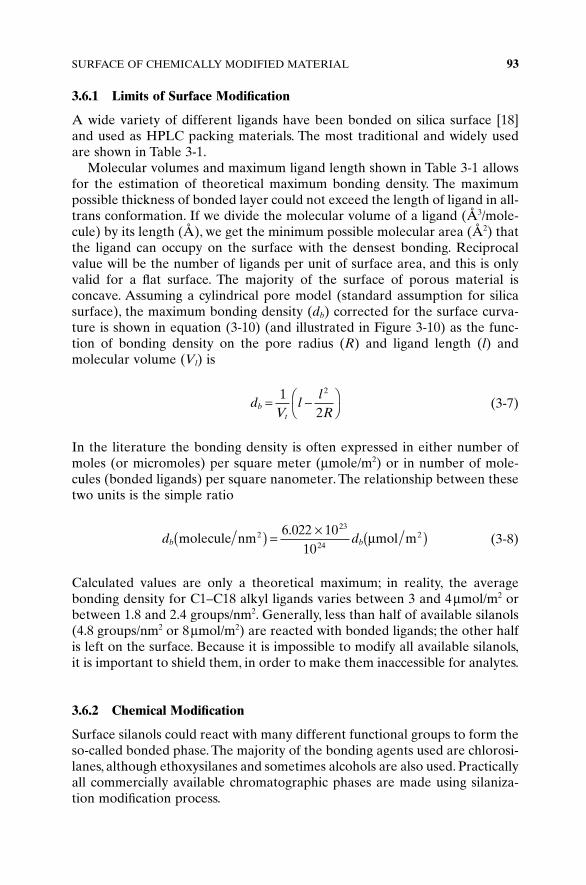
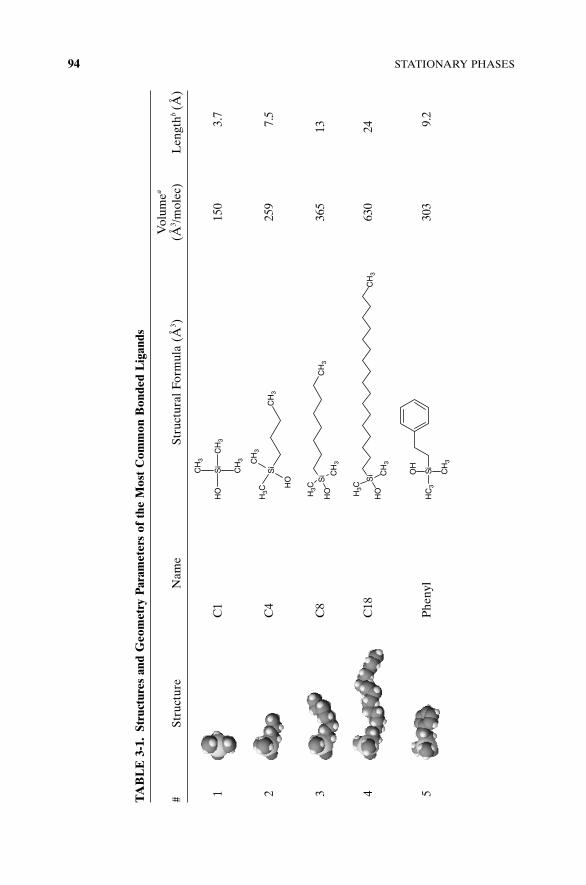
A wide variety of different ligands have been bonded on silica surface [18]and used as HPLC packing materials. The most traditional and widely usedare shown in Table 3-1.
Molecular volumes and maximum ligand length shown in Table 3-1 allowsfor the estimation of theoretical maximum bonding density. The maximumpossible thickness of bonded layer could not exceed the length of ligand in all-trans conformation. If we divide the molecular volume of a ligand (Å3/mole-cule) by its length (Å), we get the minimum possible molecular area (Å2) thatthe ligand can occupy on the surface with the densest bonding. Reciprocalvalue will be the number of ligands per unit of surface area, and this is onlyvalid for a flat surface. The majority of the surface of porous material isconcave. Assuming a cylindrical pore model (standard assumption for silicasurface), the maximum bonding density (db) corrected for the surface curva-ture is shown in equation (3-10) (and illustrated in Figure 3-10) as the func-tion of bonding density on the pore radius (R) and ligand length (l) andmolecular volume (Vl) is
(3-7)
In the literature the bonding density is often expressed in either number ofmoles (or micromoles) per square meter (μmole/m2) or in number of mole-cules (bonded ligands) per square nanometer. The relationship between thesetwo units is the simple ratio
(3-8)
Calculated values are only a theoretical maximum; in reality, the averagebonding density for C1–C18 alkyl ligands varies between 3 and 4 μmol/m2 orbetween 1.8 and 2.4 groups/nm2. Generally, less than half of available silanols(4.8 groups/nm2 or 8 μmol/m2) are reacted with bonded ligands; the other halfis left on the surface. Because it is impossible to modify all available silanols,it is important to shield them, in order to make them inaccessible for analytes.
3.6.2 Chemical Modification
Surface silanols could react with many different functional groups to form theso-called bonded phase. The majority of the bonding agents used are chlorosi-lanes, although ethoxysilanes and sometimes alcohols are also used. Practicallyall commercially available chromatographic phases are made using silaniza-tion modification process.
d db bmolecule nm mol m2 2( ) = × ( )6 022 1010
23
24
. μ
dV
llR
bt
= −⎛⎝
⎞⎠
12
2
SURFACE OF CHEMICALLY MODIFIED MATERIAL 93
94 STATIONARY PHASES
TAB
LE
3-1
.St
ruct
ures
and
Geo
met
ry P
aram
eter
s of
the
Mos
t C
omm
on B
onde
d L
igan
ds
Vol
umea
#St
ruct
ure
Nam
eSt
ruct
ural
For
mul
a (Å
3 )(Å
3 /mol
ec)
Len
gthb
(Å)
1C
115
03.
7
2C
425
97.
5
3C
836
513
4C
1863
024
5P
heny
l30
39.
2
SURFACE OF CHEMICALLY MODIFIED MATERIAL 95
6P
heny
l-he
xyl
408
14
7P
erflu
oro-
phen
yl36
310
.6
8N
itri
le (
cyan
o)24
87.
8
9A
min
o-pr
oyl
238
7
10D
iol
314
11.5
a Mol
ar v
olum
e ev
alua
ted
usin
g A
CD
sof
twar
e (v
ersi
on 9
.3).
b Lig
and
leng
th c
alcu
late
d us
ing
AC
D s
oftw
are
for
the
dist
ance
bet
wee
n an
chor
ing
oxyg
en a
nd f
orem
ost
atom
in a
ll-tr
ans
conf
orm
atio
n of
cor
resp
ondi
nglig
and.
3.6.2.1 Types Modification Reactions. Chemical modification of hydroxy-lated surface of base material in more than 90% of commercially availableHPLC stationary phase is performed by its reaction with alkylchlorosilane-type modifiers, reaction (3-9). HCl is generated as a byproduct, and typicallya scavenger for HCl is employed in the synthesis. For most common bondedphases the two side groups are methyl; however, other side groups such as iso-propyl and tert-butyl have been used.
(3-9)
(3-10)
On the silica surface, silanols can react with alcohols forming Si–O–R bonds,reaction (3-10). This type of reaction allows for a very high bonding density,but hydrolytic cleavage of Si–O–R bonds is relatively high and this materialis not practically applicable for HPLC support.
Chemical modification of the silica surface with hydridosilane-type modi-fiers as shown in schematic (3-11) offers some advantages:
(3-11)
A byproduct of this reaction is H2, which easily leaves the reaction zone andleads to higher bonding density [18].
Si OH + H Si R Si – O – Si H – R H3 2 2− − = ( ) +
Si OH + HO alkyl Si O alkyl H O2− − = − − +
Si OH +Cl Si Me -alkyl Si O Si Me -alkyl HCl− − ( ) − = − − ( ) − +2 2n n
96 STATIONARY PHASES
Figure 3-10. Schematic of the pore fragment with 100-Å diameter modified with C18ligands in all-trans conformation illustrating the steric hindrance effect.
3.6.2.2 Surface Modification with Chlorosilanes. Chlorosilanes are volatileand very sensitive to the presence of trace amounts of water. Vapor-phasesilanization reactions with rigorous control of the absence of water show thatClnSiMe4-n-type chlorosilanes react with aerosil (nonporous microparticulatesilica) as
(3-12)
that is, only one surface silanol participates in this reaction [54]. Unger [6], onthe other hand, advocates the possibility of the formation of bridging bonds:
Analysis of interatomic distances for these types of bonds shows that adjacentsilanols on the surface should be at a distance of approximately 2.5Å, whichcorresponds to that distance in β-crystobalit and leads to the surface silanoldensity of 8 groups/nm2. The majority of porous silica have a silanol densityof 4.8 groups/nm2, and there is low probability of forming bridging bonds.Lisichkin and co-workers [18] discussed the interpretation of silica surface asa mixture of different microcrystalline surfaces of quartz, β-tridimite, and β-crystobalite. They estimate that approximately 15% of silica surfaces have aβ-crystobalite structure. This means that this bridging reaction shown above ispossible but only 15% of available silanols could react in this manner, whiletrifunctional bonding is virtually impossible.
The silanization reaction in liquid phase (usually in dry toluene) is techno-logically more convenient, although it is practically impossible to ensure thecomplete absence of water in a reaction mixture that leads to hydrolysis ofchlorosilanes. Using deuterium exchange, Roumeliotis and Unger [55] ana-lyzed surface silanol concentration before and after the modification with dif-ferent reagents (Table 3-2).
All monofunctional modifiers decrease the surface concentration of silanolsby 50% (depending on the alkyl ligand) compared to original silica (7.6μmol/m2), while difunctional modifiers only slightly reduces the surfaceconcentration of silanols by 12% and trifunctional modifiers apparentlyincreases the amount of silanols. This reflects actual hydrolysis of nonreactedchlorine groups of the alkyl di- and trifunctional modifiers and their conver-sion into silanols.
When a difunctional modifier is used, it mainly reacts with only one silanole,and the second chlorine is converted into hydroxyl by the reaction with eitherresidual water in the solvent media or during the adsorbent washing processafter the main reaction is completed. As the result, each surface silanole iseffectively substituted with another hydroxyl on the attached ligand and thetotal amount of silanols almost does not change.
Si OH +Cl SiMe Si O+ SiMe Cl HCl4 4–− → − +− −n n n n 1
SURFACE OF CHEMICALLY MODIFIED MATERIAL 97
When a trifunctional modifier is used each surface silanole is substituted withtwo hydroxyls, as shown in the following reaction:
Theoretically, the sum of surface concentrations of bonded ligands and resid-ual silanols should be equal to the original silanols concentration for the reac-tion with monofunctional reagents. In reality, there is an approximately1-μmol/m2 difference; and the shorter the bonded alkyl chain, the smaller thedifference, at least in the range between C4 and C12 ligands. The differenceitself could only be explained by the effectiveness of the surface shielding forthe deuteron exchange; and the longer the bonded chain, the more effectivethe shielding for comparable bonding density.
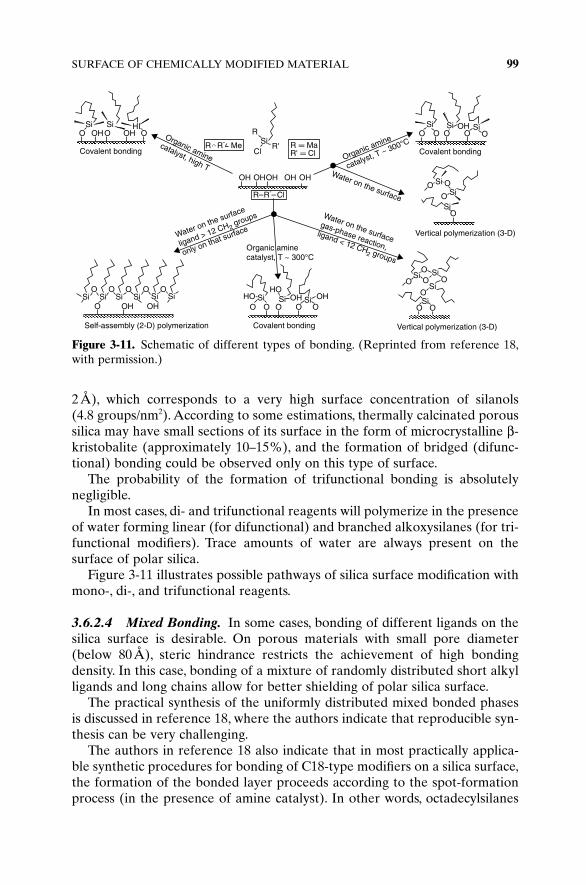
3.6.2.3 Monomeric and Polymeric Bonding. Difunctional and trifunctionalreagents are often used for the formation of so-called polymeric bonding. Inthe previous section we discussed the controversy of the surface reactions ofmono-, di-, and trifunctional reagents. At present, there is no definite conclu-sion regarding the possibility of the formation of bridging bonding, but most agree that it could not exceed 15% of the total amount bonded. For the formation of the bond shown in Figure 3-11 the distance between surfacesilanols should be similar to that on β-kristobalite (approximately
98 STATIONARY PHASES
TABLE 3-2. Surface Silanol Concentration Change after Chemical Modification [18]
CarbonSurface Concentration (umol/m2)
Modifier Content Ligands OH Groups (Lig + OH)-Silica
2Å), which corresponds to a very high surface concentration of silanols (4.8 groups/nm2). According to some estimations, thermally calcinated poroussilica may have small sections of its surface in the form of microcrystalline β-kristobalite (approximately 10–15%), and the formation of bridged (difunc-tional) bonding could be observed only on this type of surface.
The probability of the formation of trifunctional bonding is absolutely negligible.
In most cases, di- and trifunctional reagents will polymerize in the presenceof water forming linear (for difunctional) and branched alkoxysilanes (for tri-functional modifiers). Trace amounts of water are always present on thesurface of polar silica.
Figure 3-11 illustrates possible pathways of silica surface modification withmono-, di-, and trifunctional reagents.
3.6.2.4 Mixed Bonding. In some cases, bonding of different ligands on thesilica surface is desirable. On porous materials with small pore diameter(below 80Å), steric hindrance restricts the achievement of high bondingdensity. In this case, bonding of a mixture of randomly distributed short alkylligands and long chains allow for better shielding of polar silica surface.
The practical synthesis of the uniformly distributed mixed bonded phasesis discussed in reference 18, where the authors indicate that reproducible syn-thesis can be very challenging.
The authors in reference 18 also indicate that in most practically applica-ble synthetic procedures for bonding of C18-type modifiers on a silica surface,the formation of the bonded layer proceeds according to the spot-formationprocess (in the presence of amine catalyst). In other words, octadecylsilanes
SURFACE OF CHEMICALLY MODIFIED MATERIAL 99
Figure 3-11. Schematic of different types of bonding. (Reprinted from reference 18,with permission.)
are bonded close to each other, thereby forming clusters, and there is signifi-cant space between those clusters (schematically shown in Figure 3-12).
3.6.2.5 End-Capping. Secondary silanization with TMS is usually per-formed with the intention of covering accessible residual silanoles left afterthe main modification step. Possible cleavage of the main ligands (substitu-tion) may result as a consequence [18].
Figure 3-12 shows the hypothetical structure of a bonded layer. Cluster-typebonding of alkyl ligands leaves significant areas that are not covered due tothe concave nature of the inner silica surface and bulkiness of alkyl chains. Wediscussed before that only about 50% of all available silanols actually reactwith a surface-modifying agent while the other half are left unreacted. Someof these so-called “residual” silanols are left underneath the closely bondedalkylsilanes, and others are between these bonded clusters. The former areessentially inaccessible, whereas the latter are “accessible residual silanols.”These accessible residual silanols are believed to produce a lot of unwantedeffects in reversed-phase HPLC (peak tailing, bonded phase instability,fronting, etc.).
The remedy of these unwanted effects is the process called “end-capping,”which is essentially second-stage surface modification with small ligands thatcan squeeze between patches of C18 ligands and react with accessible resid-ual silanols, thus potentially deactivating them.
Despite the widely accepted opinion that endcapping really covers accessi-ble residual silanols with relatively inert “mushrooms” of trimethylsilanes, wecan refer the reader to the old work of Berendsen et al. [56], where they dida rigorous analysis of alkyl-modified silica before and after end-capping. In all
their samples, carbon content decreases after end-capping. This can only meanthat long-chain bonded alkylsilanes are substituted with short trimetylsilanesthat actually have higher bonding energy. If this process is indeed occurring,it is impossible to estimate actual coverage with TMS and original ligands.Chromatographic testing usually shows the decrease of peak tailing and othereffects usually attributed to the influence of a reduced amount of a residualsilanols.
It is possible that patches of accessible residual silanols are indeed coveredwith TMS and at the same time a fraction of bonded long-chain ligands(mainly at the borders of these patches) are substituted with TMS also. Overallpacking material becomes more hydrophobic, since the amount of accessiblesilanols decreases with end-capping, but carbon content is decreased also.
3.6.3 Types of Bonded Phases
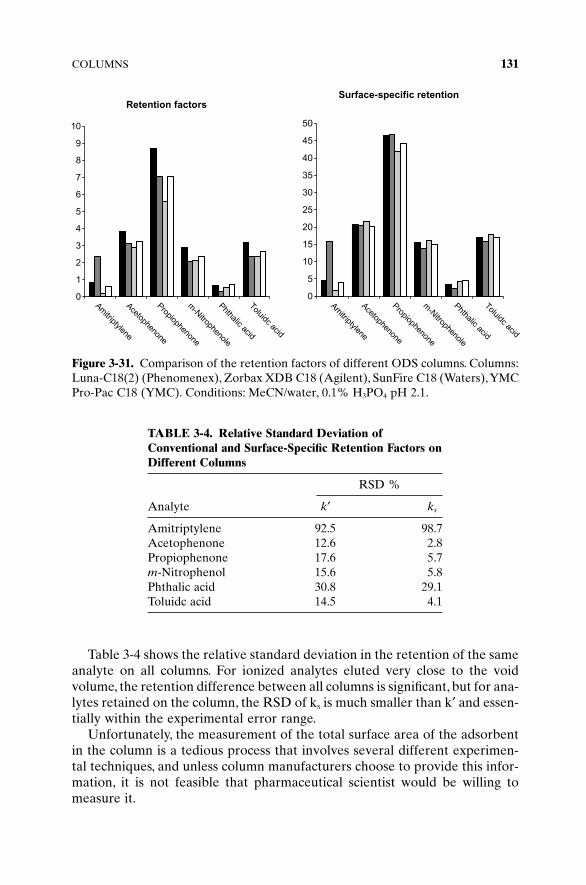
3.6.3.1 Alkyl-Type Phases (C1–C18, C30). Probably 90% of all reversed-phase columns are alkyl-type bonded phases. An enormous amount of publi-cations are devoted to the classification, standardization, and comparison ofthese phases. In their book Practical HPLC Method Development, Snyder andKirkland [57] indicate that reversed-phase retention for nonpolar and non-ionic compounds generally follows the retention pattern C1 < C4 < C8 ≈ C18.At the same time, they refer to the comparison of C18-type columns from dif-ferent manufacturers and find dramatic variation in the retention of both polarand nonpolar compounds at the same conditions on different columns.
HPLC retention expressed either in absolute values (VR) or in relativeterms (retention factor) is a complex function of a multitude of parameters.Type of bonded phase is only one of them. Surface area of base material, poresize, bonding density, end-capping, and even the column history all can signif-icantly affect analyte retention.
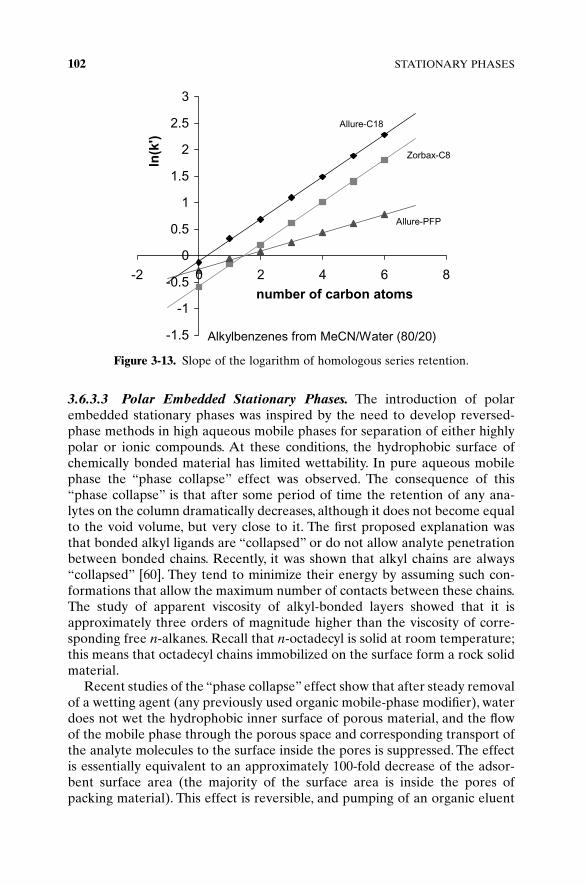
The only valuable comparison of different columns found so far is so-calledmethylene selectivity. Methylene selectivity is the slope of the dependence ofthe logarithm of retention factor of the members of homologous series on thenumber of carbon atoms in their alkyl chain (Figure 3-13). This parameterreflects the surface interaction energy of one CH2 group and is found to bevery similar on all C18-type columns (and even C8).
3.6.3.2 Phenyl-Type Phases. Phenyl-type phases have been studied for along time [58, 59]. The presence of a phenyl ring on the surface of a bondedphase introduces so-called π–π interactions with some analytes that arecapable of these types of interactions. This introduces an additional specificityfor HPLC separations on these stationary phases. Compared to common alkyl-type phases, phenyl columns show lower methylene selectivity; in other words,the separation of members of homologous series will be less selective onphenyl columns than on alkyl-modified phases.
SURFACE OF CHEMICALLY MODIFIED MATERIAL 101
3.6.3.3 Polar Embedded Stationary Phases. The introduction of polarembedded stationary phases was inspired by the need to develop reversed-phase methods in high aqueous mobile phases for separation of either highlypolar or ionic compounds. At these conditions, the hydrophobic surface ofchemically bonded material has limited wettability. In pure aqueous mobilephase the “phase collapse” effect was observed. The consequence of this“phase collapse” is that after some period of time the retention of any ana-lytes on the column dramatically decreases, although it does not become equalto the void volume, but very close to it. The first proposed explanation wasthat bonded alkyl ligands are “collapsed” or do not allow analyte penetrationbetween bonded chains. Recently, it was shown that alkyl chains are always“collapsed” [60]. They tend to minimize their energy by assuming such con-formations that allow the maximum number of contacts between these chains.The study of apparent viscosity of alkyl-bonded layers showed that it isapproximately three orders of magnitude higher than the viscosity of corre-sponding free n-alkanes. Recall that n-octadecyl is solid at room temperature;this means that octadecyl chains immobilized on the surface form a rock solidmaterial.
Recent studies of the “phase collapse” effect show that after steady removalof a wetting agent (any previously used organic mobile-phase modifier), waterdoes not wet the hydrophobic inner surface of porous material, and the flowof the mobile phase through the porous space and corresponding transport ofthe analyte molecules to the surface inside the pores is suppressed. The effectis essentially equivalent to an approximately 100-fold decrease of the adsor-bent surface area (the majority of the surface area is inside the pores ofpacking material). This effect is reversible, and pumping of an organic eluent
102 STATIONARY PHASES
Figure 3-13. Slope of the logarithm of homologous series retention.
component restores the flow through the porous space, although, dependingon the adsorbent porosity, it may require up to several hours of organic flow.The smaller the pores, the longer it takes.
Polar embedded stationary phases include a nonionizible polar groupembedded into the bonded chain. Symmetry-Shield RP18 (Waters) and Supel-cosil ABZ (Supelco) are examples of this type of bonding. Another exampleis Synergi Fusion, (Phenomenex) which uses a polar embedded ligand and ahydrophobic ligand.The polar embedded ligands do not contain nitrogen func-tionality. Other types of commercially available polar embedded phasesinclude XBridge Shield RP18 (Waters), Synergy Polar RP, Synergy Hydro-RP(Phenomenex), Zorbax SB-AQ (Agilent), YMC-Pack ODS-AQ (YMC),Dionex Acclaim PA (Dionex), and HiChrom ACE 3 AQ (ACE).
The second reason in the introduction of polar groups in the bonded ligandsis that these groups interact with residual silanols, which make the silanolseffectively inactive for the interaction with polar or basic analytes. Sometimesthese phases are also end-capped with polar end-capping groups.These phasesalso show a significant difference in selectivity compared to conventional C18-type phases. In some cases they show improvement in the peak shape for basiccomponents.
3.6.4 Structure of the Bonded Layer
Bonded alkyl ligands are flexible, although their flexibility is significantlyrestricted by immobilization on the surface; also, the higher the ligand bondingdensity, the less flexibility these chains have.
The main goal of chemical modification of the surface is to create a prefer-ably uniform surface with a selected type of interactions. Energetic uniformityof the surface is dependent on the ligand’s bonding density, distribution, andconformations. An additional desirable feature is hydrolytic stability, which inmost cases is achieved by proper shielding of anchoring bonds.
Shielding of the base material, leading to the elimination of the influenceof residual silanols, is essentially the main focus in the development of mostrecent packing materials.
SURFACE OF CHEMICALLY MODIFIED MATERIAL 103
The efficiency of the substrate shielding is dependent on the local densityof bonded ligands and their overall distribution on the surface. Three differ-ent types of surface ligand distribution could be distinguished: random,uniform, and island-like. These distributions are illustrated in Figure 3-14.
Type of bonding distribution is significantly dependent on the conditionsunder which the bonding reaction is performed. Type of catalyst (usuallyamine), reagent concentration, temperature, and presence of residualadsorbed water on the substrate surface affect this process. Detailed discus-sion of this could be found in reference 61.
Arrangement of the bonded ligands on the surface, along with conforma-tion of these ligands and their occupied volume, is also important for under-standing of the shielding effect. Berendsen et al. [62] studied the variation ofthe specific pore volume with surface modification. Recently, this obviousdecrease of adsorbent pore volume was correlated with molecular volume ofbonded ligands [63]. It was shown that molecular volume of bonded ligandscalculated from the volume of bonded layer and bonding density correspondsto that for liquid normal alkanes of similar chain length (Figure 3-15).
A similar study was performed on packed columns at HPLC conditions, andit was found that at any composition of the mobile phase, regardless of the typeof organic modifier (THF, methanol or acetonitrile), the volume of the bondedlayer corresponds to the densest arrangement of bonded ligands [60].
Molecular conformation of bonded ligands and their degree of freedom isdependent on bonding density. The higher the bonding density, the lower thenumber of possible conformations and thus the less mobility the bondedchains have. Immobilization of ligands on the surface already restrict theirmobility, so if we compare the state of free C18 molecules (n-octadecyl) withimmobilized octadecyl, we can expect more rigid (or solid-like) behavior ofimmobilized chain. Indeed, the study of the viscosity of bonded layers [64]
104 STATIONARY PHASES
Figure 3-14. Distribution of bonded ligands at low, average, and high bonding density for island, random, and uniform bonding. (Reprinted from reference 18, withpermission.)
showed that the apparent viscosity of alkyl chains in the bonded layerincreased by approximately two orders of magnitude compared to the viscos-ity of corresponding n-alkanes. Conformation of bonded ligands could beinterpreted as shown in Figure 3-16.
3.6.5 Density of Bonded Ligands
Bonding density is a surface concentration of bonded ligands, and it isexpressed in either number of moles per square meter (μmol/m2) or in numberof groups per square nanometer (groups/nm2). Unit conversion is shown inequation (3-7).
The term bonding density is constantly used throughout this book. This isprobably the most important characteristic of the bonded phase. The higherthe bonding density, the more hydrophobic the adsorbent surface, the betterthe shielding of residual silanols, and the higher the hydrolytic stability.
Above we briefly discussed the limitations on possible values of bondingdensity (Section 3.6.1). Molecular volume of bonded ligands is one of theselimitations. If the most stretched conformation of a ligand has length l and itsmolar volume is v, then the minimum area, ω, it occupies on the surface willbe w = v/l and the maximum bonding density will be dmax = 1/w. This maximumdensity is calculated for the flat surface, while on the concave internal surfaceof the pore the maximum density is lower and could be expressed as
(3-13)dv
llR
b⋅ = −⎛⎝
⎞⎠max
12
2
SURFACE OF CHEMICALLY MODIFIED MATERIAL 105
Figure 3-15. Correlation of molecular volume of bonded n-alkyl ligands with that forliquid n-alkanes [63].
where v is molar volume of the ligand, l is maximum length of the ligand,and R is pore radius. The molecular volume for a C18 ligand is estimated as630Å3 with a maximum length in all-trans conformation is 24Å.
Maximum density means that the whole volume of a surface layer of thick-ness l is actually filled with bonded ligands and is calculated for a uniformcylindrical surface. In reality, pores are interconnected and have a certain poresize distribution as well, and there are often gaps between bonded molecules(accessible silanols), so real values are usually lower as it could be seen inFigure 3-17.
Bonding density cannot be measured directly; the measured value is either(a) carbon content on modified material, (b) weight loss after ashing in theoven, or (c) thermogravimetric weight loss between 200°C and 700°C. Carbon
106 STATIONARY PHASES
Figure 3-16. Hypothetical conformations of C18 chains on silica surface. (Reprintedfrom reference 63, with permission.)
content is usually expressed as a percent of carbon atoms in a modified sampleby weight. Sometimes it is regarded as an indirect measure of the surfacehydrophobicity. We have to emphasize that this is highly misleading becauseit is not related to the available surface area.As an illustration we can comparetwo adsorbents modified with C18 chains (Table 3-3).
The first adsorbent in Table 3-3 has only 0.24% of carbon, while the secondadsorbent has almost a 50-fold higher content (12%); this indicates that thesecond adsorbent has 50 times more bonded ligands than the first adsorbent.On the other hand, the second adsorbent has 80 times higher surface area andall these bonded ligands are spread on this surface, yielding lower bondingdensity than the first adsorbent.
Carbon content is obtained from CHN analysis of modified adsorbentsample. This analysis is usually based on the determination of the amount ofCO2 gas produced after combustion of the sample of known weight in theoxygen atmosphere—the standard procedure for the determination of thebulk formula of organic compounds. In contrast to the organic compounds,
SURFACE OF CHEMICALLY MODIFIED MATERIAL 107
Figure 3-17. Dependence of maximum bonding density on the adsorbent pore diam-eter. Circles are the experimental points from references 63, and 65–67.
TABLE 3-3. Comparison of the Carbon Load and Surface Density Values
Carbon Load Surface Area Bonding DensityAdsorbent (%w/w) (m2/g) (μMol/m2)
1 0.24 3.6 4.02 12 320 2.3
modified HPLC adsorbents contain a noncombustible silica matrix. Thismatrix can melt at the combustion conditions set on CHN analyzer, and thismelting can sometimes prevent complete combustion of ligands bonded insidethe small pores of the sample (occlusion). It is advisable to compare the dataobtained at the different combustion conditions (amount of oxygen in theoven, speed of heating of inductive oven, etc.).
Bonding density is calculated using the value of carbon content (from CHNanalysis) in carbon %w/w and the specific surface area, obtained from the BETanalysis of base silica. Calculation is performed using the equation originallyintroduced by Berendsen and de Galan [68]:
(3-14)
where C% is the carbon percent by weight, nc is the number of carbons inbonded ligand, MW is the molecular weight of bonded ligand, and S is thesilica surface area. This expression is only applicable for monomeric bonding.In the case of polymeric bonding, the effect of crosslinkage should be takeninto account, although it is usually insignificant.
Calculation of the bonding density for polymeric bonding is more accurateif C% from CHN analysis is used, because weight loss during ashing or TGAanalyses is dependent on the decomposition pattern. In the case of a verticallypolymerized bonded phase, decomposition may involve a siloxane backbone,and association of the weight loss with the ligands molecular weight is essen-tially impossible. Carbon content, on the other hand, is only dependent on theoriginal reagent structure.
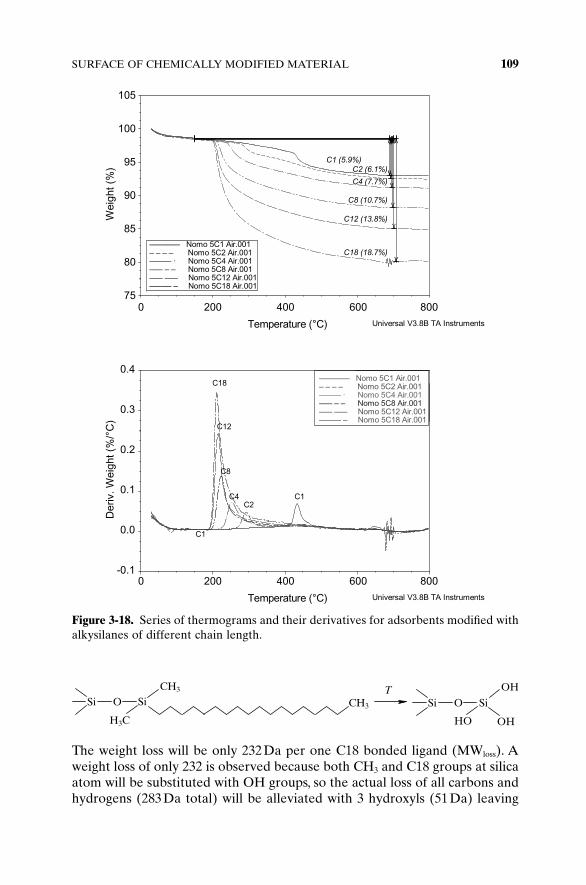
Carbon content determination is often substituted by the measurement ofthe weight loss of the modified sample heated in the oven from 200°C to900°C. It is assumed that all physically adsorbed molecules are removed beforereaching 200°C and that above 200°C, only the decomposition of organicbonded ligands is occurring. Detailed study of thermogravimetric analyses ofchemically modified adsorbents shows some significant deviations. Figure 3-18shows thermograms of silica modified with alkyl ligands of different lengthmeasured from 40°C to 800°C.
One can note that the decomposition of bonded ligands starts slightlybefore 200°C and that the decomposition/combustion of methyl groupsattached to silica (C1) occurred above 400°C. At 600°C the decomposition ofbonded organic layer is completed. Above 800°C, additional weight loss isusually observed. This weight loss is the major source of errors in bondingdensity determination, and it is not related to the decomposition of any organicbut rather dehydroxylation of base silica and loss of water molecules occludedin the silica matrix.
Calculation of the bonding density on the basis of weight loss data is onlyapproximate since it requires the assumption of the chemical decompositionpattern—for example, the following conversion:
dC
n C Sb
c
μmol mMW
2[ ] =− −( )
⋅101200 1
16 %%
108 STATIONARY PHASES
The weight loss will be only 232Da per one C18 bonded ligand (MWloss). Aweight loss of only 232 is observed because both CH3 and C18 groups at silicaatom will be substituted with OH groups, so the actual loss of all carbons andhydrogens (283Da total) will be alleviated with 3 hydroxyls (51Da) leaving
SURFACE OF CHEMICALLY MODIFIED MATERIAL 109
Figure 3-18. Series of thermograms and their derivatives for adsorbents modified withalkysilanes of different chain length.
the total loss to be equal to 232Da. Each bonded ligand increases the weightof base silica during modification process by 310Da (MWlig). The percent ofthe weight loss (Ploss) during thermal decomposition could be expressed as
(3-15)
Solving this expression for bonding density (db), we obtain
(3-16)
The actual decomposition of bonded ligands can be different from what weassume in the above calculation (weight loss), and corresponding bondingdensity values will be very approximate if based on the data from thermo-gravimetry or “ashing” techniques. The formation of trihydroxysilane is highlydoubtful, and active silica dehydration could be observed at temperaturesabove 600°C [69].
3.6.6 Residual Silanoles
As we mentioned above, chemically modified silica always retains a significantamount of residual silanols. In fact, at least half of the original silanols on thesilica surface remain unreacted after chemical modification. Silanols haveacidic nature, but their ionization constants are highly dependent on thesurface environment and on silica purity. Silanol pKa is estimated to bebetween 5 and 7 [7].
Proton donor ability of surface silanols is believed to be the source of peaktailing for analytes with proton acceptor functionality (usually basic analytes).The presence of impurities such as iron, boron, and aluminum [70] in bulksilica decreases the silanol pKa and decrease the hydrolytic stability of bondedphases.
All these effects are strongly dependent on the surface concentration ofbonded ligands (bonding density), and despite the presence of a significantamount of unreacted silanols on the silica surface, only the silanols accessiblefor analytes should be considered.
This shielding effect and variable conformation of bonded ligands makesthe estimate of the amount of accessible residual silanols virtually impossible.
In general, the more uniform the silica surface and the higher the bondingdensity, the less the residual silanols effect one should expect on that HPLCadsorbent.
3.6.7 Surface Area of Modified Adsorbent
The measurement of the silica surface area is well established; however, theassessment of the surface area of chemically modified porous silica brings a
dP
P Sb =
−⋅loss
loss loss lig100MW MW1
Pd S
d Sb
bloss
loss
lig
MWMW
=+ 1
100
110 STATIONARY PHASES
host of problems. It is obvious that chemical modification should decrease thesurface area of porous material, but the degree of this decrease will be depen-dent on the density of bonding of organic ligands on the surface. If the bondingdensity is not very high, which leaves significant conformational freedom tothe bonded chains, this may cause a significant roughness of the new surface.Also, the assessment of the surface area of the modified adsorbent is compli-cated due to the uncertainty of the molecular area of the adsorbate used forthe surface area measurement. The most common adsorbate is nitrogen, andits molecular area on the silica surface is assumed to be equal to 16.2Å2. Inthe scientific literature [15, 71] there are number of indications that this areais significantly higher on the hydrophobic surface. Essentially this is due to theincreased lateral freedom of nitrogen molecule on the nonpolar surface.
As an example of the variation of the surface area of modified adsorbents,we discuss the series of silicas modified with alkylsilanes of different length[63]. In Figure 3-19 the dependence of the surface area on the number ofcarbon atoms of attached ligands are shown.
The calculation of the adsorbent surface area using BET theory involvesthe estimation of the molecular cross-sectional area of nitrogen molecule [15].In general it is assumed to be equal to 16.2Å2 per nitrogen molecule on thesurface, but this value is the subject of intense criticism during the past 30 years[72].
It has been shown that nitrogen occupies a larger area on hydrophobic sur-faces than on polar surfaces. The nitrogen molecular area on hydrophobic surfaces is estimated to be between 19 and 22Å2 [71].
Adsorbent surface area is calculated as the product of the monolayer capac-ity estimated from BET equation and nitrogen molecular area, ωN2
. If the
SURFACE OF CHEMICALLY MODIFIED MATERIAL 111
Figure 3-19. Different ways of measuring the modified adsorbent surface area.
specific surface area of a hydrophobic adsorbent was determined using thevalue of ωN2
= 16.2Å2, then the total adsorbent area would be underestimated.Correct comparison of the surface area of different modified adsorbentsshould also be done relative to 1g of bare silica adsorbent.
The surface area dependencies on the number of carbons of the modifiedadsorbents measured with LTNA corrected for the different factors describedabove are shown in Figure 3-19. A plot of the directly measured surface areavalues shows a significant drop of the surface area between bare silica and C1-modified adsorbent (Figure 3-19, curve 4). Bonding a monolayer of relativelysmall trimethylsilane molecules could not cause this (almost 70m2/g) drop ina surface area value. However, the increase of the effective molecular area ofnitrogen from 16.2 to 20.5Å2 will cause exactly this error in the adsorbentsurface measurement. The measured surface area values were corrected usinga nitrogen molecular area of 20.5Å2. (Figure 3-19, curve 2)
On the other hand, a correct comparison of the surface areas of modifiedmaterials should be done by relating measured values to the same originalsilica weight (Figure 3-19, curve 3). As could be seen from Figure 3-19, an addition of the correction for the mass of silica to the surface alreadycorrected for the increased molecular area of the nitrogen leads to the significant increase of the surface areas for adsorbents modified with relativelyshort alkyl chains (Figure 3.19, curve 1).
Although it looks strange, a restricted mobility of anchored short alkanesmay actually cause an appearance of significant surface heterogeneity (rough-ness) which leads to the increase of the “monolayer” capacity and results inan increase of the total surface area. This is probably not the true surface areavalue that will play any role in the HPLC process, and it is doubtful that anyof these values may be relevant for the description of HPLC retention.
The assessment of the surface area of modified adsorbent is extremelyuncertain. Accounting for different types of corrections may lead to the sig-nificant differences in the calculated surface areas of the same material. Prob-ably the dominating factor is the roughness of the surface of modified silica.Differences in the alkyl chain conformations may lead to the completely dif-ferent values for the same material. Possible occlusion of nitrogen moleculesbetween alkyl chains adds additional uncertainty [73].
One definite surface parameter, which is also common to all related modi-fied adsorbents, is the surface area of original bare silica. It is probably themost appropriate to relate all processes to the surface of bare silica (makingcorresponding corrections for modified adsorbents on the fraction of the silicain 1g of actual material).
Total surface area of silica in the HPLC column could be calculated usingthe following equation, provided that V0, Vex, Vpore, SSiO2
, and bonding density(db) are known.
(3-17)SS V V
V S d nb cSiOtotal SiO ex
pore SiO2
2
2
= −( )+ +( )[ ]
0
1 58 14
112 STATIONARY PHASES
where nc is the number of carbons in the main alkyl chain of the bonded phase.All these complications could be largely avoided if we use the surface of
base silica instead. This is more beneficial for chromatographic purposes,because this will simplify the comparison of different adsorbents made on thebasis of the same silica, and it also simplifies the assessment of the total surfacearea in the column.
Indeed, if we have two columns packed with two different reversed-phaseadsorbents made from the same silica, and if, for example, the total surfacearea in both columns is the same, then the difference in the retention of thesame analyte on both columns could be only associated with the effect of theanalyte–bonded-phase interactions. If, on the other hand, we would estimatethe actual surface area of modified adsorbents and find that it is significantlydifferent, then the difference in the retention cannot be associated with theinteractions alone since the available area is different, and we would need toconsider surface specific interactions and surface specific retention.
3.7 POLYMER-BASED ADSORBENTS
The polymer gels are usually synthesized by suspending the monomers, acrosslinking reagent, and a polymerization initiator in a suitable porogenicdiluent and rapidily stirring the mixture in the presence of water to produceorganic-phase droplets.The size of these droplets defines the size of the result-ing polymer particles.The crosslinking reagent forms a rigid three-dimensionalstructure the polymer. The porogenic diluent provides the macroporous struc-ture to the gel. The proper selection of the porogen allows the control of thepore size, pore size distribution, and pore geometry.
Polymer-based adsorbents are not widely used in the HPLC analysis ofsmall molecules, mainly because of the presence of micropores in the struc-ture of polymer resins [29]. These micropores may trap small molecules, andtheir relatively slow diffusion leads to significant band broadening and overallloss of separation efficiency.
Ion-exchange resins are used to separate molecular ions (cations, anions,amino acids, proteins, peptides) based on their interaction with the ionic resin.Ion-exchange groups are bonded to inert polymeric particles that are gener-ally 3–30μm in diameter to make either anionic or cationic polymers. Anionicpolymers are known as cation exchange resins, and these resins can be strongor weak cation exchange resins that are dependent upon the anionic groupthat is bonded to the polymer. Strong cation-exchange resins usually containstrong acidic groups such as aromatic of aliphatic sulfonic acid or phosphonicacid, and weak cation-exchange resins contain aliphatic (pKa 4–5) or aromaticcarboxylic (pKa 3–4) or phenolic (pKa 8–10) groups bonded to the polymer.Cationic polymers, on the other hand, are known as anion-exchange resins, and these resins can also be weak or strong anion exchanges. Stronganion-exchange resins usually contain strong basic groups such as quaternary
POLYMER-BASED ADSORBENTS 113
ammonium groups (always charged regardless of pH of the mobile phase), andweak anion-exchange resins usually contain primary (pKa 7–8), secondary(pKa 7–9), or tertiary amine groups (pKa 9–10) (with the weaker anion-exchange resins containing primary amine groups, since they have a lowerpKa).
Most ion-exchange resins based on organic polymers are made by theprocess of suspension polymerization. The monomers can be neutral as in thecase of styrene, divinylbenze, methyl acrylate, and acryonitirle, and the result-ing polymer beads are then chemically modified to introduce the acidic orbasic functionality. Styrene-divinylbenzene-based ion exchangers are usuallymore hydrophobic than their more hydrophilic counterparts. The methacry-late matrix offers a more intermediate polarity and a less hydrophobic surfacethan styrenic-based materials.
The number of groups that are bonded to the polymeric matrix is knownas ion-exchange capacity. Ion-exchange capacity is a measure of the quanityof functional groups in the polymer and is usually denoted in the literature asmilliequivalents of functionality per gram of polymer. The greater the ion-exchange capacity, the greater the analyte loading and/or retention of desiredions. Typical values are from 0.5–5mequiv./g. For example, a sodium polystyrene-based sulfonate strong cation-exchange resin is prepared by suspension polymerization of a mixture of styrene and divinylbenzene to makesmall polymeric beads. The beads are then sulfonated using either concen-trated sulfuric acid or chlorosulfonic acid and then neutralized with sodiumhydroxide to give the functionalized product [74]. The ion-exchange capacitycan be controlled by using highly crosslinked packings, which results in a lowerdegree of sulfonation; alternatively, a lesser crosslinked polymeric matrixcould be used, and the degree of the sulfonation can be controlled to thedesired level [8].
For styrene-based strong or weak anion exchangers the styrene-divynylbenzene polymeric beads are usually chloromethylated using alkyl(methyl or ethyl) methylchloroether to form the chloromethyl–polystyreneintermediate. Then the intermediate is further reacted with a tertiary, sec-ondary, or primary amine to make the desired ion-exchange resin (strong orweak). Also, the synthesis of hydrophilic ion exchangers based on hydrophilicmethacrylate resins have gained popularity for the separation of proteinswhere contributions from ionic and hydrophobic interactions (these would besuppressed compared to styrene-based phases) would allow for suitable reten-tion in pharmaceutical analysis. In order to synthesize these phases, thehydroxyl groups of the hydrophilic metharcylate resin (e.g., 2-hydroxyethylmethacrylate) are reacted with various groups to make the desired resin [75].
Some advantages of ion-exchange polymeric resins are that they are gen-erally compatible with 0–100% organic or aqueous solvents, and also differ-ent mobile phases do not cause the supports to shrink or swell. The highercrosslinking allows for a macroporous resin that is less prone to shrinking or
114 STATIONARY PHASES
swelling in aqueous media. Also, these ion-exchange polymeric resins are rel-atively stable from pH 1–13 and can operate up to temperature of 80°C.However, for some polymeric ion-exchange phases the extended stability ofthe phase at high pH > 8 is often compromised when working at temperaturesgreater than 50°C, and it is recommended that the chromatographer shouldseek the specific stability limits (max temperature at certain pH ranges)directly from the column manufacturer. For example, although methacrylate-based packings are stable at pH 2–12, they may be more prone to hydrolyticattack due to ester linkage in the polymeric structure.
3.8 STATIONARY PHASES FOR CHIRAL SEPARATIONS
Separation of optically active isomers is one of the most important areas ofHPLC application in the pharmaceutical industry. Since most of biologicalsystems are predominantly homochiral, different enantiomers of the samedrug could have different effect and potency, and the development of enan-tioselective analytical (and preparative) separation methods is very important.Detailed description of chiral HPLC separation is given in Chapter 22 of thisbook; here we only briefly review the specifics of distinctive types of chiral sta-tionary phases (CSP).
3.8.1 Polysaccharide-Coated Phases
The inherent chiral nature and availability of natural polymers, such as cellu-lose and amylose, were the primary reasons of their use in chiral separations.The ability of cellulose to separate racemic mixtures was first observed inpaper chromatography [76, 77]. The breakthrough point in the use of celluloseand amylose in modern HPLC was achieved with the development of CSPswhere saccharides were adsorbed on the surface of aminopropyl-modifiedmacroporous silica, [78, 79].
Silica-based material provides mechanical stability and high efficiency,while adsorbed polysaccharide helices offer chiral selectivity to the wide rangeof enantiomeric analytes.
Polysaccharide-coated CSP are prepared by coating of their benzoate orcarbamate derivatives on substrate from a solution with the following evapo-ration of the solvent. These phases can be used under RP conditions withaqueous eluents or in normal-phase conditions with limited number of sol-vents to avoid dissolution of the coated layer [80, 81].
The nature and the position of the substituents introduced into the benzenering of the carbamate derivatives essentially define the chiral recognitionability of these CSPs [82]. Higher long-term stability of polysaccharide phaseswas achieved with covalent bonding of polysaccharide to the surface of thesupport [83].
STATIONARY PHASES FOR CHIRAL SEPARATIONS 115
3.8.2 Pirkle-Type Phases
In 1980 W. H. Pirkle introduced packing material with covalently bonded opti-cally active (R)-N-(2-naphthyl) alanine for use as a chiral stationary phase inHPLC [84]. The general principle of enantioselectivity of these phases is thedifference in the overall interaction energy between two enantiomers. Spaceorientation and position of active centers of Pirkle-type phase allows oneenantiomer to achieve stronger interaction because the geometry of the mol-ecule allows its active groups to position close to the active centers of a CSP,while other enantiomers, due to their geometry, are unable to achieve similarinteraction, which causes the first enantiomer to be retained longer on thesurface of this CSP. Pirkle-type phases are very compound-specific, and thesuccessful separation achieved for one type of molecule may not be obtainedfor another, similar analyte.
3.8.3 Protein Phases
Proteins with their inherent chiral nature are used in CSPs in coated andimmobilized form. Bovine serum albumin was the first used in SCP in immo-bilized form [85] for the separation of acidic and neutral compounds.
The α1-acid glycoprotein (AGP) was introduced as chiral selector in 1983by Hermannson [86]. This phase found wide application in the enantiosepa-ration of basic drugs.
Separations on AGP-type phases show unusual temperature and pH depen-dences.An example of the separation on chiral AGP column is shown in Figure3-20, together with the pH dependence of the enantiomers’ retention.
116 STATIONARY PHASES
Figure 3-20. Enantioselective separation of (R,S)-3-hydroxymethyl-2-methyl-9-phenyl-7H-8,9-dihydropyrano[2,3-c]-imidazo[1,2-a]pyridine (solute 1) and (R,S)-3-methylethylether-2-methyl-9-phenyell-7H-8,9-dihydropyrano[2,3-c]-imidazo[1,2-a]pyridine on chiral-AGP column and pH dependence of the retention of (R) and(S) forms of solute 1. Mobile phase: phosphate buffer (pH 7)–acetonitrile (9 :1).Column temperature 40°C. (Reprinted from reference 87, with permission.)
3.8.4 Molecular Imprinted Polymers for Chiral Separations
Molecular imprinted polymers (MIPs) attracted significant attention in the lastdecade as chiral stationary phases targeted for the separation of selected com-pounds used as templates during the synthesis of packing material [88].
The stationary phase in MIP is essentially synthesized around the moleculeof interest, and the nature of adsorptive active centers on the surface could beselected, synthetic ingredients with selected centers are included in the reac-tion mixture together with emulgating agent and pore-forming compounds.After polymerization the template molecules are extracted and material isgrinded, and sieved particles are packed into HPLC column. Because theactive centers were oriented around enantio-pure template molecules duringthe polymerization step, they retain their position in the matrix after templateremoval, and these cavities possess enormous selectivity toward the selectedform of enantiomers. Enantioselectivity of MIP is on the level between 10 and30, which could never be achieved on any other types of CSPs. The other sideof the coin is that due to that enormous selectivity, the kinetics of the masstransfer of selected molecule into the cavity is slow and these columns showenormous tailing (Figure 3-21). Most of the successful applications of MIP arefor preparative separation in the form of solid-phase extraction where effi-ciency is not a critical issue.
STATIONARY PHASES FOR CHIRAL SEPARATIONS 117
Figure 3-21. Example of chiral separation of N-Boc-l-Trp on MIP. (Reprinted with per-mission from reference 89.)
3.9 COLUMNS
In the previous sections of this chapter we mainly discussed the properties ofHPLC packing materials (adsorbents) and the influence of their physical andchemical properties on HPLC retention. In the following sections we will con-centrate primarily on the properties of HPLC column itself.
A modern HPLC column is either stainless steel or plastic tube filled withpacking material (adsorbent) and arranged with end-fittings designed toprovide sealed connection with the eluent inlet and outlet lines and to retainpacking material inside while allowing liquid to pass through.
A column is essentially a device that holds a stationary phase in place,allowing the mobile phase to carry an injected sample through and allowinganalytes to interact with available surface. As we discussed in Section 3.2, theefficiency is mainly dependent on the column type (packed, monolithic, or cap-illary) and particle size for packed columns, or through-pore diameter formonolithic columns.
3.9.1 Capillary / Monolithic / Packed Columns
Comparison of the porous structure of different columns was discussed inSection 3.2; here we emphasize that with a packed column the ratio of parti-cle size to the average interparticle pores (space) is on the level of 3–3.5 whilewith monolithic columns trough-pores are on the level of 6000Å and silicamaterial is only about 1u thick, which makes this ratio 0.5–0.2 or about 10times smaller, thus significantly decreasing the time needed for analyte mole-cules to diffuse into the mesoporous space for the interaction with mainsurface. This allows for much faster flow rates without the loss of the dynamicequilibrium conditions (otherwise known as the slow mass transfer term (C)in the Van Deemter equation).
Cumulative pore volume distribution in the packed column is shown as solidline in Figure 3-22. Note that bimodal type of porosity distribution creates thedifference in the liquid flow through the column, thus limiting column effi-ciency. Silica monolith pore size distribution is also shown in the Figure 3-22. The main difference with packed columns is the volume of major channels.The size of main channels in the monolith bed is comparable to the averagesize of interparticle space in the packed bed, but its volume is significantlyhigher. This reduces the column flow resistance, and monolith columns canoperate at three to four times higher flow rates compared to similar packedcolumns. Faster flow rates up to 5–10mL/min are normal for these types ofcolumns.
A monolithic column can be defined as a column consisting of one piece ofsolid with a defined pore structure that possesses interconnected skeletons and interconnected flow paths (through-pores) and mesopores. A monolithicsilica column consists of micron-sized skeletons (1–2μm), through-pores (upto 8μm), and mesopores (10–12nm). The mesopores provide the needed
118 STATIONARY PHASES
surface area for retention. SEM photographs of monolithic silica columns haveshown that both the silica skeletons and the through-pores are co-continuous.A monolithic column with small-sized skeletons and large through-pores havea large (through-pore size)/(skeleton size) ratio, commonly 1–4, and can simul-taneously provide high permeability and high column efficiency [90–93].
When monolithic silica columns are prepared in a fused silica capillary, thesilica network structure can be bonded to the tube wall. They can be used asa column directly after preparation, or as a reversed-phase adsorbent afteralkyl or some other type of modification. The porosity of monolithic silicacolumns is much greater than that of a particle-packed column. A major dif-ference is seen in interstitial porosities: 65–70% for monolithic silica preparedin a mold, and higher than 80% for those prepared in a capillary, comparedto 40% for a particle-packed column. A comparison of the separations ofcytochrome triptic digest on packed and monolithic colums is shown in Figure3-23. The separations are nearly identical except that on monolithic column itis ten times faster. Figure 3-24 shows the dependence of the backpressure gen-erated on the system as a function of the flow rate for packed column and aset of different monolithic columns. The slope on all monolithic columns is thesame, and it is approximately five times lower than that on a packed column.Additional information on fast HPLC on monolithic columns is given inChapter 17.
Columns packed with nonporous particles have also been available on themarket for more than 10 years. These columns do not have bimodal overall
COLUMNS 119
Figure 3-22. Cumulative pore volume distribution of different HPLC columns indi-cating monomodal pore size distribution for polymer monolith and bimodal distribu-tions for both packed particulate silica and silica monolith columns. (Reprinted fromreference 90, with permission.)
pore size distribution and thus demonstrate exceptional efficiency. The maindrawback of these columns is their available surface area and consequentlytheir loading capacity.
If 1g of conventional porous packing material has an average of 300m2/gsurface area, the same 1g of nonporous packing material with particle diam-eter of just 1μm has only 2.7m2/g or about 100 times lower surface area. Thismeans that these columns require approximately 100 times lower injectionvolume and higher detector sensitivity.
Waters recently introduced columns packed with 1.7- to 1.8-μm porous par-ticles and a specially designed HPLC system, which can operate at pressuresup to 1000atm. These columns do not show significant increase of the effi-ciency compared to conventional columns, but higher flow rates increase thespeed of analysis and an increase of resolution per unit time may be obtained.
120 STATIONARY PHASES
Figure 3-23. RP separation of bovine cytochrome c tryptic digest at flow rates (A) 1.0mL/min with 60-min gradient and (B) 10.0mL/min with 6-min gradient. (Reprintedfrom reference 95, with permission.)
3.9.1.1 Chromatographic Properties of Monolithic Columns. The majorchromatographic features of monolithic silica columns are (a) high perme-ability based on large through-pores and (b) a large number of theoreticalplates per column due to small-sized skeletons (Figure 3-25). There are twomain types of monolithic silica columns: (1) prepared in a mold, only C8 andC18 available (4.6mm i.d. × 5 or 10cm, through-pore size = 2μm, skeleton size= 1μm) and (2) the capillary type, none commercially available; however, someexperimental research-type phases exist (conventionally, 50- to 100-μm i.d. ×25–130cm, through-pore size = 8μm, skeleton size = 2μm).
The main benefit of monolithic columns is the separation speed. As anexample of the practical use of ultrafast separation, the two-dimensionalHPLC separation of tryptic digest BSA is shown. The fractions of the columneffluent from the first dimension (IEX) separation was collected for 2min eachand injected into the second-dimension monolithic column (RP).The run timefor the second dimension could not be more than 2min (more than fractioncollection time), and the monolithic column provided fast and efficient separation (Figure 3-26).
Vervoort et al. [98]. did an important theoretical modeling study of the influ-ence of monolith structure heterogeneity on the efficiency. They confirm thatin silica monolith the plate height to a large extent is determined by pore het-erogeneity, and improvement in the uniformity of the through-pores in amonolith structure may result in 2- to 2.5-fold efficiency increase.
Currently the majority of commercially available columns are packed withporous particles. Monolithic columns are rapidly gaining popularity, although
COLUMNS 121
Figure 3-24. Column backpressure as a function of the flow rate. Backpressure com-parison on conventional and monolithic column (silica) Circles denote Purospher-C18packed column; closed squares denote equipment pressure drop without the column;other symbols denote different monolithic columns, all in one line. (Reprinted fromreference 96, with permission.)
there is still a long road ahead before they get a comparable market share.The third type of column is capillaries, which are also commercially availablebut used exclusively for research purposes and for applications with lowsample amounts. Capillary columns could be either packed or monolith oreven just simple open-tubular. All of them are mainly used in capillary elec-trochromatography (packed and monolith types) or in capillary elec-trophoresis (open tubular type).
3.9.1.2 System Requirements. Column dimensions bring some limitations tothe HPLC system. Generally, the smaller the column, the smaller the optimuminjection volume and detector flow-cell. Volume of the injected sample essen-tially determines the starting width of chromatographic zone. All theoreticaldescriptions of column efficiency are based on the infinitively small originalzone width. If the estimated theoretical column efficiency is expected to be10,000 theoretical plates on a 4.6 × 150-mm column, then the injection of 100-μL sample on this column will decrease the efficiency for early eluting com-pounds by about five times. A simple example can illustrate this. Consideringthe same column (4.6 × 150mm) with 10,000 theoretical plates efficiency, onecan easily estimate the expected peak width using well-known expression
(3-19)NVw
wV
NR
bb
R= ⎛⎝
⎞⎠ ⇒ =16
42
122 STATIONARY PHASES
Figure 3-25. SEM photographs of monolithic silica columns: (a) Monolithic silica pre-pared from TMOS in a test tube; (b–e) prepared from a 3 :1 mixture of TMOS andMTMS in fused silica capillary; (b) 50-mm i.d., silica skeleton size 2mm, through-poresize 4.5mm; (c) 50mm i.d.; (d) 100mm i.d., and (e) 200-mm i.d. (c)–(e) Silica skeletonsize 1.5mm, through-pore size 2.0mm. (Reprinted from reference 97, with permission.)
For the mixture of benzene and phenanthrene eluted on a C18-type columnwith 70/30 acetonitrile/water eluent (1mL/min flow rate), benzene retentionwill be 2.2mL and phenanthrene will be eluted at 14.6mL. Column voidvolume is estimated to be approximately 1.7mL. Using above expression, onecan calculate the expected peak width for benzene (88 μL) and phenanthene(584μL). If the injection volume is 100 μL, then the injected original peakwidth will be higher than expected peak width of eluted first peak (earlyeluting component).
On the other hand, for highly retained analyte (phenanthrene) the finalpeak width will not be significantly greater than theoretically estimated. Thisis because this component shows strong interaction with the stationary phase;and while it is being loaded on the column, it will tend to adsorb on the surfaceimmediately after it comes into contact with the stationary phase; as a result,even though it takes up to 6 sec to transfer all 100 μL to the column, phenan-threne will be concentrated on the top portion of the column, the so-calledadsorption compression effect (Figure 3-27).
COLUMNS 123
Figure 3-26. Two-dimensional separation of tryptic digest of BSA by simple 2D-HPLC.First-D cation exchange separation (horizontal axis), MCI CQK-31S 5-mm (50mm,2.1-mm i.d.) column, 2nd-D reversed-phase separation (vertical axis), monolithic silica-C18 Chromolith Flash (25mm, 4.6mm i.d.) column. The fractionation at the 1st-D wasdone every 2min. (Reprinted from reference 98, with permission.)
This example emphasizes the importance of balancing the column dimen-sions and the injection volume, with the required analysis time and sensitivity.If the main goal is the speed of analysis, then a smaller the injection volumeis better; if, on the other hand, the sensitivity is critical, then it is possible touse a large injection volume, but the chromatographic conditions should beadjusted in such a way that target analytes will have strong interactions withthe stationary phase, and an adsorption compression effect will compensatethe loss of efficiency.
As a general rule, the injection volume should be at least 10 times smallerthan the theoretical peak width of a component eluting at the void volume.For the example shown above, this volume should be less than 8 μL.
Another useful rule is that the volume of the detector flow cell should beless than the estimated injection volume. Flow cell volume could be consid-ered as the hypothetical peak slice used for digital quantitation. The amountof analyte in the flow cell at the specific moment of time is equal to the averageconcentration in the cell multiplied by its volume. The smaller the peak slice,the more accurate the quantitation. At least 15–20 points needed for theproper description of symmetrical Gaussian peak. In the example above, weestimated the optimum injection volume as one-tenth of the earliest peak, andthe flow cell volume should be even smaller, 5 μL for the above example.
3.9.1.3 Loadability. Column loadability is a controversial subject because,as it is commonly accepted, the appearance of asymmetrical peaks (peaktailing) is regarded as an overloading phenomenon. On the other hand, asym-metrical peaks are often observed for only one or a few components of sepa-rated mixture, while others show symmetrical peaks in a wide concentrationrange as shown in Figure 3-28. The overloading effect is independent of thewavelength of the detection.
The other overloading effect that is rarely observed in HPLC separationsis on the columns with very low surface area, like columns packed with non-porous particles. In figure 3-29 the retention of 0.1% solution of benzene isshown. When only 1 μL is injected, the resulting peak shows only slight tailing;however, when the injection volume is increased to 5 μL, a severe shoulder in
124 STATIONARY PHASES
Figure 3-27. Effect of the injection volume on the peak width of early and late elutinganalytes.
the front of the peak is observed. This is because in 5 μL of 0.1v/v% solution,the amount of benzene molecules is too large for the available (∼4m2) totaladsorbent surface in the column. While a portion of benzene molecules isadsorbed on the surface, the rest is carried by the mobile phase and elutedbefore the retained peak (this is an oversimplified description of the actualphenomenon and represents an extreme case of overloading).
Peak tailing is the most commonly observed effect of sample overloading.In essence, in most cases this effect is associated with nonlinear adsorptionisotherms. In Chapter 2 the relationship of the retention volume and the deriv-ative of the excess adsorption isotherm of the analyte on given stationaryphase surface was derived. If the isotherm is linear within the injected con-centration region, all components of the chromatographic zone are moving
COLUMNS 125
Figure 3-28. Elution profile of two components. (Reprinted from reference 99, withpermission.)
Figure 3-29. Retention of benzene on Kovasil-RP18 column (50 × 4.6mm, nonporousparticles 1.5 μm).
with the constant velocity. If, on the other hand, the isotherm is convex to they-axis, then the higher the concentration, the lower the derivative of theadsorption isotherm and, consequentially, the faster the velocity of this par-ticular concentration. In other words, a chromatographic zone with higher con-centration will move faster, causing the sharpening of the peak front andformation of the noticeable tail. It is believed that the adsorption isotherm hasa linear region at very low concentrations; at these concentrations, peaks aresymmetrical. If the analyte concentration exceeds this linear region, its peakwill show tailing.
Any types of adsorption isotherm functions do not have any region withconstant derivative, and natural existence of this region would mean the breakin the continuous variation of system properties, which could not exist. Thisquasi-linear region essentially means the region where the dispersionprocesses (diffusion, band broadening) significantly exceeded the effects ofisotherm nonlinearity, and chromatographic peaks appear almost symmetrical(within the accuracy of our detection and data acquisition system).
The third overloading effect is usually associated with the presence of acces-sible residual silanols or other strong adsorption sites on the surface of sta-tionary phase. If the surface concentration of these sites is very low, then asmall portion of components sensitive to these sites (usually protonated basicanalytes) will get adsorbed on them, thus increasing the formation of the peaktail. Neutral and nonionizible analytes are usually not sensitive for theseeffects.
3.9.2 Column Cleaning
An HPLC column could be considered as an accumulation medium, such thatany type of compound dissolved in the mobile phase—whether it is an injectedsample or simply an impurity from the mobile phase or packing solvent—willbe somehow retained on the column. Chemically modified reversed-phasecolumns have immobilized flexible ligands attached to the base materialsurface. In Section 3.6 we discussed the behavior of these chains and demon-strated that from a chromatographic point of view they essentially behave asa solid surface. The penetration of the analyte molecules in between thebonded ligands, although possible, has very low probability. The diffusion ofthe probe within the bonded layer is estimated to be about 1000 times slowerthan the diffusion of the analyte in the liquid phase.This means that some mol-ecules could be trapped in the stationary phase and be retained there for along time. These trapped molecules could significantly alter the surface prop-erties of the packing material and gradually change the retention pattern foranalytes analyzed on that column and could eventually lead to gradual elutionof ghost peaks in samples that are analyzed in a sequence. The main source ofthat contamination of the bonded phase is the HPLC mobile phase for usedcolumn and the solvent(s) used (for packing a brand new column). To calcu-late approximate column contamination we assume an average analysis time
126 STATIONARY PHASES
of 30min with 1-mL/min flow with 50% MeCN: 50% water mobile phase that is about 30mL of eluent that passes through the column per injection.Assuming that the total amount of impurities in most HPLC grade solvents isestimated on the level of 3ppm (3mg per liter of solution).Assuming 100 injec-tions on that adsorbent surface with that mobile phase, this equates to about9mg of potential impurities absorbed on the stationary phase. How much ofa typical stationary phase surface would these impurities cover over 100 injec-tions? Assume that potential impurities have a molecular weight of 100g/moland a molecular area of 100Å2/molecule and assume that the typical surfacearea of an adsorbent is 300m2/g.
Therefore about 20% of the stationary phase surface could potentially becovered with these impurities.
Gradual trapping of some impurities in the bonded phase result in thegradual decrease of the column performance, appearance of strong adsorptioncenters, slow variation of the retention of some analyte, loss of the efficiency,and so on. But this trapping is not an irreversible chemisorption process, andin most cases it is not associated with the degradation of the stationary phasedue to the hydrolytic cleavage of bonded ligands or silica dissolution; however,these processes could take place, sometimes to a much higher degree than stationary-phase contamination. If column performance degradation isobserved and this column has not been used at the extreme conditions [toohigh or too low mobile-phase pH and high temperatures (above 50°C)], thenperformance decay is most probably associated with contamination.
The question is, Could these reversed-phase columns be cleaned in a fastand efficient manner? The goal is to force the stationary phase to releasetrapped molecules as fast as possible. However, usual cleaning procedures withwashing with high concentration of organic usually require very long washingtimes. When a column is flushed for any extended period of time, even withvery strong solvent, the stationary phase is essentially in the equilibrium withused solvent, which is not really that effective in releasing trapped moleculesand takes a very long time to desorb off contaminants that came from themobile phase or impurities from samples that did not elute. The equilibriumin the column has to be greatly disturbed to force the release of trapped mol-ecules, and this disturbance could be induced by a sharp change of the eluentcomposition or solvent type. For a reversed-phase column a very efficientremoval of these contaminants could be achieved by a simple sharp changefrom the pure water to pure acetonitrile, and this process is repeated severaltimes as shown in Figure 3-30 for a 150- × 4.6-mm-i.d. column.
%
%
SA Na A
Acovered
2
2
mgTotal surface area MW
Å molecule molecules mol mg 300 m 100g mol
= ⋅ ⋅⋅
= ⋅ × ⋅⋅
⋅ =100 6 10 9100 18
23
COLUMNS 127
It is advisable to start cleaning process with pure water to wash out possi-ble salt and avoid their precipitation in pure acetonitrile. As could be seen inFigure 3-30, after each acetonitrile front the burst of the detector signal occurs,which is related to the release of the contaminants from the column. Thesebursts are gradually decreased with each cycle. The solvent fronts of differentpolarity disturb the phase equilibrium and leads to the release of trappedimpurities. Usually 6 to 10 repeated cycles of the alternating solvent fronts ismore than sufficient for thorough column cleaning. Each front should be aboutone column volume to avoid equilibration with the mobile phase. Therefore,for a 150- × 4.6-mm column (1.7-mL void volume) at 1-mL/min eluent flow,each step could be approximately 1.7min; for a 150- × 3.0-mm-i.d. column (0.7-mL void volume) at 0.7mL/min, each step could be approximately 1min.Also, a more stringent procedure would entail solvents of different polarityfollowing the sequence of water, acetonitrile, and THF and repeating the cycleas described above.
3.9.3 Column Void Volume
The void volume is the volume of the liquid phase inside the column. Theimportance of this parameter has been discussed in Chapter 2. Despite thevery long debates, this is still a subject of significant controversy. Essentially,anyone who intends to measure the column void volume has to answer thequestion if he/she wants correct or estimated (convenient) measurements.
3.9.3.1 Measurement of Void Volume. It is generally believed that the injec-tion of so-called “unretained” component can be used for the measurementof the column void volume. The biggest challenge is to find a compound thatis really unretained. In the last 40 years, many different analytes have been
128 STATIONARY PHASES
Figure 3-30. Mobile-phase composition profile and detector signal (UV 205nm) duringthe column cleaning procedure.
suggested as “void volume markers,” and most of them, if not all, did not passa simple test: Their retention changes with the variation of the eluent compo-sition. In theory, if we accept the above definition of the void volume, then thisvalue should not change with the variation of practically any chromatographicparameters (type and concentration of organic modifier), except probablytemperature.
A void volume marker should travel through the column in the same wayas do eluent molecules. When binary (or tertiary) eluents are used, moleculesof different eluent components actually travel differently through the column.In the theory chapter we discuss the adsorption of the organic eluent compo-nents on the surface of the reversed-phase column; thus, in general, water mol-ecules will move through the column faster than organic molecules. Knox andKaliszan [100] suggested that the actual void volume will be the weightedaverage of the retention of each component:
(3-20)
where xH20 and xorg. are the mole fractions of the eluent components in themixture.
The simplest possible solution is to use a single-component eluent; forexample, inject deuterated acetonitrile in the flow of neat acetonitrile. The isotopic effect (the difference in the retention of molecules with different isotopes), although it exists, could be assumed negligible.
All these methods require the use of the refractive index of mass spec-trometry (MS) detectors, since the detection of the isotopes is not possiblewith conventional ultraviolet (UV) detectors.
These difficulties are inspiring the search for other alternative methods forthe void volume measurements. The main question anyone should answer is,What should the required accuracy be? For any prediction or thermodynamic-type work, the void volume values should be very accurate. For pure analyti-cal purposes or for the comparison of different columns, the use of somemarkers is justifiable insofar as all experimental conditions are kept the sameall the time.
In everyday method development practice, it is important to ensure the sep-aration of target compounds, matrix components, and other impurities. Theelution of the analyte at the void volume means that it did not interact withthe stationary phase and thus could not be separated from other componentsthat do not interact with the surface either. To ensure the analyte interactionwith the stationary phase, it is usually recommended to choose chromato-graphic conditions when any component of interest elutes with at least 1.5 voidvolume values or even greater. The error of the void volume determinationfor these purposes could be 20% or even greater (insofar as these void volumevalues are not used for any calculations but just to estimate where the leastretained analye elutes). The use of uracil, thiourea, or allantoin as analyticalvoid volume markers is most common in practical analytical work.
V V x V x0 = +H O org org2 H2O
COLUMNS 129
3.9.3.2 Other Experimental Methods. It is probably suitable to discuss herecolumn porous structure. Porous space of a conventional packed column con-sists of the interparticle volume (Vip—space around particles of packing) andpore volume (Vp—space inside porous particles). The sum of those two con-stitutes the column void volume. The void volume marker (“unretained”)should be able to evenly distribute itself in these volumes while movingthrough the column. Only in this case the statistical center mass of its peakwill represent the true volume of the liquid phase in the column. In otherwords, its chromatographic behavior should be similar to that of the eluentmolecules in a monocomponent eluent. If a chosen void volume marker com-pound has some preferential interaction with the stationary phase comparedto that of the eluent molecules, it will show positive retention and could notbe used as void marker. If on the other hand it has weaker interaction, it willbe excluded from the adsorbent surface and will elute faster than the real voidtime, meaning that it also could not be used. For any analytical applications(when no thermodynamic dependences are not extracted from experimentaldata), 10% or 15% error in the determination of the void volume are accept-able. It is generally recommended to avoid elution of the component of inter-est with a retention factor lower than 1.5. Accurate methods for thedetermination of the column void volume are discussed in Chapter 2.
3.9.4 Mass of Adsorbent in the Column
The mass of the packing material in the column is a largely underestimatedparameter. As it was discussed in the theory chapter, the retention is propor-tional to the total surface area of the adsorbent in the column. Externalmethods of the surface area measurement determine the specific surface area(in square meters per gram of the material), and the total surface in the columnis a product of the specific surface area of base material and the mass of theadsorbent in the column.
The retention factor, according expression (2-1) from Chapter 2, is
(3-21)
This shows that the retention factor is proportional to the total surface areaof the adsorbent. On the other hand, the selectivity, α, is the ratio of the capac-ity factors and is independent on the total surface area:
(3-22)
Below we compare the retention in the form of traditional retention factors(k′) and surface-specific retention factors (ks) of six different analytes on fourC18-type columns from four different vendors (Figure 3-31).
a = =kk
KK
2
1
2
1
kV V
VV V SK k
SV
KRR= − = + ⇒ =0
00
0
, where
130 STATIONARY PHASES
Table 3-4 shows the relative standard deviation in the retention of the sameanalyte on all columns. For ionized analytes eluted very close to the voidvolume, the retention difference between all columns is significant, but for ana-lytes retained on the column, the RSD of ks is much smaller than k′ and essen-tially within the experimental error range.
Unfortunately, the measurement of the total surface area of the adsorbentin the column is a tedious process that involves several different experimen-tal techniques, and unless column manufacturers choose to provide this infor-mation, it is not feasible that pharmaceutical scientist would be willing tomeasure it.
COLUMNS 131
Figure 3-31. Comparison of the retention factors of different ODS columns. Columns:Luna-C18(2) (Phenomenex), Zorbax XDB C18 (Agilent), SunFire C18 (Waters),YMCPro-Pac C18 (YMC). Conditions: MeCN/water, 0.1% H3PO4 pH 2.1.
TABLE 3-4. Relative Standard Deviation ofConventional and Surface-Specific Retention Factors onDifferent Columns
Here we provide a brief description of the methodology for the estimationof the mass of adsorbent in the column and total surface area.
Note. The total surface area of the reversed-phase adsorbent in the columnis understood as the total surface area of the base unmodified material in thecolumn, since the surface area of the modified material essentially could notbe defined, as discussed in the Section 3.6.7.
The estimation of the amount of adsorbent in the column is based on thecomparison of the total pore volume (Vp.tot [mL]) of the adsorbent in thecolumn with the specific pore volume (Vp [mL/g]) of the same adsorbent deter-mined from the full nitrogen adsorption isotherm. The ratio of these twovalues will give the adsorbent mass. Total pore volume in the column is deter-mined as the difference of the column void volume (V0) and the interparticlevolume (Vip).
Interparticle volume could be measured using GPC as the total exclusionvolume of high-molecular-weight polymers, and the void volume could beaccurately measured as the elution volume of deuterated acetonitrile elutedwith neat acetonitrile. The example of these measurements and comparisonwith the adsorbent mass determined by unpacking the column and weighingthe dried adsorbent are shown in Table 3-5.
(3-23)
As could be seen from the table, the error does not exceed 2.5%, which is verygood for the determination that involves so many different techniques.
REFERENCES
1. N. S. Wilson, J. W. Dolan, L. R. Snyder, P. W. Carr, L. C. Sander, Column selectiv-ity in reversed-phase liquid chromatography III. The physico-chemical basis ofselectivity, J. Chromatogr. A 961 (2002), 217–236.
2. J. Israelachvili, Intermolecular and Surface Forces, Academic Press, Amsterdam,2002.
mV V
Vip
p
=−0
132 STATIONARY PHASES
TABLE 3-5. Comparison of the Calculated and Measured Mass of Adsorbent in theColumn (for Five Different Columns)
3. L. Jelinek and E. Kovats, True surface areas from nitrogen adsorption experi-ments, Langmuir 10 (1994), 4225–4231.
4. T. Issaeva, A. Kourganov, and K. Unger, Super high speed liquid chromatographyof proteins and peptides on non-porous Micra NPS-RP packings, J. Chromatogr.A 846 (1999), 13–23.
5. F. C. Leinweber and U.Tallarek, Chromatographic performance of monolithic andparticulate stationary phases, J. Chromatogr. A 1006 (2003), 207–228.
6. K. K. Unger, Porous Silica, Journal of Chromatography Library, Vol. 16, Elsevier,Amsterdam, 1979.
7. R. K. Iler, The chemistry of Silica, Wiley-Interscience, New York, 1979.8. U. D. Neue, HPLC Columns. Theory, Technology, and Practice, Wiley-WCH, New
York, 1997.9. I. Halasz and M. Naefe, Influence of column parameters on peak broadening in
high-pressure liquid chromatography, Anal Chem. 44 (1972), 76–84.10. R. E. Majors, High-performance liquid chromatography on small particle silica
gel, Anal. Chem. 44 (1972), 1722–1726.11. C. Dewaele and M. Versele, Influence of the particle size distribution of the
packing material in reversed-phase high-performance liquid chromatography,J. Chromatogr. 260 (1983), 13–21.
12. W. Strubert, Herstellung von Hochleistungssäulen Fü die schnelle Flüssigkeits-Chromatographie, Chromatographia 6 (1973), 50–52.
13. S. Brunauer, P. H. Emmet, and E. Teller, Adsorption of gases in multimolecularlayers, J. Am. Che. Soc. 60 (1938), 309–319.
14. W. D. Harkins and G. Jura, Surfaces of solids, J. Am. Chem. Soc. 66 (1944),1362–1366.
15. S. J. Gregg and K. S. W. Sing, Adsorption, Surface Area and Porosity, AcademicPress, London, 1976.
16. B. Mandelbrot, The Fractal Geometry of Nature, San Francisco, Freeman, 1982.17. A. Y. Fadeev, O. R. Borisova, and G. V. Lisichkin, Fractality of porous silica:
A comparison of adsorption and porosimetry data. J. Colloid Interface Sci. 183(1996), 1–19.
18. G. V. Lisichkin (ed.), Chemistry of Bonded Surface Compounds, Fizmatlit,Moscow, 2003.
19. M. Le Page and de Vires, French Patent No. 1475929 (1967).20. K. D. Wyndham, J. E. O’Gara, T. H. Walter, K. H. Glose, N. L. Lawrence, B. A.
Alden, G. S. Izzo, C. J. Hudalla, and P. C. Iraneta, Characterization and evaluationof C18 HPLC stationary phases based on ethyl-bridged hybrid organic/inorganicparticles, Anal. Chem. 75 (2003), 6781–6788.
21. Y.-F. Cheng, T. H. Walter, Z. Lu, P. Iraneta, B. A. Alden, C. Gendreau, U. D. Neue,J. M. Grassi, J. L. Carmaody, J. E. O’Gara, and R. P. Fisk, Hybrid organic–inorganic particle technology: Breaking through traditional barriers of HPLC separations, LC-GC 18 (2000), 1162–1172.
22. J. B. Peri and A. L. Hensley, The surface structure of silica gel, J. Phys. Chem. 72(1968), 2926–2933.
23. Y.-F. Cheng., T. H. Walter, Z. Lu, P.Iraneta, B. A. Alden, C.Gendreau, U. D. Neue,J. M. Grassi, J. L. Carmody, J. E. O’Gara, and R. P. Fisk, Hybrid organic–inorganic
REFERENCES 133
particle technology: Breaking through traditional barriers of HPLC separations,LC-GC 18 (2000), 1162–1172.
24. A. Méndez, E. Bosch, M. Rosés, and U. D. Neue, Comparison of the acidity ofresidual silanol groups in several liquid chromatography columns, J. Chromatogr.A 986 (2003), 33–44.
25. U. D. Neue, A. Méndez, K. Tran, and P. W. Carr, The combined effect of silanolsand the reversed-phase ligand on the retention of positively charged analytes,J. Chromatogr. A 1063 (2005), 35–45.
26. Personal communications.27. F. Chan, L. S. Yeung, R. LoBrutto, and Y. V. Kazakevich, Characterization of
phenyl-type HPLC adsorbents, J. Chromatogr. A 1069, (2005), 217–224.28. XBridge Columns brochure, Waters, Inc., 2006.29. N. Tanaka and M. Araki, Polymer-based packing materials for reversed-phase
liquid chromatography, in J. C. Giddings, E. Grushka, and P. R. Brown (eds.),Advances in Chromatography, Vol. 30, Marcel Dekker, New York, 1989, pp. 81–122.
30. D. Gowanlock, R. Bailey, and F. F. Cantwell, Intra-particle sorption rate and liquidchromatographic bandbroadening in porous polymer packings I. Methodologyand validation of the model, J. Chromatogr. A 726 (1996), 1–23.
31. F. Nevejans and M. Verzele, On the structure and chromatographic behavior ofpolystyrene phases, J. Chromatogr. 406 (1987), 325–342.
32. L. D. Bowers and S. Pedigo , Solvent strength studies on polystyrene-divinylbenzene columns J. Chromatogr. 371 (1986), 243–251.
33. N. Tanaka, T. Ebata, K. Hashizume, K. Hosoya, and M. Araki, Polymer-basedparking materials with backbones for reversed-phase liquid chromatography. Per-formance and retention selectivity, J. Chromatogr. 475 (1989), 195–208.
34. J. V. Dawkins, L. L. Lloyd, and F. P. Warner, Chromatographic characteristics ofpolymer-based high-performance liquid chromatography packings, J. Chro-matogr. 352 (1986), 157–167.
35. J. Li, L. M. Litwinson, and F. F. Cantwell, Intra-particle sorption rate and liquidchromatographic bandbroadening in porous polymer packings II, J. Chromatogr.A 726 (1996), 25–31.
36. J. Li and F. F. Cantwell, Intra-particle sorption rate and liquid chromatographicbandbroadening in porous polymer packings III, J. Chromatogr. A 726 (1996),37–44
37. J. Nawrocki, M. Rigney, A. V. McCormick, and P. W. Carr, Chemistry of zirconiaand its use in chromatography, J. Chromatogr. 657 (1993), 229–282.
38. P. T. Jackson and P. W. Carr, Study of polar and Nonpolar substituted benzenesand aromatic isomers on carbon-coated zirconia and alkyl bonded phases,J. Chromatogr. A 958 (2002), 121–129.
39. M. P. Rigney, E. F. Funkenbusch, and P. W. Carr, Physical and chemical character-ization of microporous zirconia, J. Chromatogr. 499 (1990), 291–304.
40. J. Yu and Z. El Rassi, Reversed-phase liquid chromatography with microspheri-cal octadecyl-zirconia bonded phases, J. Chromatogr. 631 (1993), 91–106.
41. J. Li and P. W. Carr, A study of the efficiency of polybutadiene-coated zirconia asa reversed-phase chromatographic support, Anal. Chem. 69 (1997), 2193–2201.
134 STATIONARY PHASES
42. J. Dai, X.Yang, and P.W. Carr, Comparison of chromatography of octadecyl silanebonded silica and polybutadiene-coated zirconia phases based on diverse set ofcationic drugs, J. Chromatogr. A 1005 (2003), 63–82.
43. C. J. Dunlap, C. V. McNeff, D. Stoll, and P. W. Carr, Zirconia stationary phases forextreme separations, Anal. Chem. 73 (2001), 598A–607A.
44. M. T. Gilbert, J. H. Knox, and B. Kaur, Porous glassy carbon, a new columnspacking material for gas chromatography and high performance liquid chro-matography, Chromatographia 16 (1983),138–145.
45. J. H. Knox and M. T. Gilbert, UK Patent 7 939 449.46. J. H. Knox and M. T. Gilbert, US Patent 4 263 268.47. T. Hanai, Separation of polar compounds using carbon columns, J. Chromatogr.
A 989 (2003), 183–196.48. J. H. Knox, B. Kaur, and G. R. Millward, Structure and performance of porous
graphitic carbon in liquid chromatography, J. Chromatogr. 352 (1986), 3–25.49. P. Ross and J. H. Knox, Carbon-based packing materials for liquid chromatogra-
phy. Structure, performance, and retention mechanisms, in J. C. Giddings,E. Grushka, and P. R. Brown (eds.), Advances in Chromatography, Vol. 37, MarcelDekker, New York, 1997, pp. 73–119.
50. J. Kriz, E. Adamcová, J. H. Knox, and J. Hora, Characterization of adsorbents byhigh-performance liquid chromatography using aromatic hydrocarbons porousgraphite and its comparison with silica gel, alumina, octadecylsilica and phenyl-silica, J. Chromatogr. A 663 (1994), 151–161.
51. N. Tanaka, K. Kimata, K. Hosoya, H. Miyanishi, and T. Araki, Stationary phaseeffects in reversed-phase liquid chromatography, J. Chromatogr. A 656 (1993),265–287.
52. M.-C. Hennion, V. Coquart, S. Guenu, and C. Sella, Retention behaviour of polarcompounds using porous graphitic carbon with water-rich mobile phases, J. Chro-matogr. A 712 (1995), 287–301.
53. A. Karlsson, M. Berglin, and C. Charron, Robustness of the chromatographic sep-aration of alprenolol and related substances using a silica-based stationary phaseand selective retention of metoprolol and related substances on a porous graphiticcarbon stationary phase, J. Chromatogr. A 797 (1998), 75–82.
54. V.A.Tretikh,V.V. Pavlov, K. I.Tkachenko, and A.A. Chuiko, Distribution of struc-tural hydroxyl groups on an Aerosil surface, Theor.Eksp.Khim.11 (1975),415–417.
55. P. Roumeliotis and K. K. Unger, Structure and properties of n-alkyldimethylsilyell-bonded silica reversed-phase packings, J. Chromatogr. 149 (1978), 211–224.
56. G. E. Berendsen, K. A. Pikaart, and L. de Galan Preparation of various bondedphases for HPLC using monochlorosilanes, J. Liquid Chromatogr. 3 (1980),1437–1464.
57. L. R. Snyder, J. J. Kirkland, and J. L. Glajch, Practical HPLC Method Develop-ment, 2nd ed., John Wiley & Sons, New York, 1997.
58. T. Hanai and J. Hubert, Selectivity of phenyl-bonded silica gel, J. Chromatogr. 291(1984), 81–89.
59. S. Heron and S. Tchapla, Retention mechanism in RPLC: Specific effects of pro-piophenyl and multifunctional bonded silicas, J. Chromatogr. A, 725 (1996),205–218.
REFERENCES 135
60. Y. V. Kazakevich, R. LoBrutto, F. Chan, and T. Patel, Interpretation of the excesadsorption isotherms, J. Chromatogr. A 913 (2001), 73–87.
61. A. Y. Fadeev and G. V. Lisichkin, Adsorption of new and modified inorganic sor-bents, in A. Dabrovski and V. A. Tyertykh (eds.), Series Studies in Surface Scienceand Catalysis, Elsevier, Amsterdam, 1995, p. 191.
62. G. E. Berendsen, K. A. Pikaart, and L. De Galan, Preparation of various bondedphases for HPLC using monochlorosilanes, J. Liq. Chromatogr. 3 (1980),1437–1464.
63. I. Rustamov, T. Farcas, F. Ahmed, F. Chan, R. LoBrutto, H. M. McNair, and Y. V.Kazakevich, Geometry of chemically modified silica, J. Chromatogr. 913 (2001),49–63.
64. A. Y. Fadeev, S. M. Staroverov, B. K. Runov, and G. V. Lisichkin, Diffusion ofsorbed pyrene in the bonded layer of reversed-phase silicas: Effect of alkyl chainlength and pore diameter, J. Chromatogr. 558 (1991), 31–42.
65. A.Y. Fadeev, and S. M. Staroverov, Calculation of the characteristics of the bondedlayers of reversed stationary phases, J. Chromatogr. 465 (1989), 233–240.
66. W. Cheng and M. McCown, Effect of alkyl chain length on surface silanization ofsilica, J. Chromatogr, 318 (1985), 173–185.
67. C. Cao, A. Y. Fadeev, and T. J. McCarthy, Reaction of organosilanes with silica incarbon dioxide, Langmuir 17 (2001), 757–762.
68. G. E. Berendsen and L. de Galan, Preparation and chromatographic propertiesof some chemically bonded phases for reversed-phase liquid chromatography,J. Liq. Chromatogr. 1 (1978), 561–586.
69. A. V. Kiselev, Y. S. Nikitin, I. I. Frolov, and Y. I. Yashin, Problems of selectivity andefficiency in liquid–solid chromatography, J. Chromatogr. 91 (1974), 201–206.
70. J. Nawrocki, The silanols group and its role in liquid chromatography, J. Chro-matogr. A 779 (1997), 29–71.
71. N. E. Buyanova, R. V. Zagrafskaya, A. P. Karnaukhov, and A. S. Shepelina, Deter-mination of the area occupied by argon, nitrogen and krypton molecules in amonolayer, Kineti. Catal. 24 (1983), 1011–1023.
72. K. S. W. Sing, D. H. Everett, R. A. W. Haul, et al., Reporting physisorption datafor gas/solid systems, Pure Appl. Chem. 57 (1985), 603–656.
73. E. H. Slaats, J. C. Kraak, W. J. T. Burgman, and H. Poppe, Study of the influence ofcompetition and solvent interaction on retention in liquid–solid chromatographyby measurement if activity coefficients in the mobile phase, J. Chromatogr. 149(1978), 255–270.
74. L. Hughes, Ion exchange resins—The technology behind the mystery, Pharma-ceut. Technol. Eur. 17 (2005), 38–42.
75. P. R. Haddad and P. E. Jackson, Ion Chromatography, Journal of Chromatogra-phy Library, Vol. 46, Elsevier, Amsterdam, 1990.
76. C. E. Dent, Behavior of sixty amino acids and other ninhydrin-reacting substanceson phenol-collidine filter paper chromatograms, with notes as to the occurrenceof some of them in biological fluids, Biochem. J. 43 (1948), 169–180.
77. M. Kotake, T. Sakan, N. Nakamura, and S. Senoh, Resolution into optical isomersof some amino acids by paper chromatography, J. Am. Chem. Soc. 73 (1951),2973–2974.
136 STATIONARY PHASES
78. Y. Okamoto, M. Kawashima, and K. Hatada, Chromatographic resolution. 7.Useful chiral packing materials for high-performance liquid chromatographic res-olution of enantiomers: Phenylcarbamates of polysaccharides coated on silica gel,J. Am. Chem. Soc. 106 (1984), 5357–5359.
79. A. Ichida, T. Shibata, I. Okamoto, Y. Yuki, N. Namikoshi, and Y. Toga, Resolutionof enantiomers by HPLC on cellulose derivatives, Chromatographia 19 (1984),280–287.
80. Y. Okamoto and E.Yashima, Polysaccharide derivatives for chromatographic sep-aration of enantiomers, Chem. Int. Ed. 37 (1998), 1021–1043.
81. E. Yashima, C. Yamamoto, and Y. Okamoto, Polysaccharide-based chiral LCcolumns, Synlett (1998), 344–360.
82. Y. Okamota and Y. Kaida, Polysaccharide derivatives as chiral stationary phasesin HPLC, J. High Resolution Chromatogr. 13 (1990), 708–712.
83. P. Franco, A. Senso, L. Oliveros, and C. Minguillon, Covalently bonded polysac-charide derivatives as chiral stationary phases in high-performance liquid chro-matography, J. Chromatogr. 906 (2001), 155–170.
84. W. H. Pirkle, D. W. House, and J. M. Finn, Broad spectrum resolution of opticalisomers using chiral high-performance liquid chromatographic boned phases,J. Chromatogr. 192 (1980), 143–158.
85. S. Allenmark, B. Bomgren, and H. Boren, Direct liquid chromatographic separa-tion of enantiomers on immobilized protein stationary phases: III. Optical reso-lution of a series of N-aroyl d, l-amino acids by high-performance liquidchromatography onbovine serum albumin covalently bound to silica, J. Chro-matogr. 264 (1983), 63–68.
86. J. Hermansson, Direct liquid chromatographic resolution of racemic drugs usingα1-acid glycoprotein as the chiral stationary phase, J. Chromatogr. 269 (1983),71–80.
87. A. Nystrfm and A. Karlsson, Enantiomeric resolution on chiral-AGP with the aidof experimental design: Unusual effects of mobile phase pH and column tem-perature, J. Chromatogr. 763 (1997), 105–113.
88. G. Wulff, Molecular recognition in polymers prepared by imprinting with tem-plates, Am. Chem. Soc. Symp. Ser. 308 (1986), 186–230.
89. R. Sun, H. Yu, H. Luo, and Z. Shen, Construction and application of a stoichio-metric displacement model for retention in chiral recognition of molecularimprinting J. Chromatogr. A 1055 (2004), 1–9.
90. H. Minakuchi, K. Nakanishi, N. Soga, N. Ishizuka, and N. Tanaka, Anal. Chem., 68(1996), 3498–3501.
91. M. S. Fields, Silica Xerogel as a continuous column support for high-performanceliquid chromatography, Anal. Chem. 68 (1996), 2709–2712.
92. N. Ishizuka, H. Minakuchi, K. Nakanishi, N. Soga, H. Nagayama, K. Hosoya, andN. Tanaka, Anal. Chem. 72 (2000), 1275–1280.
93. M. Motokawa, H. Kobayashi, N. Ishizuka, H. Minakuchi, K. Nakanishi, H.Jinnai, K. Hosoya, T. Ikegami, and N. Tanaka, J. Chromatogr. A 961 (2002),53–63.
94. L. Xiong, R. Zhang, and F. E. Reginer, Potential of silica monolithic columns inpeptide separations, J. Chromatogr. 1030 (2004), 187–194.
REFERENCES 137
95. B. Bidlingmeyer, K. K. Unger, and N. van Doehren, Comparative study on thecolumn performance in microparticulate 5-μm C18-bonded and monolithic C18-bonded reversed-phase columns in high-performance liquid chromatography,J. Chromatogr. A 832 (1999), 11–16.
96. T. Ikegami and N. Tanaka, Monolithic columns for high-efficiency HPLC separa-tions, Curr. Opin. Chem. Biol. 8 (2004), 527–533.
97. N. Tanaka, H. Kimura, D. Tokuda, K. Hosoya, T. Ikegami, N. Ishizuka,H. Minakuchi, K. Nakanishi, Y. Shintani, M. Furuno, K. Cabrera, Simple and com-prehensive two-dimensional reversed-phase HPLC using monolithic columns,Anal. Chem. 76 (2004), 1273–1281.
98. N. Vervoort , P. Gzil , G. V. Baron, and G. Desmet, Model column structure for theanalysis of the flow and band-broadening characteristics of silica monoliths,J. Chromatogr. 1030 (2004) 177–186.
99. J. Zhu and C. Coscolluella, Chromatographic assay of pharmaceutical compoundsunder column overloading J. Chromatogr. B: Biomed. Sci.Appl. 741 (2000), 55–65.
100. J. Knox and R. Kaliszan, Theory of solvent disturbance peaks and experimentaldetermination of thermodynamic dead-volume in column liquid chromatography,J. Chromatogr. 349 (1985), 211–234.