M. Vahdati et al, Journal of Advanced Materials and Processing, Vol.3, No. 1, 2015, 15-28 15 Statistical Analysis and Optimization of Factors Affecting the Surface Roughness in the UVaSPIF Process Using Response Surface Methodology M. Vahdati a, *, R. A. Mahdavinejad a , S. Amini b , M. Moradi c a Department of Mechanical Engineering, University of Tehran, Tehran, Iran. b Department of Mechanical Engineering, University of Kashan, Kashan, Iran. c Department of Mechanical Engineering, Malayer University, Malayer, Iran. ARTICLE INFO ABSTRACT Article history: Received 12 September 2014 Accepted 18 January 2015 Available online 15 March 2015 Keywords: Single Point Incremental Forming Ultrasonic Vibration Surface Roughness Response Surface Methodology Ultrasonic vibration assisted single point incremental forming (UVaSPIF) is based on localized plastic deformation in a sheet metal blank. It consists of deforming gradually and locally the sheet metal using vibrating hemispherical-head tool controlled by a CNC milling machine. The ultrasonic excitation of the forming tool reduces the vertical component of the forming force. In addition, application of ultrasonic vibration reduces the surface roughness of the specimen. Surface roughness is one of the quantitative and qualitative parameters, which is used to assess the quality of the final product. In the present paper, a statistical analysis and optimization of the effective factors on this parameter are performed in the UVaSPIF process. For this purpose, response surface methodology (RSM) is selected as the experiment design technique. The controllable factors such as vertical step size, sheet thickness, tool diameter, wall inclination angle, and feed rate are specified as input variables of the process. The obtained results from the analysis of variance (ANOVA) and regression analysis of the experimental data confirm the accuracy of the mathematical model. Furthermore, it is shown that the linear, quadratic, and interactional terms of the variables are effective on the surface roughness parameter. To optimize the surface roughness parameter, the most appropriate conditions of the experiment are determined using desirability method, and statistical optimization is subsequently verified by conducting the confirmation test. 1. Introduction Nowadays, sheet metal-forming industries need to use economical and flexible processes to meet the market demands in a competitive environment with a minimum cost and time. Thus, researchers have considered the investigation of operational methods in order to produce and develop the new products[1-4]. Single point incremental forming (SPIF) has been introduced as an attractive and flexible method among the rapid prototyping processes with a high potential to be produced in a small volume. Leszak [5] patented this process in 1967 and its feasibility was confirmed by Kitazawa et al. [6] in forming of rotational symmetric parts. In this process, a simple Corresponding author: E-mail address: [email protected] (Mehdi Vahdati).
Transcript
M. Vahdati et al, Journal of Advanced Materials and Processing, Vol.3, No. 1, 2015, 15-28 15
Statistical Analysis and Optimization of Factors Affecting the SurfaceRoughness in the UVaSPIF Process Using Response Surface Methodology
M. Vahdatia,*, R. A. Mahdavinejada, S. Aminib, M. Moradic
a Department of Mechanical Engineering, University of Tehran, Tehran, Iran.b Department of Mechanical Engineering, University of Kashan, Kashan, Iran.c Department of Mechanical Engineering, Malayer University, Malayer, Iran.
ARTICLE INFO ABSTRACT
Article history:Received 12 September 2014Accepted 18 January 2015Available online 15 March 2015
Keywords:Single Point Incremental FormingUltrasonic VibrationSurface RoughnessResponse Surface Methodology
Ultrasonic vibration assisted single point incremental forming(UVaSPIF) is based on localized plastic deformation in a sheetmetal blank. It consists of deforming gradually and locally thesheet metal using vibrating hemispherical-head tool controlled by aCNC milling machine. The ultrasonic excitation of the formingtool reduces the vertical component of the forming force. Inaddition, application of ultrasonic vibration reduces the surfaceroughness of the specimen. Surface roughness is one of thequantitative and qualitative parameters, which is used to assess thequality of the final product. In the present paper, a statisticalanalysis and optimization of the effective factors on this parameterare performed in the UVaSPIF process. For this purpose, responsesurface methodology (RSM) is selected as the experiment designtechnique. The controllable factors such as vertical step size, sheetthickness, tool diameter, wall inclination angle, and feed rate arespecified as input variables of the process. The obtained resultsfrom the analysis of variance (ANOVA) and regression analysis ofthe experimental data confirm the accuracy of the mathematicalmodel. Furthermore, it is shown that the linear, quadratic, andinteractional terms of the variables are effective on the surfaceroughness parameter. To optimize the surface roughnessparameter, the most appropriate conditions of the experiment aredetermined using desirability method, and statistical optimizationis subsequently verified by conducting the confirmation test.
1. IntroductionNowadays, sheet metal-forming industries needto use economical and flexible processes tomeet the market demands in a competitiveenvironment with a minimum cost and time.Thus, researchers have considered theinvestigation of operational methods in order toproduce and develop the new products[1-4].
Single point incremental forming (SPIF) hasbeen introduced as an attractive and flexiblemethod among the rapid prototyping processeswith a high potential to be produced in a smallvolume. Leszak [5] patented this process in1967 and its feasibility was confirmed byKitazawa et al. [6] in forming of rotationalsymmetric parts. In this process, a simple
M. Vahdati et al, Journal of Advanced Materials and Processing, Vol.3, No. 1, 2015, 15-28 16
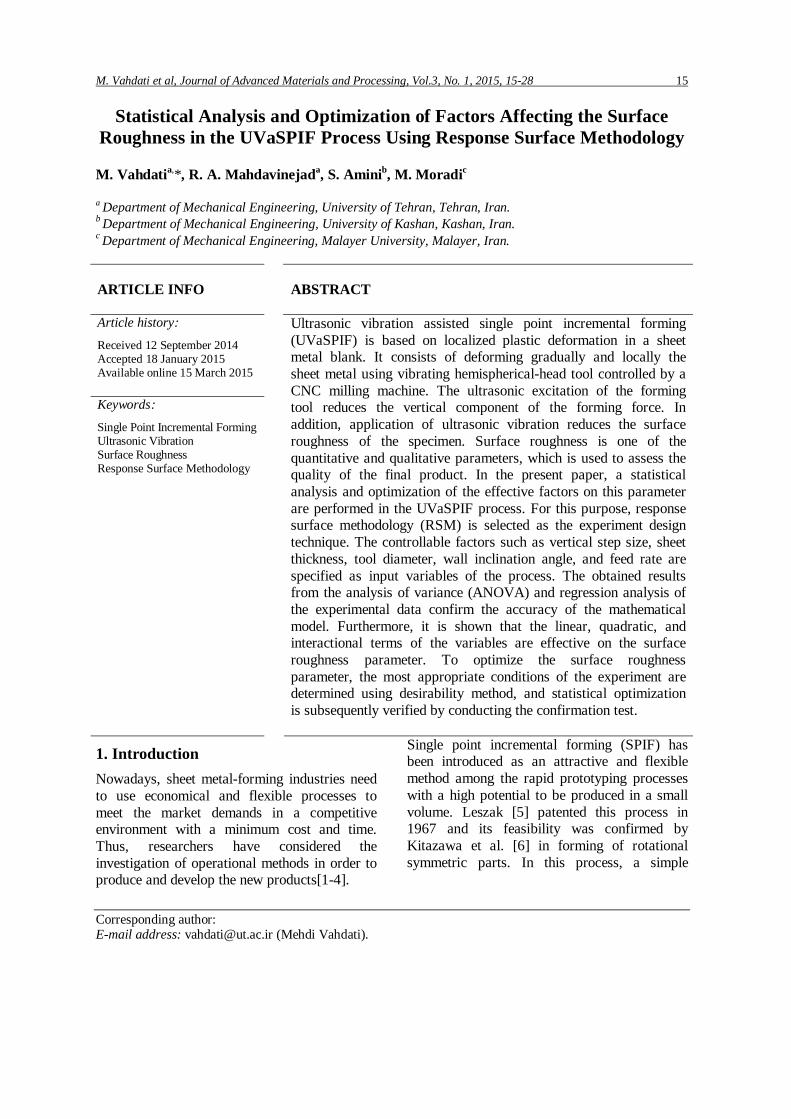
Fig. 1. General model of the process
forming tool with hemispherical-head moveson a sheet metal in a programmed path andapplies local plastic deformation to create thefinal geometry [7-10].
The surface finish of the formed sample inincremental forming has a lower situationcompared with other forming processes[11, 12]. Thus, in order to predict and controlthis parameter in incremental forming,researchers have considered the investigation ofthe surface roughness parameter. Junk et al.[13] observed that with the increase of verticalstep size, the surface roughness increases andwith the increase of tool diameter and wallinclination angle, the surface roughnessdecreases. Hagan and Jeswiet [14] studied thesignificance of the surface roughness in amicroscopic scale in particular in relation to theautomobile components. They described thesurface finish in incremental forming in theform of a combination of wave state in largescale (resulting from tool path) and roughnessin a small scale (resulting from large plainstrains). It was shown that, as the vertical stepsize decreases, the surfaces are seen totransform from wavy to strictly rough withoutwaviness. They also reported that the spindlespeed has no effect on the surface roughness.Durante et al. [15] presented the theoreticalmodel of the surface roughness in form of thefollowing relation:
[1]
In this relation, is the surface roughnessparameter. As can be observed, the reduction ofvertical step size ( ), the increase of tool
diameter ( ) and the increase of wallinclination angle ( )lead to the reduction ofthe surface roughness parameter.Shanmuganatan and Kumar [16] also foundthat the increase of wall inclination angle andtool diameter reduces the surface roughnessparameter.
Vahdati et al. [17, 18] showed thatultrasonic excitation of the hemispherical-headtool in SPIF reduces the vertical component ofthe forming force and surface roughness of thespecimen. Thus, the sheet metal will beformed incrementally in the presence ofultrasonic vibration with given frequency andspecified amplitude as compared to previousresearches. Hence, in the present paper, theanalysis and optimization of surface roughnessin UVaSPIF is done based on the DOEprinciples using the RSM technique. Design ofexperiments specially RSM is widely used formodeling and optimization of the productionprocesses, such as welding, powdermetallurgy, casting, and so on [19, 20]. Theobjectives of this research include extractionof regression model and mathematicalequation resulting from ANOVA for surfaceroughness parameter and access to optimalconditions of the experiment.
2. ExperimentalFig. 1. shows the general model of the process.Assuming the independence of controllablefactors ( iX ) and response of the process ( iY ),the goal is to obtain the mathematical relationbetween the output and the input variables withminimum error. For this purpose, themethodology of statistical analysis in thisresearch includes the following seven steps:
Selecting the response variableSelecting the controllable factorsSelecting the experiment designExperiment executionMeasuring the response variableData analysisOptimization and confirmation
2. 1. Selecting the response variableIn order to evaluate the surface roughness ofthe specimen, the parameter of was
M. Vahdati et al, Journal of Advanced Materials and Processing, Vol.3, No. 1, 2015, 15-28 17
Table 1. Input variables with design levelsVariable Notation Unit -1 0 +1
Vertical step size mm 0.25 0.5 0.75Sheet thickness mm 0.4 0.7 1Tool diameter mm 10 15 20
considered as a criterion to measure the surfaceroughness. is the average peak to valleyheight of the profile. It was selected to preventthe influence of any accidental surfaceirregularity on the experimental evaluation ofroughness.
2. 2. Selecting the controllable factorsDuring the UVaSPIF process, the applied forceon the tool leads to the change in the vibrationconditions. Therefore, vibration parameterssuch as frequency and amplitude of vibrationwere considered as the uncontrollable factors.Thus, the five factors of vertical step size ( ),sheet thickness ( ), tool diameter ( ), wallinclination angle ( ) and feed rate ( ) wereselected as the controllable input variables andeach of them were considered at three levels oflow (-1), central (0), and high (+1). The highand low levels of each parameter are coded by+1 and -1. The coded value of eachintermediate level is calculated through thefollowing relation [21]:
[2]
In this relation, X is the coded value ofconcerned parameter with the actual value of(between and ). and havethe actual low and high values of the parameter,accordingly. Table 1 shows the input variablesand experimental design levels used with codedand actual values. The variation range of thesefactors was determined based on the primaryexperiments, which lead to safe production ofthe specimen.
2. 3. Selecting the experiment designIn the present research, RSM is used as theexperiment design technique [22, 23]. Thus, thefirst step in this method is to find a suitable
approximation of the real relation existingbetween the response variable ( ) and the setof input variables ( ). The approximatingfunctions are in the form of linear and quadraticmodels and are written in the form of thefollowing relations:
[3]
[4]
In the above functions, is the constant value, is the first-order (linear)coefficient, is
the second-order (quadratic) coefficient, isthe interaction coefficient, is the number ofindependent variables, and is the rate oferror.
In this research, the second-order model andBox-Behnken Design (BBD) are used. Thesoftware in use for experiment design andstatistical analysis is Minitab [24]. Table 2shows the design matrix with 46 tests in theform of coded runs. Five tests are repeated atthe central levels of parameters (zero level).
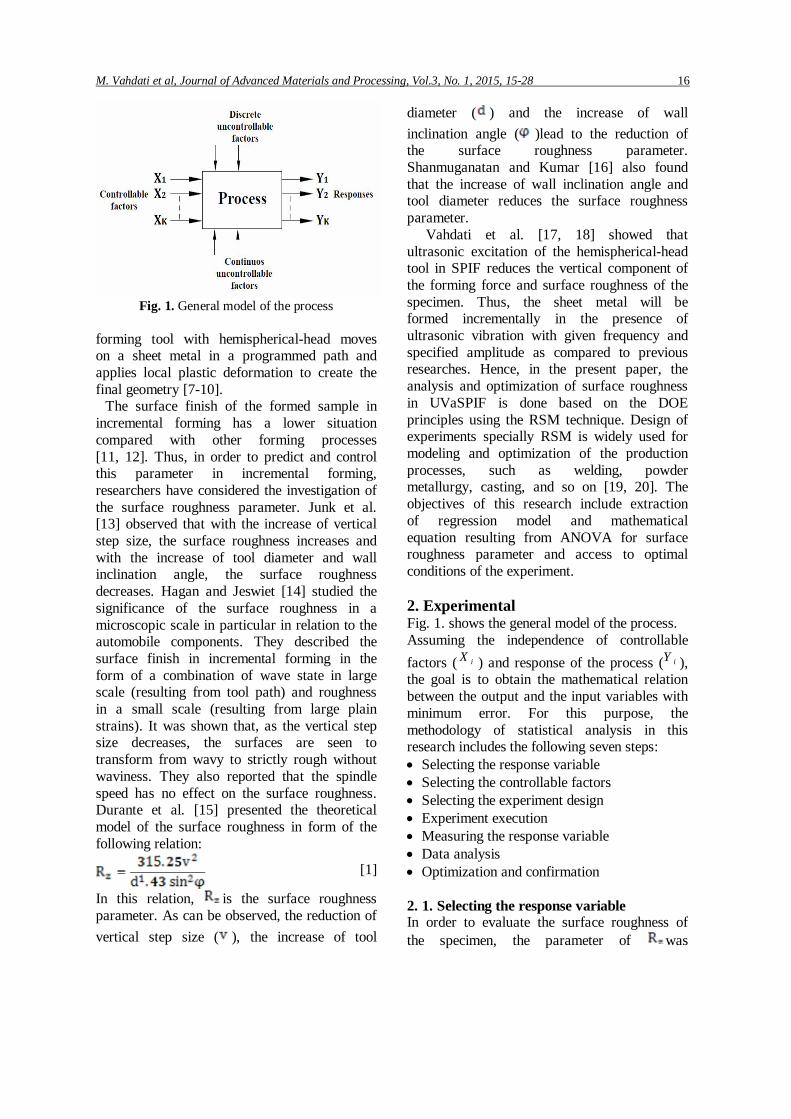
2. 4. Experiment executionAn Al 1050-O sheet metal (annealed aluminum)was used in the experiments. The HLP68 gradehydraulic oil was used as lubricant [25]. Thehemispherical-head tools were designed andmanufactured in three diameters of 10, 15, and20mm (Figure 2)in accordance with theinstruction of design, manufacturing, and test ofvibrating forming tools [17, 18]. Since theinitial surface roughness of the sheet metal willinfluence the results, sheet metals with similarinitial surface roughness were selected.Another effective factor was the surface qualityof the forming tools, which were smooth andpolished.
The ultrasonic equipment used in thisresearch consists of two components: ultrasonicgenerator and ultrasonic vibration transmission
M. Vahdati et al, Journal of Advanced Materials and Processing, Vol.3, No. 1, 2015, 15-28 18
Table 2. Design matrixTest no.
1 0 0 -1 +1 0
2 0 0 +1 -1 0
3 0 0 -1 0 +1
4 0 +1 -1 0 0
5 0 0 0 0 0
6 0 0 0 0 0
7 -1 0 -1 0 0
8 0 0 0 +1 -1
9 0 +1 0 -1 0
10 -1 0 0 0 -1
11 0 0 0 0 0
12 0 +1 0 0 -1
13 -1 -1 0 0 0
14 0 -1 0 -1 0
15 0 0 -1 -1 0
16 +1 0 0 0 -1
17 0 0 0 -1 -1
18 0 0 0 +1 +1
19 0 0 -1 0 -1
20 0 -1 0 +1 0
21 0 -1 -1 0 0
22 +1 0 +1 0 0
23 0 0 +1 +1 0
Test no.
24 0 0 0 0 0
25 0 -1 +1 0 0
26 0 +1 0 0 +1
27 +1 0 0 0 +1
28 +1 0 -1 0 0
29 +1 0 0 +1 0
30 -1 0 0 -1 0
31 0 0 0 0 0
32 0 +1 0 +1 0
33 +1 0 0 -1 0
34 0 0 0 -1 +1
35 +1 +1 0 0 0
36 -1 +1 0 0 0
37 0 +1 +1 0 0
38 0 -1 0 0 +1
39 0 0 +1 0 +1
40 -1 0 +1 0 0
41 +1 -1 0 0 0
42 -1 0 0 +1 0
43 0 -1 0 0 -1
44 0 0 +1 0 -1
45 -1 0 0 0 +1
46 0 0 0 0 0
system (piezoelectric transducer + tool holder).To apply ultrasonic vibration to the formingtool, a King generator with a power output of1000 W at an operational frequency of 20 kHzwas used. The ultrasonic generator convertslow-frequency input voltage (220 VAC, 50-60Hz) into high-frequency ultrasonic power (1000W, 20 kHz). The vibration transmission systemis combined with the forming tool, so that itcan transfer the vibration energy efficiently tothe sheet. In addition, the vibrationtransmission system must induce rotationalmovement of the forming tool (Fig. 3).
In this study, ultrasonic energy was appliedlongitudinally to the forming tool to be
vibrated. To measure the nose vibrationamplitude of the forming tool, a microndigital indicator was employed. Thevibration amplitude of the forming tools wasmeasured to be 7.5 µm. The spindle speedwas 125 rpm.
Fig.4 shows the fixture components in theSPIF process. The sheet metal is placedbetween the clamping and backing plates. Thesample geometry was considered in the form ofpyramid frustum with the base dimension of80×80mm and depth of 30mm (Figure5).
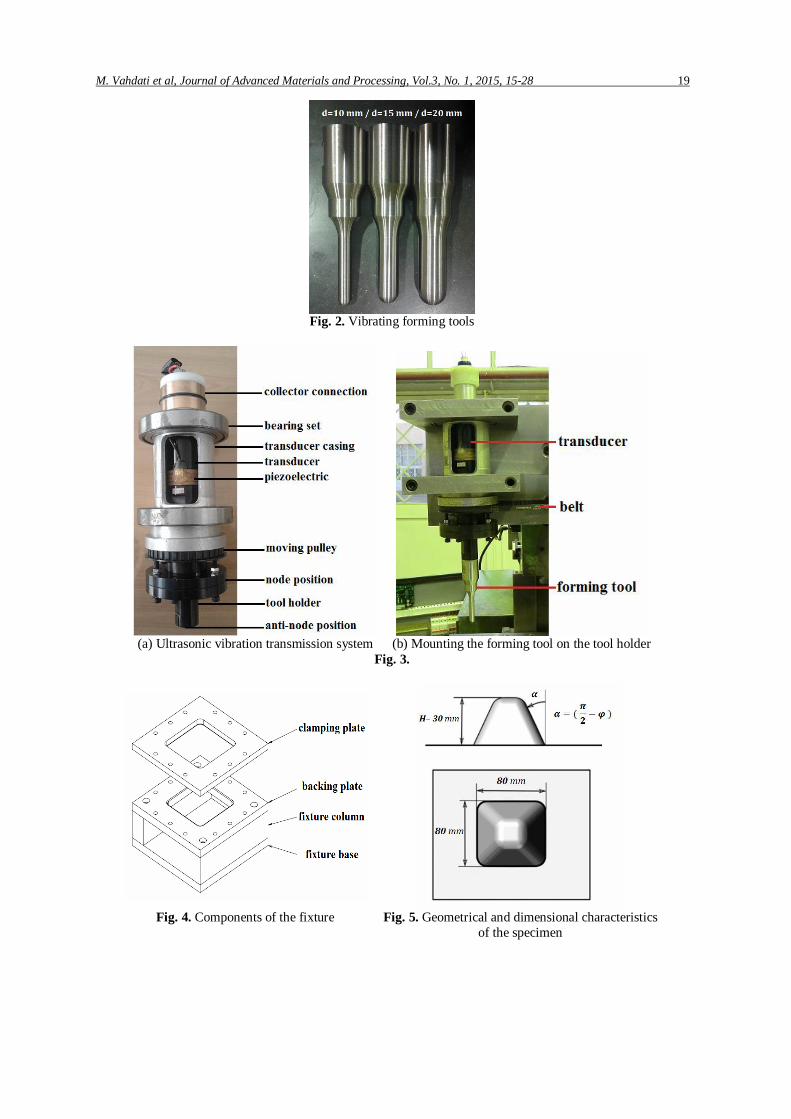
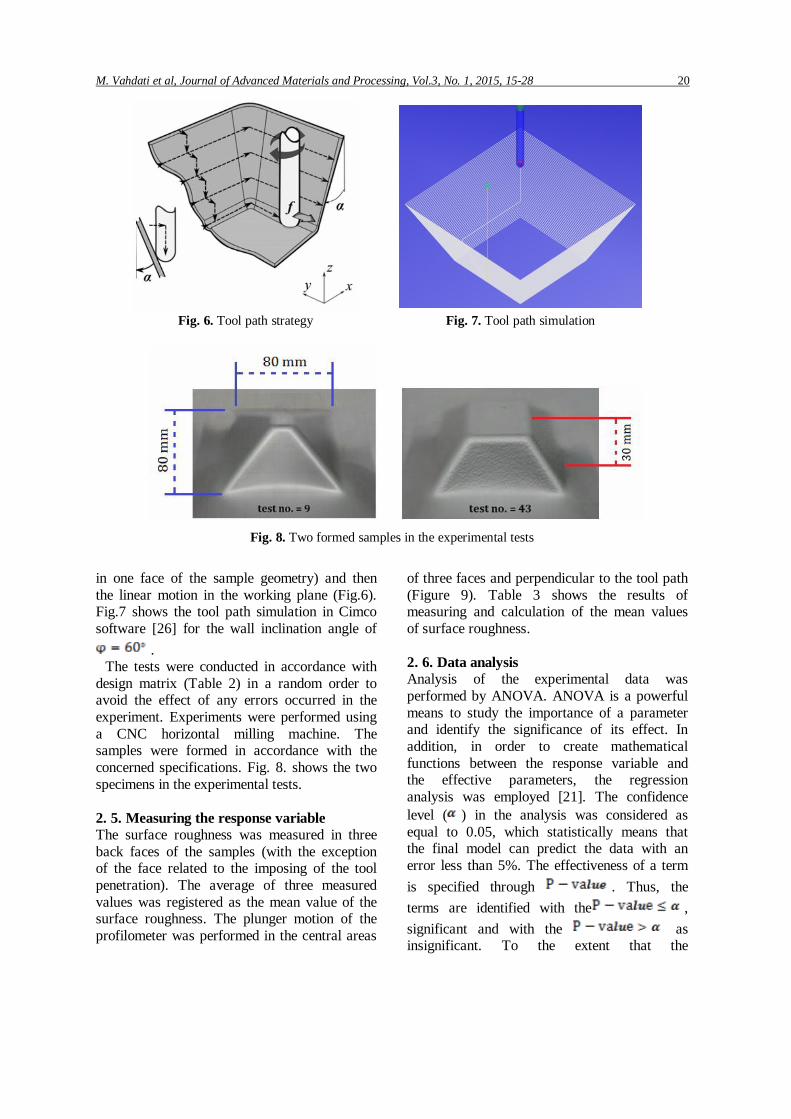
Tool path strategy is in the form of thegradual imposing of the wall inclination angle(based on successive horizontal-vertical steps
M. Vahdati et al, Journal of Advanced Materials and Processing, Vol.3, No. 1, 2015, 15-28 19
Fig. 2. Vibrating forming tools
(a) Ultrasonic vibration transmission system (b) Mounting the forming tool on the tool holderFig. 3.
Fig. 4. Components of the fixture Fig. 5. Geometrical and dimensional characteristicsof the specimen
M. Vahdati et al, Journal of Advanced Materials and Processing, Vol.3, No. 1, 2015, 15-28 20
Fig. 8. Two formed samples in the experimental tests
in one face of the sample geometry) and thenthe linear motion in the working plane (Fig.6).Fig.7 shows the tool path simulation in Cimcosoftware [26] for the wall inclination angle of
.The tests were conducted in accordance with
design matrix (Table 2) in a random order toavoid the effect of any errors occurred in theexperiment. Experiments were performed usinga CNC horizontal milling machine. Thesamples were formed in accordance with theconcerned specifications. Fig. 8. shows the twospecimens in the experimental tests.
2. 5. Measuring the response variableThe surface roughness was measured in threeback faces of the samples (with the exceptionof the face related to the imposing of the toolpenetration). The average of three measuredvalues was registered as the mean value of thesurface roughness. The plunger motion of theprofilometer was performed in the central areas
of three faces and perpendicular to the tool path(Figure 9). Table 3 shows the results ofmeasuring and calculation of the mean valuesof surface roughness.
2. 6. Data analysisAnalysis of the experimental data wasperformed by ANOVA. ANOVA is a powerfulmeans to study the importance of a parameterand identify the significance of its effect. Inaddition, in order to create mathematicalfunctions between the response variable andthe effective parameters, the regressionanalysis was employed [21]. The confidencelevel ( ) in the analysis was considered asequal to 0.05, which statistically means thatthe final model can predict the data with anerror less than 5%. The effectiveness of a termis specified through . Thus, theterms are identified with the ,significant and with the asinsignificant. To the extent that the
M. Vahdati et al, Journal of Advanced Materials and Processing, Vol.3, No. 1, 2015, 15-28 21
(b) Three faces for roughness measuring(a) Plunger motion on the back face of sampleFig. 9. Measuring procedure of the surface roughness
Table 3. Mean values of the surface roughnessTest no.
is smaller, to the same extent thesignificance of that term in the model is greater.
Thus, with the assumption of and
based on the primary results obtained fromANOVA, the first-order parameters: verticalstep size ( ), sheet thickness ( ), tool diameter
M. Vahdati et al, Journal of Advanced Materials and Processing, Vol.3, No. 1, 2015, 15-28 22
Table 4. Regression table based on the effective terms
TermRegression
coefficientT-value P-value
Constant 2.547 77.335 0.000
1.141 37.049 0.000
-1.945 -63.142 0.000
-0.526 -17.084 0.000
-0.243 -7.873 0.000
-0.069 -2.232 0.032
0.261 6.655 0.000
1.831 46.711 0.000
-0.106 -2.700 0.011
0.135 2.191 0.035
-0.340 -5.519 0.000
-0.185 -3.003 0.005
( ), wall inclination angle ( ) and feed rate( ), the second-order terms: , , andinteractional terms: , and weredetermined as the effective terms on the andthe other terms were determined as theineffective terms.
In the final step of data analysis, the termswith inactive effects were removed from themodel and only the terms with active effectswere analyzed. Thus, all ineffective terms withthe were deleted from theanalysis and all terms with the
in the final step of ANOVAwill be present. Table 4 shows the regressiontable resulting from the final ANOVA based onthe effective terms. As can be observed, all theterms in Table 4 have appeared with the
and as the effective termson the response variable. The emergence ofpositive sign (+) for regression coefficientsstates the presence of a direct relation betweenthe terms and the response variable, whereasthe emergence of negative sign (-) forregression coefficients shows the presence of areverse relation between the terms and theresponse variable. In continuation, the role of
the effective parameters for achieving an idealsituation of the response variable was studied.Thus, the reduction of surface roughness ( )was determined as the ideal situation resultingfrom the UVaSPIF process.
The following relation expresses theregression equation of surface roughness as afunction of the coded effective values:
[5]The investigation of the T-values belonging tothe effective terms shows that:
Sheet thickness ( ) as the linear effect hasthe greatest effect on . On the other hand,the product of vertical step size and sheetthickness ( ) as the interactional effectalong with feed rate ( ) as the linear effecthas the least effect on . In other words,the effect of sheet thickness ( ) is 28 timesmore than the effect of and feed rate.Sheet thickness ( ) among the linear effectshas the greatest effect on .Sheet thickness ( ) among the quadraticeffects ( ) has the greatest effect on .The product of vertical step size and tooldiameter ( ) among the interactionaleffects has the greatest effect on .
As can be observed in Table 4, the correlation
coefficients of and show the highestvalues of 99.58% and 99.44%,respectively. Asa result, a high correlation was establishedbetween the observed data in experimental testsand the predicted responses resulting from theregression equation. Hence, the ability of thefitted model and accuracy of the regressionequation in describing and predicting thechanges of the response variable wereconfirmed. Table 5 shows the results obtainedfrom the ANOVA.
In order to investigate the accuracy of theregression model, in addition to evaluation,the lack-of-fit (LOF) test was also used. Thesignificance of this test( ) indicates that the dataare not well placed around the model and it is
M. Vahdati et al, Journal of Advanced Materials and Processing, Vol.3, No. 1, 2015, 15-28 23
Table 5. ANOVA results for the final modelSource of variation Degree of freedom Sum of squares Mean squares F-value P-value
not possible to use the model to predict theresponse variable. Thus, with the confirmationof the insignificance of the LOF test( ), it is possible to findout that the model can be well fitted on thedata. As can be observed in Table 5, the LOFtest for the response variable is not significantand, consequently, the presented model showsthe data trends well. On the other hand, the bestanalysis is performed when the regression iseffective and the LOF test is ineffectiveconcurrently [21]. Thus, with regard to the
, it is observed that the regressionterm is effective and the LOF term isineffective.
The plot of normal probability is a usefulmeans to check the accuracy of normaldistribution of the residuals (Fig. 10). It isevident that residuals were scattered on thestraight line and the errors have a normaldistribution on the normal probability plot.Thus, the extracted regression model isadequate for the prediction of the effects. Also,it is possible to investigate the model
competency by studying the behavior of theresiduals.The residual is defined in the form ofthe difference of the measured response in theexperimental test and predicted response by thefinal model. If the regression model is suitable,then the residuals should be in lack of astructure. As can be seen in Fig. 11, theresiduals have been distributed randomlyaround the zero axis and the diagram does notinclude any specific pattern. Thus, the finalmodel is reliable and suitable.
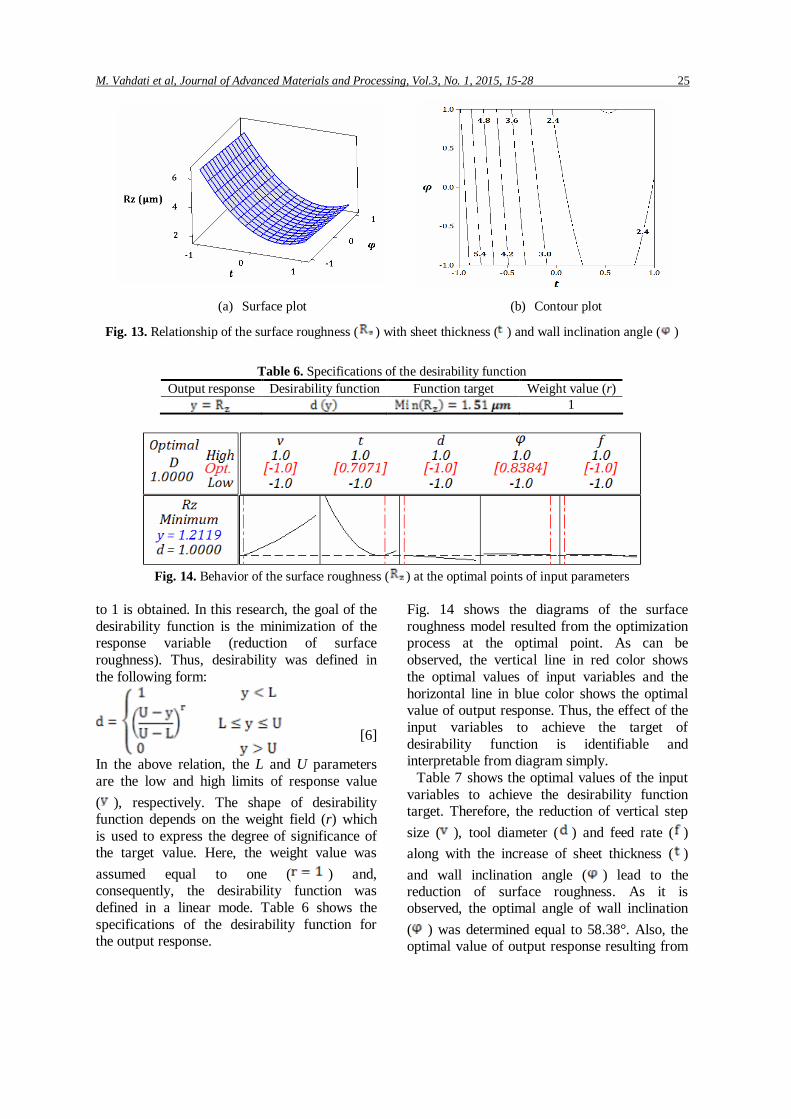
The response behaviour can be shown interms of the input variables in the form of 3Ddiagrams (surface plot) and 2D diagrams(contour plot). In these diagrams, theinteractional effects of the two input variableson the response variable are observable and thevalues of other input variables are consideredfixed at the central levels (zero level). Therelationship of the surface roughness with thesheet thickness ( ) and tool diameter ( ) hasbeen shown in Fig. 12. As can be observed, theincrease of sheet thickness ( ) along with theincrease of tool diameter ( ) is effective on the
M. Vahdati et al, Journal of Advanced Materials and Processing, Vol.3, No. 1, 2015, 15-28 24
Fig. 10. Normal probability plot
Fig. 11. The residual plot
(a) Surface plot (b) Contour plot
Fig. 12. Relationship of the surface roughness ( ) with sheet thickness ( ) and tool diameter ( )
reduction of the surface roughness of thespecimen. On the other hand, the effect of wallinclination angle ( ) on the reduction ofsurface roughness is insignificant incomparison with the effect of the increase ofsheet thickness ( ) (Figure 13).
2. 7. Optimization and confirmationIn this research, desirability method was usedas the optimization technique due to its
simplicity, flexibility, and accessibility in thesoftware. Drringer and Suich introduced thismethod in 1980 [27]. In this technique, theoutput response ( ) is converted intodimensionless desirability of ( ),such that the higher value of signifies thegreater desirability of response value ( ) andif the response is outside the acceptable limit,
. Thus, for the output response, aseparate desirability function with a range of 0
M. Vahdati et al, Journal of Advanced Materials and Processing, Vol.3, No. 1, 2015, 15-28 25
(a) Surface plot (b) Contour plot
Fig. 13. Relationship of the surface roughness ( ) with sheet thickness ( ) and wall inclination angle ( )
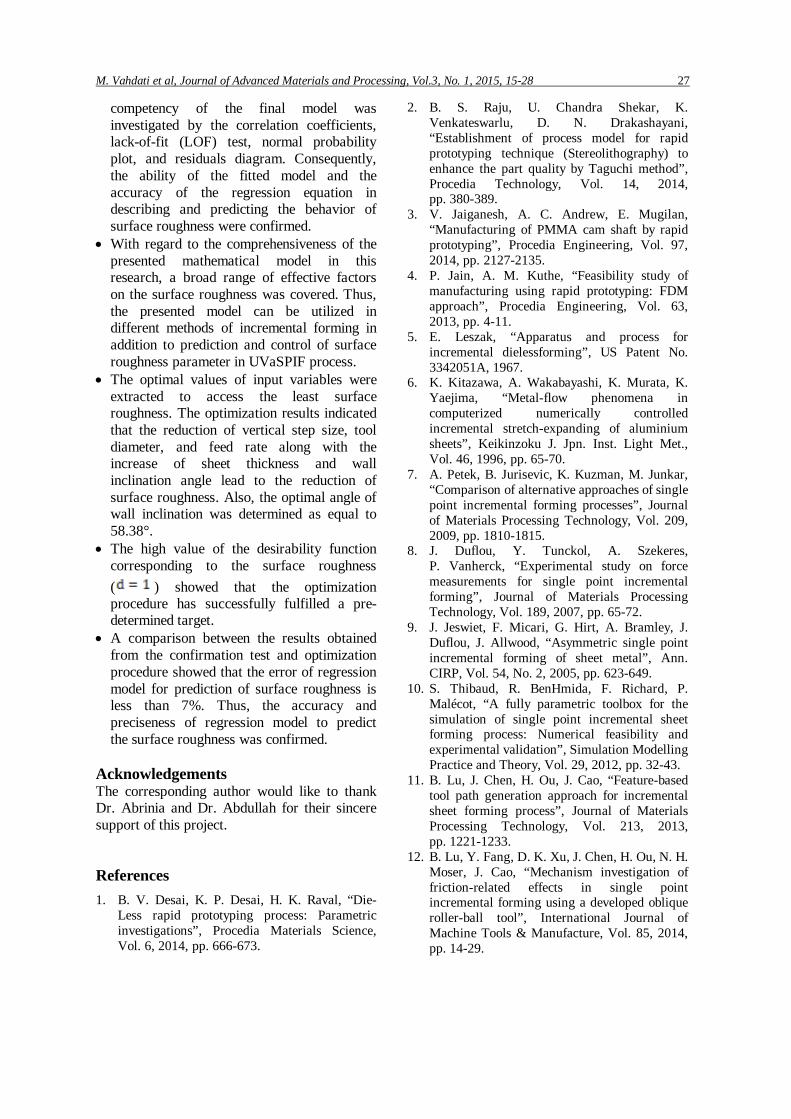
Table 6. Specifications of the desirability functionOutput response Desirability function Function target Weight value (r)
1
Fig. 14. Behavior of the surface roughness ( ) at the optimal points of input parameters
to 1 is obtained. In this research, the goal of thedesirability function is the minimization of theresponse variable (reduction of surfaceroughness). Thus, desirability was defined inthe following form:
[6]
In the above relation, the L and U parametersare the low and high limits of response value( ), respectively. The shape of desirabilityfunction depends on the weight field (r) whichis used to express the degree of significance ofthe target value. Here, the weight value wasassumed equal to one ( ) and,consequently, the desirability function wasdefined in a linear mode. Table 6 shows thespecifications of the desirability function forthe output response.
Fig. 14 shows the diagrams of the surfaceroughness model resulted from the optimizationprocess at the optimal point. As can beobserved, the vertical line in red color showsthe optimal values of input variables and thehorizontal line in blue color shows the optimalvalue of output response. Thus, the effect of theinput variables to achieve the target ofdesirability function is identifiable andinterpretable from diagram simply.
Table 7 shows the optimal values of the inputvariables to achieve the desirability functiontarget. Therefore, the reduction of vertical stepsize ( ), tool diameter ( ) and feed rate ( )along with the increase of sheet thickness ( )and wall inclination angle ( ) lead to thereduction of surface roughness. As it isobserved, the optimal angle of wall inclination( ) was determined equal to 58.38°. Also, theoptimal value of output response resulting from
M. Vahdati et al, Journal of Advanced Materials and Processing, Vol.3, No. 1, 2015, 15-28 26
Table 7. Optimal values of the input variablesInput variable Coded optimal value Actual optimal value
-1 0.25 mm0.7071 0.91 mm
-1 10 mm0.8384 58.38
-1 1500 mm/min
Table 8. Input variables for the confirmation testvariable value
0.25 mm0.9 mm10 mm
581500 mm/min
Fig. 15. Formed sample in the confirmation test
Table 9. Comparison between the results obtained from confirmation test and optimization process (confirmation test) (optimization process) Difference percent
1.295 1.212 6.85 %
the regression equation is equal toand the value of the corresponding
desirability functionis equal to one (1). Hence,with regard to the high value of separatedesirability function, it can be claimed that theprocedure of process optimization has wellfulfilled a pre-determined target.
In order to confirm the optimized responseand to measure the accuracy of the presentedmodel, the experimental test was conducted bythe optimal conditions of the input variables.Table 8 shows the input variables of theexperiment. Fig. 15 shows the specimen afterperforming the confirmation test. Table 9presents the results obtained from theconfirmation test and its comparison with theoptimized result. This comparison shows thatthe error of regression model to predict thesurface roughness is less than 7%. Thus, theaccuracy and preciseness of regression model
to predict the response variable was confirmed.3. ConclusionIn this paper, analysis and optimization of thesurface roughness in the UVaSPIF processwere conducted based on DOE principles usingthe RSM technique. The majoraccomplishments of this research aresummarized as follows:
The primary results obtained from ANOVAwith the assumption of showedthat the linear terms: vertical step size ( ),sheet thickness ( ), tool diameter ( ), wallinclination angle ( ) and feed rate ( ), thequadratic terms: , and and theinteractional terms: , and canaffect the surface roughness.The regression equation resulting fromANOVA was extracted to predict the surfaceroughness in the UVaSPIF process. The
M. Vahdati et al, Journal of Advanced Materials and Processing, Vol.3, No. 1, 2015, 15-28 27
competency of the final model wasinvestigated by the correlation coefficients,lack-of-fit (LOF) test, normal probabilityplot, and residuals diagram. Consequently,the ability of the fitted model and theaccuracy of the regression equation indescribing and predicting the behavior ofsurface roughness were confirmed.With regard to the comprehensiveness of thepresented mathematical model in thisresearch, a broad range of effective factorson the surface roughness was covered. Thus,the presented model can be utilized indifferent methods of incremental forming inaddition to prediction and control of surfaceroughness parameter in UVaSPIF process.The optimal values of input variables wereextracted to access the least surfaceroughness. The optimization results indicatedthat the reduction of vertical step size, tooldiameter, and feed rate along with theincrease of sheet thickness and wallinclination angle lead to the reduction ofsurface roughness. Also, the optimal angle ofwall inclination was determined as equal to58.38°.The high value of the desirability functioncorresponding to the surface roughness( ) showed that the optimizationprocedure has successfully fulfilled a pre-determined target.A comparison between the results obtainedfrom the confirmation test and optimizationprocedure showed that the error of regressionmodel for prediction of surface roughness isless than 7%. Thus, the accuracy andpreciseness of regression model to predictthe surface roughness was confirmed.
AcknowledgementsThe corresponding author would like to thankDr. Abrinia and Dr. Abdullah for their sinceresupport of this project.
References1. B. V. Desai, K. P. Desai, H. K. Raval, “Die-
Less rapid prototyping process: Parametricinvestigations”, Procedia Materials Science,Vol. 6, 2014, pp. 666-673.
2. B. S. Raju, U. Chandra Shekar, K.Venkateswarlu, D. N. Drakashayani,“Establishment of process model for rapidprototyping technique (Stereolithography) toenhance the part quality by Taguchi method”,Procedia Technology, Vol. 14, 2014,pp. 380-389.
3. V. Jaiganesh, A. C. Andrew, E. Mugilan,“Manufacturing of PMMA cam shaft by rapidprototyping”, Procedia Engineering, Vol. 97,2014, pp. 2127-2135.
4. P. Jain, A. M. Kuthe, “Feasibility study ofmanufacturing using rapid prototyping: FDMapproach”, Procedia Engineering, Vol. 63,2013, pp. 4-11.
5. E. Leszak, “Apparatus and process forincremental dielessforming”, US Patent No.3342051A, 1967.
6. K. Kitazawa, A. Wakabayashi, K. Murata, K.Yaejima, “Metal-flow phenomena incomputerized numerically controlledincremental stretch-expanding of aluminiumsheets”, Keikinzoku J. Jpn. Inst. Light Met.,Vol. 46, 1996, pp. 65-70.
7. A. Petek, B. Jurisevic, K. Kuzman, M. Junkar,“Comparison of alternative approaches of singlepoint incremental forming processes”, Journalof Materials Processing Technology, Vol. 209,2009, pp. 1810-1815.
8. J. Duflou, Y. Tunckol, A. Szekeres,P. Vanherck, “Experimental study on forcemeasurements for single point incrementalforming”, Journal of Materials ProcessingTechnology, Vol. 189, 2007, pp. 65-72.
9. J. Jeswiet, F. Micari, G. Hirt, A. Bramley, J.Duflou, J. Allwood, “Asymmetric single pointincremental forming of sheet metal”, Ann.CIRP, Vol. 54, No. 2, 2005, pp. 623-649.
10. S. Thibaud, R. BenHmida, F. Richard, P.Malécot, “A fully parametric toolbox for thesimulation of single point incremental sheetforming process: Numerical feasibility andexperimental validation”, Simulation ModellingPractice and Theory, Vol. 29, 2012, pp. 32-43.
11. B. Lu, J. Chen, H. Ou, J. Cao, “Feature-basedtool path generation approach for incrementalsheet forming process”, Journal of MaterialsProcessing Technology, Vol. 213, 2013,pp. 1221-1233.
12. B. Lu, Y. Fang, D. K. Xu, J. Chen, H. Ou, N. H.Moser, J. Cao, “Mechanism investigation offriction-related effects in single pointincremental forming using a developed obliqueroller-ball tool”, International Journal ofMachine Tools & Manufacture, Vol. 85, 2014,pp. 14-29.
M. Vahdati et al, Journal of Advanced Materials and Processing, Vol.3, No. 1, 2015, 15-28 28
13. S. Junk, G. Hirt, I. Chouvalova, “Formingstrategies and tools in incremental sheetforming”, Proceedings of the 10th InternationalConference on Sheet Metal, 2003, pp. 57-64.
14. E. Hagan, J. Jeswiet, “Analysis of surfaceroughness for parts formed by computernumerical controlled incremental forming”,Journal of Engineering Manufacture (Part B),Vol. 218, 2004, pp. 1307-1312.
15. M. Durante, A. Formisano, A. Langella,“Comparison between analytical andexperimental roughness values of componentscreated by incremental forming”, Journal ofMaterials Processing Technology, Vol. 210,2010, pp. 1934-1941.
16. S. P. Shanmuganatan, V. S. Senthil Kumar,“Metallurgical analysis and finite elementmodelling for thinning characteristics of profileforming on circular cup”, Materials and Design,Vol. 44, 2013, pp. 208-215.
17. M. Vahdati, R. A. Mahdavinejad, S. Amini,A. Abdullah, K. Abrinia, “Design andManufacture of Vibratory Forming Tool toDevelop Ultrasonic Vibration assistedIncremental Sheet Metal Forming Process”,Modares Mechanical Engineering, Vol. 14, No.11, 2014, pp. 68-76 (In Persian).
18. M. Vahdati, R. A. Mahdavinejad, S. Amini,K. Abrinia, “Experimental investigation theeffect of ultrasonic vibration and lubricant onbehavior of the forming force in Single PointIncremental Forming (SPIF) process”,3rd International Engineering Materials &
Metallurgy Conference, Iran, 2014, p. 159.19. M. Moradi, M. Ghoreishi, J. Frostevarg,
A. F. H. Kaplan, “An investigation on stabilityof laser hybrid arc welding”, Optics and Lasersin Engineering, Vol. 51, No.4, 2013,pp. 481-487.
20. H. Abdollahi, R. A. Mahdavinejad, M.Ghambari, M. Moradi, “Investigation of greenproperties of iron/jet milled grey cast ironcompacts by response surface method”, Journalof Engineering Manufacture (Part B), Vol. 228,No. 4, 2014, pp. 493-503.
21. D. C.Montgomery, “Design and Analysis ofExperiments”, 3rd ed., New York, John Wiley& Sons, 1991.
22. A. I. Khuri, J. A. Cornell, “Response SurfacesDesign and Analysis”, 2nd ed., New York,Marcel Dekker, 1996.
23. R. H. Myers, D. C. Montgomery, “ResponseSurface Methodology: Process and ProductOptimization Using Designed Experiments”,2nd ed., New York, John Wiley & Sons, 2002.