Statistical Analysis of an Infrared Thermography Inspection of Reinforced Carbon-Carbon Each piece of flight hardware being used on the shuttle must be analyzed and pass NASA requirements before the shuttle is ready for launch. One tool used to detect cracks that lie within flight hardware is Infrared Flash Thermography. This is a non-destructive testing technique which uses an intense flash of light to heat up the surface of a material after which an Infrared camera is used to record the cooling of the material. Since cracks within the material obstruct the natural heat flow through the material, they are visible when viewing the data from the Infrared camera. We used Ecotherm, a software program, to collect data pertaining to the delaminations and analyzed the data using Ecotherm and University of Dayton Log Logistic Probability of Detection (POD) Software. The goal was to reproduce the statistical analysis produced by the University of Dayton software, by using scatter plots, log transforms, and residuals to test the assumption of normality for the residuals. https://ntrs.nasa.gov/search.jsp?R=20110014356 2018-07-01T17:19:19+00:00Z
Transcript
Statistical Analysis of an Infrared Thermography Inspection of Reinforced Carbon-Carbon Each piece of flight hardware being used on the shuttle must be analyzed and pass NASA requirements before the shuttle is ready for launch. One tool used to detect cracks that lie within flight hardware is Infrared Flash Thermography. This is a non-destructive testing technique which uses an intense flash of light to heat up the surface of a material after which an Infrared camera is used to record the cooling of the material. Since cracks within the material obstruct the natural heat flow through the material, they are visible when viewing the data from the Infrared camera. We used Ecotherm, a software program, to collect data pertaining to the delaminations and analyzed the data using Ecotherm and University of Dayton Log Logistic Probability of Detection (POD) Software. The goal was to reproduce the statistical analysis produced by the University of Dayton software, by using scatter plots, log transforms, and residuals to test the assumption of normality for the residuals.
• Reinforced Carbon Carbon (RCC) is the composite material that makes up the nose cone of the shuttle
• Infrared (IR) Thermography is a non-destructive test used to detect cracks beneath the surface of materials– Two flash bulbs produce a 26 KJ Flash of
energy heats up top surface– The heat flow through material is
disrupted by defects – Infrared Camera is used to measure the
cooling of the material. In the Infrared images, defects appear as hot spots on the composite
K. Comeaux, 2011 3 MathFest
0
0.1
0.2
0.3
0.4
0.5
00.
55 1.1
1.65 2.
22.
75 3.3
3.85 4.
44.
95 5.5
Nor
mal
ized
Con
tras
t
Time (s)
Normalized Contrast: Defect A1
• Run IR Scan• Use Ecotherm to analyze
data
• Normalized contrast:
(Ti-Ti0) – (Tr-Tr0
)(Ti-Ti0
) + (Tr-Tr0)
• Find peak normalized contrast (Â) for each crack of size A.
Background: Normalized Contrast of IR Thermography Scan
Peak Contrast
K. Comeaux, 2011 4 MathFest
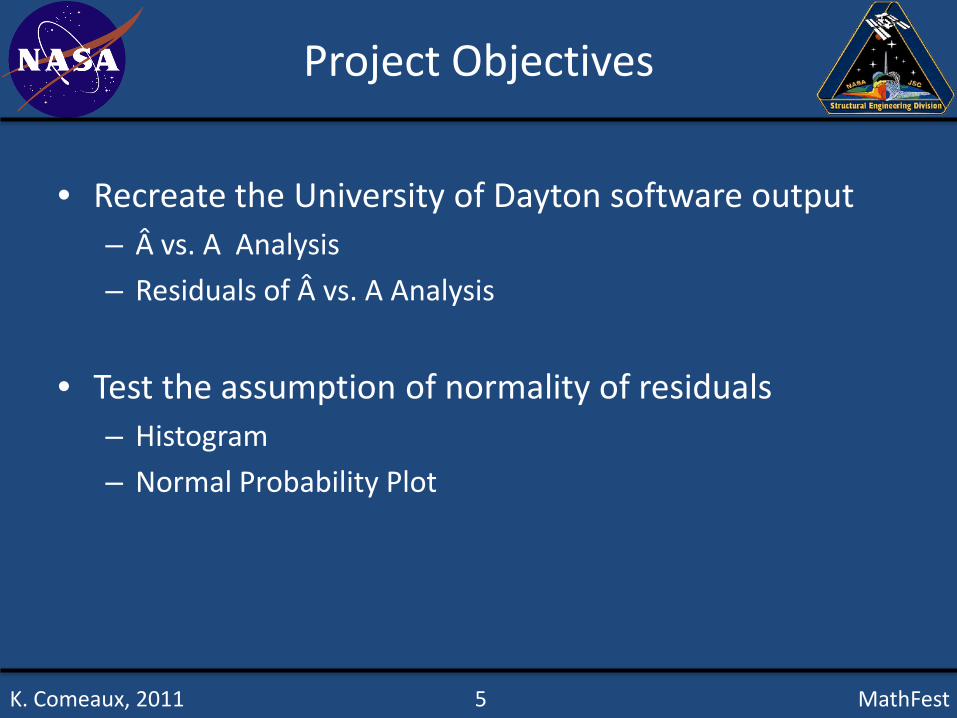
• Recreate the University of Dayton software output– Â vs. A Analysis
– Residuals of  vs. A Analysis
• Test the assumption of normality of residuals– Histogram
– Normal Probability Plot
Project Objectives
K. Comeaux, 2011 5 MathFest
• Scatter Plot
 vs. A Analysis
K. Comeaux, 2011 6 MathFest
• Log-Log Transform
Software Output:
• Ln(Â) = 1.5432 Ln(A) +2.3195
• e Ln(Â) = e 1.5432 Ln(A) +2.3195
• Â = 10.170588 A1.5432
• Residual of A = ln(Â) – (1.5432ln(A)+2.3195)
Residuals
K. Comeaux, 2011 7 MathFest
Software output:Created Residual Plot:
-1.2-1
-0.8-0.6-0.4-0.2
00.20.40.60.8
0 2 4 6 8 10 12 14
Res
idua
l in
coun
ts
Flaw size (A) in mils
Residual
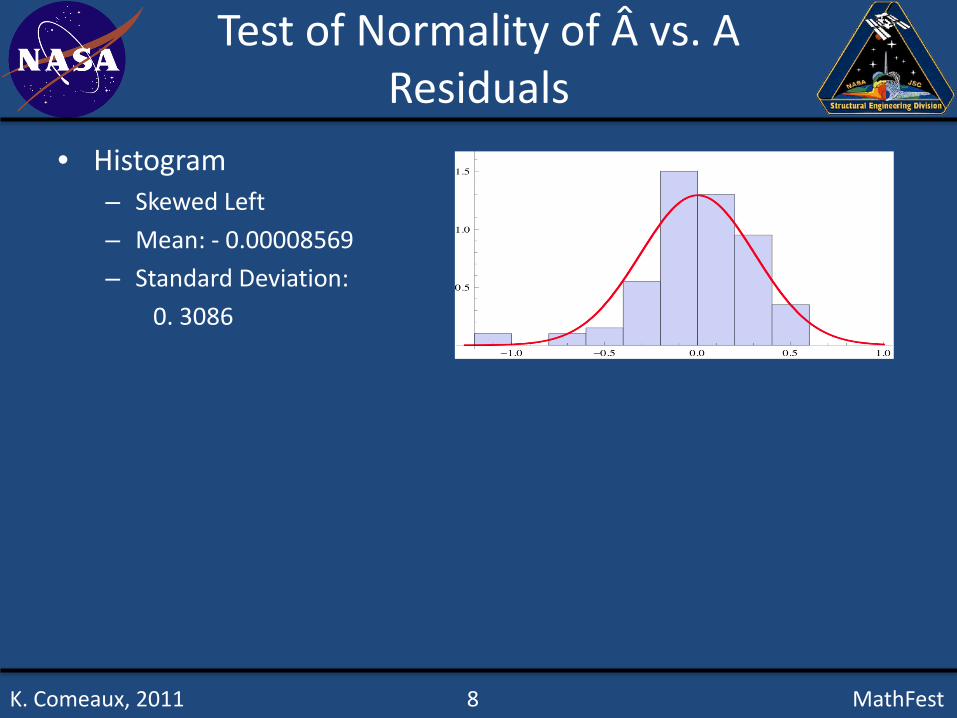
• Histogram– Skewed Left
– Mean: - 0.00008569
– Standard Deviation:
0. 3086
Test of Normality of  vs. A Residuals
K. Comeaux, 2011 8 MathFest
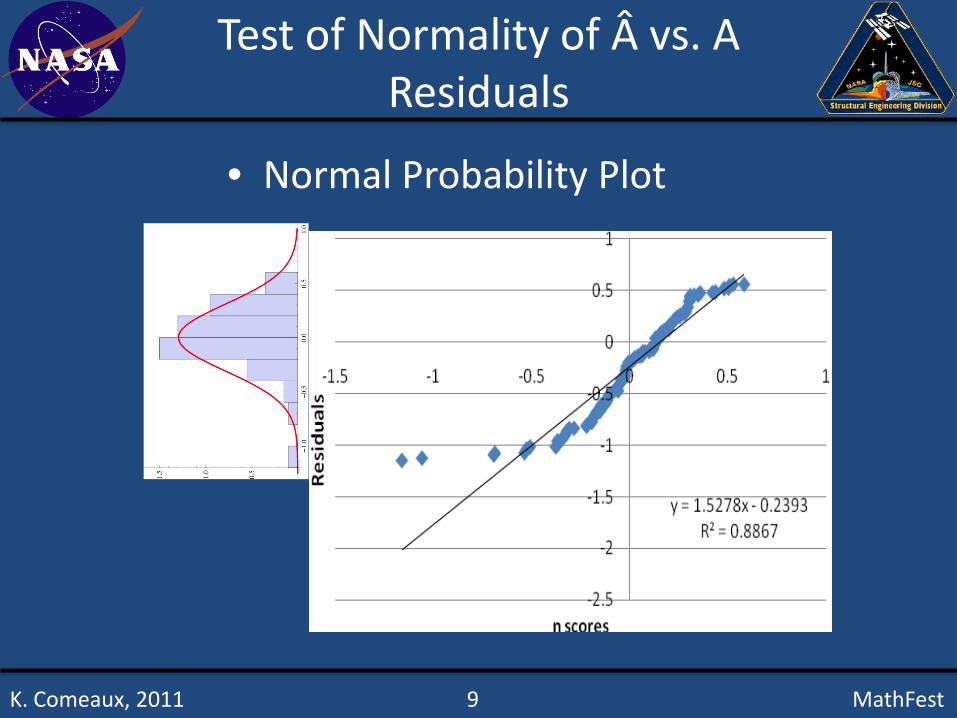
• Normal Probability Plot
Test of Normality of  vs. A Residuals
K. Comeaux, 2011 9 MathFest
• The graphical output of the software is accurate.
• The assumption of normality of residuals is correct. – However more data will make the residuals either
more normal or less normal.
Conclusions
K. Comeaux, 2011 10 MathFest
• Statistically analyze the assumptions of the University of Dayton Software as the thresholds of the IR thermography scan are changed.
Future Work
K. Comeaux, 2011 11 MathFest
Acknowledgements
• Mentors: Ajay Koshti & David Stanley
• Dr. Shelton
• Pi Mu Epsilon
• NASA MUST Program
K. Comeaux, 2011 12 MathFest
Exit Presentation: Infrared Thermography on Graphite/Epoxy