Page 1
University of KentuckyUKnowledge
Theses and Dissertations--Public Health (M.P.H. &Dr.P.H.) College of Public Health
2018
Statistical Analysis of Rabies Submissions inKentucky and Weather as a Potential Predictor ofPositive CasesHannah FreeUniversity of Kentucky, [email protected]
Click here to let us know how access to this document benefits you.
This Graduate Capstone Project is brought to you for free and open access by the College of Public Health at UKnowledge. It has been accepted forinclusion in Theses and Dissertations--Public Health (M.P.H. & Dr.P.H.) by an authorized administrator of UKnowledge. For more information, pleasecontact [email protected] .
Recommended CitationFree, Hannah, "Statistical Analysis of Rabies Submissions in Kentucky and Weather as a Potential Predictor of Positive Cases" (2018).Theses and Dissertations--Public Health (M.P.H. & Dr.P.H.). 187.https://uknowledge.uky.edu/cph_etds/187
Page 2
STUDENT AGREEMENT:
I represent that my thesis or dissertation and abstract are my original work. Proper attribution has beengiven to all outside sources. I understand that I am solely responsible for obtaining any needed copyrightpermissions. I have obtained and attached hereto needed written permission statements(s) from theowner(s) of each third-party copyrighted matter to be included in my work, allowing electronicdistribution (if such use is not permitted by the fair use doctrine).
I hereby grant to The University of Kentucky and its agents the non-exclusive license to archive and makeaccessible my work in whole or in part in all forms of media, now or hereafter known. I agree that thedocument mentioned above may be made available immediately for worldwide access unless apreapproved embargo applies.
I retain all other ownership rights to the copyright of my work. I also retain the right to use in futureworks (such as articles or books) all or part of my work. I understand that I am free to register thecopyright to my work.
REVIEW, APPROVAL AND ACCEPTANCE
The document mentioned above has been reviewed and accepted by the student’s advisor, on behalf ofthe advisory committee, and by the Director of Graduate Studies (DGS), on behalf of the program; weverify that this is the final, approved version of the student’s dissertation including all changes requiredby the advisory committee. The undersigned agree to abide by the statements above.
Hannah Free, Student
Wayne Sanderson, PhD, Major Professor
Dr. Corrine Williams, Director of Graduate Studies
Page 3
Statistical Analysis of Rabies Submissions in Kentucky and Weather as a Potential Predictor of Positive Cases
Capstone Project Paper
A paper submitted in partial fulfillment of the
requirements for the degree of Master of Public Health
In the University of Kentucky College of Public Health
By
Hannah Free
Lexington, Kentucky
April 13th, 2018
Committee Members
______________________________________ Wayne Sanderson, PhD
______________________________________ Steven Browning, PhD
______________________________________ Craig Carter, DVM, PhD, DACVPM, DSNAP
Page 4
2
CONTENTS
ABSTRACT..........................................................................................................4
INTRODUCTION.................................................................................................6
LITERATURE REVIEW..........................................................................................8
General Characteristics of Rabies.............................................................8
Characteristics of Rabies in the United States..........................................9
Predicting Models for Rabies.................................................................10
Temperature and Rabies........................................................................10
Precipitation and Rabies........................................................................11
METHODS........................................................................................................12
Dataset..................................................................................................12
Statistical Analysis.................................................................................14
RESULTS...........................................................................................................16
DISCUSSION.....................................................................................................18
Limitations............................................................................................20
Conclusion.............................................................................................21
APPENDIX........................................................................................................23
Figure 1.................................................................................................23
Figure 2.................................................................................................23
Figure 3.................................................................................................24
Page 5
3
Figure 4.................................................................................................24
Figure 5.................................................................................................25
Figure 6.................................................................................................25
Map 1....................................................................................................26
Map 2....................................................................................................26
Map 3....................................................................................................27
Map 4....................................................................................................27
Map 5....................................................................................................28
Map 6....................................................................................................28
Map 7....................................................................................................29
Map 8....................................................................................................29
Table 1……………………………………………………….……………………….….……………30
Table 2…………………………………………………………………………….………..…………30
Table 3……………………………………………………………………….………..………………30
Table 4……………………………………………………….……………….………….……………31
Table 5………………………………………………………………….…………………..…………31
Table 6……………………………………………………………….………………..………………31
REFERENCES.....................................................................................................32
BIOGRAPHICAL SKETCH………………………………………..…………..……………………………34
Page 6
4
Abstract
Background
The rabies virus is a zoonotic pathogen that is nearly 100 percent fatal once symptoms
occur. Because it is still active in wildlife populations in Kentucky, the need for
preventive measures and surveillance is critical. Temperature and precipitation have
been shown to affect rabies. This study examined rabies submissions in Kentucky,
weather and geographical distribution to both describe and predict cases.
Methods
Data from the University of Kentucky Veterinary Diagnostics laboratory were used to
assess rabies submissions from 2005 through 2015. These submissions were
anonymously submitted by the public and the Florescent Antibody Test was used to
determine infection status. Submissions were totaled across years to interpret
distribution over time. The rate of positive submissions over total submissions by county
was used to evaluate where rabies occurred in Kentucky. Next, maps were made to
assess distribution geographically. Fisher’s exact test was used to determine differences
between climate regions. Linear regression was used to examine the association
between climate region data and positive rates of submissions.
Results
Yearly distribution of submissions was fairly stable with a spike of both submissions and
positive results for the years 2008-2009. Fisher’s Exact test revealed significant
differences between climate region. Post-hoc analysis showed a non-significant
difference between the northern region of Kentucky compared to other regions. Maps
Page 7
5
of distribution of positive rates showed a belt of activity in southern Kentucky. A warmer
observed regional temperature was a statistically significant predictor of positive rates
of rabies submissions in linear regression models for all species as well as bats when
considered separately. However, this increase was exceptionally small and provided
little clinical significance.
Conclusion
Rabies in Kentucky is still active. While the majority of submissions come from the
northern parts of the state, the southern portion of Kentucky has a higher proportion of
positive submissions. Based on the results of this study, temperature should be
considered when trying to predict future cases of rabies in Kentucky. More research
using additional predictors could help establish a stronger relationship.
Page 8
6
Introduction
The rabies virus is a zoonotic pathogen that is nearly 100 percent fatal once
symptoms occur.1 A member of the Lyssavirus genus, this RNA virus can infect all
mammals and accounts for the deaths of approximately 59,000 people per year
globally.1 Rabies is still active in the United States, with 5.5 percent of animals tested for
rabies being found positive in 2015. Of these cases, 92.4 percent came from wildlife
populations. 1
Because rabies is still active in wildlife populations, the need for preventive
measures and surveillance is critical. Kentucky borders several states that are targeted
using the Oral Rabies Vaccine zones, making the state part of the vanguard for potential
exposure to rabies in the eastern United States. Current knowledge of state specific
statistics is especially crucial for doctors and veterinarians who need to make informed
decisions in cases where exposure might have occurred. Onset of the disease can occur
in as little as a week of exposure.2 When limited time is available to assess these cases,
physicians and wildlife management face the problem of having to wade through large
sets of information to find data that might be relevant to their situation.
While estimates in Kentucky are lower than the national average due to
surveillance and vaccination prevention strategies, the primary data on rabies
submissions from the Kentucky Department of Public Health had not been published or
used as a resource to understand the disease within the state. There is a substantial gap
Page 9
7
in the scientific literature on the distribution of rabies as well as risk factors and
protective factors for Kentucky.
Previously studied risk factors for rabies include the percentage of farmland,
rurality, and demographics.3 Rabies infection also has a seasonality pattern and could
benefit from a model that incorporates previously assessed predictors and weather.
Heat and precipitation could influence the behavior of both animals and people in
regard to exposure. Additionally, rabies transmission can be affected by how infected
fluids enter the body. Prevention with suspected bites outside of Post Exposure
Prophylaxis (PEP) includes cleaning the wound because washing away the virus can
prevent infection.2
The goals of this study were to describe the rates of rabies submissions, assess
rabies trends, and identify potential risk factors that can be used as predictors of the
disease in Kentucky based on rabies submissions from the years 2005 through 2015.
LITERATURE REVIEW
This literature review is comprised of articles and journals that come from
numerous health organizations. Database searches were conducted using resources
such as PubMed and the American Veterinary Medicine Association. Keywords and
phrases used in searches included rabies surveillance, rabies predictors, geographic
predictors of rabies, rabies and weather, and rabies control. The purpose of this review
is to gain an understanding of how the disease spreads, demonstrate the need in the
Page 10
8
literature for descriptive studies of rabies in Kentucky, and evaluate the possible
influence of weather on the rabies virus.
General Characteristics of Rabies
Rabies is caused by the RNA rhabdovirus which stems from the genus Lyssavirus.
There are at least 6 different serotypes that have been identified.2 The virus accounts
for the deaths of approximately 59,000 people per year globally.1 Transmission occurs
when saliva infected with the virus comes in contact with broken skin or the mucus
membrane. This usually occurs from bites, but transmission can also from scratches,
secretions and occasionally inhalation of aerosolized virus.2 After the host is
contaminated, the virus slowly begins to replicate and spread through nerve tissue until
it reaches the brain.2 Once the virus infects the brain, clinical signs begin to appear, and
prevention is no longer effective. Carnivorous mammals and bats are seen as the most
common reservoirs of the virus; however, all mammals can potentially develop and
transmit rabies.4
Characteristics of Rabies in the United States
In the United States, 91.6% of animals reported to be rabid were from wildlife
populations for 2012 and 92.4% of reported animals were from wildlife populations in
2015.1,5 Seasonality trends in wildlife populations have been reported and are relatively
consistent throughout the years.5 Reported cases of both rabid raccoons and skunks
tend to peak in March with a moderate second peak around August. Reports of rabid
bats tend to peak primarily in August.5
Page 11
9
Raccoon variant rabies can be found along the east coast of North America. In
order to create a barrier preventing the spread of raccoon rabies, oral rabies vaccination
(ORV) zones were established in strategic locations.6 ORV collaborations have been set
up across multiple states and Canadian territories and ORV is currently used as a
primary method of impeding raccoon variant rabies distribution.7 Because of these
vaccine zones and the natural barriers of the Appalachian mountains, raccoon variant
rabies is currently not present in Kentucky.
Rabies in Kentucky
Despite the lack of raccoon-variant rabies, Kentucky still has active rabies cases.
The state’s percentage of positive cases within the wildlife population is estimated to be
2% with the primary reservoirs being bat and skunk populations.1,8 While rabies is
described at the national level on nearly a yearly basis, relatively few studies have done
any analysis on rabies specific to Kentucky.1,9 One of the most recent studies conducted
in 1999 that looked at applying a geospatial filter to help improve rabies surveillance.10
The only other main additions to the literature regarding rabies specifically in Kentucky
during this nearly 20-year stretch includes an article describing the diagnosis of a human
case of rabies that happened to be in Kentucky and an article describing risk assessment
for a group of volunteers who had been exposed to bats.8,11 There is a substantial gap in
the literature for current evaluations of rabies in Kentucky.
Predicting Models for Rabies
Predictive approaches for raccoon rabies have included population level models
such as simple epidemic models that assess rabies given a uniform mixing of populations
Page 12
10
and multi-host deterministic models that account for cross-species interactions.12
Additionally, spatial analyses that look at natural and man-made barriers such as roads,
rivers, mountains and vaccine drops have been used to determine how landscapes
shape rabies outcomes.12 Other models have used seasonality based on life patterns of
hosts.12 Research on big brown bats found that cyclical birth and death rates had an
impact on rabies trends across time.13
Temperature and Rabies
Additional concepts in the seasonal bat research note that bats are facultative
heterotherms, meaning their body temperature decreases during hibernation. Because
of this it is theorized that viral incubation rates are prolonged during the winter
months.13 Experiments on Mexican free tailed bats injected with rabies virus that
controlled for temperature found that bats that were placed in cold conditions were less
likely to develop rabies than those in warmer conditions.14 However, once these bats
were transferred over to warmer conditions, the onset of rabies was quicker and viral
levels in saliva were more pronounced.14 Similar experiments on pallid bats revealed the
same relationship of temperature on infection outcomes. Pallid bats placed in cooler
environments showed negligible traces of the disease compared to those placed in
warmer settings when they were injected with rabies strains.15 They did mention the
importance of the metabolic rate of these in addition to ambient temperature worked
together. As experiments were undertaken during different seasons and metabolic rates
adjusted, the incubation times for rabies also changed.15
Page 13
11
In mice, experiments were conducted to see the effects of high ambient
temperature through the different stages of rabies infection. Temperature did not effect
the later stages of infection.16 Conversely, high heat was found to be protective during
the incubation of mice, delayed onset of signs, and was linked to decreased mortality.
They hypothesized that based on these results, bodily temperature variation could
impact the dynamics of infections, especially animals who hibernated such as skunks
and bats.16
Precipitation and Rabies
A study of skunks in Arizona found that precipitation could be a predictor for
rabies.17 They looked at long-term trends of skunk breeding seasons and past rainfall to
see how precipitation impacted disease outcomes. Models predicted that heavy rainy
seasons few years prior to outbreaks were indicators of severity.17 Their explanation of
these results is that rain may have an impact on food supply which contributes to
overall skunk populations.17 If population of skunks increase, this would also increase
the potential for interaction and spread of rabies.17
Summary of Need
Based on this literature review, there is a considerable need for analysis of rabies
distribution and prediction in Kentucky. The literature tends to look only at specific
species trend, so models that address overall distributions as well as species specific
distributions could help enhance an understanding of where hot spots are regardless of
animal type. While temperature and weather are shown to be influential on their own, a
Page 14
12
model that includes both variables and incorporates multiple species could be useful in
predicting the rate of rabies.
Materials and Methods
Data Set
The research design is an ecological study. Microsoft Excel and R Studio were
used to evaluate 10 years of rabies submissions from 2005 to 2015. The study
population was defined as submissions across the state of Kentucky that were sent to
the Health Department-Laboratory Services Division in Frankfort, Kentucky. These
submissions are currently tested, maintained and archived by the University of Kentucky
Veterinary Diagnostic Laboratory (UKVDL) in Lexington, Kentucky. All data collection for
animal submissions was passive and anonymous. Submissions included the following
information: county of origin, test result, species, exposure, and date of submission. The
Florescent Antibody Test determined the test result. Results are categorized as positive,
negative, or unsatisfactory for testing. Submissions were available for 106 counties. The
Kentucky counties not available include the following: Ballard, Caldwell, Calloway,
Carlisle, Crittenden, Fulton, Graves, Hickman, Hopkins, Livingston, Lyon, McLean, Todd,
and Trigg. For the time period between 2005 and 2015, 8883 submissions were
recorded. These submissions were used for calculating date figures. 116 submissions
that were missing county of origin or test date were excluded from later analysis. The
total number of reported submissions for Kentucky that met the criteria of complete
submission details were 8767 submissions for the years between 2005 and 2015.
Page 15
13
Population data comes from the 2010 United States Census. This includes
county-level total population and population per square mile for all relevant counties in
Kentucky. Multiple county-level rates were calculated using this data including total
submissions per population, total submissions per population per square mile, total
positives per population, total positives per population per square mile, total positives
over total submissions per population, and total positives over total submissions per
population per square mile. For the purpose of this study, population and population
per square mile were used as the metric for population density.
Weather data comes from the Midwestern Regional Climate Center climate
division data for the state of Kentucky. Data contain the temperature and precipitation
for each month by the five climate regions in Kentucky. Each county was assigned to its
respective climate region, so that monthly regional data could be used as an
approximation for weather in each county. The time frame starts on January 2005 and
ends with December 2015.
The key response variable is the rate of positive rabies submissions. This was
measured by the total number of positive submissions over the total number of all
submissions at the county level. Weather is the key covariate of interest in this study.
Monthly weather data was not available for each county in Kentucky, therefore it is
being assessed using climate regions as a proxy for the county level. Weather is
measured by monthly temperature in Fahrenheit and monthly precipitation in inches.
Page 16
14
Analysis
Initial analysis compared submissions for all species as well as submissions for
bats and skunks separately by creating bar graphs by year between 2005-2015. This was
done by charting the total number of rabies submissions in Kentucky for each year. In
order to include all submissions, even submissions lacking a county of origin were
allowed that were not aggregated in further analysis. Charts of total number of positive
rabies submissions in Kentucky for each year were then created to look at trends across
time for true cases of rabies as well. This part of the analysis was used to understand the
distribution of both confirmed cases and total submissions through the time frame used
for the study.
The next evaluation was a comparison of the variance between the four weather
regions in Kentucky to see if there is a difference in submission rates. Weather Region 1
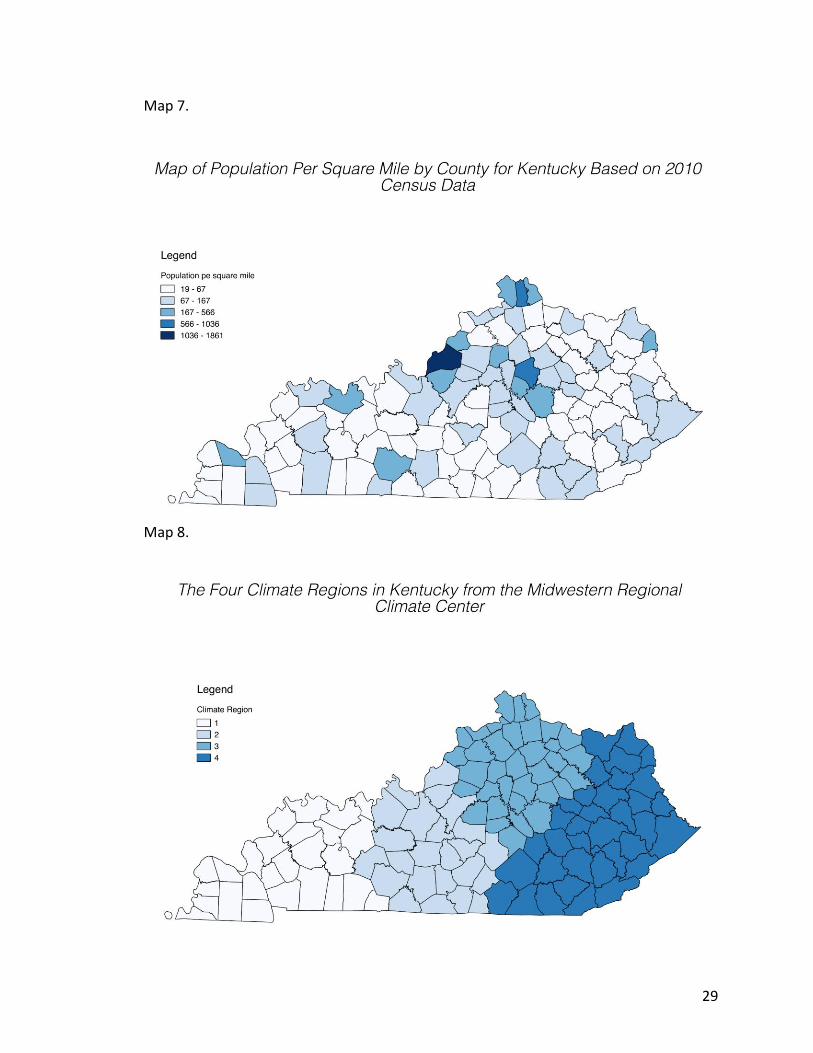
is located in Western Kentucky, Region 2 in the Mid-south, Region 3 in Northern
Kentucky, and Region 4 in Eastern Kentucky. A map showing the location of these
regions was created. These rates were calculated as the number of positives
submissions per region divided by the total number of submissions per region.
Histograms were created based to assess overall normality and normality between
weather regions. Tables of submissions by region were created for all species as well as
bats and skunks. Data were not normally distributed, so the rates were originally log
transformed. However, even with the transformation, the assumption of normality was
not met. Therefore, a chi-squared test was applied to the non-transformed rates. Total
submissions met the basic criteria for the chi-square test, however, skunk and bat
Page 17
15
submissions did not meet the minimal number criteria for positives. To assess regions,
Fisher’s Exact Test was performed on all submissions as well as bats and skunks and post
hoc analysis was done using pairwise comparisons of Fisher’s Exact Test with Bonferroni
corrections afterwards. Fisher’s Exact was chosen for its ability to handle smaller sample
sizes of positive cases and the Bonferroni correction was chosen in order to reduce type
1 error.18,19
Geographic area is crucial to my analysis as both the outcome of interest and
predictive factors are based off of location. Therefore, my next analysis was to create
maps that explored the relationship between my data and locations. Maps were created
using QGIS software. Maps were made for the raw counts of total submissions, total
positives, rates of positives over total submissions, the rates of positives over total
submissions over population per square mile, and locations of Kentucky climate regions.
No cluster analysis was performed due to the potential for a geographic bias. Instead,
bias in maps was adjusted based on population density by county. This map was added
because the number of positive submissions can depend on the abundance of total
samples and the abundance of total samples can depend on the population density.
Since data was collected passively from the public, submissions were more likely to
come from cities or locations that have convenient access to cities.
Based on the histograms and because the primary outcome of interest was a
rate rather than count data; a general linear regression model was used for the next
phase of the analysis. This allowed for a description of the probabilities of the outcome
of interest. Because weather data were based on monthly intervals and population data
Page 18
16
were based on 10-year census data, all data were merged at the individual rabies
submission level by county to create the final data set for the regression. The final
merged dataset included submission date, county, climate region, species, test result,
monthly temperature by region, monthly precipitation by region, population by county,
population per square mile by county, the rate of positive submission over total
submissions by county and the rate of positive submissions over total submissions by
population per square mile.
Results
Out of all 8767 total submissions, 186 submissions were positive over the ten
year period (2.11%). Of skunk submissions, there were a total of 238 submissions with
78 positive (32.77%). Of bat submissions, there was a total of 1835 submissions with 71
positive (3.87%). For the four climate regions, Region 1 had 336 total submissions with 5
positives (1.37%), Region 2 had 2307 total submissions with 38 positives (1.16%), Region
3 had 5016 total submissions with 126 positives (2.51%) and Region 4 had 1078 total
submissions with 17 positives (1.58%).
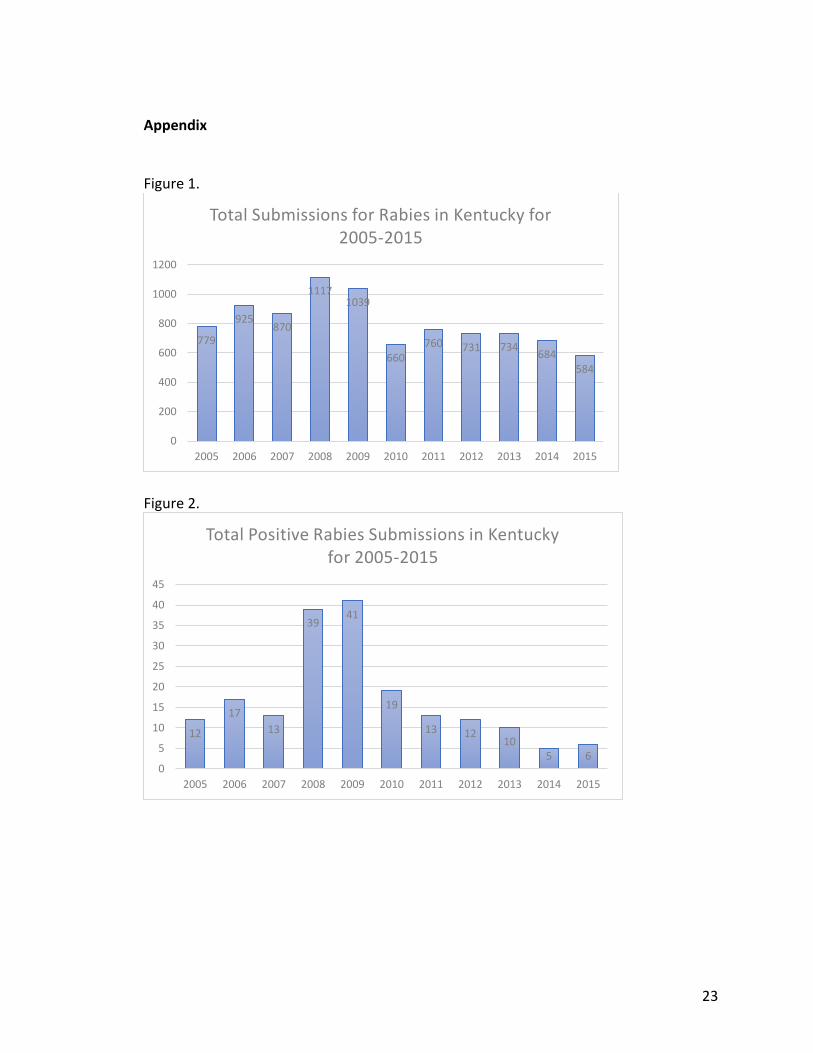
Figure 1 shows the time trend of rabies submissions in Kentucky for 2005
through 2015. Submissions are relatively stable across years with a slight jump in 2008
and 2009. Figure 2 shows the trend of positive rabies submissions for the same period.
There is a spike in positives for 2008 and 2009 followed by a return to relatively stable
but declining numbers subsequently. Figure 3 shows the time trend of total bat
submissions. The submissions oscillate between roughly 100 and 200 submissions with a
Page 19
17
few larger years. Figure 4 shows the time trend of positive bat submissions. These
submissions also fluctuate by year but with are much more exaggerated and do not
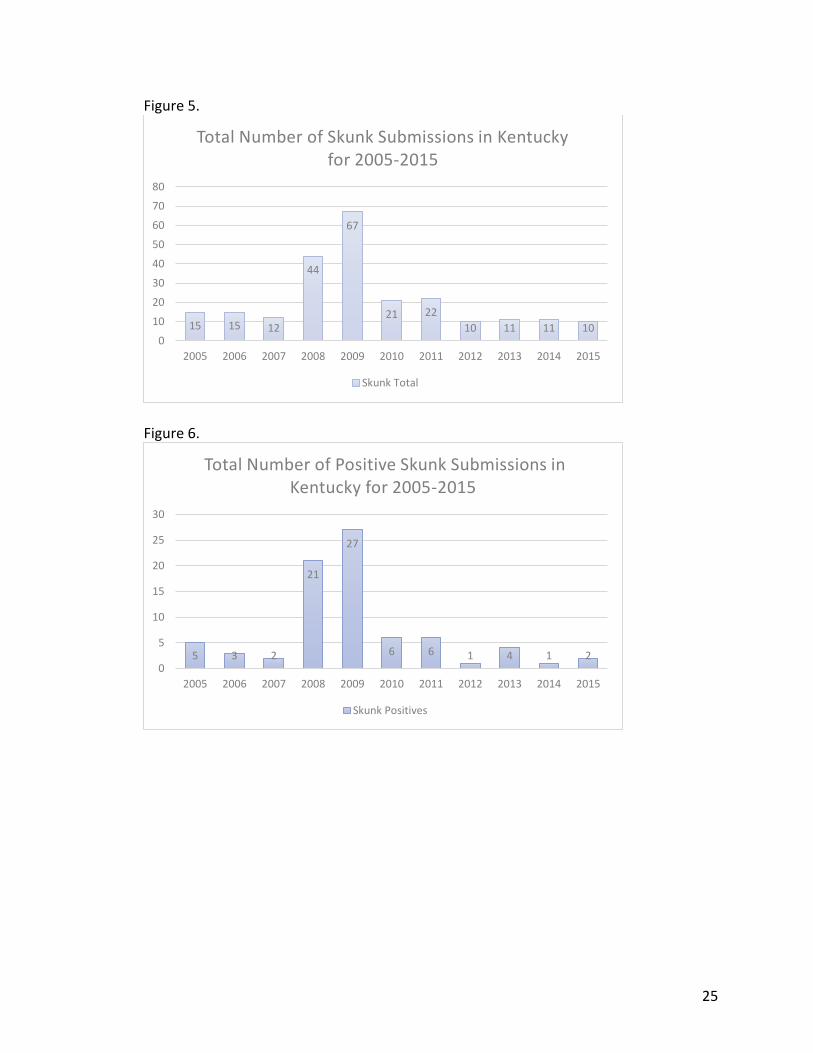
completely match the patterns of total bat submissions. Figure 5 shows the time trend
of skunk submissions. These submissions are stable with a spike in 2008 and 2009 being
the exceptions. Figure 6 shows the time trend of positive skunk submissions. Positive
skunk submissions are fairly stable except the spike in 2008 and 2009.
The chi-square test for total submission rates between climate regions was
statistically significant with a value of 8.73 and a p-value of 0.03. Post-Hoc analysis of
total submissions was conducted by looking at the residuals of the chi-squared. Region 3
appeared to be different from the other 3 regions. Fisher’s Exact Test was significant for
total submissions with a p-value of 0.038 and skunk submissions with a p-value of
0.0095. Bat submissions for Fisher were not significant with a p-value of 0.107. Pairwise
comparison of total submissions showed that region 3 was different, but not statistically
significant. Pairwise comparison of skunk submissions revealed at statistically significant
difference between region 2 and 3 with a p-value of 0.013.
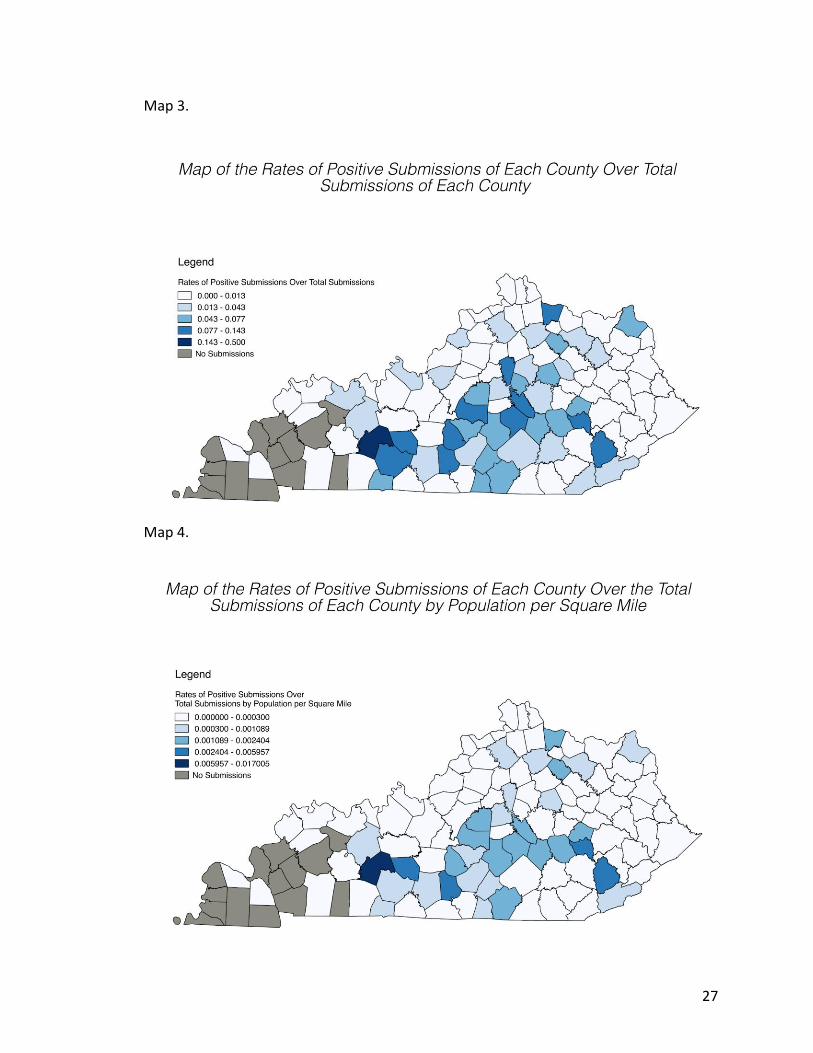
Map 1 also demonstrates the geographic distribution of submissions center
around Fayette County. Map 2 shows the positives that are also mainly found arranged
near Fayette County but also a small belt was present in Southern Kentucky. When rates
of positives were included in Map 3, the belt became even more pronounced with
Butler County having the highest rate of positives. Map 4 shows the rates of positives
when population per square mile is accounted for. It yields similar results to map three.
Map 5 shows the rates of positives for bats and Map 6 shows the rates of positives for
Page 20
18
skunks. Map 7 shows the 2010 census population in Kentucky and Map 8 shows the 4
climate regions for reference. Jefferson County had the highest population.
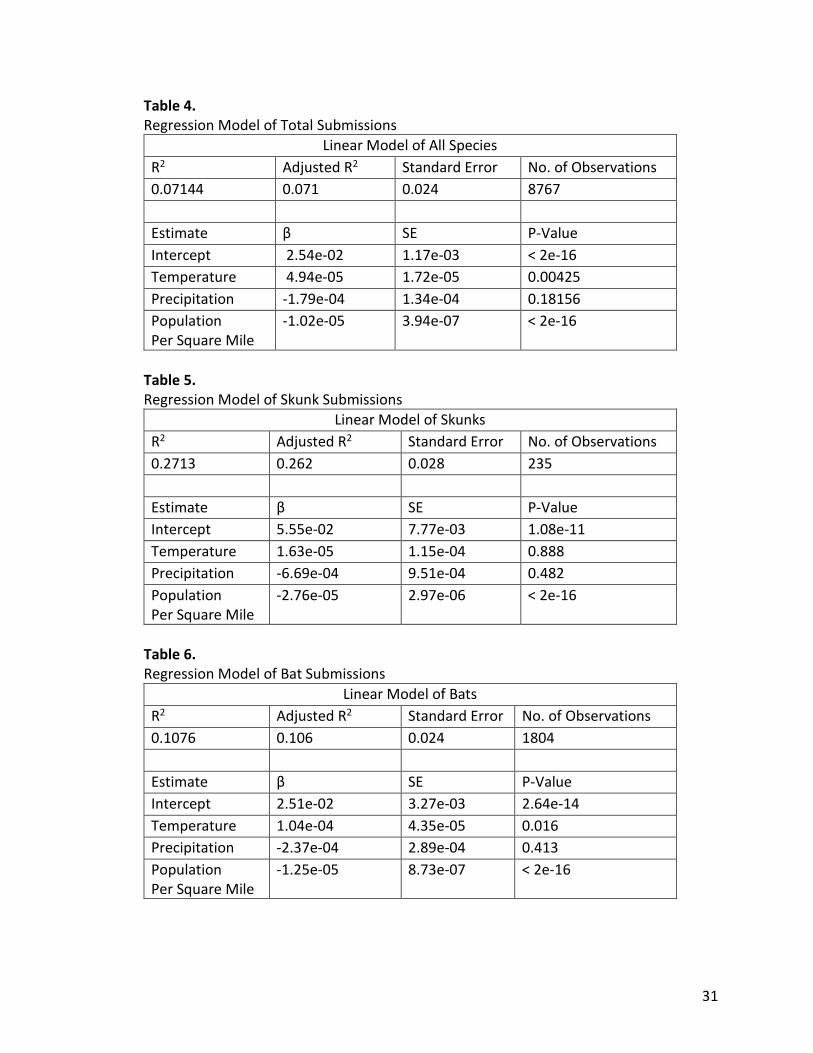
Linear Regression models of all species found temperature to be a significant
predictor. Bat submissions also had temperature as a significant predictor. Neither
precipitation nor the interaction of precipitation and temperature were found to be
significant in any of the models. The model of all species had an adjusted R2 of 0.07.
The model of skunks had an adjusted R2 of 0.26 and the model of bats an adjusted R2 of
0.1.
Discussion
First, yearly submissions fluctuate over time but remain relatively stable aside
from a large spike between 2008 and 2009. 2008 was around the time when issues of
testing validity had occurred in Kentucky. Because of this, it is hypothesized that more
sampling had been performed to during this time and this would account for the spike in
submissions. Overtime, positive submissions appear to be stable or declining, which
matches trends in the United States. While bat positives vary by year in Kentucky, this
also matches the cyclical patterns described in the literature. Second, the majority of
submissions come from Fayette County in Region 3 and this most likely accounts for the
variation between submissions by weather region, although geography and weather
could also be contributing factors to regional differences. Continuing with the maps,
there appears to be a belt of positives per submissions in Southern Kentucky, which
follows an almost straight line through the southern counties. There are some roads in
Southern Kentucky that mirror this pattern, and this could be influencing either the
Page 21
19
distribution of positive rabies cases or have a confounding effect on people who make
submissions in that area. This is because where roads, there is more likely to be human
activity that could lead to more submissions. Another potential way roads could
influence cases would depend on whether or not street lights are present. If roads in
this area have street lights, then this might attract bugs at night which would attract
bats. Roads that have a large amount of roadkill could also add to submissions out of
convenience for people who submit. Insects from street lights or road kill could easily
attract bats or carnivorous terrestrial mammals that would normally be less likely to
come into contact with other animals or people. While roads could potentially explain
some this phenomenon in this belt area, more research is needed to produce a valid
conclusion. Regardless of whether roads contribute to this phenomenon, southern
Kentucky has the highest rates of positive submissions. When considering PEP for those
who have been exposed to wildlife, the counties indicated on the map of rates provides
information on the areas that are most likely to have rabies infection. The all species
map can be used for general exposure and the species-specific maps offer guidance to
those exposed to bats or skunks in specific areas. These rate maps improve upon the
current knowledge of rabies in Kentucky because the maps account for some of the bias
in sampling, allowing the areas with the actual problems to be observed. The rate maps
could also be used for evaluating ORV success and targeting counties that could benefit
the most from intervention.
Finally, the regression revealed a positive relationship with temperature that
agreed with the findings from the literature review with skunks being the exception. The
Page 22
20
relationship between skunk submission rates and precipitation was not observed
compared to previous findings. However, this could be due to the naturally different
environmental conditions between the example from the literature and conditions in
Kentucky. In the study in Arizona, it makes sense that rain would improve population
and infection because of the arid climate of the state. Dry conditions would prevent
plant growth; decreasing access to food and thus decreasing skunk population. In
Kentucky, rain is more frequent and access to food is not as driven by precipitation to
the same extreme. Given what is known about temperature and rabies, winter months
would possibly suspend rabies activity in Kentucky which would resume once spring and
summer return. While not statistically significant, precipitation had a negative
relationship with the rate of positives which also matched my initial hypothesis. It
should also be noted that when an interaction between temperature and precipitation
were placed in the model during the exploratory analysis, the interaction was also
insignificant. Even with the statistical significance of temperature on the general and bat
submissions, the model showed only a fraction of an increase in the rate of positives.
Strengths and Limitations
Several limitations must be addressed. Because submissions were sent to the
Veterinary Diagnostic Lab in Fayette County and data were collected passively, there is
selection bias of having higher submissions in locations closer to Fayette County due to
the convenience of distance from the lab. An additional state laboratory is located in
western Kentucky that also performs rabies testing. However, due to issues in testing
accuracy, these results were not considered to be as reliable as the UKVDL and thus
Page 23
21
were not included in the state-wide analysis. Because of location bias and the
competing lab, this study does lose some of its generalizability and would not be as
powerful in assessing rates especially in western Kentucky. With climate region acting as
a proxy for weather by county, there are limitations to the accuracy of measurements
for each county. Especially for counties that are on the boarders of each region, the
approximation of weather measurements might not hold true as much as the sentinel
counties where the data were actually recorded. Because there are a lot of zeros in the
data, this truncates the results and therefore the linear regression can only account for
so much variation. Regarding confounding, there are several variables mentioned in the
literature that could be influencing rabies rates. The seasonal behaviors of animals,
access to food, availability of habitat, could be influencing the regression in ways that
were not accounted for in this study. Other potential confounders could involve the
behavior of people who provide submissions and their understanding of the disease
potentially through education or experience. Strengths included the validity of test
results. Because the UKVDL will only test submissions that yield a valid result, positive
results could be confidently treated as such because any sample that was deemed unfit
for testing was marked as “unsatisfactory for testing” for the result.
Conclusion
Based on the results of this study, temperature does not appear to be clinically
useful in determining the proportion of positive submissions in Kentucky. The most
relevant areas of activity for rabies in Kentucky appear to be in the south. In future
research that stems from findings such as these, it may be useful to build a model that
Page 24
22
not only includes weather and population data, but also includes additional predictors
such as cropland, altitude, roads and forested area.
Page 25
23
Appendix Figure 1.
Figure 2.
779
925870
11171039
660760 731 734
684584
0
200
400
600
800
1000
1200
2005 2006 2007 2008 2009 2010 2011 2012 2013 2014 2015
Total Submissions for Rabies in Kentucky for 2005-2015
12
17
13
3941
19
13 1210
5 60
5
10
15
20
25
30
35
40
45
2005 2006 2007 2008 2009 2010 2011 2012 2013 2014 2015
Total Positive Rabies Submissions in Kentucky for 2005-2015
Page 26
24
Figure 3.
Figure 4.
107
193
120
251
198
136122
164 157
201186
0
50
100
150
200
250
300
2005 2006 2007 2008 2009 2010 2011 2012 2013 2014 2015
Total Number of Bat Submissions in Kentucky for 2005-2015
Bat Total
7
10
3
12
5
12
5
8
43
20
2
4
6
8
10
12
14
2005 2006 2007 2008 2009 2010 2011 2012 2013 2014 2015
Total Number of Positive Bat Submissions in Kentucky for 2005-2015
Bat Positives
Page 27
25
Figure 5.
Figure 6.
15 15 12
44
67
21 22
10 11 11 100
10
20
30
40
50
60
70
80
2005 2006 2007 2008 2009 2010 2011 2012 2013 2014 2015
Total Number of Skunk Submissions in Kentucky for 2005-2015
Skunk Total
5 3 2
21
27
6 6 1 4 1 20
5
10
15
20
25
30
2005 2006 2007 2008 2009 2010 2011 2012 2013 2014 2015
Total Number of Positive Skunk Submissions in Kentucky for 2005-2015
Skunk Positives
Page 32
30
Table 1. Submissions by Weather Region for All Species
Table of Submissions by Weather Region for All Species
Region Total Number of Submissions
Total Number of Positive Submissions
Percentage of Positives and 95% CI
1 366 5 1.37% (0.50, 3.00)
2 2307 38 1.65% (1.17, 2.23)
3 5016 126 2.51% (2.12, 2.97)
4 1078 17 1.58% (0.92, 2.46)
Grand Total 8767 186 2.12% (1.83, 2.44)
Table 2. Submissions by Weather Region for Skunks
Table of Submissions by Weather Region for Skunks
Region Total Number of Submissions
Total Number of Positive Submissions
Percentage of Positives and 95% CI
1 3 1 33.33% (1.67, 86.8)
2 43 6 13.95% (5.86, 26.78)
3 182 69 37.91% (31.08, 45.13)
4 10 2 20.00% (3.5, 51.95)
Grand Total 238 78 32.77% (27.03, 38.93)
Table 3. Submissions by Weather Region for Bats
Table of Submissions by Weather Region for Bats
Region Total Number of Submissions
Total Number of Positive Submissions
Percentage of Positives and 95% CI
1 58 4 6.90% (2.23, 15.8)
2 438 17 3.88% (2.35, 6.02)
3 1123 37 3.29% (2.36, 4.47)
4 188 12 10.17% (5.63, 16.65)
Grand Total 1807 70 3.87% (3.055, 4.84)
Page 33
31
Table 4. Regression Model of Total Submissions
Linear Model of All Species
R2 Adjusted R2 Standard Error No. of Observations
0.07144 0.071 0.024 8767
Estimate β SE P-Value
Intercept 2.54e-02 1.17e-03 < 2e-16
Temperature 4.94e-05 1.72e-05 0.00425
Precipitation -1.79e-04 1.34e-04 0.18156
Population Per Square Mile
-1.02e-05 3.94e-07 < 2e-16
Table 5. Regression Model of Skunk Submissions
Linear Model of Skunks
R2 Adjusted R2 Standard Error No. of Observations
0.2713 0.262 0.028 235
Estimate β SE P-Value
Intercept 5.55e-02 7.77e-03 1.08e-11
Temperature 1.63e-05 1.15e-04 0.888
Precipitation -6.69e-04 9.51e-04 0.482
Population Per Square Mile
-2.76e-05 2.97e-06 < 2e-16
Table 6. Regression Model of Bat Submissions
Linear Model of Bats
R2 Adjusted R2 Standard Error No. of Observations
0.1076 0.106 0.024 1804
Estimate β SE P-Value
Intercept 2.51e-02 3.27e-03 2.64e-14
Temperature 1.04e-04 4.35e-05 0.016
Precipitation -2.37e-04 2.89e-04 0.413
Population Per Square Mile
-1.25e-05 8.73e-07 < 2e-16
Page 34
32
References:
1 Birhane MG, Cleaton JM, Monroe BP, Wadhwa A, Orciari LA, Yager P, Blanton J, Velasco-Villa A, Petersen BW, Wallace RM. Rabies surveillance in the United States during 2015. Journal of the American Veterinary Medical Association. 2017 May 15;250(10):1117-30.
2 Hankins DG, Rosekrans JA. Overview, prevention, and treatment of rabies. In Mayo Clinic Proceedings 2004 May 1 (Vol. 79, No. 5, pp. 671-676). Elsevier.
3 Reilly S, Sanderson WT, Christian WJ, Browning SR. Geographical Clusters and Predictors of Rabies in Three Southeastern States. Vector-Borne and Zoonotic Diseases. 2017 Jun 1;17(6):432-8.
4 Nigg AJ, Walker PL. Overview, prevention, and treatment of rabies. Pharmacotherapy: The Journal of Human Pharmacology and Drug Therapy. 2009 Oct 1;29(10):1182-95.
5 Dyer JL, Wallace R, Orciari L, Hightower D, Yager P, Blanton JD. Rabies surveillance in
the United States during 2012. Journal of the American Veterinary Medical Association. 2013 Sep 15;243(6):805-15.
6 Slate D, Rupprecht CE, Donovan D, Badcock J, Messier A, Chipman R, Mendoza M,
Nelson K. Attaining raccoon rabies management goals: history and challenges. Developments in biologicals. 2008 Jan 1;131:439-48.
7 Slate D, Algeo TP, Nelson KM, Chipman RB, Donovan D, Blanton JD, Niezgoda M, Rupprecht CE. Oral rabies vaccination in North America: opportunities, complexities, and challenges. PLoS neglected tropical diseases. 2009 Dec 22;3(12):e549.
8 Thoroughman D, Russell ES. Assessment of Risk for Exposure to Bats in Sleeping
Quarters Before and During Remediation—Kentucky, 2012. MMWR-MORBIDITY AND MORTALITY WEEKLY REPORT. 2013 May 17;62(19):382-4.
9 Blanton JD, Hanlon CA, Rupprecht CE. Rabies surveillance in the United States during 2006. Journal of the American Veterinary Medical Association. 2007 Aug 15;231(4):540-56.
10 Curtis A. Using a spatial filter and a geographic information system to improve rabies
surveillance data. Emerging Infectious Diseases. 1999 Sep;5(5):603. 11 House J, Poe J, Humbaugh K, Drew C, Paddock C, Zaki S, Rupprecht C, Ritchey M,
Page 35
33
Petersen B. Human rabies-Kentucky/Indiana, 2009. Morbidity and Mortality Weekly Report. 2010;59(13):393-6.
12 Elmore SA, Chipman RB, Slate D, Huyvaert KP, VerCauteren KC, Gilbert AT.
Management and modeling approaches for controlling raccoon rabies: The road to elimination. PLoS neglected tropical diseases. 2017 Mar 16;11(3):e0005249.
13 George DB, Webb CT, Farnsworth ML, O'Shea TJ, Bowen RA, Smith DL, Stanley TR,
Ellison LE, Rupprecht CE. Host and viral ecology determine bat rabies seasonality and maintenance. Proceedings of the National Academy of Sciences. 2011 Jun 21;108(25):10208-13.
14 Sulkin SE, Allen R, Sims R, Krutzsch PH, Kim C. Studies on the pathogenesis of rabies in insectivorous bats: II. Influence of environmental temperature. Journal of Experimental Medicine. 1960 Oct 1;112(4):595-617.
15 Sadler WW, Enright JB. Effect of metabolic level of the host upon the pathogenesis of rabies in the bat. The Journal of infectious diseases. 1959 Nov 1:267-73. 16 Bell JF, Moore GJ. Effects of high ambient temperature on various stages of rabies virus infection in mice. Infection and immunity. 1974 Sep 1;10(3):510-5. 17 Hass CC, Dragoo JW. Rabies in hooded and striped skunks in Arizona. Journal of
wildlife diseases. 2006 Oct;42(4):825-9.
18 Shan G, Gerstenberger S. Fisher’s exact approach for post hoc analysis of a chi- squared test. PloS one. 2017 Dec 20;12(12):e0188709.
19 Armstrong RA. When to use the Bonferroni correction. Ophthalmic and Physiological
Optics. 2014 Sep 1;34(5):502-8.
Page 36
34
Biographical Sketch Hannah Free completed her Bachelor of Science in Statistics and minor in Biology from
the University of Tennessee in 2015. Upon completing her bachelor’s, she worked in the
Business Analytics and Statistics department at the University of Tennessee for a
semester before entering the Master of Public Health program at the University of
Kentucky. Currently, Hannah is a responder for the Kentucky Public Health Assistance
and Support Team. She is also working with the Central Appalachian Regional Education
and Research Center and the University of Kentucky Veterinary Diagnostic Lab as a
statistical and spatial disease analyst.