28
Statistical Approaches for Finding Bugs in Large-Scale Parallel Systems Leonardo R. Bachega
| Date post: | 01-Jan-2016 |
| Category: |
Documents |
| Upload: | reece-osborn |
| View: | 19 times |
| Download: | 2 times |

Statistical Approaches for Finding Bugs in Large-Scale Parallel Systems
Leonardo R. Bachega
Papers
1. Problem Diagnosis in Large-Scale Computing Environments, A. Mirgorodskiy, N. Maruyama, Barton Miller, SC 2006;
2. DMTracker: Finding Bugs in Large-Scale Parallel Programs by Detecting Anomaly in Data Movements, Q. Gao, F. Qin, D. Panda, SC 2007.

Motivation for the Papers
• Debugging is a very hard task– ½ of the development time in sequential
applications– Problem gets magnified in systems with
hundreds of processes
• Massively parallel systems becoming popular– How do we make parallel debugging easier by
leveraging statistical bug detection techniques?

BackgroundStatistical Techniques
– Explore properties likely to hold at certain program points– Run-time information collected in traces– Empirical Execution models (profiles): Built from trace
information– Find similarities (and dissimilarities) between profiles– Classification into groups– Outliers as suspects for buggy behavior– Assumption: Correct behavior is the common case, faulty
behavior is unusual - a deviation from the common case
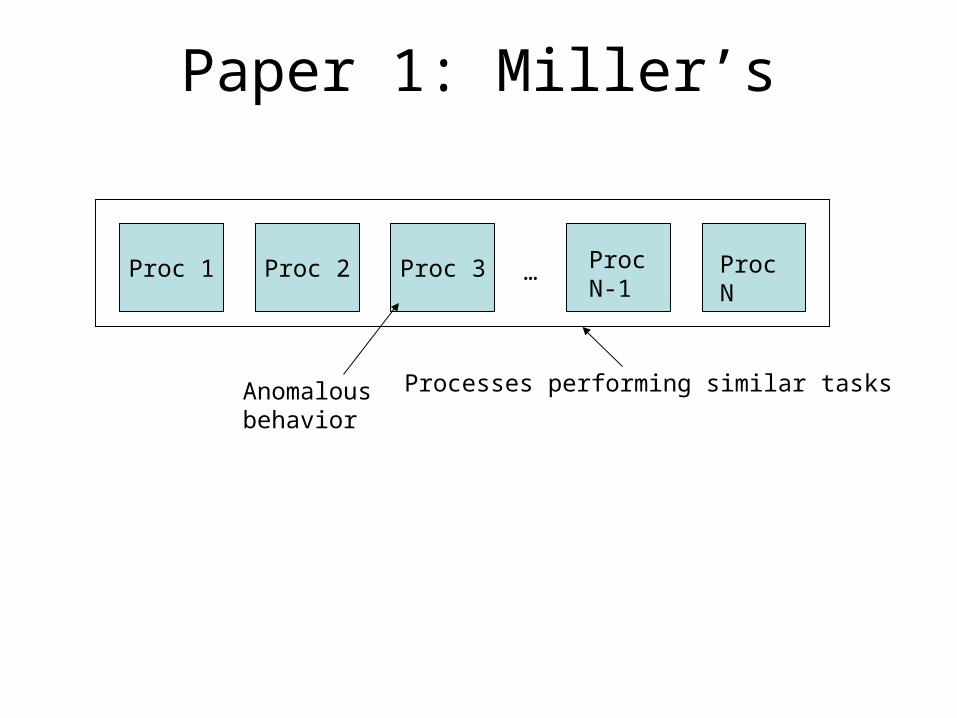
Paper 1: Miller’s
Proc 1 Proc 2 Proc 3 … Proc N-1
Proc N
Processes performing similar tasksAnomalousbehavior
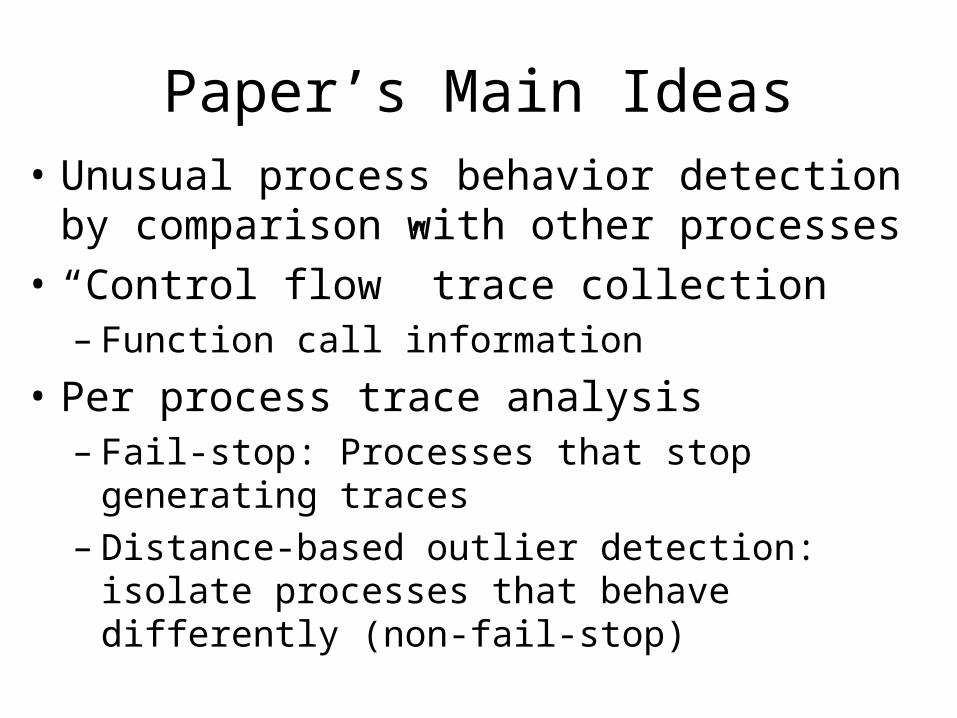
Paper’s Main Ideas• Unusual process behavior detection by
comparison with other processes
• “Control flow” trace collection– Function call information
• Per process trace analysis– Fail-stop: Processes that stop generating traces– Distance-based outlier detection: isolate processes
that behave differently (non-fail-stop)

Fault Model• Non-deterministic fail-stop failures
– failing process stop collecting traces earlier
• Infinite loops– process spends unusual amount of time in a
particular function
• Deadlock, livelock, starvation– deadlocked procs stop generating traces– Starving procs spend time in different parts than
procs with resources granted
• Load imbalance– Unusual little time spent on certain parts– Analyst identifies

Limitations of Fault Model
A problem that…
• Happens in all nodes is considered normal behavior
• Doesn’t change the ctrl flow is not detected
• Happens too early can’t be tracked since the trace collection is limited (can’t go too far back in history)
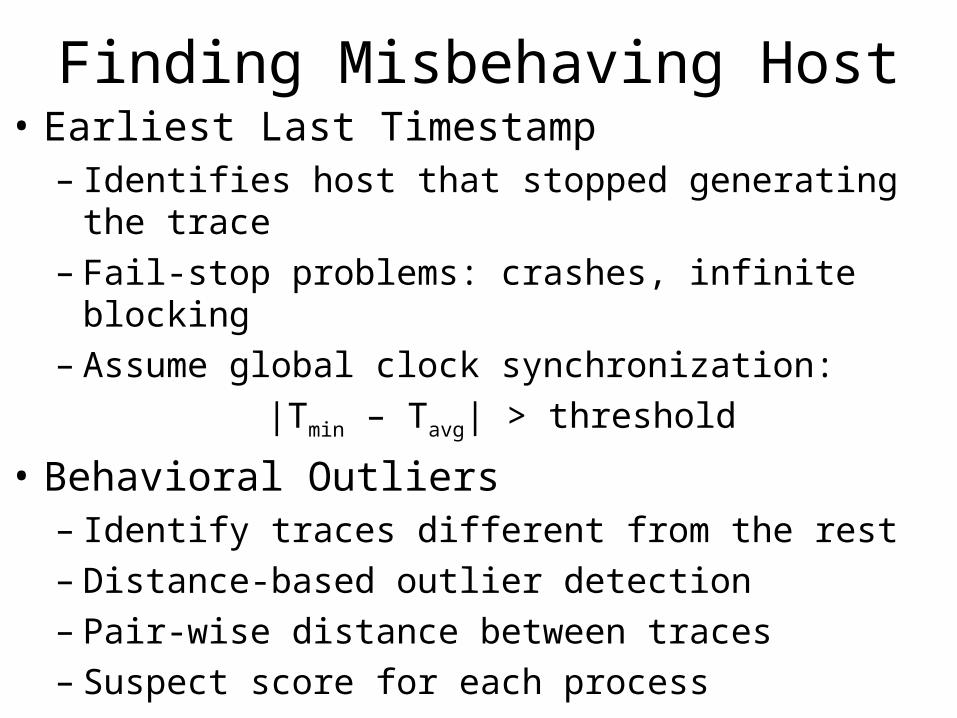
Finding Misbehaving Host• Earliest Last Timestamp
– Identifies host that stopped generating the trace– Fail-stop problems: crashes, infinite blocking– Assume global clock synchronization:
|Tmin – Tavg| > threshold
• Behavioral Outliers– Identify traces different from the rest– Distance-based outlier detection– Pair-wise distance between traces– Suspect score for each process

Profile’s distance metrics
Time spent at f1 in host h
If h and g are similar: each function will consume similar amounts of time on both hosts and d(g,h) will be low
Manhattan distance
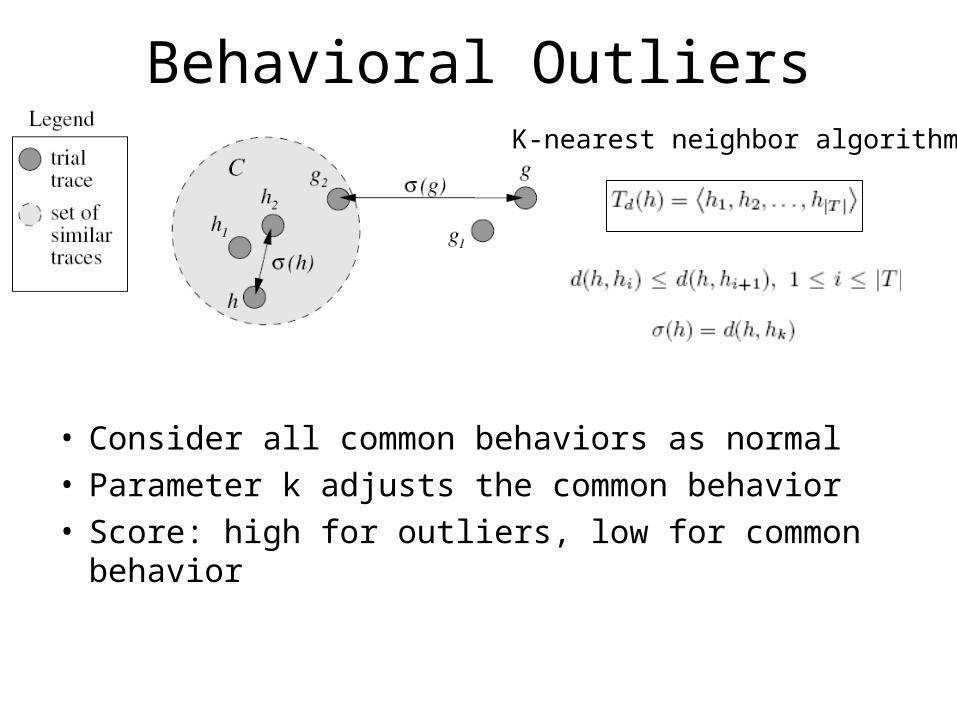
Behavioral Outliers
• Consider all common behaviors as normal• Parameter k adjusts the common behavior• Score: high for outliers, low for common
behavior
K-nearest neighbor algorithm:
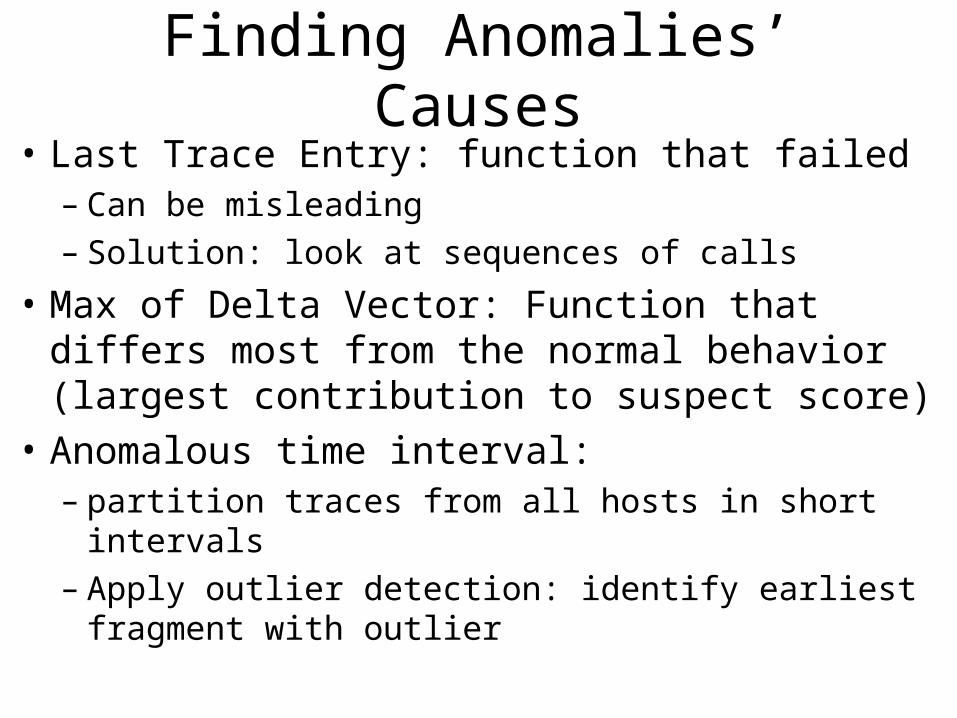
Finding Anomalies’ Causes• Last Trace Entry: function that failed
– Can be misleading– Solution: look at sequences of calls
• Max of Delta Vector: Function that differs most from the normal behavior (largest contribution to suspect score)
• Anomalous time interval: – partition traces from all hosts in short intervals– Apply outlier detection: identify earliest fragment
with outlier
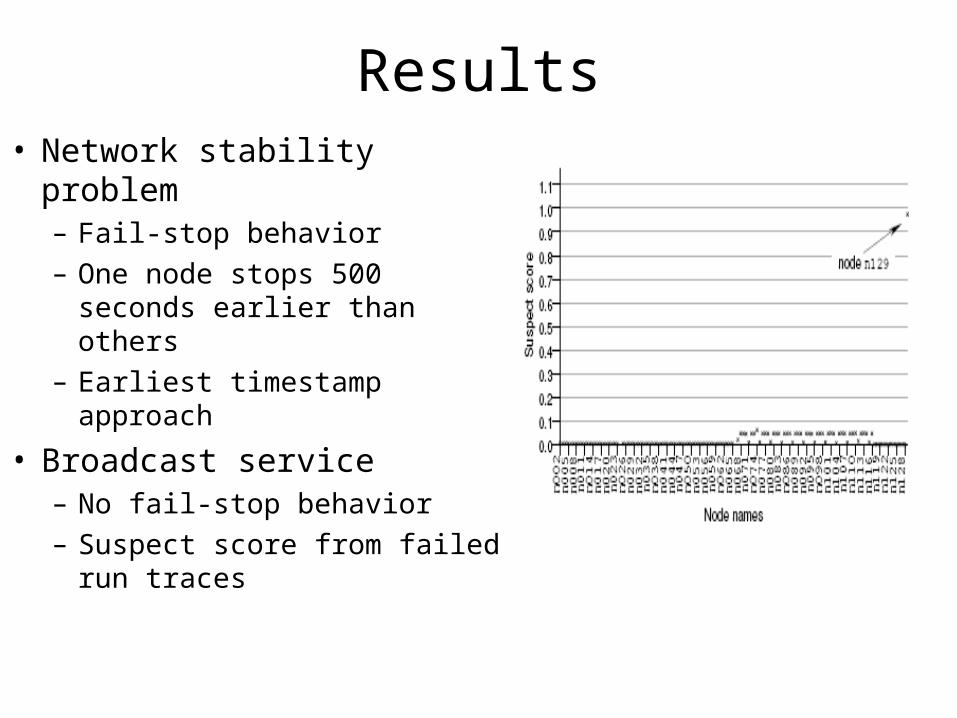
Results• Network stability problem
– Fail-stop behavior– One node stops 500 seconds
earlier than others– Earliest timestamp approach
• Broadcast service– No fail-stop behavior– Suspect score from failed run
traces
Summary and Conclusions
• Trace analysis to explain failures in large-scale distributed systems
• Detect anomalies rather than massive failures
• Identify both fail-stop and non-fail-stop anomalous behavior

Paper 2: DMTracker
Proc 1 Proc 2 Proc 3 … Proc N-1
Proc N
Processes performing similar tasksAnomalousbehavior
Proc 1 Proc 2 Proc 3 … Proc N-1
Proc N
Processes performing similar tasks
Spatial Dissimilarity
Temporal Dissimilarity
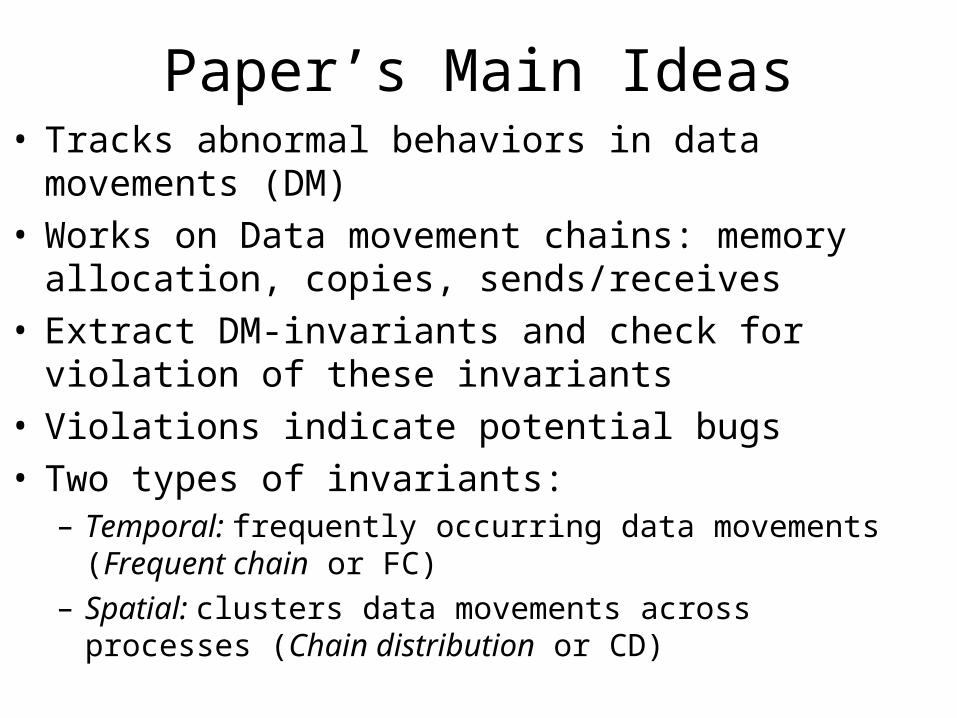
Paper’s Main Ideas• Tracks abnormal behaviors in data movements (DM)• Works on Data movement chains: memory allocation,
copies, sends/receives• Extract DM-invariants and check for violation of these
invariants• Violations indicate potential bugs• Two types of invariants:
– Temporal: frequently occurring data movements (Frequent chain or FC)
– Spatial: clusters data movements across processes (Chain distribution or CD)

Data Movement ChainsSingle processor DMs Multi-processor DMs
Match Sends/Receives from processes’traces
Concatenation of memory operationsof a trace file

Key: Data Movement Chain
Normal ExecutionBuggy Execution
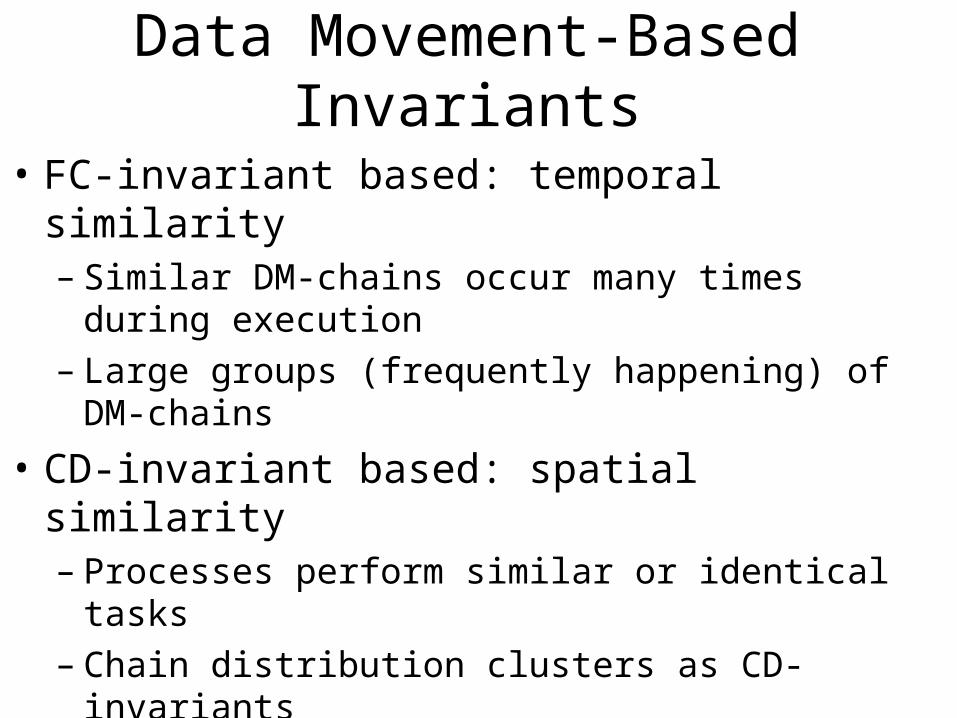
Data Movement-Based Invariants
• FC-invariant based: temporal similarity– Similar DM-chains occur many times during
execution– Large groups (frequently happening) of DM-chains
• CD-invariant based: spatial similarity– Processes perform similar or identical tasks– Chain distribution clusters as CD-invariants

DMTracker: Design Overview
Function callsMemory mgmt: allocation/deallocationData Movement: copies/network operations
RecordsKey arguments / return valuesCall sitesThread IDsLocal timestamps
Correlates each operation to its source and destination
Invariants generation
• Groups formed by chains of same type
• Chains of same type have the same– call sites for individual DM operations– allocation call sites for source and destination
buffers
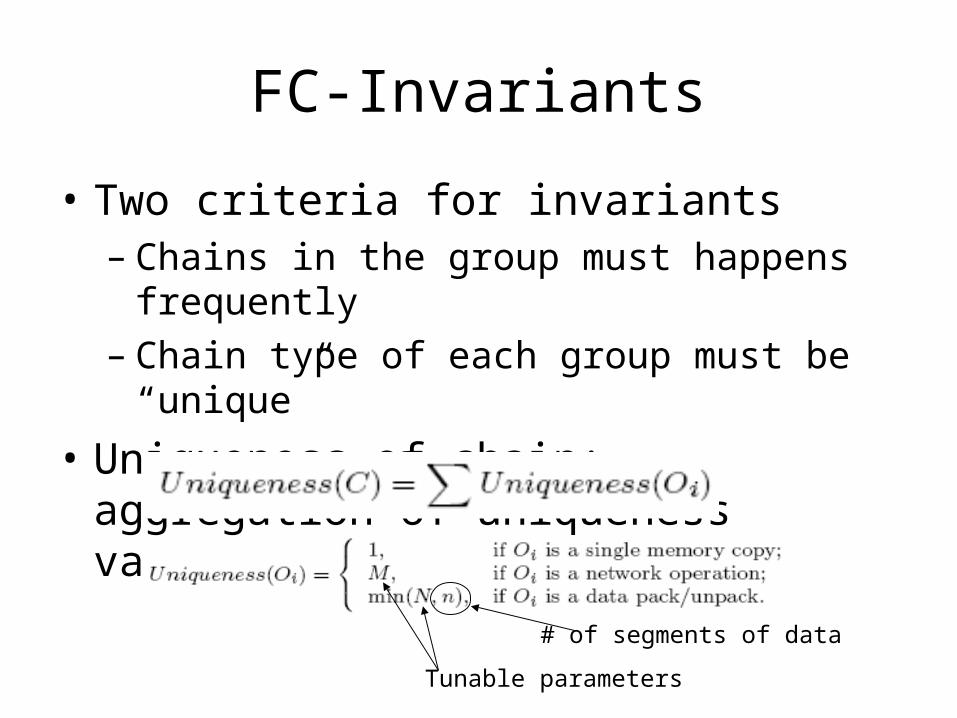
FC-Invariants
• Two criteria for invariants– Chains in the group must happens frequently– Chain type of each group must be “unique”
• Uniqueness of chain: aggregation of uniqueness values of memory operations
Tunable parameters
# of segments of data

FC-Invariant Anomaly Detection
• Abnormality of P compared to C based in
– Combined using harmonic mean:
• Threshold for abnormality is an adjustable parameter
)()()(
)(
)(
)(),(
PCUniquenessPUniquenessCUniqueness
PCUniqueness
PCUniqueness
PCUniquenessPCSimilarity
)(
)()(),(
PFrequency
CFrequencyPFrequencyPCRareness
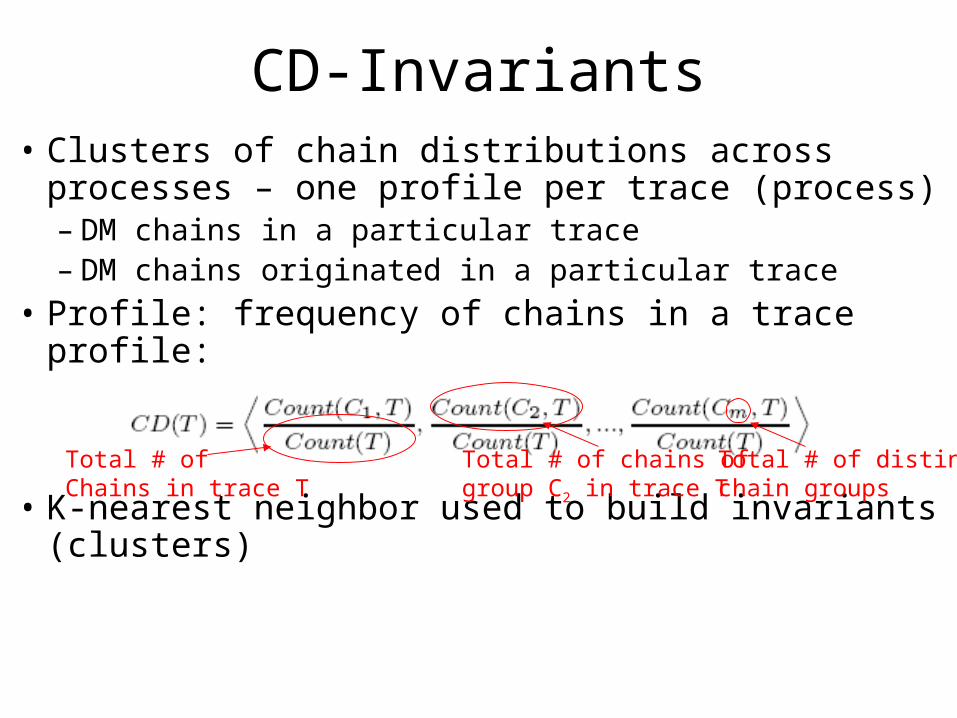
CD-Invariants• Clusters of chain distributions across
processes – one profile per trace (process)– DM chains in a particular trace– DM chains originated in a particular trace
• Profile: frequency of chains in a trace profile:
• K-nearest neighbor used to build invariants (clusters)
Total # of distinct chain groups
Total # of Chains in trace T
Total # of chains ofgroup C2 in trace T

CD-Invariant Anomaly Detection
• Abnormal trace: distance to k-nearest neighbor exceeds threshold
• Exactly the same procedure as in paper1!

DMTracker Results
• FC-Invariant (15,075 times) violated by similar chains: 154 times– All processes triggered the bug
• CD-Invariant: catches non-deterministic bug

DMTracker Summary
• Data Movement chains derived from traces
• Frequency Chain and Chain Distribution invariants to capture temporal and spatial correlations in parallel system
• Study cases show bug detection

General Observations
• Use of spatial and temporal invariants• Detection of deviant behavior as opposed
to common behavior• Simple Machine Learning techniques
applied for data classification• Bug detection in large systems using
outlier detection• Very few results to support broad
conclusions about the effectiveness of the techniques


