199
Technical Report Statistical Handbook for Canada’s Upstream Petroleum Industry October/2017 2017-9999

Technical Report
Statistical Handbook for Canada’s Upstream Petroleum Industry October/2017
2017-9999


Statistical Handbook
The Canadian Association of Petroleum Producers' (CAPP) Statistical Handbook was initiated by the Canadian Petroleum Association (CPA) in 1955 as a compilation of key data on major economic sectors of the petroleum industry. All information contained is the latest data available. The CAPP Statistical Handbook presents a historical summary of the petroleum industry's progress, summarizing detailed statistical information concisely in one publication. Additional data will be developed annually to retain the value of the handbook as an up-to-date reference source. CAPP appreciates the assistance and cooperation provided by the government, statistical agencies, petroleum publications and CAPP member companies in assembling the data. The Canadian Association of Petroleum Producers (CAPP) represents 130 companies that explore for, develop and produce natural gas, natural gas liquids, crude oil, oil sands, and elemental sulphur throughout Canada. CAPP member companies produce more than 90 per cent of Canada’s natural gas and crude oil. CAPP also has 150 associate members that provide a wide range of services that support the upstream crude oil and natural gas industry. Together, these members and associate members are an important part of a $120-billion-a-year national industry that affects the livelihoods of more than half a million Canadians. Disclaimer
The Canadian Association of Petroleum Producers produces its online Statistical Handbook as a convenience to its
members. The Statistical Handbook is also made available to organizations and others with an interest in the
Canadian upstream sector. The contents of the Statistical Handbook are derived from a number of public and
industry sources. Some industry data is obtained by survey.
Although CAPP believes the information in the Statistical Handbook to be reasonably complete and accurate and
makes efforts to ensure it is, CAPP does not warrant it to be so. CAPP and its member companies shall not be
considered as having made any covenant, representation or warranty, express or implied, as to the accuracy,
completeness, adequacy or appropriateness of the information contained in the Statistical handbook. Use of or
reliance on the Statistical Handbook will be at the user's sole risk and CAPP and its member companies shall have
no liability whatsoever with respect to such use or reliance regardless of their fault or negligence.
The Statistical Handbook is the copyright of CAPP. Users of the Statistical Handbook may, however, make use of it
as a source for external presentation and other similar purposes without the prior approval of CAPP, written or
otherwise, but must refer to the CAPP Statistical Handbook as the source.
CAPP is pleased to respond to inquiries regarding the Statistical Handbook. The above disclaimer also applies to
statistical data and other information provided by CAPP in response to such inquiries.
Canadian Association of Petroleum Producers
2100, 350 – 7 Avenue SW
Calgary, AB T2P 3N9
Canada
Phone: (403) 267-1100
Email: [email protected]
www.capp.ca


Index
CAPP Statistical Handbook
Section
CONSUMPTION/DEMAND Crude Oil & Products .................................... 6 Natural Gas ................................................... 6 Primary Energy, Canada .............................. 6 Energy by Type ............................................. 6 CRUDE OIL Average Prices .............................................. 5 Exports .......................................................... 8 Imports .......................................................... 8 Prices ............................................................ 5 Producing Wells ............................................ 3 Production ..................................................... 3 Refinery Receipts .......................................... 7 Reserves ....................................................... 2 Synthetic Production .................................... 3 Value of Production....................................... 4 Wellhead Prices ............................................ 5 DEFINITIONS Drilling ........................................................... 1 Reserves ....................................................... 2 DRILLING Completions .................................................. 1 Completions Historical .................................. 1 Metres Drilled ................................................ 1 Wells Drilled .................................................. 1 Rig Drilling, Available & Utilization Rate ....... 1 ETHANE Production ..................................................... 3 Value of Production....................................... 4 EXPENDITURES/REVENUES By Province ................................................... 4 - Alberta ........................................................ 4 - Atlantic Provinces ...................................... 4 - British Columbia ......................................... 4 - Canada ...................................................... 4 - Eastcoast Offshore (discontinued) ............ 4 - Manitoba ..................................................... 4 - Ontario ........................................................ 4 - Quebec ....................................................... 4 - Saskatchewan ............................................ 4 - Territories & Arctic Islands .......................... 4 Land Sales .................................................... 1 Oil Sands ...................................................... 4
Section EXPORTS Crude Oil & Equivalent .................................. 8 Energy Materials ........................................... 8 Natural Gas ................................................... 8 Products .................................................... 6, 8 IMPORTS Crude Oil Value & Volume ............................ 8 Crude Oil By Country .................................... 7 Energy Materials ........................................... 8 Products .................................................... 6, 8 LAND SALES Hectares ........................................................ 1 Bonuses......................................................... 1 NATURAL GAS Exports............................................................ 8 Prices .............................................................. 5 Producing Wells ............................................. 3 Production ..................................................... 3 Reserves ....................................................... 2 Sales by Categories ...................................... 6 Sales by Provinces ........................................ 6 Value of Production ....................................... 4 NATURAL GAS LIQUIDS Production ..................................................... 3 Butane Production ......................................... 3 Condensate Production ................................ 3 Pentanes Plus Production ............................. 3 Propane Production ...................................... 3 Reserves ....................................................... 2 Value of Production ....................................... 4 PRICES Average Crude Oil Prices .............................. 5 Average Natural Gas Prices ......................... 5
Retail Prices, Regular Un-Leaded Gasolines .......... 5 Consumer Price Index ................................... 5 PRODUCTS Consumption ................................................. 6 Exports....................................................... 6, 8 Gasoline Prices .............................................. 5 Imports ....................................................... 6, 8 Yields by Product .......................................... 7

Index
CAPP Statistical Handbook
Section PRODUCTION Bitumen and Synthetic .................................. 3 Butanes by Province ..................................... 3 Condensate by Province ............................... 3 Crude Oil by Province .................................. 3 Crude Oil by Major Fields & Cumulative....... 3 Crude Oil and Equivalent ............................. 3
Crude Oil and Equivalent Productive Capacity ........ 3 Daily Average ................................................ 3 Ethane by Province ....................................... 3 Experimental & Bitumen by Province ........... 3 Liquid Hydrocarbons - Average Daily ........... 3 Natural Gas by Province (marketable/raw) .. 3 Pentanes Plus by Province ........................... 3 Propane by Province..................................... 3 Sulphur by Province ...................................... 3 Synthetic Crude by Province ........................ 3 Value of Producers' Sales ............................ 4 RESERVES Crude Oil - Initial & Remaining ...................................... 2 - Initial & Remaining by Type ........................ 2 - Non-Conventional (Oil Sands) .................... 2 - Remaining by Province (Annual) ................ 2 - Remaining by Province (Historical) ............ 2 - Remaining Canada (Historical) .................. 2 Natural Gas - Remaining by Province (Annual) ................ 2 - Remaining by Province (Historical) ............ 2 - Remaining Canada (Historical) .................. 2 Natural Gas Liquids - Remaining by Province (Annual) ................ 2 - Remaining by Province (Historical) ............ 2 - Remaining Canada (Historical) .................. 2
Section Non-Conventional - Oil Sands Mining ......................................... 2 - In-Situ Bitumen ............................................ 2 Sulphur - Non-Conventional (Oil Sands) .................... 2 - Remaining by Province (Annual) ................. 2 - Remaining by Province (Historical)............. 2 - Remaining Canada (Historical) ................... 2 Terms & Definitions .................................... 2 REFINERY Capacity by Province..................................... 7 Crude Oil Receipts ........................................ 7 Closures ........................................................ 7 Listing by Operators & Provinces .................. 7 Run To Stills .................................................. 7 Utilization Rate .............................................. 7 Yields ............................................................. 7 SULPHUR Inventory by Province .................................... 3 Production ..................................................... 3 Reserves ....................................................... 2 Sales by Provinces ........................................ 3 Value off Producers' Sales ............................ 4
Metric Conversion Factors In accordance with the Canadian petroleum industry's SI (metric) conversion program, the data in the Statistical Handbook is reported in SI units. The following conversion factors have been applied to historical data: See Supplementary Metric Practice Guide http://www.capp.ca/library/publications/industryOperations/pages/pubInfo.aspx?DocId=67101 Imperial Metric Equivalent Metric Measurement 1 foot = 0.304 8 m metres 1 mile = 1.609 344 km kilometres 1 acre = 0.404 685 6 ha hectares 1 atmosphere = 101.325 kPa kilopascals 1 cubic foot of natural gas = 0.028 173 99 m3 cubic metres at 14.65 psia and 60°F at 101.325 kPa kilopascals, and 15°C Celsius 1 Canadian barrel of oil, condensate or pentanes = 0.158 91 m3 cubic metres plus at 60°F at 15°C Celsius 1 Canadian barrel of propane = 0.158 73 m3 cubic metres at 60°F at 15°C 1 Canadian barrel of butane = 0.158 81 m3 cubic metres at 60°F at 15°C Celsius 1 Canadian barrel of ethane = 0.157 976 m3 cubic metres at 60°F at 15°C Celsius 1 Canadian barrel of natural gas liquids = 0.158 8 m3 cubic metres at 60°F at 15°C Celsius 1 Canadian gallon = 4.546 09 L litres 1 long ton (2240 pounds) = 1.016 047 t tonnes

CAPP Statistical Handbook
Table of Contents
Land, Exploration, Drilling 1
Reserves 2
Production 3
Expenditures/Revenues 4
Prices 5
Demand/Consumption 6
Refining 7
Imports/Exports 8
CAPP Statistical Handbook
Section 1
Land, Exploration, Drilling
Table # Crown Land Sales - Western Canada and Canada Lands Current Year .................................................................................................................................... 1.1 1955 – Present ................................................................................................................................ 1.1 Drilling Activity by Province and Territory Glossary of Terms - Drilling Completions - Canada ......................................................................... 1.2 Current Year .................................................................................................................................... 1.2 Wells and Metres Drilled in Western Canada 1947 - Present ................................................................................................................................. 1.3 Wells and Metres Drilled in Canada by Province 1955 – Present ................................................................................................................................ 1.4 Gas Wells Completed in Canada 1955 - Present ................................................................................................................................. 1.5 Oil Wells Completed in Canada 1955 - Present ................................................................................................................................. 1.6 Canada Rigs Drilling, available and utilization rate .......................................................................... 1.7


Table 1
Hectares Bonus Paid ($)
ALBERTA:
Leases 394,155 57,457,142
Exploration Licenses 542,621 79,326,251
Oil Sands 44,153 11,779,836
TOTAL PROVINCIAL SALES 980,929 148,563,229
Indian Lands 0 0
Metis Lands 0 0
TOTAL 2016 980,929 148,563,229
TOTAL 2015 1,615,398 298,739,727
BRITISH COLUMBIA:
Leases 7,705 3,851,898
Petroleum & Natural Gas Permits 0 0
Drilling Licenses 88,912 11,338,121
TOTAL PROVINCIAL SALES 96,617 15,190,019
Federal Lands 0 0
TOTAL 2016 96,617 15,190,019
TOTAL 2015 62,197 18,355,998
MANITOBA:
Leases 2,981 262,189
Reservations 0 0
TOTAL PROVINCIAL SALES 2,981 262,189
Indian Lands 0 0
Federal Lands 0 0
TOTAL 2016 2,981 262,189
TOTAL 2015 2,912 2,216,791
SASKATCHEWAN:
Leases 84,027 33,892,361
Petroleum & Natural Gas Permits 0 0
Drilling Reservations 27,713 19,600,752
TOTAL PROVINCIAL SALES 111,740 53,493,113
Indian Lands 0 0
Federal Lands 0 0
TOTAL 2016 111,740 53,493,113
TOTAL 2015 132,843 56,470,165
TOTAL:
TOTAL 2016 1,192,267 217,508,550
TOTAL 2015 1,813,350 375,782,681
2016 CROWN LAND SALES
WESTERN CANADA AND CANADA LANDS
February 2017

British Columbia Alberta Oil Sands Saskatchewan Manitoba Indian/Federal Total West. Canada Terr./Arctic Off. Nova Scotia Off. Nfld.
Hectares Thou. $ Hectares Thou. $ Hectares Thou. $ Hectares Thou. $ Hectares Thou. $ Hectares Thou. $ Hectares Thou $ Hectares Thou. $ Hectares Thou. $ Hectares Thou. $
1955 502 429 613 1 426 848 63 585 680 051 1 429 40 777 582 67 130 1 137 2 717 235 67 345 111 379 5
1956 597 398 1 614 1 288 635 74 899 886 928 9 813 259 439 149 124 184 952 3 156 584 87 428 1 678 578 502
1957 504 530 1 343 2 557 177 69 647 2 663 050 16 484 53 367 102 138 709 980 5 916 833 88 557 946 898 654
1958 1 152 683 4 510 3 210 574 51 544 1 889 169 7 436 17 686 2 39 220 84 6 309 332 63 576 1 646 117 765
1959 506 277 10 991 3 725 209 73 430 955 069 3 509 4 850 8 92 766 448 5 284 171 88 387 1 548 689 7 959
1960 296 794 6 187 3 165 306 55 740 1 058 434 2 080 65 4 17 639 212 4 538 238 64 222 1 692 208 2 447
1961 278 932 7 642 3 578 026 45 517 1 163 268 1 310 50 699 134 97 484 248 5 168 409 54 851 710 468 829
1962 317 681 11 365 3 295 154 41 626 2 132 093 3 742 7 721 26 28 861 119 5 781 510 56 878 719 345 704
1963 204 584 7 092 3 625 860 54 588 1 146 301 5 292 8 675 33 30 055 368 5 015 475 67 373 554 621 717
1964 370 794 13 049 4 050 062 2 132 680 8 304 14 737 110 99 914 911 6 668 187 22 373 162 090 98
1965 676 096 18 161 3 287 064 139 428 2 661 848 11 312 96 827 93 346 223 2 668 7 068 058 171 662 574 647 909
1966 511 480 15 839 3 211 734 113 864 3 251 742 7 108 47 652 87 114 094 815 7 136 702 137 714 1 192 759 5 080
1967 911 677 14 298 3 609 515 101 664 3 346 684 9 337 52 162 79 168 885 1 090 8 088 923 126 467 453 209 501
1968 835 427 15 077 3 259 498 106 474 1 548 242 5 148 49 619 54 98 698 499 5 791 484 127 252 1 289 647 3 174
1969 1 085 092 21 691 3 121 646 119 044 1 942 879 6 011 17 416 82 33 848 370 6 200 881 147 199 592 926 3 715
1970 805 094 16 340 2 640 081 36 621 1 766 975 3 820 58 472 355 5 270 622 57 136
1971 958 187 22 186 4 928 307 47 149 1 180 043 2 473 1 230 34 23 222 746 7 090 989 72 589
1972 1 165 191 20 496 4 445 324 52 524 1 769 100 4 691 158 033 1 203 7 537 648 78 914
1973 720 424 17 776 3 273 933 76 086 708 648 5 208 15 745 230 4 718 750 99 300
1974 820 788 22 955 1 797 868 84 107 479 927 3 968 1 020 37 3 099 603 111 068
1975 478 052 12 749 2 025 379 105 991 2 503 431 118 740
1976 981 687 43 226 1 832 739 160 154 537 163 9 066 2 703 42 3 354 292 212 488
1977 945 351 125 468 2 092 194 579 755 170 565 10 751 3 015 547 3 211 125 716 520
1978 698 737 177 458 1 595 835 603 242 134 283 22 620 98 644 11 462 2 527 499 814 782
1979 2 456 477 191 042 2 038 527 996 744 150 772 37 156 15 800 939 67 115 30 298 4 728 691 1 256 178
1980 441 297 181 267 2 473 684 1 004 883 269 265 77 637 28 112 1 878 71 631 26 976 3 283 989 1 292 640
1981 598 233 60 776 1 581 237 588 497 124 908 37 325 19 161 1 686 827 180 2 324 366 688 465
1982 166 441 16 724 1 111 783 333 961 123 967 34 122 6 448 1 056 2 674 503 1 411 313 386 366
1983 141 148 26 014 1 214 041 429 477 240 961 108 350 10 279 1 072 9 536 1 643 1 615 965 566 556
1984 237 085 61 754 1 870 963 624 164 434 104 123 676 8 776 2 181 12 438 3 931 2 563 366 815 707
1985 391 139 87 768 2 740 802 796 176 717 404 148 588 15 471 4 215 3 864 816 1 036 747
1986 217 695 28 641 1 899 779 250 891 165 834 18 195 8 672 912 2 291 980 298 638 1 525 436 (1)
1987 259 594 44 187 2 274 942 687 389 406 072 59 945 5 813 577 3 513 1 323 2 949 934 793 421 404 686 (1)
1988 515 537 99 972 2 630 286 521 015 553 585 34 954 5 541 433 13 675 3 047 3 718 624 659 421 113 686 (1) 43 686 44 730
1989 403 807 88 284 2 263 664 359 877 941 973 36 289 2 832 232 8 832 946 3 621 108 485 627 365 648 (1) 265 000 49 710
1990 529 875 130 622 2 410 126 434 975 657 850 32 565 5 616 162 52 720 2 069 3 656 187 600 393 1 884 435 not avail. 24 948 2 600 1 748 695 11 470
1991 349 392 59 710 2 217 421 307 079 208 544 16 402 1 920 124 1 544 264 2 778 821 383 580 695 860 not avail. 520 772 7 320
1992 245 320 39 613 1 714 929 148 448 50 669 4 162 175 949 13 622 4 960 121 2 191 827 205 966
1993 514 621 143 450 2 969 132 503 712 595 609 83 676 22 018 884 4 101 380 731 723 55 500 1 000 77 330 2 850
1994 737 918 208 019 4 671 996 997 134 66 883 7 455 1 557 114 199 742 20 900 1 195 7 054 811 1 413 545 150 267 22 681
1995 714 765 130 611 4 269 302 634 734 99 168 22 521 604 230 65 679 23 181 2 545 55 501 2 633 5 766 147 858 722 163 889 4 365 74 206 86 400 31 924 95 750
1996 564 624 128 008 4 566 956 725 614 115 812 43 103 1 046 244 122 195 12 131 1 692 100 601 4 072 6 406 368 1 024 684 520 344 29 660 12 996 2 300 909 723 126 050
1997 735 979 216 775 4 783 512 969 978 366 329 183 287 933 862 131 002 49 967 5 695 6 869 649 1 506 737 577 018 35 153 1 133 850 94 200 618 621 98 000
1998 482 831 96 343 2 838 182 581 964 176 454 14 998 403 055 54 029 4 220 308 3 904 742 747 642 2 401 952 597 000 629 966 175 330
1999 730 553 176 169 2 796 398 528 977 199 766 64 418 398 240 45 672 4 058 395 4 129 015 815 631 293 451 183 219 1 245 005 61 200 818 472 192 470
2000 692 894 248 240 3 663 472 1 002 535 186 992 139 495 283 173 48 334 5 173 473 4 831 704 1 439 077 1 472 718 523 971 1 253 661 191 759 1 605 497 88 627
2001 854 201 439 467 3 673 644 1 003 126 234 525 82 684 372 648 56 208 21 631 885 5 156 649 1 582 370 423 972 20 294 1 579 970 527 188 1 196 598 14 673
2002 848 917 288 466 2 607 258 476 516 168 576 24 942 653 010 102 915 2 720 212 4 280 481 893 051 47 102 14 300
2003 733 487 646 679 3 085 727 887 040 64 351 17 771 1 064 439 158 744 4 416 294 4 952 420 1 710 528 79 668 1 108 150 094 14 107 2 124 990 672 680
2004 540 427 232 379 2 823 964 1 023 337 299 198 83 453 434 228 80 776 15 349 1 288 4 113 166 1 421 233 291 513 124 883 270 256 71 126
2005 579 402 533 986 2 888 212 1 827 239 355 308 433 093 483 605 134 414 68 239 5 773 4 374 766 2 934 505 446 093 58 126 300 044 39 569
2006 690 744 629 849 2 692 911 1 471 853 1 542 473 1 963 042 454 711 176 500 12 778 2 190 5 393 617 4 243 434 673 220 122 421 604 647 32 356
2007 595 559 1 047 108 1 871 920 710 686 1 134 481 649 728 405 308 250 326 9 530 384 4 016 798 2 658 232 727 541 613 443 991 458 187 952
2008 756 752 2 662 394 2 023 536 938 427 1 660 094 288 078 766 248 1 118 974 13 694 4 929 5 220 324 5 012 802 931 294 1 206 086 113 945 216 800 953 035 132 292
2009 389 146 892 856 1 740 609 731 763 101 449 9 910 306 657 118 180 22 000 5 416 2 559 861 1 758 125 847 597 149 471 513 769 47 000
2010 370 132 844 414 3 853 300 2 387 812 130 322 26 769 453 453 462 806 20 449 12 003 4 827 656 3 733 804 576 723 110 687 500 545 112 731
2011 191 534 222 683 4 109 574 3 536 328 497 379 104 685 504 394 248 773 23 091 13 140 5 325 971 4 125 608 1 109 083 536 192 787 784 349 777
2012 136 521 139 262 3 083 176 1 110 115 78 579 10 708 397 119 105 686 19 370 11 389 3 714 765 1 377 159 1 060 053 99 648 3 541 512 1 082 823 1 518 801 116 876
2013 119 095 224 685 2 144 317 679 552 146 814 28 196 111 392 67 384 4 079 2 370 2 525 698 1 002 186 146 458 19 200 554 939 580 000
2014 148 705 382 793 1 058 414 489 362 31 039 4 664 200 242 197 869 6 765 1 549 64 14 1 445 229 1 076 251 47 945 1 000 108 939 16 700
2015 62 197 18 356 1 553 920 275 827 61 477 22 913 132 843 56 470 2 912 2 217 1 813 350 375 783 1 629 926 1 204 954
2016 96 617 15 190 936 776 136 783 44 153 11 780 111 740 53 493 2 981 262 1 192 267 217 509 1 526 482 757 990
(1) Work bonus bids - excluded from total.
CROWN LAND SALES WESTERN CANADA AND CANADA LANDS
1955-2016
Alberta Conventional
Work Bonus Bids
February 2017 Table 1.1

DRILLING CLASSIFICATIONS - CANADA
The following classifications are used by the Canadian Committee on Statistics of Drilling. These classeswere designed to permit a test to be characterized by the general degree of risk assumed by the operator. There are five exploratory classes, of which the class "new field wildcat" represent the highest level of risk. A well classed as "development" is lower in risk than any of the exploratory wells.
New Field Wildcat: A test located on a structural feature or other type of trap which has not previouslyproduced oil or gas. In regions where local geological conditions have little or no control over accumulations,these tests are generally at least three kilometres from the nearest productive area. Distance, however, isnot the determining factor. Of greater importance is the degree of risk assumed by the operator and hisintention to test a structure or stratigraphic condition not previously proved productive.
New Pool Wildcat: A test located to explore for a new pool on a structural feature or other type of trapalready producing oil or gas, but outside the known limits of the presently producing area. In some regionswhere local geological conditions exert an almost negligible control, exploratory holes of this type may becalled "near wildcats". Such wells will usually be less than three kilometres from the nearest productive area.
Deeper Pool Test: An exploratory hole located within the productive area of a pool, or pools, already partlyor wholly developed. It is drilled below the deepest productive pool in order to explore for deeper unknownprospects. All metres drilled are assigned to the exploratory category. This practise was adoptedcommencing with the 1979 data. Previously, metres drilled were split between the exploratory anddevelopment category.
Shallower Pool Test: An exploratory test drilled in search of a new productive reservoir, unknown butpossibly suspected from data secured from other wells, and shallower than known productive pools. Thistest is located within the productive area of a pool or pools previously developed.
Outposts: A test located and drilled with the expectation of extending for a considerable distance theproductive area of a partly developed pool. It is usually two or more locations distant from the nearestproductive site.
Development Well: A well drilled within the proved area of an oil or gas reservoir to the depth of astratigraphic horizon known to be productive. If the well is completed for production, it is classified as an oilor gas development well. If the well is not completed for production and is abandoned, it is classified as adry development hole.
Bitumen Wells: A well drilled within a designated oil sands area or like deposit for the purpose ofproducing raw bitumen from the deposit. Such wells may be drilled for pilot, experimental or commercialprojects.
Stratigraphic Test: A drilling effort, geologically directed, to obtain information pertaining to a specificgeological condition that might lead toward the discovery of an accumulation of hydrocarbons. Such testsare customarily drilled without the intention of being completed for hydrocarbon production. Thisclassification also includes tests identified as core tests and all types of expendable holes related tohydrocarbon exploration.
Service Well: A well drilled or completed for the purpose of supporting production in an existing field. Wells of this class are drilled for the following specific purposes: gas injection (natural gas, propane,butane), water injection, air injection, steam injection, salt water disposal, water supply for injection,observation, etc.
Miscellaneous Wells: Includes storage wells (natural gas, propane, butane), salt brine wells and otherwells not classified under categories.


No. Metres No. Metres No. Metres No. Metres No. Metres No. Metres
TERRITORIES & ARCTIC ISLANDS
New Field Wildcats
New Pool Wildcats
Deeper Pool Tests
Shallower Pool Tests
Outposts
Total Exploratory Tests
Stratigraphic Tests
Development Wells
Bitumen Wells
Service & Misc Wells
Total Completions
BRITISH COLUMBIA
New Field Wildcats
New Pool Wildcats
Deeper Pool Tests
Shallower Pool Tests
Outposts 6 25 688 6 25 688 1 6 991 1 3 868 8 36 547
Total Exploratory Tests 6 25 688 6 25 688 1 6 991 1 3 868 8 36 547
Stratigraphic Tests
Development Wells 17 59 572 238 1 004 428 255 1 064 000 22 86 047 277 1 150 047
Bitumen Wells
Service & Misc Wells 1 4 140
Total Completions 17 59 572 244 1 030 116 261 1 089 688 1 6 991 23 89 915 286 1 190 734
ALBERTA
New Field Wildcats 3 8 778 3 8 778 3 8 778
New Pool Wildcats 25 66 540 11 49 658 36 116 198 1 1 938 37 118 136
Deeper Pool Tests 23 58 356 48 256 724 71 315 080 10 21 253 81 336 333
Shallower Pool Tests
Outposts 15 42 750 32 164 387 47 207 137 2 2 865 49 210 002
Total Exploratory Tests 66 176 424 91 470 769 157 647 193 13 26 056 170 673 249
Stratigraphic Tests 601 236 379
Development Wells 654 1 755 501 634 3 046 403 1 288 4 801 904 11 22 123 1 299 4 824 027
Bitumen Wells 347 447 380 347 447 380 347 447 380
Service & Misc Wells 162 263 570
Total Completions 1 067 2 379 305 725 3 517 172 1 792 5 896 477 24 48 179 2 579 6 444 605
SASKATCHEWAN
New Field Wildcats 5 11 924 5 11 924 2 4 860 7 16 784
New Pool Wildcats 26 68 139 26 68 139 5 3 454 31 71 593
Deeper Pool Tests 1 1 432 1 1 432 1 1 432
Shallower Pool Tests
Outposts 27 50 074 27 50 074 3 3 550 30 53 624
Total Exploratory Tests 59 131 569 59 131 569 10 11 864 69 143 433
Stratigraphic Tests 26 16 667
Development Wells 1 475 3 018 734 1 475 3 018 734 1 2 286 12 19 487 1 488 3 040 507
Bitumen Wells
Service & Misc Wells 54 65 069
Total Completions 1 534 3 150 303 1 534 3 150 303 1 2 286 22 31 351 1 637 3 265 676
2016 DRILLING ACTIVITY
ABANDONEDOIL GAS TOTAL PRODUCERS SUSPENDED TOTAL
February 2017 Table 1.2

No. Metres No. Metres No. Metres No. Metres No. Metres No. Metres
2016 DRILLING ACTIVITY
ABANDONEDOIL GAS TOTAL PRODUCERS SUSPENDED TOTAL
MANITOBA
New Field Wildcats 2 1 252 1 748 3 2 000
New Pool Wildcats 2 2 379 2 2 379
Deeper Pool Tests
Shallower Pool Tests
Outposts 3 2 270 3 2 270
Total Exploratory Tests 2 1 252 6 5 397 8 6 649
Stratigraphic Tests
Development Wells 50 96 236 50 96 236 28 47 547 78 143 783
Bitumen Wells
Service & Misc Wells 1 2 560
Total Completions 50 96 236 50 96 236 2 1 252 34 52 944 87 152 992
WESTERN CANADA
New Field Wildcats 8 20 702 8 20 702 2 1 252 3 5 608 13 27 562
New Pool Wildcats 51 134 679 11 49 658 62 184 337 1 1 938 7 5 833 70 192 108
Deeper Pool Tests 24 59 788 48 256 724 72 316 512 10 21 253 82 337 765
Shallower Pool Tests
Outposts 42 92 824 38 190 075 80 282 899 3 9 856 7 9 688 90 302 443
Total Exploratory Tests 125 307 993 97 496 457 222 804 450 16 34 299 17 21 129 255 859 878
Stratigraphic Tests 627 253 046
Development Wells 2 196 4 930 043 872 4 050 831 3 068 8 980 874 12 24 409 62 153 081 3 142 9 158 364
Bitumen Wells 347 447 380 347 447 380 347 447 380
Service & Misc Wells 218 335 339
Total Completions 2 668 5 685 416 969 4 547 288 3 637 10 232 704 28 58 708 79 174 210 4 589 11 054 007
ONTARIO
New Field Wildcats 1 1 027 1 1 027
New Pool Wildcats
Deeper Pool Tests
Shallower Pool Tests
Outposts
Total Exploratory Tests 1 1 027 1 1 027
Stratigraphic Tests 2 230
Development Wells 1 225 1 225 1 225
Bitumen Wells
Service & Misc Wells 1 940
Total Completions 1 225 1 225 1 1 027 5 2 422
QUEBEC
New Field Wildcats
New Pool Wildcats
Deeper Pool Tests
Shallower Pool Tests
Outposts
Total Exploratory Tests
Stratigraphic Tests
Development Wells
Bitumen Wells
Service & Misc Wells
Total Completions
February 2017 Table 1.2

No. Metres No. Metres No. Metres No. Metres No. Metres No. Metres
2016 DRILLING ACTIVITY
ABANDONEDOIL GAS TOTAL PRODUCERS SUSPENDED TOTAL
OFFSHORE NOVA SCOTIA
New Field Wildcats 1 7 068 1 7 068
New Pool Wildcats
Deeper Pool Tests
Shallower Pool Tests
Outposts
Total Exploratory Tests 1 7 068 1 7 068
Stratigraphic Tests
Development Wells
Bitumen Wells
Service & Misc Wells
Total Completions 1 7 068 1 7 068
OFFSHORE NEWFOUNDLAND
New Field Wildcats
New Pool Wildcats
Deeper Pool Tests
Shallower Pool Tests
Outposts
Total Exploratory Tests
Stratigraphic Tests
Development Wells 3 17 304 3 17 304 1 2 699 4 20 003
Bitumen Wells
Service & Misc Wells 4 17 645
Total Completions 3 17 304 3 17 304 1 2 699 8 37 648
NEW BRUNSWICK
New Field Wildcats
New Pool Wildcats
Deeper Pool Tests
Shallower Pool Tests
Outposts
Total Exploratory Tests
Stratigraphic Tests
Development Wells
Bitumen Wells
Service & Misc Wells
Total Completions
NEWFOUNDLAND
New Field Wildcats
New Pool Wildcats
Deeper Pool Tests
Shallower Pool Tests
Outposts
Total Exploratory Tests
Stratigraphic Tests
Development Wells
Bitumen Wells
Service & Misc Wells
Total Completions
February 2017 Table 1.2

No. Metres No. Metres No. Metres No. Metres No. Metres No. Metres
2016 DRILLING ACTIVITY
ABANDONEDOIL GAS TOTAL PRODUCERS SUSPENDED TOTAL
NOVA SCOTIA/PEI
New Field Wildcats
New Pool Wildcats
Deeper Pool Tests
Shallower Pool Tests
Outposts
Total Exploratory Tests
Stratigraphic Tests
Development Wells
Bitumen Wells
Service & Misc Wells
Total Completions
EASTERN CANADA
New Field Wildcats 2 8 095 2 8 095
New Pool Wildcats
Deeper Pool Tests
Shallower Pool Tests
Outposts
Total Exploratory Tests 2 8 095 2 8 095
Stratigraphic Tests 2 230
Development Wells 3 17 304 1 225 4 17 529 1 2 699 5 20 228
Bitumen Wells
Service & Misc Wells 5 18 585
Total Completions 3 17 304 1 225 4 17 529 3 10 794 14 47 138
CANADA
New Field Wildcats 8 20 702 8 20 702 4 9 347 3 5 608 15 35 657
New Pool Wildcats 51 134 679 11 49 658 62 184 337 1 1 938 7 5 833 70 192 108
Deeper Pool Tests 24 59 788 48 256 724 72 316 512 10 21 253 82 337 765
Shallower Pool Tests
Outposts 42 92 824 38 190 075 80 282 899 3 9 856 7 9 688 90 302 443
Total Exploratory Tests 125 307 993 97 496 457 222 804 450 18 42 394 17 21 129 257 867 973
Stratigraphic Tests 629 253 276
Development Wells 2 199 4 947 347 873 4 051 056 3 072 8 998 403 13 27 108 62 153 081 3 147 9 178 592
Bitumen Wells 347 447 380 347 447 380 347 447 380
Service & Misc Wells 223 353 924
Total Completions 2 671 5 702 720 970 4 547 513 3 641 10 250 233 31 69 502 79 174 210 4 603 11 101 145
Note: CAPP drilling data is based on rotary rig release date
Junked Holes Wells Metres
Alberta 3 1 118
3 1 118
February 2017 Table 1.2

Table 1.3
EXPLORATORY DEVELOPMENT TOTAL No. Metres No. Metres No. Metres
Pre to 1947 1 118 900 861 950 1 239 858 2 068 2 140 7191947 129 125 953 202 160 688 331 286 6411948 179 208 307 281 340 034 460 548 3411949 275 352 126 580 669 524 855 1 021 6501950 311 410 170 859 946 081 1 170 1 356 2511951 487 652 801 933 1 135 229 1 420 1 788 0301952 900 1 084 089 1 282 1 571 582 2 182 2 655 6711953 905 1 157 247 1 334 1 628 611 2 239 2 785 8581954 928 1 216 705 1 365 1 575 051 2 293 2 791 7561955 885 1 212 529 2 050 2 663 245 2 935 3 875 7741956 899 1 342 829 2 383 3 379 146 3 282 4 721 9751957 1 058 1 516 179 1 942 2 753 686 3 000 4 269 8651958 849 1 275 048 1 667 2 502 804 2 516 3 777 8521959 939 1 397 939 1 629 2 476 581 2 568 3 874 5201960 818 1 335 657 1 718 2 854 036 2 536 4 189 6931961 769 1 302 665 1 743 2 888 582 2 512 4 191 2471962 869 1 397 234 1 640 2 563 288 2 509 3 960 5221963 1 011 1 579 464 1 850 2 751 836 2 861 4 331 3001964 1 293 1 833 748 2 007 2 910 220 3 300 4 743 9681965 1 470 2 078 430 2 163 2 894 937 3 633 4 973 3671966 1 447 2 050 160 1 605 2 143 615 3 052 4 193 7751967 1 341 1 913 449 1 537 1 959 486 2 878 3 872 9351968 1 495 2 257 325 1 500 1 886 373 2 995 4 143 6981969 1 624 2 149 223 1 553 1 886 851 3 177 4 036 0741970 1 414 1 884 488 1 522 1 610 239 2 936 3 494 7271971 1 445 1 861 534 1 489 1 579 190 2 934 3 440 7241972 1 649 2 176 651 1 936 1 968 887 3 585 4 145 5381973 2 126 2 403 485 2 271 2 465 742 4 397 4 869 2271974 1 648 1 971 296 2 319 2 237 618 3 967 4 208 9141975 1 565 1 715 655 2 467 2 315 283 4 032 4 030 9381976 2 389 2 301 411 3 104 3 021 340 5 493 5 322 7511977 2 739 2 803 393 3 237 3 238 430 5 976 6 041 8231978 3 065 3 529 465 3 913 3 751 819 6 978 7 281 2841979 2 901 4 111 269 4 554 4 463 970 7 455 8 575 2391980 3 744 5 234 229 5 188 5 138 500 8 932 10 372 7291981 3 074 4 257 685 3 897 3 810 523 6 971 8 068 2081982 2 288 3 161 028 4 093 3 963 678 6 381 7 124 7061983 1 973 2 804 879 4 877 5 153 549 6 850 7 958 4281984 2 863 3 977 174 6 517 6 567 178 9 380 10 544 3521985 3 296 4 611 664 8 794 8 596 464 12 090 13 208 1281986 1 955 2 836 782 3 730 4 347 112 5 685 7 183 8941987 2 322 3 434 838 4 518 4 959 110 6 840 8 393 9481988 2 889 4 025 708 5 652 5 855 401 8 541 9 881 1091989 2 525 3 341 228 3 015 3 132 092 5 540 6 473 3201990 2 696 3 565 913 3 111 3 317 434 5 807 6 883 3471991 2 184 2 974 094 3 082 3 355 748 5 266 6 329 8421992 1 570 2 136 080 2 929 3 391 156 4 499 5 527 2361993 2 781 3 650 170 6 660 7 150 499 9 441 10 800 6691994 3 991 5 334 213 7 972 8 631 276 11 963 13 965 4891995 3 168 4 292 755 7 840 8 400 064 11 008 12 692 8191996 3 250 4 365 570 10 350 10 981 483 13 600 15 347 0531997 3 555 4 768 049 13 229 14 564 127 16 784 19 332 1761998 3 586 5 112 457 6 448 7 469 037 10 034 12 581 4941999 3 491 4 942 057 8 759 8 686 693 12 250 13 628 7502000 4 548 6 271 126 12 775 13 166 367 17 323 19 437 493
1947 - 2016
WELLS AND METRES DRILLED IN WESTERN CANADA
February 2017

Table 1.3
EXPLORATORY DEVELOPMENT TOTAL No. Metres No. Metres No. Metres
1947 - 2016
WELLS AND METRES DRILLED IN WESTERN CANADA
2001 4 967 6 549 338 13 194 13 531 519 18 161 20 080 8572002 4 009 5 376 680 11 578 11 692 748 15 587 17 069 4282003 5 026 6 218 519 16 295 16 378 375 21 321 22 596 8942004 5 476 6 940 944 17 243 17 665 203 22 719 24 606 1472005 5 895 8 207 517 19 173 21 652 922 25 068 29 860 4392006 5 635 8 443 309 17 579 19 975 570 23 214 28 418 8792007 3 408 5 378 926 14 565 16 153 124 17 973 21 532 0502008 2 789 5 049 258 13 340 16 378 690 16 129 21 427 9482009 1 248 2 495 322 6 889 10 022 508 8 137 12 517 8302010 1 569 3 302 175 9 042 14 720 170 10 611 18 022 3452011 1 636 3 663 881 9 479 18 518 881 11 115 22 182 7622012 1 190 2 707 177 9 328 17 959 674 10 518 20 666 8512013 1 065 2 762 082 9 085 19 027 153 10 150 21 789 2352014 1 016 2 761 645 9 374 21 486 866 10 390 24 248 5112015 484 1 606 138 4 747 12 379 777 5 231 13 985 9152016 255 859 878 3 489 9 605 744 3 744 10 465 622
Pre 1947 to
Date Total 150 357 212 929 273 379 421 472 220 277 529 778 685 149 550
Bitumen included with Development on this table
February 2017

Wells Metres Wells Metres Wells Metres Wells Metres Wells Metres Wells Metres Wells Metres Wells Metres Wells Metres
1955 36 63 104 1 620 2 569 687 912 986 113 361 257 689 6 3 739 405 156 099 3 340 4 036 431
1956 57 102 025 1 856 3 017 083 1 108 1 412 709 254 177 352 7 3 806 451 168 621 3 733 4 881 596
1957 94 161 620 1 450 2 323 610 1 227 1 623 829 225 157 403 4 3 403 444 173 140 3 444 4 443 005
1958 75 114 865 1 550 2 553 802 790 1 037 625 92 60 437 9 11 123 366 161 197 2 882 3 939 049
1959 115 182 180 1 594 2 681 422 806 990 812 45 30 676 8 7 718 325 140 453 2 893 4 033 261
1960 143 229 608 1 692 3 162 547 602 720 449 67 44 790 32 32 299 316 132 226 2 852 4 321 919
1961 210 316 998 1 603 3 109 372 655 722 572 29 19 647 15 22 658 321 116 827 2 833 4 308 074
1962 330 476 750 1 557 2 785 203 598 671 823 24 17 687 9 18 546 232 114 536 2 750 4 084 545
1963 176 273 725 1 698 3 040 176 950 1 011 022 59 42 762 5 14 683 229 130 172 3 117 4 512 540
1964 141 202 220 1 857 3 154 439 1 195 1 280 235 107 75 262 18 34 461 269 158 078 3 587 4 904 695
1965 250 329 506 1 974 3 110 808 1 289 1 389 921 64 50 146 18 36 448 209 112 986 3 804 5 029 815
1966 212 314 729 1 633 2 513 089 1 168 1 302 431 61 43 852 28 37 070 155 81 928 3 257 4 293 099
1967 186 302 041 1 590 2 359 739 965 1 070 759 87 65 124 40 39 302 2 6 062 1 4 604 150 69 627 3 021 3 917 258
1968 186 320 305 1 848 2 678 312 923 1 003 637 66 49 780 36 37 547 8 24 635 188 97 698 3 255 4 211 914
1969 166 258 435 1 843 2 620 067 1 162 1 113 154 82 44 485 56 83 637 4 11 254 1 3 980 223 131 125 3 537 4 266 137
1970 177 274 299 1 824 2 370 427 933 755 795 19 16 680 70 110 249 14 45 482 173 104 820 3 210 3 677 752
1971 194 298 976 2 025 2 445 944 768 639 988 20 13 840 76 143 039 19 62 291 166 99 133 3 268 3 703 211
1972 213 349 501 2 675 3 068 130 651 567 668 7 5 485 71 174 986 18 58 281 192 115 339 3 827 4 339 390
1973 165 264 542 3 517 3 879 989 661 545 491 16 13 649 97 209 027 30 101 025 131 82 887 4 617 5 096 610
1974 144 231 759 3 499 3 666 357 282 215 229 20 21 964 59 153 384 19 56 495 178 94 803 4 201 4 439 991
1975 80 128 488 3 652 3 659 421 275 207 905 11 8 770 43 113 218 9 26 313 172 101 320 4 242 4 245 435
1976 175 283 091 5 046 4 879 453 257 229 671 16 13 515 27 83 807 10 22 793 159 88 891 5 690 5 601 221
1977 306 491 733 5 120 5 255 020 534 438 369 13 11 584 26 80 767 8 11 766 190 109 967 6 197 6 399 206
1978 390 638 343 5 584 6 111 748 978 724 611 22 18 328 17 51 795 16 32 874 163 134 832 7 170 7 712 531
1979 395 685 170 5 753 6 852 496 1 258 967 805 25 20 537 27 54 936 12 29 399 231 135 951 7 701 8 746 294
1980 386 694 785 7 044 8 397 933 1 458 1 219 392 33 29 113 17 37 110 9 32 644 241 133 007 9 188 10 543 984
1981 209 407 585 5 886 6 865 955 801 694 839 67 66 046 13 38 818 9 39 511 201 102 854 7 186 8 215 608
1982 109 207 712 5 225 5 973 024 811 693 538 195 184 302 41 66 240 7 34 099 174 78 927 6 562 7 237 842
1983 76 130 535 4 619 5 843 692 1 840 1 683 524 253 234 302 67 71 709 22 99 681 218 103 162 7 095 8 166 605
1984 194 231 975 6 043 7 439 831 3 063 2 708 874 246 221 026 96 127 555 22 104 833 199 102 041 9 863 10 936 135
1985 235 312 600 7 937 9 273 034 3 815 3 557 318 269 231 865 75 118 502 27 122 390 206 119 994 12 564 13 735 703
1986 161 267 097 4 412 5 868 530 1 086 1 035 947 138 121 160 55 105 793 16 67 201 123 61 912 5 991 7 527 640
1987 136 241 810 5 121 6 792 382 1 566 1 386 420 109 98 246 41 45 534 8 30 756 97 52 600 7 078 8 647 748
1988 189 355 763 6 378 7 889 646 2 073 1 756 871 72 63 711 18 32 285 9 28 870 147 82 378 8 886 10 209 524
1989 219 395 496 3 891 4 949 873 1 479 1 171 534 55 45 265 7 16 578 2 6 497 151 92 268 5 804 6 677 511
1990 285 454 481 4 189 5 206 175 1 315 1 212 628 83 79 714 14 19 580 1 3 092 133 64 558 6 020 7 040 228
1991 237 419 330 3 973 4 873 164 1 133 1 120 446 57 51 153 8 15 084 7 18 747 124 72 180 5 539 6 570 104
1992 150 251 301 3 627 4 482 493 793 886 103 27 26 121 2 2 560 2 5 732 77 62 659 4 678 5 716 969
1993 324 539 047 7 170 8 516 415 2 189 2 140 071 86 88 248 10 27 084 115 81 147 9 894 11 392 012
1994 530 838 533 9 370 11 146 535 2 430 2 564 491 80 86 628 2 3 234 2 5 115 102 71 417 12 516 14 715 953
1995 447 712 222 8 780 10 132 327 2 202 2 476 100 52 57 906 3 4 848 90 64 807 11 574 13 448 210
1996 500 811 465 10 926 12 004 837 3 000 3 268 549 60 60 587 6 11 368 4 13 799 61 50 907 14 557 16 221 512
1997 616 1 012 467 13 225 14 813 927 4 055 4 468 049 109 103 509 13 17 248 4 14 201 82 64 480 18 104 20 493 881
1998 683 1 044 845 8 175 9 875 306 1 744 1 913 306 49 55 218 12 17 465 9 38 230 109 83 528 10 781 13 027 898
1999 678 1 035 160 9 444 10 687 739 2 522 2 408 641 41 46 606 15 32 654 19 89 640 84 62 708 12 803 14 363 148
2000 846 1 351 010 13 543 14 821 473 3 839 3 759 404 76 77 324 16 17 306 22 100 184 138 130 617 18 480 20 257 318
2001 934 1 572 371 14 975 15 435 493 3 571 3 520 662 115 121 102 12 19 041 18 83 696 127 136 956 19 752 20 889 321
2002 580 994 700 12 989 13 543 517 3 401 2 937 711 97 104 871 13 29 037 15 75 813 87 83 163 17 182 17 768 812
2003 1 032 1 880 562 17 873 17 855 802 4 179 3 409 918 106 104 279 36 73 387 34 138 631 105 74 305 23 365 23 536 884
2004 1 117 1 923 003 19 365 19 538 053 4 104 3 576 631 133 133 220 18 40 432 25 110 679 112 77 652 24 874 25 399 670
2005 1 202 2 211 953 21 599 24 211 705 3 781 3 873 079 260 271 244 10 15 078 15 71 532 84 46 876 26 951 30 701 467
2006 1 313 2 349 465 19 800 21 971 316 4 029 4 299 405 487 524 353 5 11 581 20 81 814 157 101 592 25 811 29 339 526
2007 827 1 682 655 16 238 16 079 296 3 689 4 336 664 345 393 982 15 25 028 12 59 659 84 72 039 21 210 22 649 323
2008 805 1 951 670 14 969 15 060 899 4 037 5 327 344 302 415 433 10 15 128 4 21 064 76 88 408 20 203 22 879 946
2009 667 1 778 962 6 894 7 780 524 2 126 3 401 060 237 430 746 9 16 959 10 37 955 44 52 257 9 987 13 498 463
Canada
Wells and Metres Drilled in Canada
1955-2016
British Columbia Alberta Saskatchewan Manitoba NWT Westcoast Offshore Eastcoast Offshore Other Eastern Canada
February 2017 Table 1.4

Wells Metres Wells Metres Wells Metres Wells Metres Wells Metres Wells Metres Wells Metres Wells Metres Wells Metres
Canada
Wells and Metres Drilled in Canada
1955-2016
British Columbia Alberta Saskatchewan Manitoba NWT Westcoast Offshore Eastcoast Offshore Other Eastern Canada
2010 554 1 868 013 8 537 11 889 897 2 669 4 308 180 467 842 515 13 17 345 12 61 914 91 85 554 12 343 19 073 418
2011 568 1 941 488 9 651 15 519 241 3 275 5 273 750 500 909 850 18 32 478 5 21 669 24 6 979 14 041 23 705 455
2012 363 1 400 055 8 862 14 225 233 3 243 5 237 672 573 1 080 388 13 21 207 8 34 017 18 12 190 13 080 22 010 762
2013 527 2 046 671 8 656 14 851 676 3 464 5 784 447 537 1 018 108 7 14 489 17 88 388 20 13 532 13 228 23 817 311
2014 621 2 386 143 8 477 16 473 376 3 638 6 336 265 461 832 133 2 6 062 10 40 611 7 5 517 13 216 26 080 107
2015 517 2 054 221 3 837 8 763 087 1 780 3 428 342 209 355 376 11 55 916 2 502 6 356 14 657 444
2016 286 1 190 734 2 579 6 444 605 1 637 3 265 676 87 152 992 9 44 716 5 2 422 4 603 11 101 145
Total 23 739 48 241 898 408 339 499 366 352 116 784 132 072 474 8 865 11 000 086 1 506 2 700 371 14 41 951 593 2 365 683 9 953 5 610 751 569 793 701 399 566
Based on rig release date.
February 2017 Table 1.4

Table 1.5
OTHER EAST
WEST. EAST COAST
NWT* BC ALTA SASK MAN CANADA ONT CANADA OFFSHORE CANADA
1955 1 12 135 20 168 Not available for Eastern 168
1956 34 134 12 180 Canada from 1955-64 180
1957 43 135 16 194 194
1958 15 168 17 200 200
1959 41 248 13 302 302
1960 1 34 247 10 292 292
1961 1 66 314 11 392 392
1962 61 264 6 331 331
1963 65 235 38 338 338
1964 3 35 243 27 308 55 363
1965 2 41 220 57 320 68 388
1966 51 257 34 342 44 386
1967 2 43 283 44 372 59 431
1968 2 34 395 47 478 61 539
1969 2 43 437 42 524 49 573
1970 1 50 617 63 731 63 794
1971 3 36 691 108 838 47 1 886
1972 7 61 1 010 86 1 164 34 2 1 200
1973 11 54 1 518 73 1 656 34 1 1 691
1974 10 47 1 719 126 1 902 60 1 962
1975 6 31 1 958 85 2 080 68 2 148
1976 9 86 3 193 16 3 304 67 2 3 373
1977 8 148 2 953 83 3 192 93 3 285
1978 3 186 3 090 40 3 319 70 1 3 390
1979 2 187 3 216 45 3 450 83 1 3 534
1980 5 219 3 968 49 4 241 91 1 4 333
1981 1 95 3 085 25 3 206 76 1 2 3 285
1982 4 42 2 499 10 2 555 61 2 2 618
1983 1 19 1 188 166 1 374 59 5 1 438
1984 3 31 1 397 435 1 866 56 5 1 927
1985 6 57 2 022 443 2 528 61 3 6 2 598
1986 4 43 1 029 222 1 298 34 5 1 337
1987 57 996 546 1 599 17 1 616
1988 1 78 1 517 700 4 2 300 30 2 1 2 333
1989 2 105 1 294 912 2 313 28 5 2 346
1990 5 153 1 593 475 2 226 28 2 254
1991 3 103 1 133 406 1 645 46 1 691
1992 63 657 188 908 31 939
1993 134 2 287 906 3 327 33 3 360
1994 261 4 236 836 5 333 60 5 393
1995 238 2 877 210 3 325 27 1 3 353
1996 240 3 117 307 3 664 3 3 667
1997 1 293 4 278 248 4 820 21 1 4 842
1998 2 352 4 033 567 1 4 955 36 4 991
1999 5 388 5 622 990 7 005 7 6 7 018
2000 521 7 353 1 160 9 034 36 1 7 9 078
2001 2 530 8 789 1 372 10 693 56 3 5 10 757
2002 5 344 6 949 1 713 9 011 45 3 2 9 061
2003 9 673 9 942 2 287 12 911 34 1 5 12 951
2004 6 772 12 276 1 987 15 041 84 1 15 126
2005 1 049 13 268 1 578 15 895 31 2 3 15 931
2006 2 892 11 603 1 353 13 850 105 9 1 13 965
2007 597 8 006 1 023 9 626 26 2 9 654
2008 2 487 6 449 1 166 8 104 15 8 8 127
2009 488 2 717 182 3 387 6 1 3 394
2010 368 2 988 69 3 425 6 3 431
2011 435 2 237 23 2 695 2 695
2012 297 809 3 1 109 1 1 110
2013 390 1 224 10 1 624 7 1 631
2014 561 1 582 2 2 145 2 2 147
2015 467 1 013 1 480 1 1 481
2016 244 725 969 1 9701955 to current
Total* 143 13 590 170 438 23 688 5 207 864 2 215 45 64 210 188
* Includes Mainland Terr., Mackenzie Delta & Beaufort Sea & the Arctic Islands
1955 - 2016
GAS WELLS COMPLETED IN CANADA
February 2017

Table 1.6
1955 - 2016
WESTERN OTHER EASTERN EAST COAST
NWT* BC ALBERTA** BITUMEN SASK MAN CANADA ONT CANADA OFFSHORE CANADA
1955 1 1 137 549 270 1 957 Not available for Eastern 1 957
1956 4 7 1 347 784 191 2 333 Canada from 1955-64 2 333
1957 8 874 853 117 1 852 1 852
1958 11 870 498 61 1 440 1 440
1959 20 868 487 29 1 404 1 404
1960 1 46 957 425 52 1 481 1 481
1961 89 810 471 11 1 381 1 381
1962 161 690 376 15 1 242 1 242
1963 28 871 552 42 1 493 1 493
1964 42 912 628 72 1 654 33 1 687
1965 1 113 877 697 26 1 714 23 1 1 738
1966 45 641 540 26 1 252 11 1 263
1967 50 648 421 43 1 162 6 1 168
1968 2 46 556 387 28 1 019 9 1 028
1969 42 464 528 15 1 049 5 1 054
1970 1 36 304 469 2 812 10 822
1971 1 46 361 266 2 676 2 678
1972 1 37 514 316 868 4 872
1973 1 8 600 392 1 001 11 1 012
1974 2 6 651 71 5 735 4 739
1975 3 2 670 105 2 782 4 786
1976 4 13 550 154 3 724 3 727
1977 38 705 359 9 1 111 9 1 120
1978 1 72 946 766 10 1 795 11 1 806
1979 2 80 1 256 956 16 2 310 6 1 2 317
1980 4 31 1 639 1 099 18 2 791 12 2 2 805
1981 5 27 1 483 512 47 2 074 6 4 2 084
1982 10 25 1 619 686 163 2 503 27 1 2 531
1983 32 26 2 457 1 412 223 4 150 36 3 4 189
1984 41 106 3 189 2 120 216 5 672 28 4 5 704
1985 31 95 3 945 2 794 227 7 092 24 5 7 121
1986 16 55 2 059 667 126 2 923 20 4 2 947
1987 20 31 2 699 819 89 3 658 16 3 3 677
1988 8 42 3 014 1 069 46 4 179 39 3 4 221
1989 1 54 1 281 400 45 1 781 22 1 803
1990 1 28 1 298 641 74 2 042 16 2 058
1991 1 32 1 485 539 50 2 107 10 3 2 120
1992 32 1 702 1 495 20 2 250 11 2 2 263
1993 88 2 895 174 962 74 4 193 11 7 4 211
1994 89 2 498 21 1 148 56 3 812 5 2 3 819
1995 1 66 3 218 17 1 550 32 4 884 5 4 889
1996 3 74 2 976 1 463 2 039 34 6 589 17 1 6 607
1997 6 106 3 512 1 792 3 059 56 8 531 8 4 8 543
1998 99 1 095 296 908 32 2 430 27 2 2 459
1999 2 53 1 386 365 1 298 20 3 124 12 10 3 146
2000 5 86 2 297 901 2 330 46 5 665 28 5 8 5 706
2001 3 111 1 895 663 1 954 73 4 699 24 9 4 732
2002 3 90 1 707 938 1 489 77 4 304 11 4 4 319
2003 6 91 2 042 980 1 623 83 4 825 5 15 4 845
2004 1 80 1 847 716 1 753 114 4 511 6 9 4 526
2005 30 1 949 1 272 1 974 249 5 474 4 4 5 482
2006 67 2 146 1 220 2 243 436 6 112 16 2 4 6 134
2007 1 62 1 393 1 361 2 099 280 5 196 4 2 5 202
2008 2 11 1 260 1 044 2 431 231 4 979 5 1 2 4 987
2009 3 71 720 794 1 419 200 3 207 6 2 3 215
2010 17 1 917 1 005 1 894 302 5 135 4 2 5 141
2011 5 67 3 261 1 398 2 453 197 7 381 1 2 7 384
2012 4 41 2 884 2 409 2 529 554 8 421 5 6 8 432
2013 42 2 632 1 941 2 960 513 8 088 4 4 8 096
2014 33 2 559 1 590 3 229 445 7 856 4 3 7 863
2015 37 864 870 1 472 114 3 357 3 3 360
2016 17 720 347 1 534 50 2 668 3 2 671
Total 239 3 159 96 622 23 578 71 653 6 659 201 910 630 9 143 202 692
* Includes Mainland Terr., Mackenzie Delta & Beaufort Sea & the Arctic Islands
** Prior to 1992 includes project (bitumen) wells.
OIL WELLS COMPLETED IN CANADA
February 2017

Table 1.7
Alberta
British Columbia Saskatchewan Manitoba NWT
Eastern Canada
Total Active Total Available Utilization Rate
1977 176 27 8 1 9 - 221 340 65%
1978 228 36 16 1 7 - 288 373 77%
1979 282 47 20 1 6 - 356 452 79%
1980 339 54 27 1 5 - 426 539 79%
1981 239 26 15 2 4 - 286 497 58%
1982 177 13 12 3 7 - 212 467 45%
1983 154 7 24 4 6 - 195 482 40%
1984 191 10 38 3 7 - 249 494 50%
1985 264 17 55 2 6 - 344 533 65%
1986 167 13 16 1 6 - 203 564 36%
1987 186 10 17 1 2 - 216 539 40%
1988 202 16 22 0 1 - 241 544 44%
1989 135 17 14 0 1 - 167 511 33%
1990 144 20 19 1 1 - 185 488 38%
1991 124 20 18 1 1 - 164 469 35%
1992 103 11 16 0 0 - 130 436 30%
1993 190 20 37 2 0 - 249 421 59%
1994 254 34 41 2 0 - 331 431 77%
1995 218 27 39 1 0 - 285 461 62%
1996 241 27 50 1 1 - 320 461 69%
1997 310 35 74 2 2 - 423 503 84%
1998 252 41 36 1 2 - 332 613 54%
1999 200 30 29 1 3 - 263 578 46%
2000 294 40 47 1 1 - 383 602 64%
2001 297 51 40 2 1 - 391 638 61%
2002 225 37 34 1 1 - 298 662 45%
2003 308 62 42 1 3 6 422 685 62%
2004 323 66 39 1 3 5 437 711 61%
2005 397 74 51 4 2 6 534 750 71%
2006 376 70 53 6 0 6 511 813 63%
2007 266 52 47 4 1 5 375 872 43%
2008 265 64 67 6 0 3 405 863 47%
2009 141 47 42 5 0 3 238 855 28%
2010 237 57 69 10 0 3 376 810 46%
2011 307 52 81 12 2 1 455 810 56%
2012 269 38 71 12 2 1 393 796 49%
2013 256 46 62 10 1 0 375 809 46%
2014 274 51 67 9 0 0 401 807 50%
2015 126 35 32 4 0 0 197 766 26%
2016 89 18 26 1 0 1 135 682 20%
Source: Nickle's Daily Oil Bulletin
Canada Rigs Drilling, Available & Utilization Rate
Annual Average
February 2017


CAPP Statistical Handbook
Section 2
Reserves Table # Glossary of Terms – Reserves Frequently Used Terms ....................................................................... 2 Conventional Crude Oil Remaining Established Reserves Current Year .......................................................................................................................................... 2.1 1951 – Present ...................................................................................................................................... 2.1 Conventional Crude Oil in Canada by Type Remaining Established 1984 – Present ...................................................................................................................................... 2.2 Conventional Crude Oil by Province Remaining Established 1962 – Present ...................................................................................................................................... 2.3 Liquid Hydrocarbon Reserves in Canada Initial Established & Remaining Established Reserves Current Year .................................................................................................................................... 2.4 Conventional Crude Oil in Canada by Type Initial Established Reserves 1984 – Present ...................................................................................................................................... 2.5 Developed Non-Conventional Oil Remaining Established Reserves Current Year .......................................................................................................................................... 2.6 Developed Non-Conventional Reserves Mining – Upgraded and Bitumen 1968 - Present ....................................................................................................................................... 2.6 Developed Non-Conventional Established Reserves In Situ Bitumen 1982 – Present ...................................................................................................................................... 2.6 Non-Conventional Reserves in Canada Initial Volume In Place, Initial Established & Remaining Established Reserves Current Year .................................................................................................................................... 2.7
CAPP Statistical Handbook
Marketable Natural Gas Remaining Established Reserves Current Year .......................................................................................................................................... 2.8 Marketable Natural Gas Remaining Established Reserves 1955 - Present ....................................................................................................................................... 2.8 Marketable Natural Gas Remaining Established Reserves by Province 1962 - Present ....................................................................................................................................... 2.9 Natural Gas Liquids Remaining Established Reserves Current Year .......................................................................................................................................... 2.10 Natural Gas Liquids Remaining Established Reserves 1952 - Present ....................................................................................................................................... 2.10 NGLs/Ethane, Propane & Butane Remaining Established 1962 – Present ...................................................................................................................................... 2.11 Pentanes Plus Remaining Established 1979 – Present ...................................................................................................................................... 2.12 Sulphur Remaining Established Reserves Current Year .......................................................................................................................................... 2.13 Sulphur Remaining Established Reserves 1959 - Present ....................................................................................................................................... 2.13 Sulphur Remaining Established Reserves by Province 1962 – Present ...................................................................................................................................... 2.14

Table 2
CAPP Statistical Handbook
Glossary of Terms Reserves Frequently Used Terms
Initial Volume in-Place: The gross volume of Crude Oil, Crude Bitumen or Raw Natural Gas calculated or interpreted to exist in a reservoir before any volume has been produced. Established Reserves: Those reserves recoverable under current technology and present and anticipated economic conditions, specifically proved by drilling, testing or production, plus that judgement portion of contiguous recoverable reserves that are interpreted to exist, from geological, geophysical or similar information, with reasonable certainty. Initial Established Reserves: Established Reserves prior to the deduction of any production. Remaining Established Reserves: Initial Established Reserves less cumulative production. Ultimate Potential: An estimate of the Initial Established Reserves which will have become developed in an area by the time all exploratory and development activity has ceased, having regard for the geological prospects of that area and anticipated technology and economic conditions. Ultimate Potential includes cumulative production, Remaining Established Reserves and future additions through extensions and revisions to existing pools and the discovery of new pools. Primary Recovery: The volume of Crude Oil and Natural Gas recoverable by natural depletion processes only. Secondary Recovery: The incremental volume of Crude Oil and Natural Gas recoverable by conventional water flooding, pressure maintenance or cycling. Tertiary Recovery: The incremental volume of Crude Oil and Natural Gas recoverable by a process after or in lieu of conventional water flooding, pressure maintenance or cycling. A Tertiary Recovery process may be implemented without a preceding Secondary Recovery scheme. Enhanced Recovery: A general term for the incremental volume of Crude Oil and Natural Gas recoverable over the volume recoverable by natural depletion processes only. Enhanced Recovery is the sum of Secondary and Tertiary Recovery. Crude Oil: A mixture, consisting mainly of pentanes and heavier hydrocarbons that may contain sulphur compounds, that is liquid at the conditions under which its volume is measured or estimated, but excluding such liquids obtained from the processing of Natural Gas. Conventional Crude Oil: Crude Oil recoverable through wells where production can initially be achieved at commercial rates without altering the natural viscous state of the oil. This includes subsequent production from such reservoirs by thermal methods and Crude Oil from certain pools from which production cannot initially be achieved at commercial rates, but which, for other reasons, are designated as Conventional Crude Oil.
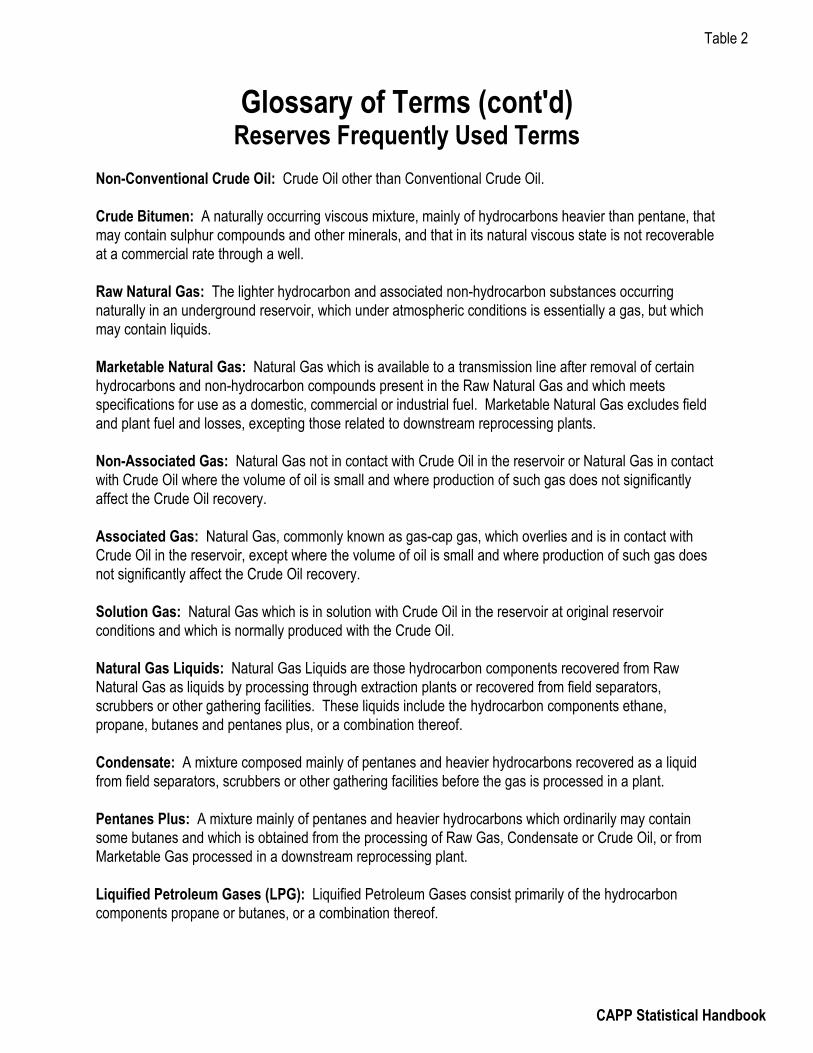
Table 2
CAPP Statistical Handbook
Glossary of Terms (cont'd) Reserves Frequently Used Terms
Non-Conventional Crude Oil: Crude Oil other than Conventional Crude Oil. Crude Bitumen: A naturally occurring viscous mixture, mainly of hydrocarbons heavier than pentane, that may contain sulphur compounds and other minerals, and that in its natural viscous state is not recoverable at a commercial rate through a well. Raw Natural Gas: The lighter hydrocarbon and associated non-hydrocarbon substances occurring naturally in an underground reservoir, which under atmospheric conditions is essentially a gas, but which may contain liquids. Marketable Natural Gas: Natural Gas which is available to a transmission line after removal of certain hydrocarbons and non-hydrocarbon compounds present in the Raw Natural Gas and which meets specifications for use as a domestic, commercial or industrial fuel. Marketable Natural Gas excludes field and plant fuel and losses, excepting those related to downstream reprocessing plants. Non-Associated Gas: Natural Gas not in contact with Crude Oil in the reservoir or Natural Gas in contact with Crude Oil where the volume of oil is small and where production of such gas does not significantly affect the Crude Oil recovery. Associated Gas: Natural Gas, commonly known as gas-cap gas, which overlies and is in contact with Crude Oil in the reservoir, except where the volume of oil is small and where production of such gas does not significantly affect the Crude Oil recovery. Solution Gas: Natural Gas which is in solution with Crude Oil in the reservoir at original reservoir conditions and which is normally produced with the Crude Oil. Natural Gas Liquids: Natural Gas Liquids are those hydrocarbon components recovered from Raw Natural Gas as liquids by processing through extraction plants or recovered from field separators, scrubbers or other gathering facilities. These liquids include the hydrocarbon components ethane, propane, butanes and pentanes plus, or a combination thereof. Condensate: A mixture composed mainly of pentanes and heavier hydrocarbons recovered as a liquid from field separators, scrubbers or other gathering facilities before the gas is processed in a plant. Pentanes Plus: A mixture mainly of pentanes and heavier hydrocarbons which ordinarily may contain some butanes and which is obtained from the processing of Raw Gas, Condensate or Crude Oil, or from Marketable Gas processed in a downstream reprocessing plant. Liquified Petroleum Gases (LPG): Liquified Petroleum Gases consist primarily of the hydrocarbon components propane or butanes, or a combination thereof.

Remaining Remaining Net Change
Reserves at Reserves at in Reserves
Previous Year Current Year
CRUDE OIL
British Columbia 17 553 16 483 - 1 070 Alberta 280 773 267 789 - 12 985 Saskatchewan 214 000 143 123 - 70 877 Manitoba 6 800 6 566 - 234 Ontario 1 405 1 352 - 53 Mainland Territories 8 297 7 776 - 521 Eastcoast Offshore 109 600 205 500 95 900
Total 638 428 648 588 10 161
Frontier Areas
Mackenzie/Beaufort 53 950 53 950 Total Frontier Areas 53 950 53 950
TOTAL CRUDE OIL 692 378 702 538 10 161
PENTANES PLUS
British Columbia 30 900 32 900 2 000 Alberta 40 700 35 300 - 5 400 Eastcoast Offshore 4 268 4 268
TOTAL PENTANES PLUS 75 868 72 468 - 3 400
TOTAL CRUDE OIL & EQUIV 768 246 775 006 6 761
Note: Effective 2010 CAPP Reserves are based on provincial and NEB data. Year ends vary.
Thousand cubic metres
2016
CONVENTIONAL CRUDE - OIL
REMAINING ESTABLISHED RESERVES IN CANADA
January 2018 Table 2.1

Table 2.1
CONVENTIONAL CRUDE OIL
REMAINING ESTABLISHED RESERVES IN CANADA
1951 - 2016
Thousand Cubic Metres
Remaining Remaining Net Change
at Beginning Gross Net at End in Reserves
of Year Additions Production** of Year during Year
1951 191 106 35 169 7 519 218 756 27 650
1952 218 756 57 749 9 614 266 891 48 135
1953 266 891 39 222 12 857 293 256 26 365
1954 293 256 72 750 15 194 350 812 57 556
1955 350 812 68 240 20 262 398 790 47 978
1956 398 790 80 910 26 907 452 793 54 003
1957 452 793 32 868 28 882 456 779 3 986
1958 456 779 72 701 26 386 503 094 46 315
1959 503 094 81 832 29 198 555 728 52 634
1960 555 728 59 197 30 368 584 557 28 829
1961 584 557 113 788 35 123 663 222 78 665
1962 663 222 87 720 38 914 712 028 48 806
Break in Series
1963 1 062 733 13 944 40 758 1 035 919 - 26 814
1964 1 035 919 255 384 43 033 1 248 270 212 351
1965 1 248 270 196 556 46 337 1 398 489 150 219
1966 1 398 489 208 887 50 224 1 557 152 158 663
1967 1 557 152 124 587 54 690 1 627 049 69 897
1968 1 627 049 93 668 59 030 1 661 687 34 638
1969 1 661 687 66 636 62 516 1 665 807 4 120
1970 1 665 807 26 894 69 606 1 623 095 - 42 712
1971 1 623 095 37 636 76 297 1 584 434 - 38 661
1972 1 584 434 22 229 82 319 1 524 344 - 60 090
1973 1 524 344 6 537 99 423 1 431 458 - 92 886
1974 1 431 458 - 5 065 95 530 1 330 863 - 100 595
1975 1 330 863 - 6 280 79 897 1 244 686 - 86 177
1976 1 244 686 5 921 69 683 1 180 924 - 63 762
1977 1 180 924 10 227 70 872 1 120 279 - 60 645
1978 1 120 279 37 426 67 647 1 090 058 - 30 221
1979 1 090 058 71 415 79 469 1 082 004 - 8 054
1980 1 082 004 - 56 247 74 529 951 228 - 130 776
1981 951 228 178 220 65 873 1 063 575 112 347
1982 1 063 575 19 314 61 756 1 021 133 - 42 442
1983 1 021 133 66 074 64 488 1 022 719 1 586
1984 1 022 719 - 588 73 108 949 023 - 73 696
1985 949 023 39 837 73 030 915 830 - 33 193
1986 915 830 98 719 70 138 944 411 28 581
1987 944 411 67 943 72 192 940 162 - 4 249
1988 940 162 108 468 73 482 975 148 34 986
1989 975 148 31 677 68 832 937 993 - 37 155
1990 937 993 18 350 68 386 887 957 - 50 036
1991 887 957 22 359 69 014 841 302 - 46 655
January 2018

Table 2.1
CONVENTIONAL CRUDE OIL
REMAINING ESTABLISHED RESERVES IN CANADA
1951 - 2016
Thousand Cubic Metres
Remaining Remaining Net Change
at Beginning Gross Net at End in Reserves
of Year Additions Production** of Year during Year
1992 841 302 39 697 71 265 809 734 - 31 568
1993 809 734 65 439 74 587 800 586 - 9 148
1994 800 586 56 607 78 400 778 793 - 21 793
1995 778 793 78 078 78 844 778 027 - 766
1996 778 027 71 518 80 176 769 369 - 8 658
1997 769 369 97 177 82 607 783 939 14 570
1998 783 939 72 883 81 473 775 349 - 8 590
1999 775 349 48 966 76 468 747 847 - 27 502
2000 747 847 103 550 79 368 772 029 24 182
2001 772 029 48 559 80 492 740 096 - 31 933
2002 740 096 58 867 84 986 713 977 - 26 119
2003 713 977 47 049 84 739 676 287 - 37 690
2004 676 287 97 629 81 975 691 941 15 654
2005 691 941 215 224 79 227 827 938 135 997
2006 827 938 36 292 78 540 785 690 - 42 248
2007 785 690 92 816 81 169 797 337 11 647
2008 797 337 46 565 78 767 765 135 - 32 202
2009 750 277 - 7 786 69 693 636 109 - 114 168
Break in data series
2010 636 109 - - 659 114 23 005
2011 659 114 - - 655 410 - 3 704
2012 655 410 - - 682 253 26 843
2013 682 253 - - 680 770 - 1 483
2014 680 770 - - 656 616 - 27 304
2015 656 616 - - 692 378 35 762
2016 692 378 - - 702 538 10 161
**Preliminary estimate. Corrections to previous year cumulative production included with gross additions.
Note: Effective 2010 CAPP Reserves are based on provincial and NEB data. Year ends vary.
Note: East Coast Offshore reserves booked in 1981, Arctic Islands booked in 1985 and Mackenzie Delta/Beaufort Sea booked in 1986.
January 2018
Main. Territory
Mac Delta/ Beau
Sea Arctic Isles
British
Columbia Alberta Saskatchewan Manitoba Ontario Other East Can.
E. Coast
Offshore Canada
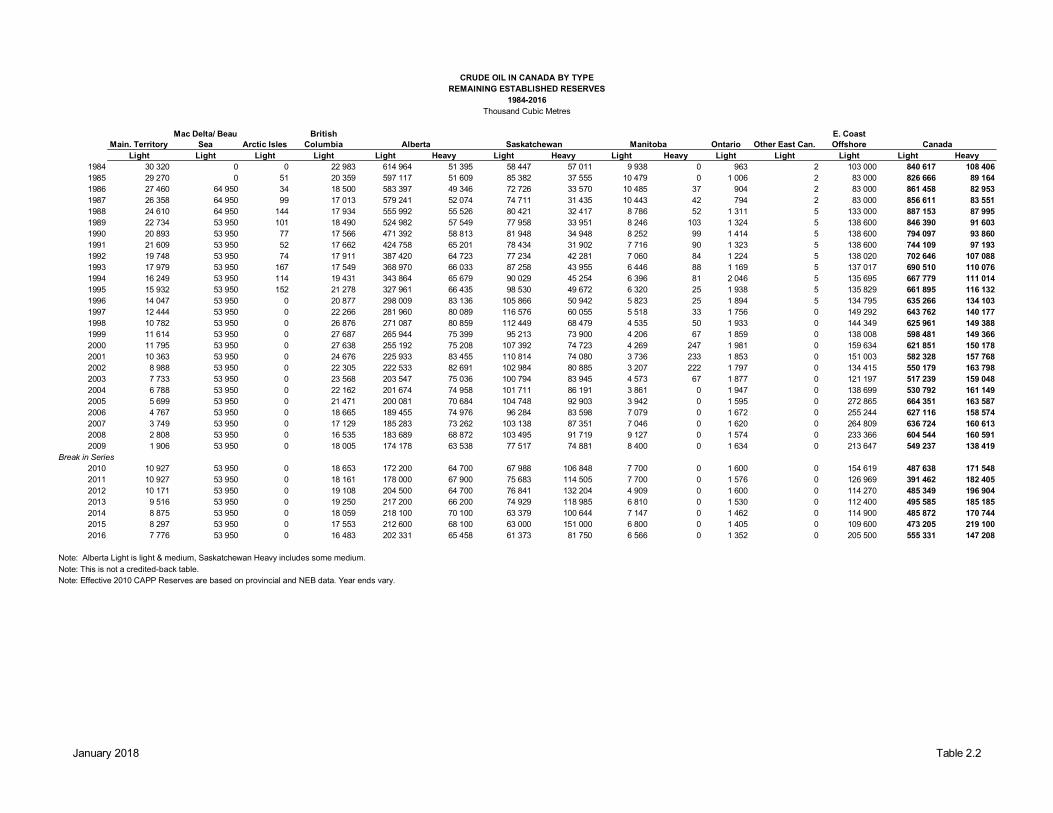
Light Light Light Light Light Heavy Light Heavy Light Heavy Light Light Light Light Heavy
1984 30 320 0 0 22 983 614 964 51 395 58 447 57 011 9 938 0 963 2 103 000 840 617 108 406
1985 29 270 0 51 20 359 597 117 51 609 85 382 37 555 10 479 0 1 006 2 83 000 826 666 89 164
1986 27 460 64 950 34 18 500 583 397 49 346 72 726 33 570 10 485 37 904 2 83 000 861 458 82 953
1987 26 358 64 950 99 17 013 579 241 52 074 74 711 31 435 10 443 42 794 2 83 000 856 611 83 551
1988 24 610 64 950 144 17 934 555 992 55 526 80 421 32 417 8 786 52 1 311 5 133 000 887 153 87 995
1989 22 734 53 950 101 18 490 524 982 57 549 77 958 33 951 8 246 103 1 324 5 138 600 846 390 91 603
1990 20 893 53 950 77 17 566 471 392 58 813 81 948 34 948 8 252 99 1 414 5 138 600 794 097 93 860
1991 21 609 53 950 52 17 662 424 758 65 201 78 434 31 902 7 716 90 1 323 5 138 600 744 109 97 193
1992 19 748 53 950 74 17 911 387 420 64 723 77 234 42 281 7 060 84 1 224 5 138 020 702 646 107 088
1993 17 979 53 950 167 17 549 368 970 66 033 87 258 43 955 6 446 88 1 169 5 137 017 690 510 110 076
1994 16 249 53 950 114 19 431 343 864 65 679 90 029 45 254 6 396 81 2 046 5 135 695 667 779 111 014
1995 15 932 53 950 152 21 278 327 961 66 435 98 530 49 672 6 320 25 1 938 5 135 829 661 895 116 132
1996 14 047 53 950 0 20 877 298 009 83 136 105 866 50 942 5 823 25 1 894 5 134 795 635 266 134 103
1997 12 444 53 950 0 22 266 281 960 80 089 116 576 60 055 5 518 33 1 756 0 149 292 643 762 140 177
1998 10 782 53 950 0 26 876 271 087 80 859 112 449 68 479 4 535 50 1 933 0 144 349 625 961 149 388
1999 11 614 53 950 0 27 687 265 944 75 399 95 213 73 900 4 206 67 1 859 0 138 008 598 481 149 366
2000 11 795 53 950 0 27 638 255 192 75 208 107 392 74 723 4 269 247 1 981 0 159 634 621 851 150 178
2001 10 363 53 950 0 24 676 225 933 83 455 110 814 74 080 3 736 233 1 853 0 151 003 582 328 157 768
2002 8 988 53 950 0 22 305 222 533 82 691 102 984 80 885 3 207 222 1 797 0 134 415 550 179 163 798
2003 7 733 53 950 0 23 568 203 547 75 036 100 794 83 945 4 573 67 1 877 0 121 197 517 239 159 048
2004 6 788 53 950 0 22 162 201 674 74 958 101 711 86 191 3 861 0 1 947 0 138 699 530 792 161 149
2005 5 699 53 950 0 21 471 200 081 70 684 104 748 92 903 3 942 0 1 595 0 272 865 664 351 163 587
2006 4 767 53 950 0 18 665 189 455 74 976 96 284 83 598 7 079 0 1 672 0 255 244 627 116 158 574
2007 3 749 53 950 0 17 129 185 283 73 262 103 138 87 351 7 046 0 1 620 0 264 809 636 724 160 613
2008 2 808 53 950 0 16 535 183 689 68 872 103 495 91 719 9 127 0 1 574 0 233 366 604 544 160 591
2009 1 906 53 950 0 18 005 174 178 63 538 77 517 74 881 8 400 0 1 634 0 213 647 549 237 138 419
Break in Series
2010 10 927 53 950 0 18 653 172 200 64 700 67 988 106 848 7 700 0 1 600 0 154 619 487 638 171 548
2011 10 927 53 950 0 18 161 178 000 67 900 75 683 114 505 7 700 0 1 576 0 126 969 391 462 182 405
2012 10 171 53 950 0 19 108 204 500 64 700 76 841 132 204 4 909 0 1 600 0 114 270 485 349 196 904
2013 9 516 53 950 0 19 250 217 200 66 200 74 929 118 985 6 810 0 1 530 0 112 400 495 585 185 185
2014 8 875 53 950 0 18 059 218 100 70 100 63 379 100 644 7 147 0 1 462 0 114 900 485 872 170 744
2015 8 297 53 950 0 17 553 212 600 68 100 63 000 151 000 6 800 0 1 405 0 109 600 473 205 219 100
2016 7 776 53 950 0 16 483 202 331 65 458 61 373 81 750 6 566 0 1 352 0 205 500 555 331 147 208
Note: Alberta Light is light & medium, Saskatchewan Heavy includes some medium.
Note: This is not a credited-back table.
Note: Effective 2010 CAPP Reserves are based on provincial and NEB data. Year ends vary.
CRUDE OIL IN CANADA BY TYPE
REMAINING ESTABLISHED RESERVES
1984-2016
Thousand Cubic Metres
January 2018 Table 2.2

Table 2.3
CRUDE OIL
REMAINING ESTABLISHED RESERVES IN CANADA
AT YEAR END
1962 - 2016
Thousand Cubic Metres
Mainland Territories Mackenzie Delta/ Arctic British Other Eastcoast
(S. 68° N) Beaufort Sea Isles Columbia Alberta Saskatchewan Manitoba Ontario Eastern Canada Offshore Canada
1962 8 011 37 021 879 352 131 120 5 735 1 494 1 062 733
1963 7 914 40 456 856 204 120 351 8 056 2 938 1 035 919
1964 7 813 42 651 1 046 816 138 294 9 637 3 057 2 1 248 270
1965 7 612 51 892 1 177 618 146 803 11 534 3 029 1 1 398 489
1966 7 489 53 959 1 327 535 153 545 12 449 2 174 1 1 557 152
1967 7 604 61 681 1 386 190 156 680 12 655 1 983 256 1 627 049
1968 7 462 56 506 1 426 719 156 191 12 464 2 091 254 1 661 687
1969 7 326 51 690 1 442 838 148 787 12 835 2 078 253 1 665 807
1970 11 950 53 703 1 394 634 147 395 13 253 1 909 251 1 623 095
1971 11 747 46 389 1 374 947 136 975 12 374 1 753 249 1 584 434
1972 11 590 42 406 1 326 988 129 671 11 317 2 124 248 1 524 344
1973 11 425 39 865 1 245 676 121 747 10 486 2 013 246 1 431 458
1974 11 250 32 223 1 161 155 115 805 8 012 2 173 245 1 330 863
1975 11 091 27 454 1 068 705 127 990 7 317 1 883 246 1 244 686
1976 10 920 25 716 1 012 060 122 888 7 134 1 960 246 1 180 924
1977 10 761 24 351 957 152 119 439 6 474 1 857 245 1 120 279
1978 10 598 22 812 931 603 117 214 6 330 1 491 10 1 090 058
1979 21 148 27 588 908 403 117 723 5 678 1 455 9 1 082 004
1980 21 009 25 898 779 980 117 752 5 195 385 9 950 228
1981 20 860 25 904 718 848 117 045 4 962 948 8 175 000 1 063 575
1982 20 673 24 180 682 518 109 707 8 211 836 8 175 000 1 021 133
1983 30 493 24 265 665 273 114 295 12 534 851 8 175 000 1 022 719
1984 30 320 22 983 666 359 115 458 9 938 963 2 103 000 949 023
1985 29 270 51 20 359 648 726 122 937 10 479 1 006 2 83 000 915 830
1986 27 460 64 950 34 18 500 632 743 106 296 10 522 904 2 83 000 944 411
1987 26 358 64 950 99 17 013 631 315 106 146 10 485 794 2 83 000 940 162
1988 24 610 64 950 144 17 934 611 518 112 838 8 838 1 311 5 133 000 975 148
1989 22 734 53 950 101 18 490 582 531 111 909 8 349 1 324 5 138 600 937 993
1990 20 893 53 950 77 17 566 530 205 116 896 8 351 1 414 5 138 600 887 957
1991 21 609 53 950 52 17 662 489 959 110 336 7 806 1 323 5 138 600 841 302
1992 19 748 53 950 74 17 911 452 143 119 515 7 144 1 224 5 138 020 809 734
1993 17 979 53 950 167 17 549 435 003 131 213 6 534 1 169 5 137 017 800 586
1994 16 249 53 950 114 19 431 409 543 135 283 6 477 2 046 5 135 695 778 793
1995 15 932 53 950 152 21 278 394 396 148 202 6 345 1 938 5 135 829 778 027
1996 14 047 53 950 20 877 381 145 156 808 5 848 1 894 5 134 795 769 369
1997 12 444 53 950 22 266 362 049 176 631 5 551 1 756 149 292 783 939
1998 10 782 53 950 26 876 351 946 180 928 4 585 1 933 144 349 775 349
1999 11 614 53 950 27 687 341 343 169 113 4 273 1 859 138 008 747 847
2000 11 795 53 950 27 638 330 400 182 115 4 516 1 981 159 634 772 029
2001 10 363 53 950 24 676 309 388 184 894 3 969 1 853 151 003 740 096
2002 8 988 53 950 22 305 305 224 183 869 3 429 1 797 134 415 713 977
2003 7 733 53 950 23 568 278 583 184 739 4 640 1 877 121 197 676 287
2004 6 788 53 950 22 162 276 632 187 902 3 861 1 947 138 699 691 941
2005 5 699 53 950 21 471 270 765 197 651 3 942 1 595 272 865 827 938
2006 4 767 53 950 18 665 264 431 179 882 7 079 1 672 255 244 785 690
2007 3 749 53 950 17 129 258 545 190 489 7 046 1 620 264 809 797 337
2008 2 808 53 950 16 535 252 561 195 214 9 127 1 574 233 366 765 135
2009 1 906 53 950 18 005 237 716 152 398 8 400 1 634 213 647 687 656
Break in Data Series
2010 10 927 53 950 na 18 653 236 853 174 836 7 700 1 576 na 154 619 659 114
2011 10 927 53 950 na 18 161 245 939 190 188 7 700 1 576 na 126 969 648 989
2012 10 171 53 950 na 19 108 269 200 209 045 4 909 1 600 na 114 270 682 253
2013 9 516 53 950 na 19 250 283 400 193 914 6 810 1 530 na 112 400 680 770
2014 8 875 53 950 na 18 059 288 200 164 023 7 147 1 462 na 114 900 656 616
2015 8 297 53 950 na 17 553 280 700 214 000 6 800 1 405 na 109 600 692 305
2016 7 776 53 950 na 16 483 267 789 143 123 6 566 1 352 na 205 500 702 539
Note: East Coast Offshore crude oil reserves booked for first time in 1981.
Arctic Islands crude oil reserves booked for first time in 1985.
Mackenzie Delta/Beaufort Sea booked for first time in 1986.
Note: Effective 2010 CAPP Reserves are based on provincial and NEB data. Year ends vary.
January 2018

Table 2.4
ESTABLISHED RESERVES
AT 2016-12-31
Thousand Cubic Metres
Initial Remaining
Established Established
Reserves Reserves
Crude Oil
Conventional Areas
British Columbia 135 959 16 483
Alberta 3 046 000 267 789
Saskatchewan 1 141 303 143 123
Manitoba 65 666 6 566
Ontario 16 000 1 352
Mainland Territories (S68°N) 53 000 7 776
East Coast Offshore 615 799 205 500
Total Conventional Areas 5 073 727 648 588
Frontier Areas
Mackenzie Delta/Beaufort Sea 54 000 53 950
Total Frontier Areas 54 000 53 950
TOTAL CRUDE OIL 5 127 727 702 538
Note: Effective 2010 CAPP Reserves are based on provincial and NEB data. Year ends vary.
LIQUID HYDROCARBON RESERVES IN CANADA
INITIAL ESTABLISHED & REMAINING
January 2018

Mackenzie Delta/ Beaufort
Sea Arctic Isles British Columbia Alberta Saskatchewan Manitoba Ontario
Other Eastern
Canada CanadaLight Light Light Light Light Heavy Light Heavy Light Heavy Light Light Light Light Heavy
1984 35 000 0 0 83 748 1 958 240 125 042 260 677 163 086 33 132 0 10 100 129 103 000 2 484 026 288 1281985 35 000 0 100 83 347 1 990 812 131 656 358 146 83 632 34 498 0 10 257 129 83 000 2 595 289 215 2881986 34 600 65 000 100 83 195 2 021 634 136 696 354 738 85 104 35 119 261 10 261 129 83 000 2 687 776 222 0611987 35 030 65 000 200 83 845 2 065 908 147 172 364 822 86 263 35 830 275 10 284 129 83 000 2 744 048 233 7101988 35 030 65 000 300 86 687 2 090 609 159 089 379 441 92 100 34 914 295 10 998 133 133 000 2 836 112 251 4841989 35 030 54 000 300 89 257 2 105 233 170 068 385 586 94 913 35 112 355 11 268 133 138 600 2 854 519 265 3361990 35 030 54 000 300 90 303 2 094 906 181 154 397 136 99 048 35 837 357 11 606 133 138 600 2 857 851 280 5591991 37 500 54 000 300 92 363 2 087 660 199 584 401 544 100 000 36 079 357 11 742 133 138 600 2 859 921 299 9411992 37 500 54 000 350 94 662 2 090 496 212 484 413 356 114 494 36 079 357 11 867 133 138 600 2 877 043 327 3351993 37 500 54 000 500 96 273 2 119 501 220 654 429 576 123 441 36 087 367 12 065 133 138 600 2 924 235 344 4621994 37 500 54 000 500 100 088 2 137 185 234 258 443 333 130 988 36 673 367 13 200 133 138 600 2 961 212 365 6131995 38 881 54 000 575 103 957 2 162 425 249 643 463 806 142 539 37 173 319 13 377 133 139 980 3 014 307 392 5011996 38 628 54 000 463 105 600 2 171 818 281 783 484 968 151 890 37 295 324 13 601 133 139 980 3 046 486 433 9971997 38 628 54 000 463 109 666 2 192 148 294 895 506 663 170 426 37 671 338 13 683 128 155 250 3 108 300 465 6591998 38 628 54 000 463 117 289 2 215 899 311 009 519 182 188 215 37 303 362 14 079 128 155 250 3 152 221 499 5861999 40 987 54 000 463 119 891 2 242 056 319 065 515 550 203 036 37 595 389 14 249 128 154 846 3 179 765 522 4902000 42 533 54 000 463 123 020 2 259 408 332 877 539 245 215 867 38 155 592 14 602 128 184 866 3 256 420 549 3362001 42 533 54 000 463 122 575 2 260 448 355 479 555 973 226 521 38 155 592 14 920 128 184 866 3 274 061 582 5922002 42 533 54 000 463 122 309 2 277 425 367 485 562 215 245 407 38 155 592 15 082 128 184 866 3 297 176 613 4842003 42 533 54 000 463 126 228 2 285 989 372 919 568 908 262 129 40 489 447 15 162 128 191 197 3 325 097 635 4952004 42 853 54 000 463 126 882 2 307 138 384 986 581 627 277 075 40 723 0 15 232 128 226 947 3 395 993 662 0612005 42 853 54 000 463 127 797 2 327 449 392 115 596 133 296 686 41 560 0 15 288 128 378 818 3 584 489 688 8012006 43 003 54 000 463 126 382 2 337 406 407 461 598 614 300 135 45 788 0 15 490 128 378 818 3 600 092 707 5962007 43 003 54 000 463 126 533 2 354 505 415 994 618 350 316 824 47 056 0 15 546 128 409 564 3 669 148 732 8182008 43 003 54 000 463 127 439 2 375 260 417 613 632 970 332 344 50 502 0 15 596 128 398 204 3 697 565 749 9572009 43 003 54 000 463 130 153 2 384 242 419 724 625 207 326 403 51 171 0 15 656 128 394 013 3 698 036 746 127
Break in Series2010 53 926 54 000 463 131 840 2 450 300 379 400 456 900 534 674 53 552 0 15 899 128 339 801 3 556 808 914 0742011 53 925 54 000 463 132 414 2 474 700 388 500 475 654 556 110 55 426 0 15 924 128 364 296 3 626 930 944 6102012 53 778 54 000 463 134 600 2 525 000 396 700 489 414 588 484 55 031 0 15 922 128 352 111 3 680 448 985 1842013 53 863 54 000 463 135 883 2 562 900 407 000 500 481 589 933 60 000 0 16 108 128 471 995 3 855 822 996 9332014 54 457 54 000 463 135 657 2 589 300 420 700 514 844 606 862 62 630 0 16 094 128 503 745 3 931 318 1 027 5622015 53 000 54 000 463 136 691 2 601 200 431 700 361 000 807 000 68 000 0 16 000 128 628 000 3 918 482 1 238 7002016 53 000 54 000 463 135 959 2 610 000 436 000 347 834 793 469 65 666 0 16 000 128 615 799 3 898 849 1 229 469
Note: Alberta Light is light & medium, Saskatchewan Heavy includes some medium.Note: This is not a credited-back table.Note: Effective 2010 CAPP Reserves are based on provincial and NEB data. Year ends vary.
CRUDE OIL IN CANADA BY TYPE
Mainland Territory
Eastcoast
Offshore
INITIAL ESTABLISHED RESERVES 1984-2016
Thousand Cubic Metres
January 2018 Table 2.5

REMAINING ESTABLISHED RESERVES IN CANADA
2015
Thousand Cubic Metres
Remaining Remaining Net Change
Reserves at Reserves at In Reserves
2014-12-31 2015-12-31 during 2015
MINING - UPGRADED AND BITUMEN
Alberta 5 166 000 5 099 000 ( 67 000)
Developed synthetic crude oil reserves are those recoverable from developed commercial projects
IN-SITU - BITUMEN
Alberta 21 265 000 21 185 000 ( 80 000)
Note: Effective 2010 CAPP Reserves are based on provincial data
DEVELOPED NON-CONVENTIONAL OIL
Developed bitumen reserves are those recoverable from developed experimental/demonstration and commercial projects
March 2017 Table 2.6

Table 2.6
Remaining Remaining Net Change
at Beginning Gross Net at End in Reserves
of Year Additions Production* of Year during Year
1982 - 8 331 1 281 7 050 7 050
1983 7 050 725 1 455 6 320 - 730
1984 6 320 1 993 1 943 6 370 50
1985 6 370 132 726 2 589 136 507 130 137
1986 136 507 15 948 4 695 147 760 11 253
1987 147 760 10 387 6 731 151 416 3 656
1988 151 416 78 127 7 546 221 997 70 581
1989 221 997 4 480 7 482 218 995 - 3 002
1990 218 995 - 36 548 7 856 174 591 - 44 404
1991 174 591 - 3 154 7 113 164 324 - 10 267
1992 164 324 7 763 7 362 164 725 401
1993 164 725 1 356 7 237 158 844 - 5 881
1994 158 844 18 606 7 810 169 640 10 796
1995 169 640 36 553 8 743 197 450 27 810
1996 197 450 23 190 9 535 211 105 13 655
1997 211 105 32 694 13 962 229 837 18 732
1998 229 837 6 850 16 173 220 514 - 9 323
1999 220 514 41 744 14 200 248 058 27 544
2000 248 058 55 129 16 361 286 826 38 768
2001 286 826 19 355 16 954 289 227 2 401
2002 289 227 49 782 17 264 321 745 32 518
2003 321 745 19 655 18 401 322 999 1 254
2004 322 999 30 406 22 537 330 868 7 869
2005 330 868 87 940 25 555 393 253 62 385
2006 393 253 381 799 27 161 747 891 354 638
2007 747 891 67 929 29 230 786 590 38 699
2008 786 590 302 304 32 030 1 056 864 270 274
2009 1 056 864 33 963 33 033 1 057 794 930
Break in data series
2010 21 554 000 - - 21 509 000 - 45 000
2011 21 509 000 - - 21 461 000 - 48 000
2012 21 461 000 - - 21 403 000 - 58 000
2013 21 403 000 - - 21 339 000 - 64 000
2014 21 339 000 - - 21 265 000 - 74 000
2015 21 265 000 - - 21 185 000 - 80 000
Developed bitumen reserves are those recoverable from developed experimental/demonstration and commercial projects.
*Preliminary estimate. Corrections to previous year cumulative production included with gross additions.
Note: Effective 2010 CAPP Reserves are based on provincial and NEB data. Year ends vary.
DEVELOPED NON-CONVENTIONAL ESTABLISHED RESERVES
AT YEAR-END IN-SITU BITUMEN
1982 - 2015
Thousand Cubic Metres
March 2017
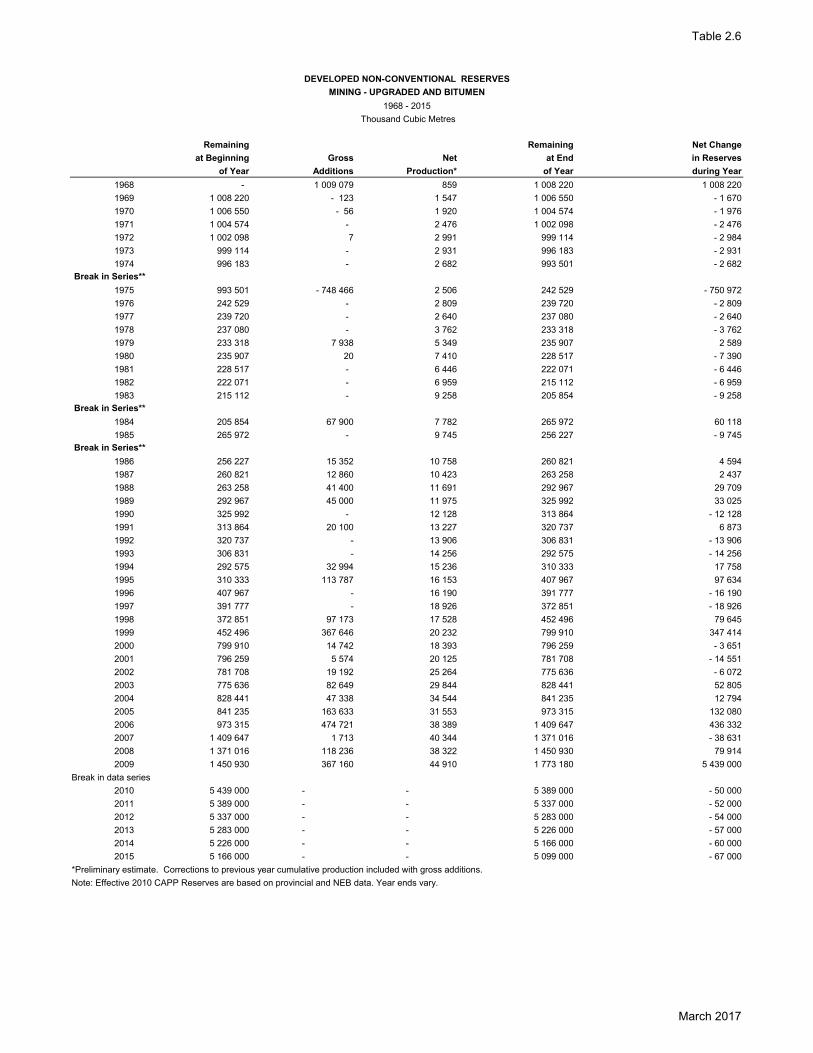
Table 2.6
DEVELOPED NON-CONVENTIONAL RESERVES
MINING - UPGRADED AND BITUMEN
1968 - 2015
Thousand Cubic Metres
Remaining Remaining Net Change
at Beginning Gross Net at End in Reserves
of Year Additions Production* of Year during Year
1968 - 1 009 079 859 1 008 220 1 008 220
1969 1 008 220 - 123 1 547 1 006 550 - 1 670
1970 1 006 550 - 56 1 920 1 004 574 - 1 976
1971 1 004 574 - 2 476 1 002 098 - 2 476
1972 1 002 098 7 2 991 999 114 - 2 984
1973 999 114 - 2 931 996 183 - 2 931
1974 996 183 - 2 682 993 501 - 2 682
Break in Series**
1975 993 501 - 748 466 2 506 242 529 - 750 972
1976 242 529 - 2 809 239 720 - 2 809
1977 239 720 - 2 640 237 080 - 2 640
1978 237 080 - 3 762 233 318 - 3 762
1979 233 318 7 938 5 349 235 907 2 589
1980 235 907 20 7 410 228 517 - 7 390
1981 228 517 - 6 446 222 071 - 6 446
1982 222 071 - 6 959 215 112 - 6 959
1983 215 112 - 9 258 205 854 - 9 258
Break in Series**
1984 205 854 67 900 7 782 265 972 60 118
1985 265 972 - 9 745 256 227 - 9 745
Break in Series**
1986 256 227 15 352 10 758 260 821 4 594
1987 260 821 12 860 10 423 263 258 2 437
1988 263 258 41 400 11 691 292 967 29 709
1989 292 967 45 000 11 975 325 992 33 025
1990 325 992 - 12 128 313 864 - 12 128
1991 313 864 20 100 13 227 320 737 6 873
1992 320 737 - 13 906 306 831 - 13 906
1993 306 831 - 14 256 292 575 - 14 256
1994 292 575 32 994 15 236 310 333 17 758
1995 310 333 113 787 16 153 407 967 97 634
1996 407 967 - 16 190 391 777 - 16 190
1997 391 777 - 18 926 372 851 - 18 926
1998 372 851 97 173 17 528 452 496 79 645
1999 452 496 367 646 20 232 799 910 347 414
2000 799 910 14 742 18 393 796 259 - 3 651
2001 796 259 5 574 20 125 781 708 - 14 551
2002 781 708 19 192 25 264 775 636 - 6 072
2003 775 636 82 649 29 844 828 441 52 805
2004 828 441 47 338 34 544 841 235 12 794
2005 841 235 163 633 31 553 973 315 132 080
2006 973 315 474 721 38 389 1 409 647 436 332
2007 1 409 647 1 713 40 344 1 371 016 - 38 631
2008 1 371 016 118 236 38 322 1 450 930 79 914
2009 1 450 930 367 160 44 910 1 773 180 5 439 000
Break in data series
2010 5 439 000 - - 5 389 000 - 50 000
2011 5 389 000 - - 5 337 000 - 52 000
2012 5 337 000 - - 5 283 000 - 54 000
2013 5 283 000 - - 5 226 000 - 57 000
2014 5 226 000 - - 5 166 000 - 60 000
2015 5 166 000 - - 5 099 000 - 67 000
*Preliminary estimate. Corrections to previous year cumulative production included with gross additions.
Note: Effective 2010 CAPP Reserves are based on provincial and NEB data. Year ends vary.
March 2017

INITIAL VOLUME IN PLACE, INITIAL ESTABLISHED & REMAINING
AT 2015-12-31
Initial Volume Initial Remaining
in Place Established Reserves Established Reserves
SURFACE MINING - INTEGRATED SYNTHETIC CRUDE OIL
Thousand Cubic Metres
Alberta 20 800 000 6 157 000 5 099 000
Total Canada 20 800 000 6 157 000 5 099 000
SULPHUR
Thousand Tonnes
Alberta 93 800
Total Canada 93 800
Developed upgraded bitumen reserves are those recoverable from developed commercial projects
IN-SITU RAW BITUMEN
Thousand Cubic Metres
Alberta 293 125 000 28 090 000 21 185 000
Total Canada 293 125 000 28 090 000 21 185 000
Developed bitumen reserves are those recovered from developed experimental / demonstration and commercial projects
Note: Effective 2010 CAPP Reserves are based on provincial and NEB data
NON-CONVENTIONAL RESERVES IN CANADA
March 2017 Table 2.7

Remaining Remaining Net Changes
Reserves at Reserves at in Reserves
Previous Year Current Year
NATURAL GAS
British Columbia 1 216 740 1 258 977 42 237
Alberta 829 126 758 438 - 70 688
Saskatchewan 49 306 46 723 - 2 583
Ontario 6 780 6 677 - 102
New Brunswick 2 883 2 843 - 40
Mainland Territories 12 503 12 448 - 55
Eastcoast Offshore 742 742
TOTAL MARKETABLE NATURAL GAS 2 118 080 2 086 848 - 31 232
Note: Effective 2010 CAPP Reserves are based on provincial and NEB data. Year ends vary.
MARKETABLE NATURAL GAS
REMAINING ESTABLISHED RESERVES IN CANADA
2016
Million Cubic Metres at 101.325 kPa and 15°C
January 2018 Table 2.8

Table 2.8
MARKETABLE NATURAL GAS
REMAINING ESTABLISHED RESERVES IN CANADA
1955 - 2016
Million Cubic Metres at 101.325 kPa and 15°C
Remaining Net Change in Remaining Net Change
at Beginning Gross Underground Net at End in Reserves
Of Year Additions Storage Production of Year during Year
1955 355 802 60 724 102 4 110 412 518 56 716
1956 412 518 79 089 117 5 426 486 298 73 780
1957 486 298 34 215 79 6 862 513 730 27 432
1958 513 730 72 877 60 9 437 577 230 63 500
1959 577 230 94 059 966 12 347 659 908 82 678
1960 659 908 113 847 153 13 378 760 530 100 622
1961 760 530 91 169 - 8 19 544 832 147 71 617
1962 832 147 70 930 - 11 23 554 879 512 47 365
1963 879 512 74 749 721 25 459 929 523 50 011
Break in Series
1964 1 054 466 257 146 782 28 436 1 283 958 229 492
1965 1 283 958 62 203 - 218 30 642 1 315 301 31 343
1966 1 315 301 110 766 505 31 704 1 394 868 79 567
1967 1 394 868 86 355 116 34 262 1 447 077 52 209
1968 1 447 077 136 443 - 35 39 300 1 544 185 97 108
1969 1 544 185 137 938 62 43 854 1 638 331 94 146
1970 1 638 331 128 611 569 50 690 1 716 821 78 490
1971 1 716 821 101 860 2 55 027 1 763 656 46 835
1972 1 763 656 21 822 - 157 63 329 1 721 992 - 41 664
1973 1 721 992 70 228 1 975 65 514 1 728 681 6 689
1974 1 728 681 169 925 294 67 434 1 831 466 102 785
1975 1 831 466 261 729 842 66 522 2 027 515 196 049
1976 2 027 515 209 181 - 311 71 595 2 164 790 137 275
1977 2 164 790 134 970 1 316 70 234 2 230 842 66 052
1978 2 230 842 157 213 97 65 939 2 322 213 91 371
1979 2 322 213 247 681 299 74 136 2 496 057 173 844
1980 2 496 057 66 784 - 936 70 041 2 491 864 - 4 193
1981 2 491 864 138 614 264 67 769 2 562 973 71 109
1982 2 562 973 95 498 2 069 69 490 2 591 050 28 077
1983 2 591 050 87 478 - 3 226 62 707 2 612 595 21 545
1984 2 612 595 275 000 79 014 2 808 581 195 986
1985 2 808 581 57 764 82 422 2 783 923 - 24 658
1986 2 783 923 38 554 76 967 2 745 510 - 38 413
1987 2 745 510 27 141 79 868 2 692 783 - 52 727
1988 2 692 783 78 870 101 108 2 670 545 - 22 238
1989 2 670 545 163 947 102 043 2 732 449 61 904
1990 2 732 449 99 637 106 696 2 725 390 - 7 059
1991 2 725 390 96 231 110 752 2 710 869 - 14 521
1992 2 710 869 79 685 119 000 2 671 554 - 39 315
1993 2 671 554 - 297 266 142 032 2 232 256 - 439 298
1994 2 232 256 - 188 609 145 661 1 897 986 - 334 270
1995 1 897 986 181 613 150 705 1 928 894 30 908
1996 1 928 894 70 649 158 380 1 841 163 - 87 731
1997 1 841 163 122 717 155 185 1 808 695 - 32 468
1998 1 808 695 103 675 164 819 1 747 551 - 61 144
1999 1 747 551 140 562 169 215 1 718 898 - 28 653
2000 1 718 898 136 443 172 422 1 682 919 - 35 979
January 2018

Table 2.8
MARKETABLE NATURAL GAS
REMAINING ESTABLISHED RESERVES IN CANADA
1955 - 2016
Million Cubic Metres at 101.325 kPa and 15°C
Remaining Net Change in Remaining Net Change
at Beginning Gross Underground Net at End in Reserves
Of Year Additions Storage Production of Year during Year
2001 1 682 919 192 260 181 427 1 693 752 10 833
2002 1 693 752 150 620 180 167 1 664 205 - 29 547
2003 1 664 205 100 765 170 969 1 594 001 - 70 204
2004 1 594 001 173 244 174 203 1 593 042 - 959
2005 1 593 042 214 954 175 436 1 632 560 39 518
2006 1 632 560 183 205 176 053 1 639 712 7 152
2007 1 639 712 168 974 174 862 1 633 824 - 5 888
2008 1 633 824 285 263 164 853 1 754 234 120 410
2009 1 754 234 129 614 156 398 1 727 450 - 26 784
Break in data series
2010 1 785 889 1 976 977 191 088
2011 1 976 977 1 920 518 - 61 985
2012 1 920 518 1 999 454 102 099
2013 1 999 454 2 027 703 28 249
2014 2 027 703 1 987 249 - 40 454
2015 1 987 249 2 118 080 130 832
2016 2 118 080 2 086 848 - 31 232
*Preliminary estimate. Corrections to previous year cumulative production included with gross additions.
Note: Effective 2010 CAPP Reserves are based on provincial and NEB data. Year ends vary.
January 2018

Table 2.9
MARKETABLE NATURAL GAS
REMAINING ESTABLISHED RESERVES IN CANADA
AT YEAR END
1962 - 2016
Million Cubic Metres at 101.325 kPa & 15°C
Mainland Territories Mackenzie Delta/ Arctic British Other Eastern Eastcoast
(S. 68° N) Beaufort Sea Isles Columbia Alberta Saskatchewan Ontario Canada* Offshore Canada
1962 2 407 165 684 791 990 22 831 - 5 683 988 595
1963 2 407 174 404 848 856 22 813 - 5 986 1 054 466
1964 2 407 224 655 1 028 177 24 196 4 481 42 1 283 958
1965 5 183 210 655 1 069 137 25 051 5 233 42 1 315 301
1966 7 797 230 813 1 124 191 26 299 5 712 56 1 394 868
1967 8 397 249 938 1 157 618 25 345 5 716 63 1 447 077
1968 8 538 249 700 1 254 752 24 569 6 570 56 1 544 185
1969 39 536 250 057 1 312 279 29 130 7 280 49 1 638 331
1970 39 552 287 025 1 352 610 28 955 8 637 42 1 716 821
1971 49 413 280 562 1 397 192 28 305 8 152 32 1 763 656
1972 49 145 267 060 1 369 171 29 284 7 287 45 1 721 992
1973 32 507 256 380 1 396 794 36 032 6 929 39 1 728 681
1974 161 242 221 436 1 406 558 35 393 6 805 32 1 831 466
1975 328 712 209 206 1 448 744 33 225 7 598 30 2 027 515
1976 473 990 201 553 1 448 836 31 959 8 408 44 2 164 790
1977 22 103 187 064 291 178 209 704 1 478 270 33 141 9 046 336 2 230 842
1978 16 863 185 880 306 617 218 365 1 549 716 35 333 9 106 333 2 322 213
1979 16 211 184 123 397 619 207 363 1 646 392 35 431 8 586 332 2 496 057
1980 15 102 184 123 380 551 208 694 1 661 442 33 651 7 975 326 2 491 864
1981 11 581 184 123 380 551 222 280 1 723 130 32 557 8 434 317 2 562 973
1982 11 412 212 810 380 551 220 588 1 728 364 28 282 8 815 228 2 591 050
1983 11 767 212 810 380 551 222 191 1 744 766 27 650 12 639 221 2 612 595
1984 11 580 245 010 389 390 223 996 1 898 815 26 962 12 698 130 2 808 581
1985 11 372 258 310 406 370 243 548 1 827 058 25 801 11 310 154 2 783 923
1986 11 636 258 310 406 370 240 307 1 749 997 61 305 17 444 141 2 745 510
1987 11 272 258 310 406 370 210 327 1 727 725 60 705 17 949 125 2 692 783
1988 11 205 280 130 406 370 210 094 1 688 054 56 283 18 311 98 2 670 545
1989 10 987 298 730 406 370 218 393 1 705 559 74 791 17 529 90 2 732 449
1990 10 913 298 730 406 370 223 638 1 689 884 78 880 16 903 72 2 725 390
1991 10 029 298 730 406 370 229 215 1 678 553 71 182 16 718 72 2 710 869
1992 9 883 298 730 406 370 247 335 1 621 875 70 409 16 881 71 2 671 554
1993 9 355 298 730 246 957 1 578 959 80 927 17 217 111 2 232 256
1994 9 297 242 227 1 547 635 85 301 13 415 111 1 897 986
1995 8 869 253 540 1 567 785 86 609 11 982 109 1 928 894
1996 9 583 253 502 1 483 710 81 805 12 454 109 1 841 163
1997 8 963 247 432 1 392 709 76 528 12 458 105 70 500 1 808 695
1998 8 523 238 599 1 346 172 71 471 12 181 105 70 500 1 747 551
1999 17 025 238 973 1 311 707 68 595 11 993 105 70 500 1 718 898
2000 16 079 249 479 1 262 949 75 633 11 591 105 67 083 1 682 919
2001 15 026 251 451 1 272 232 81 730 11 513 105 61 695 1 693 752
2002 12 656 254 661 1 252 562 76 649 11 419 105 56 153 1 664 205
2003 12 456 259 905 1 198 748 87 877 11 586 105 23 324 1 594 001
2004 11 872 289 432 1 175 892 85 007 11 456 105 19 278 1 593 042
2005 11 260 347 833 1 153 480 91 614 13 021 105 15 247 1 632 560
2006 10 241 367 653 1 131 234 98 829 20 006 105 11 644 1 639 712
2007 9 995 375 929 1 124 930 95 060 19 842 105 7 963 1 633 824
2008 10 089 483 051 1 138 557 88 621 19 637 105 14 174 1 754 234
2009 10 000 534 208 1 072 114 81 026 19 418 105 10 579 1 727 450
Break in Data Series
2010 13 006 782 049 1 092 700 58 315 19 208 3 900 7 800 1 976 977
2011 12 866 805 764 1 007 000 53 411 18 983 3 806 5 122 1 906 952
2012 12 736 948 690 972 400 52 105 6 721 3 713 3 089 1 999 454
2013 12 647 1 001 128 949 000 51 206 6 535 3 443 3 744 2 027 703
2014 12 561 997 487 913 100 51 602 6 385 3 415 2 573 1 987 123
2015 12 503 1 216 740 829 126 49 306 6 780 2 883 742 2 118 080
2016 12 448 1 258 977 758 438 46 723 6 677 2 843 742 2 086 848
* Note: Effective 2010 New Brunswick included. Prior years was "Other Eastern Canada"
Note: Effective 2010 CAPP Reserves are based on provincial and NEB data. Year ends vary.
January 2018

REMAINING ESTABLISHED RESERVES IN CANADA
2016
Thousand Cubic Metres
Remaining Remaining Net Change
Reserves at Reserves at in Reserves
Previous Year Current Year
ETHANE, PROPANE & BUTANES
Conventional Areas
British Columbia 93 900 102 200 8 300
Alberta 198 000 171 600 - 26 400
TOTAL LIQUIFIED PETROLEUM GASES 291 900 273 800 - 18 100
Note: Effective 2010 CAPP Reserves are based on provincial and NEB data. Year ends vary.
NATURAL GAS LIQUIDS
January 2018 Table 2.10

Table 2.10
NATURAL GAS LIQUIDS
REMAINING ESTABLISHED RESERVES IN CANADA
1952 - 2016
Thousand Cubic Metres
Remaining Remaining Net Change
at Beginning Gross Net at End in Reserves
of Year Additions Production* of Year during Year
1952 1 802 8 677 98 10 381 8 579
1953 10 381 21 279 198 31 462 21 081
1954 31 462 1 851 230 33 083 1 621
1955 33 083 6 535 381 39 237 6 154
1956 39 237 5 639 422 44 454 5 217
1957 44 454 18 698 480 62 672 18 218
1958 62 672 14 997 779 76 890 14 218
1959 76 890 3 911 1 060 79 741 2 851
1960 79 741 7 134 1 358 85 517 5 776
1961 85 517 8 080 2 182 91 415 5 898
1962 91 415 22 744 3 737 110 422 19 007
Break in Series
1963 130 962 4 160 4 345 130 777 - 185
1964 130 777 33 444 6 532 157 689 26 912
1965 157 689 8 333 7 555 158 467 778
1966 158 467 59 803 7 874 210 396 51 929
1967 210 396 13 331 9 001 214 726 4 330
1968 214 726 40 856 9 730 245 852 31 126
1969 245 852 41 834 10 530 277 156 31 304
1970 277 156 21 639 12 529 286 266 9 110
1971 286 266 - 14 008 13 454 258 804 - 27 462
1972 258 804 7 588 16 458 249 934 - 8 870
1973 249 934 5 648 17 767 237 815 - 12 119
1974 237 815 26 165 17 239 246 741 8 926
1975 246 741 11 850 16 862 241 729 - 5 012
1976 241 729 13 878 16 826 238 781 - 2 948
1977 238 781 6 669 17 940 227 510 - 11 271
1978 227 510 15 216 13 064 229 662 2 152
1979 229 662 - 9 231 13 393 207 038 - 22 624
1980 207 038 9 211 13 103 203 146 - 3 892
1981 203 146 2 816 12 169 193 793 - 9 353
1982 193 793 15 579 11 394 197 978 4 185
1983 197 978 15 252 10 453 202 777 4 799
1984 202 777 64 558 14 422 252 913 50 136
1985 252 913 82 748 14 904 320 757 67 844
1986 320 757 33 018 14 990 338 785 18 028
1987 338 785 23 795 14 465 348 115 9 330
1988 348 115 18 629 18 545 348 199 84
1989 348 199 38 609 19 509 367 299 19 100
1990 367 299 11 450 17 898 360 851 - 6 448
1991 360 851 41 412 19 135 383 128 22 277
1992 383 128 - 20 072 19 689 343 367 - 39 761
1993 343 367 18 166 23 401 338 132 - 5 235
1994 338 132 - 1 630 26 383 310 119 - 28 013
1995 310 119 33 722 27 300 316 541 6 422
1996 316 541 20 077 25 431 311 187 - 5 354
1997 311 187 23 546 33 600 301 133 - 10 054
1998 301 133 17 754 27 998 290 889 - 10 244
1999 290 889 5 739 26 670 269 958 - 20 931
2000 269 958 34 069 28 274 275 753 5 795
January 2018

Table 2.10
NATURAL GAS LIQUIDS
REMAINING ESTABLISHED RESERVES IN CANADA
1952 - 2016
Thousand Cubic Metres
Remaining Remaining Net Change
at Beginning Gross Net at End in Reserves
of Year Additions Production* of Year during Year
2001 275 753 9 761 26 298 259 216 - 16 537
2002 259 216 14 940 26 824 247 332 - 11 884
2003 247 332 - 20 690 26 646 199 996 - 47 336
2004 199 996 24 798 28 425 196 369 - 3 627
2005 196 369 29 474 30 055 195 788 - 581
2006 195 788 36 891 30 096 202 583 6 795
2007 202 583 13 519 29 101 187 001 - 15 582
2008 187 001 40 870 27 609 200 262 13 261
2009 200 262 23 187 27 362 196 087 - 4 175
Break in data series
2010 246 500 241 500 - 5 000
2011 241 500 236 900 - 3 000
2012 238 500 250 400 11 900
2013 250 400 265 000 14 600
2014 265 000 283 000 18 000
2015 283 000 291 900 8 900
2016 291 900 273 800 - 18 100
*Preliminary estimate. Corrections to previous year cumulative production included with gross additions.
Note: Effective 2010 CAPP Reserves are based on provincial and NEB data. Year ends vary.
January 2018
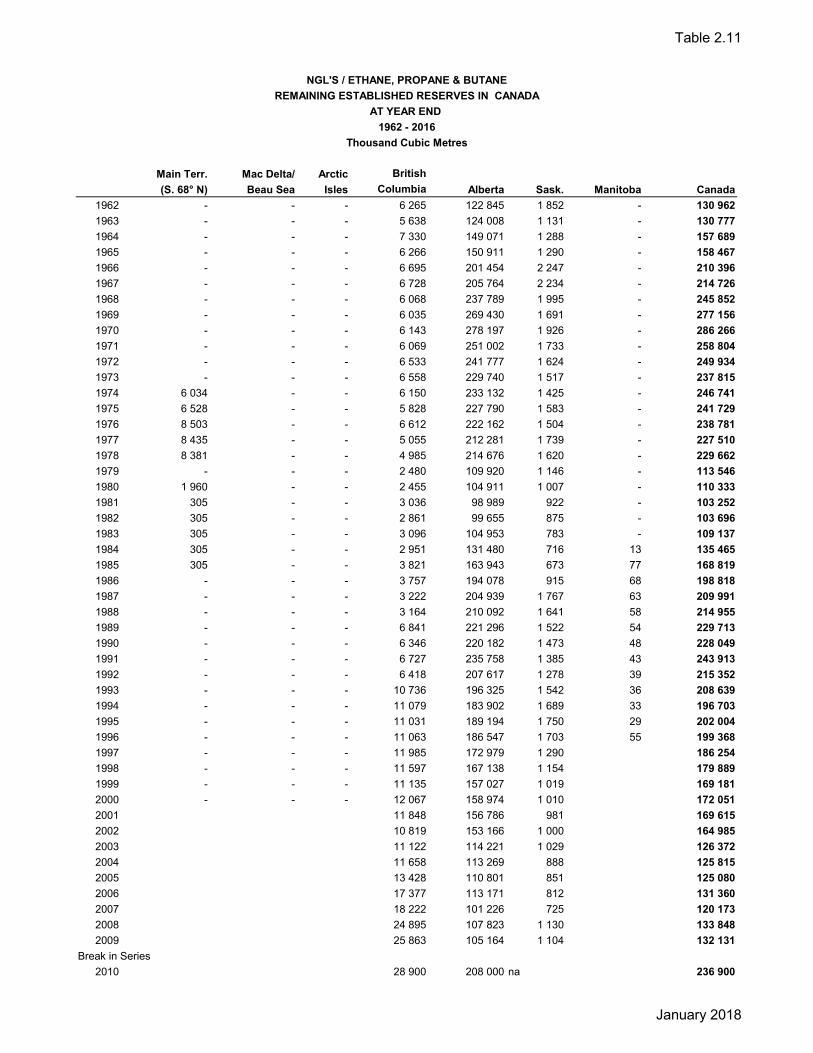
Table 2.11
NGL'S / ETHANE, PROPANE & BUTANE
REMAINING ESTABLISHED RESERVES IN CANADA
AT YEAR END
1962 - 2016
Thousand Cubic Metres
Main Terr. Mac Delta/ Arctic British
(S. 68° N) Beau Sea Isles Columbia Alberta Sask. Manitoba Canada
1962 - - - 6 265 122 845 1 852 - 130 962
1963 - - - 5 638 124 008 1 131 - 130 777
1964 - - - 7 330 149 071 1 288 - 157 689
1965 - - - 6 266 150 911 1 290 - 158 467
1966 - - - 6 695 201 454 2 247 - 210 396
1967 - - - 6 728 205 764 2 234 - 214 726
1968 - - - 6 068 237 789 1 995 - 245 852
1969 - - - 6 035 269 430 1 691 - 277 156
1970 - - - 6 143 278 197 1 926 - 286 266
1971 - - - 6 069 251 002 1 733 - 258 804
1972 - - - 6 533 241 777 1 624 - 249 934
1973 - - - 6 558 229 740 1 517 - 237 815
1974 6 034 - - 6 150 233 132 1 425 - 246 741
1975 6 528 - - 5 828 227 790 1 583 - 241 729
1976 8 503 - - 6 612 222 162 1 504 - 238 781
1977 8 435 - - 5 055 212 281 1 739 - 227 510
1978 8 381 - - 4 985 214 676 1 620 - 229 662
1979 - - - 2 480 109 920 1 146 - 113 546
1980 1 960 - - 2 455 104 911 1 007 - 110 333
1981 305 - - 3 036 98 989 922 - 103 252
1982 305 - - 2 861 99 655 875 - 103 696
1983 305 - - 3 096 104 953 783 - 109 137
1984 305 - - 2 951 131 480 716 13 135 465
1985 305 - - 3 821 163 943 673 77 168 819
1986 - - - 3 757 194 078 915 68 198 818
1987 - - - 3 222 204 939 1 767 63 209 991
1988 - - - 3 164 210 092 1 641 58 214 955
1989 - - - 6 841 221 296 1 522 54 229 713
1990 - - - 6 346 220 182 1 473 48 228 049
1991 - - - 6 727 235 758 1 385 43 243 913
1992 - - - 6 418 207 617 1 278 39 215 352
1993 - - - 10 736 196 325 1 542 36 208 639
1994 - - - 11 079 183 902 1 689 33 196 703
1995 - - - 11 031 189 194 1 750 29 202 004
1996 - - - 11 063 186 547 1 703 55 199 368
1997 - - - 11 985 172 979 1 290 186 254
1998 - - - 11 597 167 138 1 154 179 889
1999 - - - 11 135 157 027 1 019 169 181
2000 - - - 12 067 158 974 1 010 172 051
2001 11 848 156 786 981 169 615
2002 10 819 153 166 1 000 164 985
2003 11 122 114 221 1 029 126 372
2004 11 658 113 269 888 125 815
2005 13 428 110 801 851 125 080
2006 17 377 113 171 812 131 360
2007 18 222 101 226 725 120 173
2008 24 895 107 823 1 130 133 848
2009 25 863 105 164 1 104 132 131
Break in Series
2010 28 900 208 000 na 236 900
January 2018

Table 2.11
NGL'S / ETHANE, PROPANE & BUTANE
REMAINING ESTABLISHED RESERVES IN CANADA
AT YEAR END
1962 - 2016
Thousand Cubic Metres
Main Terr. Mac Delta/ Arctic British
(S. 68° N) Beau Sea Isles Columbia Alberta Sask. Manitoba Canada
2011 30 500 208 000 na 238 500
2012 44 000 206 400 na 250 400
2013 53 600 211 400 na 265 000
2014 77 800 205 200 na 283 000
2015 93 900 198 000 na 291 900
2016 102 200 171 600 na 273 800
Note: Prior to 1979, LPG & Pentanes Plus combined into NGL
Note: Effective 2010 CAPP Reserves are based on provincial and NEB data. Year ends vary.
January 2018

Table 2.12
Thousand Cubic Metres
Main Terr. Mac Delta/ Arctic British E. Coast
(S. 68° N) Beau Sea Isles Columbia Alberta Saskatchewan Manitoba Offshore Canada
1979 0 8 302 - 2 416 82 424 350 0 0 93 492
1980 195 8 302 4 732 2 431 76 848 305 0 0 92 813
1981 195 8 302 4 732 2 961 74 078 273 0 0 90 541
1982 195 9 552 4 732 2 918 76 639 246 0 0 94 282
1983 195 9 552 4 732 3 155 75 761 245 0 0 93 640
1984 195 10 666 6 647 3 114 96 552 267 0 0 117 441
1985 195 11 206 6 617 4 448 129 187 252 33 0 151 938
1986 2 067 11 206 6 617 4 399 115 405 240 33 0 139 967
1987 752 11 206 6 617 3 891 115 056 572 30 0 138 124
1988 708 12 203 6 617 3 811 109 343 534 28 0 133 244
1989 357 11 671 6 617 4 260 114 157 498 26 0 137 586
1990 327 11 671 6 617 4 024 109 636 503 24 0 132 802
1991 866 11 671 6 617 4 681 114 881 477 22 0 139 215
1992 796 11 671 6 617 4 685 103 779 446 21 0 128 015
1993 725 11 671 0 5 618 110 966 493 20 0 129 493
1994 2 685 0 0 5 640 104 554 518 19 0 113 416
1995 2 560 0 0 5 737 105 818 405 17 0 114 537
1996 5 466 0 0 5 840 100 094 383 36 0 111 819
1997 5 277 0 0 5 734 92 742 342 0 10 784 114 879
1998 5 208 0 0 5 546 89 134 328 0 10 784 111 000
1999 3 360 0 0 5 198 81 148 287 0 10 784 100 777
2000 2 974 0 0 5 477 84 279 280 0 10 692 103 702
2001 2 910 0 0 5 676 70 194 265 0 10 556 89 601
2002 2 848 0 0 5 896 62 900 295 0 10 408 82 347
2003 2 789 0 0 5 874 56 865 295 0 7 801 73 624
2004 2 731 0 0 6 477 53 536 262 0 7 548 70 554
2005 2 676 0 0 6 640 53 782 247 0 7 363 70 708
2006 2 616 0 0 8 220 52 984 237 0 7 166 71 223
2007 2 559 0 0 7 230 49 893 203 0 6 943 66 828
2008 2 501 0 0 9 460 48 627 372 0 5 454 66 414
2009 2 441 0 0 9 959 46 510 361 0 4 685 63 956
Break in Data Series
2010 na na na 11 100 48 700 na na 4 268 64 068
2011 na na na 11 300 46 500 na na 4 268 62 068
2012 na na na 16 200 45 500 na na 4 268 65 968
2013 na na na 20 800 44 900 na na 4 268 69 968
2014 na na na 29 700 42 700 na na 4 268 76 668
2015 na na na 30 900 40 700 na na 4 268 75 868
2016 na na na 32 900 35 300 na na 4 268 72 468
Note: Prior to 1979, LPG & Pentanes Plus combined into NGL on Table 2.15
Note: Effective 2010 CAPP Reserves are based on provincial and NEB data. Year ends vary.
PENTANES PLUS
REMAINING ESTABLISHED RESERVES IN CANADA
AT YEAR END
1979 - 2016
January 2018

REMAINING ESTABLISHED RESERVES IN CANADA
Remaining Remaining Net Change
Reserves at Reserves at in Reserves
Previous Year Current Year
RECOVERABLE FROM
NATURAL GAS RESERVES
British Columbia 14 400 13 900 - 500
Alberta 17 276 15 900 -1 376
Total 31 676 29 800 -1 876
RECOVERABLE FROM
DEVELOPED OIL SANDS MINING
CRUDE OIL RESERVES
Alberta 93 800 92 100 -1 700
Total 125 476 121 900 -3 576
Note: Effective 2010 CAPP Reserves are based on provincial and NEB data. Year ends vary.
SULPHUR
Thousand Tonnes
2016
January 2018 Table 2.13

Table 2.13
Remaining Remaining Net Change
at Beginning Gross Net at End in Reserves From Developed
of Year Additions Production of Year during Year Mining Reserves
1959 47 489 4 402 277 51 614 4 125
1960 51 614 4 842 442 56 014 4 400
1961 56 014 3 383 517 58 880 2 866
1962 58 880 -952 1 043 56 885 -1 995
Break in Series
1963 62 286 2 767 1 259 63 794 1 508
1964 63 794 27 077 1 502 89 369 25 575
1965 89 369 -3 118 1 562 84 689 -4 680
1966 84 689 21 504 1 701 104 492 19 803
1967 104 492 7 816 2 128 110 180 5 688
1968 110 180 19 505 2 978 126 707 16 527 41 470
1969 126 707 17 789 3 592 140 904 14 197 41 422
1970 140 904 31 695 4 195 168 404 27 500 41 374
1971 168 404 5 139 4 376 169 167 763 41 323
1972 169 167 4 116 5 072 168 211 -956 41 232
1973 168 211 -3 260 6 424 158 527 -9 684 41 127
1974 158 527 -16 170 6 775 135 582 -22 945 41 030
1975 135 582 -14 728 6 242 114 612 -20 970 9 448
1976 114 612 5 087 6 381 113 318 -1 294 9 294
1977 113 318 13 051 6 329 120 040 6 722 9 247
1978 120 040 4 696 5 275 119 461 -579 9 129
1979 119 461 -4 223 5 795 109 443 -10 018 8 760
1980 109 443 -727 5 487 103 229 -6 214 8 471
1981 103 229 -1 187 4 987 97 055 -6 174 8 225
1982 97 055 1 243 4 742 93 556 -3 499 7 966
1983 93 556 1 607 3 746 91 417 -2 139 7 635
1984 91 417 3 520 5 257 89 680 -1 737 9 417
1985 89 680 10 136 5 202 94 614 4 934 9 025
1986 94 614 -3 305 5 161 86 148 -8 466 10 601
1987 86 148 21 485 5 269 102 364 16 216 10 665
1988 102 364 8 460 8 021 102 803 439 12 041
1989 102 803 5 055 5 005 102 853 50 13 350
1990 102 853 7 275 5 137 104 991 2 138 12 849
1991 104 991 2 238 5 489 101 740 -3 251 13 499
1992 101 740 6 895 5 771 102 864 1 124 12 920
1993 102 864 -2 906 6 069 93 889 -8 975 12 321
1994 93 889 11 468 6 944 98 413 4 524 13 091
1995 98 413 2 057 6 871 93 599 -4 814 17 124
1996 93 599 2 281 7 463 88 417 -5 182 16 467
1997 88 417 -1 189 7 202 80 026 -8 391 15 782
1998 80 026 4 346 7 787 76 585 -3 441 18 711
1999 76 585 5 261 8 367 73 479 -3 106 37 245
2000 73 479 9 457 7 640 75 296 1 817 37 307
2001 75 296 -1 545 7 145 66 606 -8 690 36 705
2002 66 606 -2 462 6 945 57 199 -9 407 37 580
2003 57 199 5 690 6 431 56 458 -741 38 464
2004 56 458 6 172 6 388 56 242 -216 39 020
2005 56 242 4 940 6 024 55 158 -1 084 38 183
2006 55 158 -290 6 103 48 765 -6 393 44 773
2007 48 765 7 737 5 596 50 906 2 141 43 251
2008 50 906 -2 393 5 014 43 499 -7 407 41 834
SULPHUR
REMAINING ESTABLISHED RESERVES IN CANADA
1960 - 2016
Thousand Tonnes
January 2018

Table 2.13
Remaining Remaining Net Change
at Beginning Gross Net at End in Reserves From Developed
of Year Additions Production of Year during Year Mining Reserves
SULPHUR
REMAINING ESTABLISHED RESERVES IN CANADA
1960 - 2016
Thousand Tonnes
2009 43 499 2 653 4 373 41 779 -1 720 40 952
Break in data series
2010 40 400 - - 36 900 -3 500 154 000
2011 36 900 - - 34 600 -2 300 152 200
2012 34 600 - - 36 500 1 900 100 100
2013 36 500 - - 37 100 600 98 000
2014 37 100 - - 33 100 -4 000 95 900
2015 33 100 - - 31 676 -1 424 93 800
2016 31 676 - - 29 800 -1 876 92 100
*Preliminary estimate. Corrections to previous year cumulative production included with gross additions.
Note: Sulphur recoverable from natural gas reserves only.
Note: Effective 2010 CAPP Reserves are based on provincial and NEB data. Year ends vary.
January 2018

Table 2.14
SULPHUR
REMAINING ESTABLISHED RESERVES IN CANADA
AT YEAR END
1962 - 2016
Thousand Tonnes
British Columbia Alberta Saskatchewan
From Natural Gas
Reserves
From Developed
Mining Reserves TOTAL CANADA
1962 2 533 59 737 16 62 286 - 62 286
1963 2 721 61 057 16 63 794 - 63 794
1964 3 226 86 129 14 89 369 - 89 369
1965 2 765 81 911 14 84 690 - 84 690
1966 3 164 101 322 6 104 492 - 104 492
1967 3 018 107 156 6 110 180 - 110 180
1968 3 136 123 564 7 126 707 41 470 168 177
1969 2 770 138 113 21 140 904 41 422 182 326
1970 2 644 165 738 22 168 404 41 374 209 778
1971 2 734 166 410 23 169 167 41 323 210 490
1972 2 393 165 794 24 168 211 41 232 209 443
1973 2 293 156 202 32 158 527 41 127 199 654
1974 2 161 133 402 19 135 582 41 030 176 612
1975 2 151 112 431 30 114 612 9 448 124 060
1976 2 303 110 985 30 113 318 9 294 122 612
1977 11 491 108 521 28 120 040 9 247 129 287
1978 11 973 107 462 26 119 461 9 129 128 590
1979 6 711 102 707 25 109 443 8 760 118 203
1980 6 587 96 617 25 103 229 8 471 111 700
1981 6 191 90 840 24 97 055 8 225 105 280
1982 5 924 87 632 - 93 556 7 966 101 522
1983 8 070 83 347 - 91 417 7 635 99 052
1984 8 433 81 247 - 89 680 9 417 99 097
1985 11 264 83 350 - 94 614 9 025 103 639
1986 10 930 75 218 - 86 148 10 601 96 749
1987 8 399 93 965 - 102 364 10 665 113 029
1988 9 069 93 734 - 102 803 12 041 114 844
1989 8 768 94 085 - 102 853 13 350 116 203
1990 9 143 95 848 - 104 991 12 849 117 840
1991 8 840 92 900 - 101 740 13 499 115 239
1992 14 521 88 343 - 102 864 12 920 115 784
1993 15 496 78 393 - 93 889 12 321 106 210
1994 15 431 82 982 - 98 413 13 091 111 504
1995 14 789 78 810 - 93 599 17 124 110 723
1996 14 994 73 423 - 88 417 16 467 104 884
1997 13 507 66 519 - 80 026 15 782 95 808
1998 13 089 63 496 - 76 585 18 711 95 296
1999 13 498 59 981 - 73 479 37 245 110 724
2000 13 288 62 008 - 75 296 37 307 112 603
2001 13 542 53 064 - 66 606 36 705 103 311
2002 13 735 43 464 - 57 199 37 580 94 779
2003 13 838 42 620 - 56 458 38 464 94 922
2004 13 780 42 462 - 56 242 39 020 95 262
2005 14 033 41 125 - 55 158 38 183 93 341
2006 13 630 35 135 - 48 765 44 773 93 538
2007 14 641 36 265 - 50 906 43 251 94 157
2008 13 805 29 694 - 43 499 41 834 85 333
2009 14 368 27 411 - 41 779 40 952 82 731
Break in Data Series
2010 14 400 22 500 - 36 900 154 000 190 900
2011 13 700 20 900 - 34 600 152 200 186 800
2012 15 700 20 800 - 36 500 100 100 136 600
2013 17 700 19 400 - 37 100 98 000 135 100
2014 14 800 18 300 - 33 100 95 900 129 000
2015 14 400 17 276 - 31 676 93 800 125 476
2016 13 900 15 900 - 29 800 92 100 121 900
Note: New procedure adopted for estimating oil sands reserves commencing with the 1975, 1984 and 1986 report.
Note: Effective 2010 CAPP Reserves are based on provincial and NEB data. Year ends vary.
January 2018


CAPP Statistical Handbook
Section 3
Production Table # Canadian Crude Oil Production 1947 – Present ...................................................................................................................................... 3.1 Canadian Synthetic & Other Crude Oil Production 1967 - Present ....................................................................................................................................... 3.2 Canadian Condensate Production 1950 – Present ...................................................................................................................................... 3.3 Canadian Pentanes Plus Production 1947 – Present ...................................................................................................................................... 3.4 Canadian Propane Production 1948 – Present ...................................................................................................................................... 3.5 Canadian Butanes Production 1950 – Present ...................................................................................................................................... 3.6 Canadian Liquid Hydrocarbon Production 1947 – Present ...................................................................................................................................... 3.7 Canadian Crude Oil Production by Major Fields and in Order of Cumulative Output Current Year .......................................................................................................................................... 3.8 Canadian Natural Gas Production (Raw) 1947 – Present ...................................................................................................................................... 3.9 Canadian Marketed Gas Production 1947 – Present ...................................................................................................................................... 3.10 Canadian Sulphur Production 1952 – Present ...................................................................................................................................... 3.11 Canadian Sulphur Sales 1952 – Present ...................................................................................................................................... 3.12 Canadian Sulphur Inventory 1952 – Present ...................................................................................................................................... 3.13

CAPP Statistical Handbook
Canadian Ethane Production 1974 - Present ....................................................................................................................................... 3.14 Canadian Crude Oil & Equivalent Productive Capacity 1947 - Present ....................................................................................................................................... 3.15 Canadian Crude Oil & Equivalent Production by Type 1971 - Present ....................................................................................................................................... 3.16 Operated Oil Wells in Western Canada 1956 - Present ....................................................................................................................................... 3.17 Operated Gas Wells in Western Canada 1956 - Present ....................................................................................................................................... 3.18

CANADIAN CRUDE OIL PRODUCTION
1947 - 2016
Cubic Metres
Northwest British Western New Eastcoast Eastern
Territories Columbia Alberta Saskatchewan Manitoba Canada Ontario Brunswick Offshore Canada Canada
Pre 1947 354,677 - 12,044,374 24,376 - 12,423,427 4,920,550 66,262 4,986,812 17,410,239
1947 36,842 - 1,014,174 82,808 - 1,133,824 20,864 3,631 24,495 1,158,319
1948 55,605 - 1,669,338 133,946 - 1,858,889 28,125 3,396 31,521 1,890,410
1949 29,046 - 3,141,308 123,977 - 3,294,331 41,423 3,106 44,529 3,338,860
1950 30,109 - 4,314,306 165,190 - 4,509,605 39,832 2,683 42,515 4,552,120
1951 36,164 - 7,283,821 198,224 1,854 7,520,063 31,332 2,402 33,734 7,553,797
1952 49,932 - 9,349,732 269,662 17,022 9,686,348 30,481 2,335 32,816 9,719,164
1953 50,325 - 12,188,729 443,593 104,192 12,786,839 47,623 2,342 49,965 12,836,804
1954 58,779 - 13,919,414 861,753 341,410 15,181,356 65,546 2,074 67,620 15,248,976
1955 64,393 92 17,933,491 1,798,411 658,802 20,455,189 83,509 1,986 85,495 20,540,684
1956 71,416 23,591 22,832,519 3,349,441 919,730 27,196,697 94,293 3,357 97,650 27,294,347
1957 66,876 54,875 21,733,557 5,857,596 967,721 28,680,625 99,107 3,083 102,190 28,782,815
1958 70,773 81,635 17,872,829 7,091,503 926,322 26,043,062 123,686 2,414 126,100 26,169,162
1959 67,043 137,417 20,467,870 7,538,752 803,461 29,014,543 159,161 2,301 161,462 29,176,005
1960 72,343 137,914 20,753,825 8,248,768 757,054 29,969,904 159,709 2,248 161,957 30,131,861
1961 81,804 161,384 25,050,700 8,876,729 711,972 34,882,589 182,601 1,910 184,511 35,067,100
1962 95,042 1,415,084 26,249,871 10,238,954 623,989 38,622,940 180,289 1,642 181,931 38,804,871
1963 97,025 1,988,780 26,803,561 11,330,902 599,276 40,819,544 191,546 1,173 192,719 41,012,263
1964 91,813 1,831,513 27,868,136 12,935,978 701,923 43,429,363 198,110 745 198,855 43,628,218
1965 102,497 2,140,638 29,199,091 13,950,524 786,050 46,178,800 203,272 652 203,924 46,382,724
1966 115,949 2,643,973 32,179,289 14,813,291 831,248 50,583,750 210,362 1,089 211,451 50,795,201
1967 112,911 3,123,662 36,677,699 14,705,385 887,572 55,507,229 197,096 1,404 198,500 55,705,729
1968 119,753 3,520,072 39,972,539 14,602,120 986,024 59,200,508 182,870 1,215 184,085 59,384,593
1969 127,341 4,021,859 45,553,900 13,889,741 985,981 64,578,822 184,636 1,140 185,776 64,764,598
1970 134,438 4,025,754 52,399,500 14,220,317 939,175 71,719,184 166,612 1,537 168,149 71,887,333
1971 149,240 3,997,242 56,779,900 14,062,694 890,622 75,879,698 152,252 1,525 153,777 76,033,475
1972 141,456 3,787,007 67,508,300 13,767,933 835,380 86,040,076 139,540 1,385 140,925 86,181,001
1973 152,988 3,367,264 83,012,600 13,625,605 807,882 100,966,339 128,565 1,576 130,141 101,096,480
1974 158,806 2,994,500 79,108,300 11,725,945 754,667 94,742,218 116,708 1,262 117,970 94,860,188
1975 159,874 2,268,795 67,511,900 9,379,084 701,459 80,021,112 111,978 1,062 113,040 80,134,152
1976 142,416 2,366,299 60,908,200 8,885,931 633,322 72,936,168 99,812 865 100,677 73,036,845
1977 137,520 2,199,233 60,514,100 9,763,272 630,466 73,244,591 98,372 794 99,166 73,343,757
1978 145,649 2,003,724 60,015,300 9,624,550 598,354 72,387,577 95,144 636 95,780 72,483,357
1979 149,915 2,139,963 68,515,800 9,371,831 583,377 80,760,886 91,984 571 92,555 80,853,441
1980 160,542 2,002,128 63,200,800 9,330,839 563,482 75,257,791 93,882 475 94,357 75,352,148
1981 173,367 2,032,308 56,978,500 7,392,727 542,695 67,119,597 89,983 321 90,304 67,209,901
1982 173,294 2,076,533 54,383,700 8,104,366 582,223 65,320,116 85,638 103 85,741 65,405,857
1983 169,430 2,078,771 55,317,100 9,543,275 736,934 67,845,510 83,600 100 83,700 67,929,210
1984 174,724 2,094,156 59,886,000 10,812,499 793,284 73,760,663 90,500 100 90,600 73,851,263
1985 1,099,000 1,958,194 56,994,700 11,616,186 820,729 72,488,809 112,300 100 112,400 72,601,209
1986 1,527,700 2,019,450 53,081,700 11,690,644 823,322 69,142,816 135,500 100 135,600 69,278,416
1987 1,567,000 2,083,471 55,170,300 12,037,145 781,806 71,639,722 133,000 495 133,495 71,773,217
1988 1,803,000 1,882,038 57,652,600 12,249,366 768,563 74,355,567 190,570 367 190,937 74,546,504
1989 1,876,000 1,888,438 54,604,600 11,626,032 722,820 70,717,890 243,676 - 243,676 70,961,566
May 2016 Table 3.1

CANADIAN CRUDE OIL PRODUCTION
1947 - 2016
Cubic Metres
Northwest British Western New Eastcoast Eastern
Territories Columbia Alberta Saskatchewan Manitoba Canada Ontario Brunswick Offshore Canada Canada
1990 1,865,037 1,926,023 52,972,800 12,249,177 737,762 69,750,799 247,200 - 247,200 69,997,999
1991 1,926,500 2,012,833 52,089,500 12,420,084 712,792 69,161,709 235,249 - 235,249 69,396,958
1992 1,899,000 2,033,394 53,172,700 13,369,511 656,415 71,131,020 224,300 - 576,511 800,811 71,931,831
1993 1,846,408 1,995,703 54,547,500 14,972,109 634,561 73,996,281 253,400 - 1,015,676 1,269,076 75,265,357
1994 1,783,768 1,966,577 55,197,000 17,184,047 657,870 76,789,262 263,100 - 1,313,345 1,576,445 78,365,707
1995 1,734,561 2,021,484 55,395,000 18,674,847 642,650 78,468,542 284,763 - 1,241,125 1,525,888 79,994,430
1996 1,672,000 2,280,892 54,774,900 20,934,161 613,114 80,275,067 267,799 - 1,034,311 1,302,110 81,577,177
1997 1,584,630 2,540,059 52,818,300 23,455,404 636,681 81,035,074 220,475 - 772,904 993,379 82,028,453
1998 1,561,734 2,699,083 49,774,200 23,150,915 634,071 77,820,003 218,600 - 4,738,885 4,957,485 82,777,488
1999 1,549,052 2,361,149 45,541,700 21,708,701 581,206 71,741,808 238,300 - 6,141,128 6,379,428 78,121,236
2000 1,434,274 2,577,200 43,503,800 24,245,085 621,378 72,381,737 231,200 - 8,394,275 8,625,475 81,007,212
2001 1,432,198 2,573,005 41,735,200 24,750,931 642,908 71,134,242 247,500 - 8,631,181 8,878,681 80,012,923
2002 1,376,500 2,409,095 38,331,800 24,415,887 650,750 67,184,032 218,000 - 16,587,721 16,805,721 83,989,753
2003 1,283,130 2,486,413 36,506,445 24,332,312 632,770 65,241,070 197,800 - 19,549,577 19,747,377 84,988,447
2004 1,235,280 2,254,412 34,893,117 24,584,203 637,498 63,604,510 153,048 - 18,248,635 18,401,683 82,006,193
2005 1,089,849 1,938,700 33,143,639 24,300,749 806,137 61,279,074 137,582 - 17,690,412 17,827,994 79,107,068
2006 1,082,727 1,670,600 31,503,390 24,838,452 1,100,800 60,195,969 124,657 - 17,621,414 17,746,071 77,942,040
2007 1,016,900 1,529,200 30,424,500 24,822,600 1,289,100 59,082,300 109,400 1,246 21,380,600 21,491,246 80,573,546
2008 941,600 1,345,682 29,254,409 25,488,844 1,371,771 58,402,306 98,400 1,501 19,912,406 20,012,307 78,414,613
2009 901,253 1,273,983 26,738,848 24,512,955 1,520,424 54,947,462 88,044 2,328 15,529,748 15,620,120 70,567,582
2010 872,226 1,264,202 26,629,302 24,420,742 1,873,445 55,059,916 83,779 1,941 16,008,588 16,094,308 71,154,224
2011 608,638 1,180,347 28,427,741 24,980,489 2,396,724 57,593,939 78,987 5,154 15,464,721 15,548,862 73,142,801
2012 756,767 1,217,220 32,343,676 27,318,066 3,057,838 64,693,568 81,000 4,260 11,475,882 11,561,142 76,254,710
2013 653,670 1,145,635 33,767,911 28,198,231 2,949,397 66,714,844 70,187 3,088 13,288,938 13,362,213 80,077,056
2014 641,395 1,245,566 34,195,897 29,817,376 2,852,992 68,753,226 68,212 2,471 12,536,283 12,606,966 81,360,192
2015 578,092 1,213,312 30,755,211 28,175,271 2,679,158 63,401,045 55,457 2,006 9,964,256 10,021,719 73,422,764
2016 521,992 1,342,518 25,824,858 26,697,329 2,333,799 56,720,496 52,648 306 12,201,417 12,254,371 68,974,867
Total 46,103,999 121,052,044 2,783,881,317 984,380,342 61,046,176 3,996,463,877 14,684,726 152,265 271,319,939 286,156,930 4,282,620,807
NOTE: Effective 1985, Alberta experimental crude included with the above. Excludes synthetic crude oil.
May 2016 Table 3.1
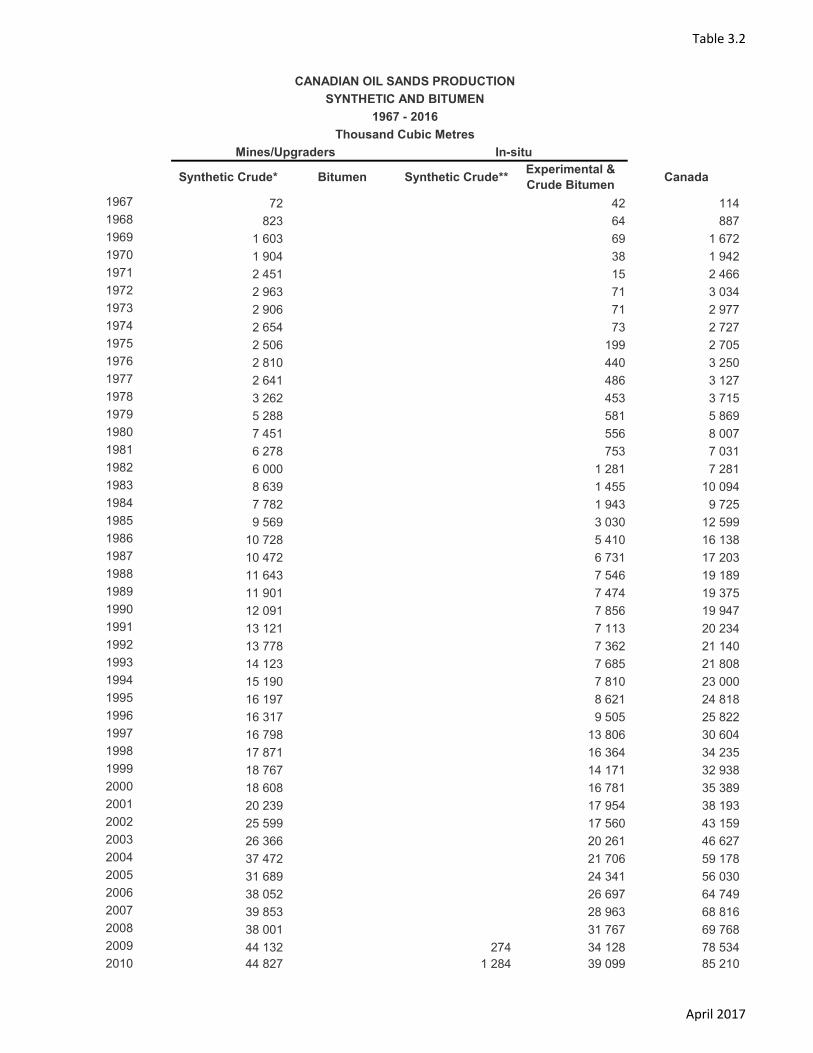
Table 3.2
CANADIAN OIL SANDS PRODUCTION
SYNTHETIC AND BITUMEN
1967 - 2016
Thousand Cubic Metres
Mines/Upgraders In-situ
Synthetic Crude* Bitumen Synthetic Crude**Experimental &
Crude Bitumen Canada
1967 72 42 114
1968 823 64 887
1969 1 603 69 1 672
1970 1 904 38 1 942
1971 2 451 15 2 466
1972 2 963 71 3 034
1973 2 906 71 2 977
1974 2 654 73 2 727
1975 2 506 199 2 705
1976 2 810 440 3 250
1977 2 641 486 3 127
1978 3 262 453 3 715
1979 5 288 581 5 869
1980 7 451 556 8 007
1981 6 278 753 7 031
1982 6 000 1 281 7 281
1983 8 639 1 455 10 094
1984 7 782 1 943 9 725
1985 9 569 3 030 12 599
1986 10 728 5 410 16 138
1987 10 472 6 731 17 203
1988 11 643 7 546 19 189
1989 11 901 7 474 19 375
1990 12 091 7 856 19 947
1991 13 121 7 113 20 234
1992 13 778 7 362 21 140
1993 14 123 7 685 21 808
1994 15 190 7 810 23 000
1995 16 197 8 621 24 818
1996 16 317 9 505 25 822
1997 16 798 13 806 30 604
1998 17 871 16 364 34 235
1999 18 767 14 171 32 938
2000 18 608 16 781 35 389
2001 20 239 17 954 38 193
2002 25 599 17 560 43 159
2003 26 366 20 261 46 627
2004 37 472 21 706 59 178
2005 31 689 24 341 56 030
2006 38 052 26 697 64 749
2007 39 853 28 963 68 816
2008 38 001 31 767 69 768
2009 44 132 274 34 128 78 534
2010 44 827 1 284 39 099 85 210
April 2017

Table 3.2
CANADIAN OIL SANDS PRODUCTION
SYNTHETIC AND BITUMEN
1967 - 2016
Thousand Cubic Metres
Mines/Upgraders In-situ
Synthetic Crude* Bitumen Synthetic Crude**Experimental &
Crude Bitumen Canada
2011 48 293 1 749 43 798 93 840
2012 50 721 1 734 51 047 103 502
2013 52 277 1 449 2 029 56 742 112 497
2014 53 142 4 619 2 222 65 313 125 296
2015 54 878 9 733 1 756 70 987 137 354
2016 54 003 10 784 69 75 415 140 271
Total 954 751 26 585 11 116 781 633 1 774 085
Effective 1985, experimental crude production is included with the conventional on Table 3.1
* From upgraders integrated with mining projects
** From upgraders integrated with in situ projects
April 2017

Table 3.3
British Columbia Alberta Manitoba Canada
Pre 1950 1 396 562 1 396 562
1951 12 595 12 595
1952 12 558 12 558
1953 18 166 18 166
1954 6 996 6 996
1955 28 908 28 908
1956 36 174 36 174
1957 115 037 115 037
1958 126 743 126 743
1959 184 631 184 631
1960 353 394 353 394
1961 25 476 284 476 309
1962 1 529 1 055 724 1 057 253
1963 2 172 544 488 546 660
1964 4 190 152 503 156 693
1965 5 050 92 734 97 784
1966 6 288 118 817 125 105
1967 6 447 120 613 127 060
1968 8 607 126 969 135 576
1969 12 418 107 400 119 818
1970 17 044 111 600 128 644
1971 17 322 121 500 138 822
1972 16 611 145 200 161 811
1973 20 104 158 700 178 804
1974 16 553 119 400 135 953
1975 16 086 113 800 129 886
1976 18 300 115 200 133 500
1977 24 453 121 900 146 353
1978 25 373 122 300 147 673
1979 32 549 134 200 166 749
1980 36 855 111 300 148 155
1981 28 525 95 100 123 625
1982 20 361 104 400 124 761
1983 17 636 98 000 115 636
1984 14 102 133 900 148 002
1985 12 096 151 900 2 920 166 916
1986 17 480 103 000 730 121 210
1987 25 879 86 800 2 200 114 879
1988 28 538 117 200 607 146 345
1989 27 868 161 700 1 920 191 488
CANADIAN CONDENSATE PRODUCTION
1950 - 2016
Cubic Metres
April 2017

Table 3.3
British Columbia Alberta Manitoba Canada
CANADIAN CONDENSATE PRODUCTION
1950 - 2016
Cubic Metres
1990 24 794 128 100 2 259 155 153
1991 23 858 158 700 1 500 184 058
1992 20 539 194 500 1 400 216 439
1993 40 728 228 300 1 100 270 128
1994 40 134 272 400 1 200 313 734
1995 58 232 292 800 1 200 352 232
1996 77 563 337 900 300 415 763
1997 73 170 382 800 455 970
1998 115 393 393 400 508 793
1999 85 000 418 500 503 500
2000 107 400 451 800 559 200
2001 107 209 464 200 571 409
2002 126 794 449 600 576 394
2003 147 550 480 721 628 271
2004 168 761 500 360 669 121
2005 188 045 563 106 751 150
2006 224 067 639 831 863 898
2007 238 140 762 327 1 000 467
2008 272 835 879 745 1 152 580
2009 277 879 793 311 1 071 190
2010 280 606 705 244 985 850
2011 311 938 707 307 1 019 244
2012 323 853 727 105 1 050 958
2013 349 802 948 966 1 298 768
2014 516 476 1 383 917 1 900 393
2015 673 727 1 193 041 1 866 768
2016 667 852 2 799 825 3 467 677
Total 6 022 807 24 772 198 17 336 30 812 341
April 2017

Table 3.4
1947 - 2016
Cubic Metres
British Columbia Alberta Saskatchewan Canada
Pre 1947 - 931 648 - 931 648
1947 - 67 890 - 67 890
1948 - 74 474 - 74 474
1949 - 75 871 - 75 871
1950 - 70 935 - 70 935
1951 - 81 843 - 81 843
1952 - 92 148 - 92 148
1953 - 95 786 - 95 786
1954 - 108 437 - 108 437
1955 - 138 000 - 138 000
1956 - 146 030 - 146 030
1957 4 444 157 728 - 162 172
1958 39 895 170 813 2 447 213 155
1959 81 513 265 056 24 152 370 721
1960 119 317 311 277 36 104 466 698
1961 129 284 699 895 35 907 865 086
1962 133 139 1 497 996 42 362 1 673 497
1963 133 761 2 775 033 43 422 2 952 216
1964 146 548 3 702 430 45 389 3 894 367
1965 150 556 4 145 298 40 162 4 336 016
1966 154 868 4 347 806 39 895 4 542 569
1967 161 460 4 539 898 47 034 4 748 392
1968 152 594 4 934 305 51 563 5 138 462
1969 150 029 5 786 244 59 888 5 996 161
1970 159 409 6 657 502 64 750 6 881 661
1971 177 048 7 071 511 62 135 7 310 694
1972 161 772 9 270 495 63 589 9 495 856
1973 179 998 9 427 390 67 570 9 674 958
1974 178 444 9 012 300 56 443 9 247 187
1975 185 182 8 443 500 52 072 8 680 754
1976 167 494 7 420 900 46 777 7 635 171
1977 180 179 7 343 700 23 254 7 547 133
1978 155 427 6 561 100 44 011 6 760 538
1979 184 397 6 472 200 42 974 6 699 571
1980 133 601 5 890 700 37 527 6 061 828
1981 124 946 5 652 200 28 455 5 805 601
1982 135 185 5 529 600 25 842 5 690 627
1983 113 984 5 161 100 17 408 5 292 492
CANADIAN PENTANES PLUS PRODUCTION
April 2017

Table 3.4
1947 - 2016
Cubic Metres
British Columbia Alberta Saskatchewan Canada
CANADIAN PENTANES PLUS PRODUCTION
1984 131 441 5 333 000 36 100 5 500 541
1985 125 059 5 644 600 26 200 5 795 859
1986 141 343 5 717 600 28 300 5 887 243
1987 187 805 6 061 300 27 100 6 276 205
1988 196 231 6 285 300 28 580 6 510 111
1989 235 375 6 440 800 27 450 6 703 625
1990 234 035 6 306 400 26 339 6 566 774
1991 250 672 6 620 100 25 750 6 896 522
1992 301 555 7 277 200 28 083 7 606 838
1993 344 167 8 023 500 28 720 8 396 387
1994 342 991 8 893 500 29 680 9 266 171
1995 357 813 9 343 400 32 596 9 733 809
1996 357 446 9 988 000 33 195 10 378 641
1997 440 796 11 577 400 40 448 12 058 644
1998 573 458 11 623 300 41 939 12 238 697
1999 569 076 11 420 000 79 084 12 068 160
2000 608 400 10 761 200 94 253 11 463 853
2001 597 899 9 649 000 107 027 10 353 926
2002 588 513 9 351 000 87 621 10 027 134
2003 530 709 8 567 496 80 692 9 178 897
2004 527 061 9 636 779 78 256 10 242 096
2005 526 980 9 407 795 77 259 10 012 034
2006 532 100 9 687 909 81 489 10 301 499
2007 470 342 9 721 127 112 024 10 303 492
2008 424 339 9 103 759 128 233 9 656 332
2009 458 591 8 387 391 85 398 8 931 381
2010 517 230 8 118 654 85 801 8 721 686
2011 650 794 7 736 225 81 209 8 468 228
2012 739 745 7 612 379 93 498 8 445 622
2013 899 311 7 945 413 97 385 8 942 109
2014 1 102 532 9 132 786 110 302 10 345 620
2015 762 009 11 183 674 152 478 12 098 161
2016 898 113 11 801 436 144 519 12 844 068
Total 19 418 405 419 490 462 3 338 142 442 247 009
Saskatchewan: 1978 forward Includes condensate
April 2017

Table 3.5
CANADIAN PROPANE PRODUCTION*
1948 - 2016
Cubic Metres
Offshore
British Columbia Alberta Saskatchewan Manitoba Nova Scotia Canada
1948 1 347 1 347
1949 8 596 8 596
1950 22 392 22 392
1951 39 453 39 453
1952 53 600 53 600
1953 68 743 68 743
1954 83 987 83 987
1955 126 426 126 426
1956 146 939 146 939
1957 176 405 176 405
1958 10 967 159 735 3 815 174 517
1959 15 385 235 999 44 604 295 988
1960 19 856 299 927 63 129 382 912
1961 25 886 374 499 69 044 469 429
1962 34 444 466 978 82 066 583 488
1963 32 565 540 903 94 759 668 227
1964 38 858 887 079 102 540 1 028 477
1965 56 948 1 443 047 107 252 1 607 247
1966 53 066 1 800 871 119 218 1 973 155
1967 65 565 2 033 180 140 522 2 239 267
1968 63 619 2 303 463 149 656 2 516 738
1969 51 984 2 637 500 135 662 2 825 146
1970 66 718 3 199 800 126 361 3 392 879
1971 74 425 3 671 900 126 566 3 872 891
1972 76 198 4 624 500 121 292 4 821 990
1973 90 026 5 166 500 116 102 5 372 628
1974 89 225 5 083 300 99 238 5 271 763
1975 81 842 5 358 700 88 869 5 529 411
1976 88 052 5 240 400 81 292 5 409 744
1977 91 149 5 342 000 78 893 5 512 042
1978 85 702 5 050 700 80 132 5 216 534
1979 84 864 5 543 400 75 779 5 704 043
1980 75 507 5 294 900 66 926 5 437 333
1981 64 118 5 192 500 34 129 5 290 747
1982 68 783 5 235 400 27 080 5 331 263
1983 62 494 4 945 000 67 100 5 074 594
1984 59 687 5 475 700 79 500 5 614 887
1985 64 802 5 445 600 84 600 4 380 5 599 382
1986 209 062 5 074 300 56 500 3 650 5 343 512
1987 230 602 5 602 700 64 900 3 400 5 901 602
1988 246 789 5 896 400 68 000 3 137 6 214 326
1989 277 995 6 268 500 65 335 4 400 6 616 230
April 2017
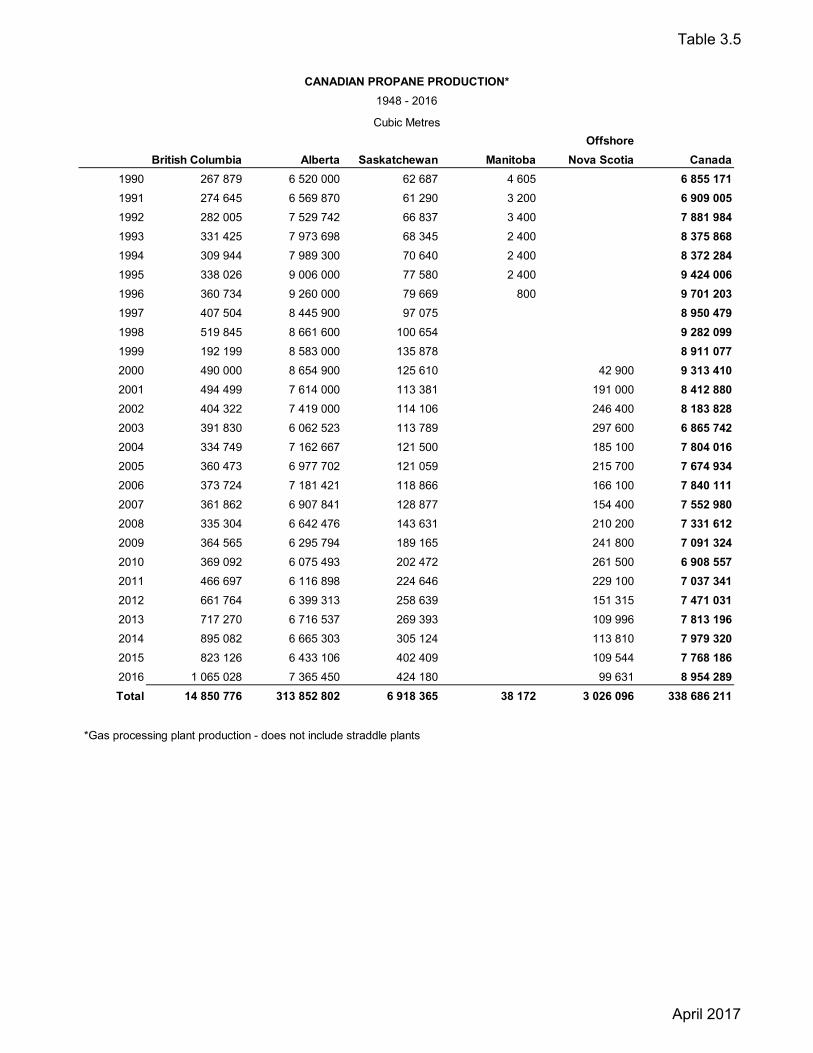
Table 3.5
CANADIAN PROPANE PRODUCTION*
1948 - 2016
Cubic Metres
Offshore
British Columbia Alberta Saskatchewan Manitoba Nova Scotia Canada
1990 267 879 6 520 000 62 687 4 605 6 855 171
1991 274 645 6 569 870 61 290 3 200 6 909 005
1992 282 005 7 529 742 66 837 3 400 7 881 984
1993 331 425 7 973 698 68 345 2 400 8 375 868
1994 309 944 7 989 300 70 640 2 400 8 372 284
1995 338 026 9 006 000 77 580 2 400 9 424 006
1996 360 734 9 260 000 79 669 800 9 701 203
1997 407 504 8 445 900 97 075 8 950 479
1998 519 845 8 661 600 100 654 9 282 099
1999 192 199 8 583 000 135 878 8 911 077
2000 490 000 8 654 900 125 610 42 900 9 313 410
2001 494 499 7 614 000 113 381 191 000 8 412 880
2002 404 322 7 419 000 114 106 246 400 8 183 828
2003 391 830 6 062 523 113 789 297 600 6 865 742
2004 334 749 7 162 667 121 500 185 100 7 804 016
2005 360 473 6 977 702 121 059 215 700 7 674 934
2006 373 724 7 181 421 118 866 166 100 7 840 111
2007 361 862 6 907 841 128 877 154 400 7 552 980
2008 335 304 6 642 476 143 631 210 200 7 331 612
2009 364 565 6 295 794 189 165 241 800 7 091 324
2010 369 092 6 075 493 202 472 261 500 6 908 557
2011 466 697 6 116 898 224 646 229 100 7 037 341
2012 661 764 6 399 313 258 639 151 315 7 471 031
2013 717 270 6 716 537 269 393 109 996 7 813 196
2014 895 082 6 665 303 305 124 113 810 7 979 320
2015 823 126 6 433 106 402 409 109 544 7 768 186
2016 1 065 028 7 365 450 424 180 99 631 8 954 289
Total 14 850 776 313 852 802 6 918 365 38 172 3 026 096 338 686 211
*Gas processing plant production - does not include straddle plants
April 2017

Table 3.6
1950 - 2016
Cubic Metres
Offshore
British Columbia Alberta Saskatchewan Manitoba Nova Scotia Canada
1950 5 385 5 385
1951 13 424 13 424
1952 22 270 22 270
1953 31 508 31 508
1954 38 938 38 938
1955 78 143 78 143
1956 93 958 93 958
1957 118 744 118 744
1958 12 960 105 358 2 972 121 290
1959 32 878 177 650 27 304 237 832
1960 46 590 202 083 36 345 285 018
1961 51 090 260 144 38 322 349 556
1962 61 548 322 591 46 192 430 331
1963 64 967 396 694 53 393 515 054
1964 73 332 741 262 58 289 872 883
1965 75 910 964 212 53 741 1 093 863
1966 79 560 1 158 462 54 323 1 292 345
1967 93 399 1 319 233 62 557 1 475 189
1968 83 780 1 506 777 64 554 1 655 111
1969 66 310 1 654 800 55 227 1 776 337
1970 49 019 2 082 700 55 805 2 187 524
1971 50 532 2 400 500 59 317 2 510 349
1972 54 139 3 054 800 50 839 3 159 778
1973 108 933 3 361 200 49 834 3 519 967
1974 105 307 3 371 700 42 072 3 519 079
1975 106 308 3 501 900 37 986 3 646 194
1976 109 658 3 436 000 36 977 3 582 635
1977 111 233 3 500 400 38 064 3 649 697
1978 106 461 3 212 000 39 135 3 357 596
1979 112 683 3 470 800 36 503 3 619 986
1980 89 556 3 250 200 31 127 3 370 883
1981 84 635 3 126 100 18 138 3 228 873
1982 89 443 3 117 400 16 516 3 223 359
1983 80 291 3 032 400 43 680 3 156 371
1984 81 972 3 103 100 47 900 3 232 972
1985 73 932 3 095 400 49 000 1 095 3 219 427
1986 114 957 2 847 000 41 400 1 095 3 004 452
1987 141 643 3 128 500 45 100 1 100 3 316 343
1988 149 123 3 353 100 47 630 1 316 3 551 169
1989 162 683 3 246 300 45 750 1 680 3 456 413
1990 152 224 3 253 600 43 898 1 824 3 451 546
1991 162 349 3 537 655 42 920 1 200 3 744 124
1992 183 378 3 727 497 46 805 1 200 3 958 880
1993 214 795 4 102 794 47 860 1 200 4 366 649
1994 214 640 4 459 200 49 460 1 200 4 724 500
1995 223 006 5 014 000 54 327 1 200 5 292 533
1996 233 467 4 760 000 55 325 400 5 049 192
1997 271 786 4 104 500 67 413 4 443 699
1998 350 715 4 328 200 69 898 4 748 813
1999 230 488 4 439 000 64 399 4 733 887
2000 405 600 5 076 700 54 880 40 900 5 578 080
2001 349 081 4 525 000 55 439 134 600 5 064 120
2002 324 063 4 264 000 62 221 160 000 4 810 284
2003 319 881 4 160 483 62 682 193 500 4 736 546
CANADIAN BUTANES PRODUCTION*
April 2017
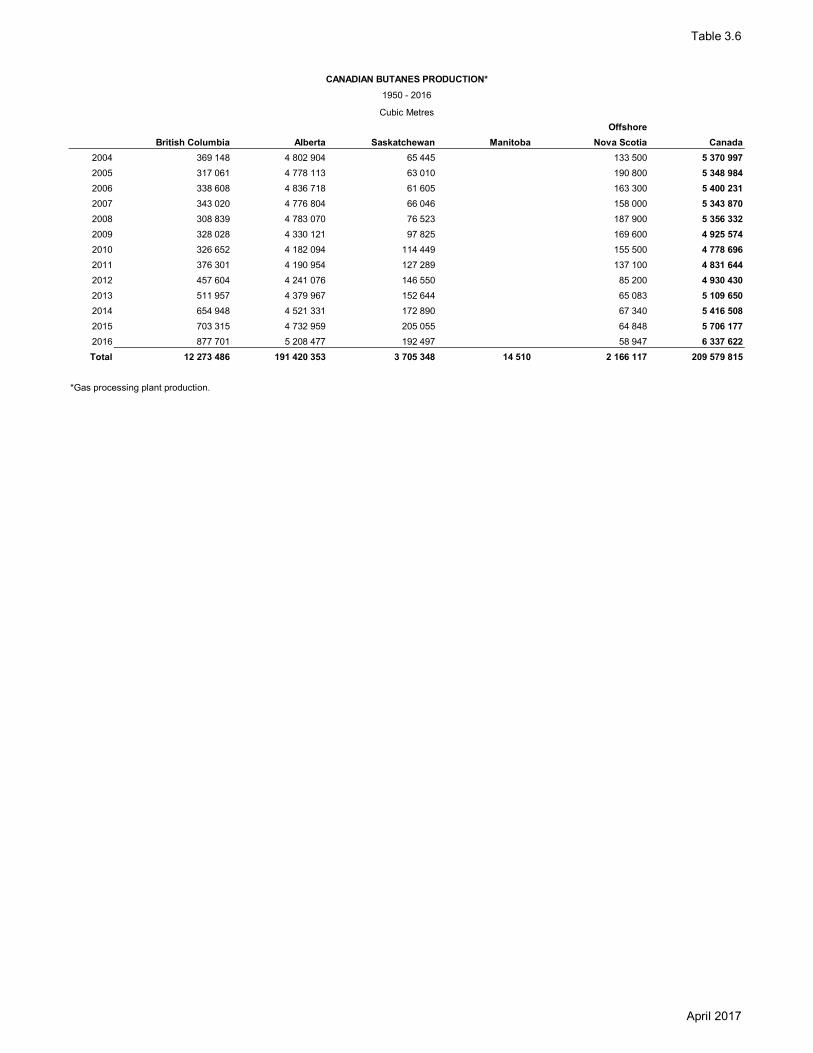
Table 3.6
1950 - 2016
Cubic Metres
Offshore
British Columbia Alberta Saskatchewan Manitoba Nova Scotia Canada
CANADIAN BUTANES PRODUCTION*
2004 369 148 4 802 904 65 445 133 500 5 370 997
2005 317 061 4 778 113 63 010 190 800 5 348 984
2006 338 608 4 836 718 61 605 163 300 5 400 231
2007 343 020 4 776 804 66 046 158 000 5 343 870
2008 308 839 4 783 070 76 523 187 900 5 356 332
2009 328 028 4 330 121 97 825 169 600 4 925 574
2010 326 652 4 182 094 114 449 155 500 4 778 696
2011 376 301 4 190 954 127 289 137 100 4 831 644
2012 457 604 4 241 076 146 550 85 200 4 930 430
2013 511 957 4 379 967 152 644 65 083 5 109 650
2014 654 948 4 521 331 172 890 67 340 5 416 508
2015 703 315 4 732 959 205 055 64 848 5 706 177
2016 877 701 5 208 477 192 497 58 947 6 337 622
Total 12 273 486 191 420 353 3 705 348 14 510 2 166 117 209 579 815
*Gas processing plant production.
April 2017
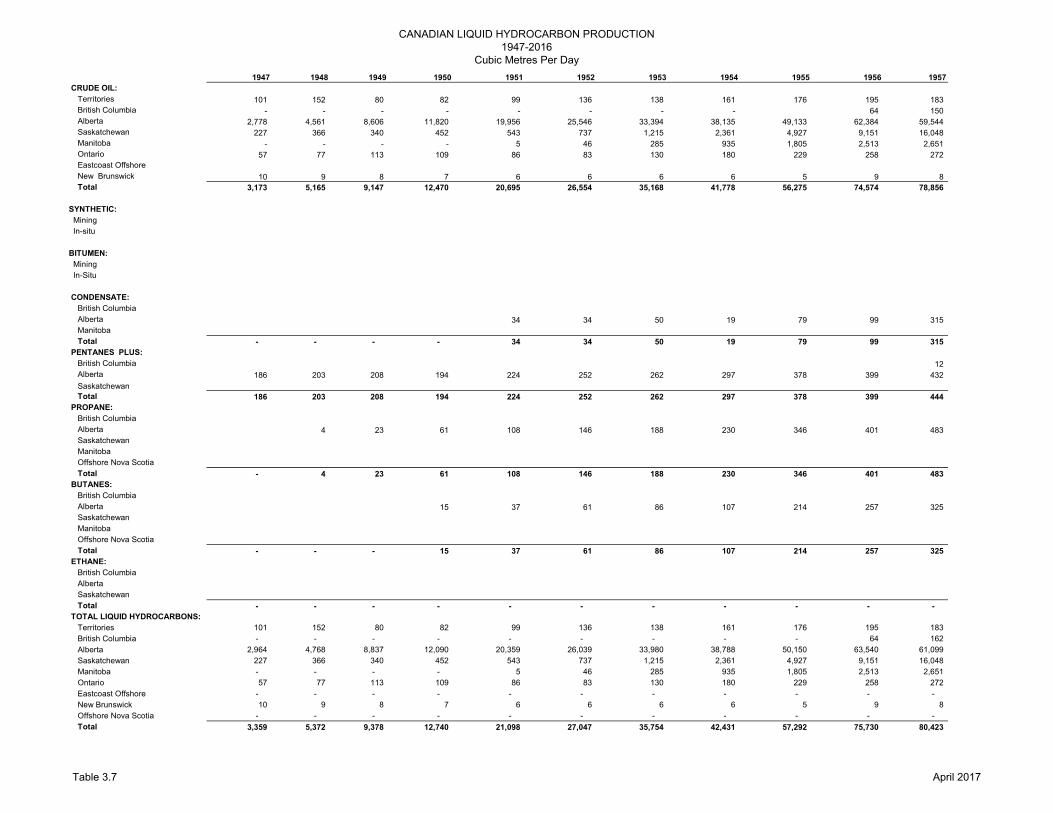
CANADIAN LIQUID HYDROCARBON PRODUCTION1947-2016
Cubic Metres Per Day
1947 1948 1949 1950 1951 1952 1953 1954 1955 1956 1957
CRUDE OIL:
Territories 101 152 80 82 99 136 138 161 176 195 183
British Columbia - - - - - - - - 64 150
Alberta 2,778 4,561 8,606 11,820 19,956 25,546 33,394 38,135 49,133 62,384 59,544
Saskatchewan 227 366 340 452 543 737 1,215 2,361 4,927 9,151 16,048
Manitoba - - - - 5 46 285 935 1,805 2,513 2,651
Ontario 57 77 113 109 86 83 130 180 229 258 272
Eastcoast Offshore
New Brunswick 10 9 8 7 6 6 6 6 5 9 8
Total 3,173 5,165 9,147 12,470 20,695 26,554 35,168 41,778 56,275 74,574 78,856
SYNTHETIC:
Mining
In-situ
BITUMEN:
Mining
In-Situ
CONDENSATE:
British Columbia
Alberta 34 34 50 19 79 99 315
Manitoba
Total - - - - 34 34 50 19 79 99 315
PENTANES PLUS:
British Columbia 12
Alberta 186 203 208 194 224 252 262 297 378 399 432
Saskatchewan
Total 186 203 208 194 224 252 262 297 378 399 444
PROPANE:
British Columbia
Alberta 4 23 61 108 146 188 230 346 401 483
Saskatchewan
Manitoba
Offshore Nova Scotia
Total - 4 23 61 108 146 188 230 346 401 483
BUTANES:
British Columbia
Alberta 15 37 61 86 107 214 257 325
Saskatchewan
Manitoba
Offshore Nova Scotia
Total - - - 15 37 61 86 107 214 257 325
ETHANE:
British Columbia
Alberta
Saskatchewan
Total - - - - - - - - - - -
TOTAL LIQUID HYDROCARBONS:
Territories 101 152 80 82 99 136 138 161 176 195 183
British Columbia - - - - - - - - - 64 162
Alberta 2,964 4,768 8,837 12,090 20,359 26,039 33,980 38,788 50,150 63,540 61,099
Saskatchewan 227 366 340 452 543 737 1,215 2,361 4,927 9,151 16,048
Manitoba - - - - 5 46 285 935 1,805 2,513 2,651
Ontario 57 77 113 109 86 83 130 180 229 258 272
Eastcoast Offshore - - - - - - - - - - -
New Brunswick 10 9 8 7 6 6 6 6 5 9 8
Offshore Nova Scotia - - - - - - - - - - -
Total 3,359 5,372 9,378 12,740 21,098 27,047 35,754 42,431 57,292 75,730 80,423
Table 3.7 April 2017

CANADIAN LIQUID HYDROCARBON PRODUCTION1947-2016
Cubic Metres Per Day
CRUDE OIL:
Territories
British Columbia
Alberta
Saskatchewan
Manitoba
Ontario
Eastcoast Offshore
New Brunswick
Total
SYNTHETIC:
Mining
In-situ
BITUMEN:
Mining
In-Situ
CONDENSATE:
British Columbia
Alberta
Manitoba
Total
PENTANES PLUS:
British Columbia
Alberta
Saskatchewan
Total
PROPANE:
British Columbia
Alberta
Saskatchewan
Manitoba
Offshore Nova Scotia
Total
BUTANES:
British Columbia
Alberta
Saskatchewan
Manitoba
Offshore Nova Scotia
Total
ETHANE:
British Columbia
Alberta
Saskatchewan
Total
TOTAL LIQUID HYDROCARBONS:
Territories
British Columbia
Alberta
Saskatchewan
Manitoba
Ontario
Eastcoast Offshore
New Brunswick
Offshore Nova Scotia
Total
1958 1959 1960 1961 1962 1963 1964 1965 1966 1967 1968
194 184 198 224 260 266 251 281 318 309 327
224 376 377 442 3,877 5,449 5,004 5,865 7,244 8,558 9,618
48,967 56,076 56,704 68,632 71,917 73,434 76,142 79,998 88,162 100,487 109,214
19,429 20,654 22,538 24,320 28,052 31,044 35,344 38,221 40,584 40,289 39,896
2,538 2,201 2,068 1,951 1,710 1,642 1,918 2,154 2,277 2,432 2,694
339 436 436 500 494 525 541 557 576 540 500
7 6 6 5 4 3 2 2 3 4 3
71,698 79,933 82,327 96,074 106,314 112,363 119,202 127,078 139,164 152,619 162,252
197 2,249
4 6 11 14 17 18 24
347 506 966 1,301 2,892 1,492 417 254 326 330 347
347 506 966 1,301 2,896 1,498 428 268 343 348 371
109 223 326 354 365 366 400 412 424 442 417
468 726 850 1,918 4,104 7,603 10,116 11,357 11,912 12,438 13,482
7 66 99 98 116 119 124 110 109 129 141
584 1,015 1,275 2,370 4,585 8,088 10,640 11,879 12,445 13,009 14,040
30 42 54 71 94 89 106 156 145 180 174
438 646 819 1,026 1,279 1,482 2,424 3,954 4,934 5,570 6,311
10 122 172 189 225 260 280 294 327 385 410
478 810 1,045 1,286 1,598 1,831 2,810 4,404 5,406 6,135 6,895
36 90 127 140 169 178 200 208 218 256 229
289 487 552 713 884 1,087 2,025 2,642 3,174 3,614 4,117
8 75 99 105 126 146 159 147 149 171 176
333 652 778 958 1,179 1,411 2,384 2,997 3,541 4,041 4,522
- - - - - - - - - - -
194 184 198 224 260 266 251 281 318 309 327
399 731 884 1,007 4,509 6,088 5,721 6,655 8,048 9,454 10,462
50,509 58,441 59,891 73,590 81,076 85,098 91,124 98,205 108,508 122,636 135,720
19,454 20,917 22,908 24,712 28,519 31,569 35,907 38,772 41,169 40,974 40,623
2,538 2,201 2,068 1,951 1,710 1,642 1,918 2,154 2,277 2,432 2,694
339 436 436 500 494 525 541 557 576 540 500
- - - - - - - - - - -
7 6 6 5 4 3 2 2 3 4 3
- - - - - - - - - - -
73,440 82,916 86,391 101,989 116,572 125,191 135,464 146,626 160,899 176,349 190,329
Table 3.7 April 2017

CANADIAN LIQUID HYDROCARBON PRODUCTION1947-2016
Cubic Metres Per Day
CRUDE OIL:
Territories
British Columbia
Alberta
Saskatchewan
Manitoba
Ontario
Eastcoast Offshore
New Brunswick
Total
SYNTHETIC:
Mining
In-situ
BITUMEN:
Mining
In-Situ
CONDENSATE:
British Columbia
Alberta
Manitoba
Total
PENTANES PLUS:
British Columbia
Alberta
Saskatchewan
Total
PROPANE:
British Columbia
Alberta
Saskatchewan
Manitoba
Offshore Nova Scotia
Total
BUTANES:
British Columbia
Alberta
Saskatchewan
Manitoba
Offshore Nova Scotia
Total
ETHANE:
British Columbia
Alberta
Saskatchewan
Total
TOTAL LIQUID HYDROCARBONS:
Territories
British Columbia
Alberta
Saskatchewan
Manitoba
Ontario
Eastcoast Offshore
New Brunswick
Offshore Nova Scotia
Total
1969 1970 1971 1972 1973 1974 1975 1976 1977 1978 1979 1980
349 368 409 386 419 435 438 389 377 399 389 439
11,019 11,029 10,951 10,347 9,225 8,204 6,216 6,465 6,025 5,490 5,863 5,470
124,805 143,560 155,561 184,449 227,432 216,735 184,963 166,416 165,792 164,424 187,715 172,680
38,054 38,960 38,528 37,617 37,330 32,126 25,696 24,278 26,749 26,369 25,676 25,494
2,701 2,573 2,440 2,282 2,213 2,068 1,922 1,730 1,727 1,639 1,598 1,540
506 456 417 381 352 320 307 270 269 261 252 256
3 4 4 4 4 3 3 2 2 2 2 1
177,437 196,950 208,310 235,466 276,975 259,891 219,545 199,550 200,941 198,584 221,495 205,880
4,392 5,216 6,715 8,096 7,962 7,271 6,866 7,678 7,216 8,937 14,488 20,358
194 200 545 1,202 1,331 1,241 1,592 1,519
34 47 47 46 55 45 44 50 67 70 89 101
294 306 333 397 435 327 312 315 334 336 368 304
328 353 380 443 490 372 356 365 401 406 457 405
411 437 485 442 493 489 507 458 494 426 505 365
15,853 18,240 19,374 25,329 25,828 24,691 23,133 20,276 20,120 17,976 17,732 16,095
164 177 170 174 185 155 143 128 64 120 118 103
16,428 18,854 20,029 25,945 26,506 25,335 23,783 20,862 20,678 18,522 18,355 16,563
142 183 204 208 271 244 224 240 250 235 232 206
7,226 8,767 10,060 12,635 14,155 13,927 14,681 14,318 14,636 13,838 15,187 14,467
372 346 347 331 318 272 243 222 216 219 208 183
7,740 9,296 10,611 13,174 14,744 14,443 15,148 14,780 15,102 14,292 15,627 14,856
182 134 138 148 298 288 291 300 305 292 309 245
4,534 5,706 6,577 8,346 9,209 9,237 9,594 9,388 9,590 8,800 9,509 8,880
151 153 162 139 136 115 104 101 104 107 100 85
4,867 5,993 6,877 8,633 9,643 9,640 9,989 9,789 9,999 9,199 9,918 9,210
442 528 503 1,015 3,837 9,828 12,174
- - - - - 442 528 503 1,015 3,837 9,828 12,174
349 368 409 386 419 435 438 389 377 399 389 439
11,788 11,830 11,825 11,191 10,342 9,270 7,282 7,513 7,141 6,513 6,998 6,387
157,104 181,795 198,620 239,252 285,215 272,830 240,622 220,096 220,034 219,389 256,419 246,477
38,741 39,636 39,207 38,261 37,969 32,668 26,186 24,729 27,133 26,815 26,102 25,865
2,701 2,573 2,440 2,282 2,213 2,068 1,922 1,730 1,727 1,639 1,598 1,540
506 456 417 381 352 320 307 270 269 261 252 256
- - - - - - - - - - - -
3 4 4 4 4 3 3 2 2 2 2 1
- - - - - - - - - - - -
211,192 236,662 252,922 291,757 336,514 317,594 276,760 254,729 256,683 255,018 291,760 280,965
Table 3.7 April 2017

CANADIAN LIQUID HYDROCARBON PRODUCTION1947-2016
Cubic Metres Per Day
CRUDE OIL:
Territories
British Columbia
Alberta
Saskatchewan
Manitoba
Ontario
Eastcoast Offshore
New Brunswick
Total
SYNTHETIC:
Mining
In-situ
BITUMEN:
Mining
In-Situ
CONDENSATE:
British Columbia
Alberta
Manitoba
Total
PENTANES PLUS:
British Columbia
Alberta
Saskatchewan
Total
PROPANE:
British Columbia
Alberta
Saskatchewan
Manitoba
Offshore Nova Scotia
Total
BUTANES:
British Columbia
Alberta
Saskatchewan
Manitoba
Offshore Nova Scotia
Total
ETHANE:
British Columbia
Alberta
Saskatchewan
Total
TOTAL LIQUID HYDROCARBONS:
Territories
British Columbia
Alberta
Saskatchewan
Manitoba
Ontario
Eastcoast Offshore
New Brunswick
Offshore Nova Scotia
Total
1981 1982 1983 1984 1985 1986 1987 1988 1989 1990 1991 1992
475 475 464 477 3,012 4,185 4,293 4,926 5,140 5,110 5,278 5,188
5,568 5,689 5,695 5,722 5,365 5,533 5,708 5,143 5,174 5,277 5,515 5,612
156,105 148,996 151,554 163,623 156,150 145,429 151,151 157,521 149,602 145,131 142,711 145,281
20,254 22,204 26,146 29,542 31,825 32,029 32,978 33,469 31,852 33,559 34,028 36,528
1,487 1,595 2,019 2,167 2,248 2,256 2,142 2,100 1,980 2,021 1,953 1,793
246 235 229 247 308 371 364 521 668 677 645 613
1,575
1 1 1 1 1
184,136 179,195 186,108 201,778 198,908 189,803 196,637 203,681 194,416 191,775 190,130 196,590
17,200 16,438 23,668 21,262 26,216 29,391 28,690 31,812 32,605 33,126 35,948 37,645
2,063 3,510 3,986 5,309 8,301 14,822 18,441 20,618 20,477 21,523 19,488 20,115
78 56 48 39 33 48 71 78 76 68 65 56
261 286 268 366 416 282 238 321 443 351 435 531
8 2 6 2 5 6 4 4
339 342 316 405 457 332 315 401 524 425 504 591
342 370 312 359 343 387 515 537 645 641 687 824
15,485 15,150 14,140 14,571 15,464 15,665 16,606 17,173 17,646 17,278 18,137 19,883
78 71 48 99 72 78 74 77 75 72 71 77
15,905 15,591 14,500 15,029 15,879 16,130 17,195 17,787 18,366 17,991 18,895 20,784
176 188 171 163 177 573 632 675 762 734 752 771
14,226 14,344 13,548 14,961 14,919 13,902 15,350 16,111 17,174 17,863 18,000 20,573
94 74 184 211 193 155 178 186 179 172 168 183
12 10 9 9 12 13 9 9
14,496 14,606 13,903 15,335 15,301 14,640 16,169 16,981 18,127 18,782 18,929 21,536
232 245 220 224 203 315 388 408 446 417 445 501
8,565 8,541 8,308 8,478 8,480 7,800 8,571 9,162 8,894 8,914 9,692 10,184
50 45 120 130 118 113 124 128 125 120 118 128
3 3 3 4 5 5 3 3
8,847 8,831 8,648 8,832 8,804 8,231 9,086 9,702 9,470 9,456 10,258 10,816
12,796 11,639 12,764 15,390 14,981 14,101 17,680 17,795 17,879 19,468 20,651 19,965
56 64 123 147 117 121 120 120 118 113 111 124
12,852 11,703 12,887 15,537 15,098 14,222 17,800 17,915 17,997 19,581 20,762 20,089
475 475 464 477 3,012 4,185 4,293 4,926 5,140 5,110 5,278 5,188
6,396 6,548 6,446 6,507 6,121 6,856 7,314 6,841 7,103 7,137 7,464 7,764
226,701 218,904 228,236 243,960 244,927 241,392 256,727 270,513 264,720 263,654 265,062 274,177
20,532 22,458 26,621 30,129 32,325 32,496 33,474 33,980 32,349 34,036 34,496 37,040
1,487 1,595 2,019 2,167 2,271 2,271 2,160 2,115 2,002 2,045 1,969 1,809
246 235 229 247 308 371 364 521 668 677 645 613
- - - - - - - - - - - 1,575
1 1 1 - - - 1 1 - - - -
- - - - - - - - - - - -
255,838 250,216 264,016 283,487 288,964 287,571 304,333 318,897 311,982 312,659 314,914 328,166
Table 3.7 April 2017
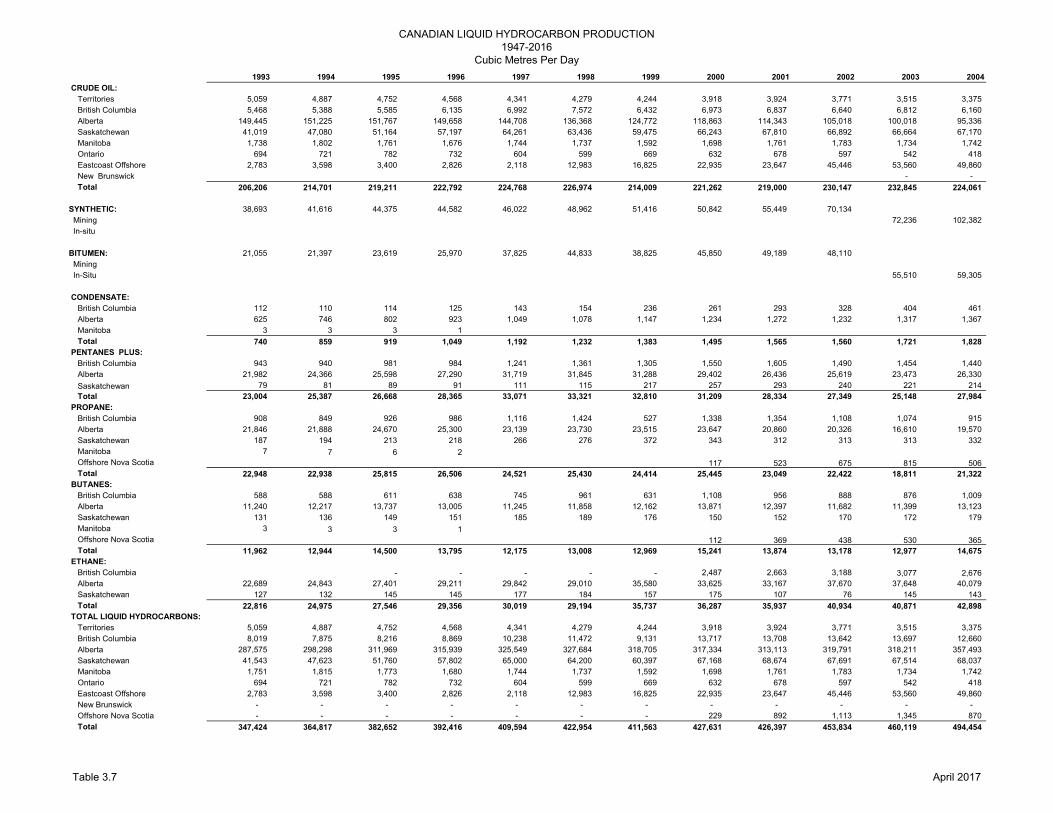
CANADIAN LIQUID HYDROCARBON PRODUCTION1947-2016
Cubic Metres Per Day
CRUDE OIL:
Territories
British Columbia
Alberta
Saskatchewan
Manitoba
Ontario
Eastcoast Offshore
New Brunswick
Total
SYNTHETIC:
Mining
In-situ
BITUMEN:
Mining
In-Situ
CONDENSATE:
British Columbia
Alberta
Manitoba
Total
PENTANES PLUS:
British Columbia
Alberta
Saskatchewan
Total
PROPANE:
British Columbia
Alberta
Saskatchewan
Manitoba
Offshore Nova Scotia
Total
BUTANES:
British Columbia
Alberta
Saskatchewan
Manitoba
Offshore Nova Scotia
Total
ETHANE:
British Columbia
Alberta
Saskatchewan
Total
TOTAL LIQUID HYDROCARBONS:
Territories
British Columbia
Alberta
Saskatchewan
Manitoba
Ontario
Eastcoast Offshore
New Brunswick
Offshore Nova Scotia
Total
1993 1994 1995 1996 1997 1998 1999 2000 2001 2002 2003 2004
5,059 4,887 4,752 4,568 4,341 4,279 4,244 3,918 3,924 3,771 3,515 3,375
5,468 5,388 5,585 6,135 6,992 7,572 6,432 6,973 6,837 6,640 6,812 6,160
149,445 151,225 151,767 149,658 144,708 136,368 124,772 118,863 114,343 105,018 100,018 95,336
41,019 47,080 51,164 57,197 64,261 63,436 59,475 66,243 67,810 66,892 66,664 67,170
1,738 1,802 1,761 1,676 1,744 1,737 1,592 1,698 1,761 1,783 1,734 1,742
694 721 782 732 604 599 669 632 678 597 542 418
2,783 3,598 3,400 2,826 2,118 12,983 16,825 22,935 23,647 45,446 53,560 49,860
- -
206,206 214,701 219,211 222,792 224,768 226,974 214,009 221,262 219,000 230,147 232,845 224,061
38,693 41,616 44,375 44,582 46,022 48,962 51,416 50,842 55,449 70,134
72,236 102,382
21,055 21,397 23,619 25,970 37,825 44,833 38,825 45,850 49,189 48,110
55,510 59,305
112 110 114 125 143 154 236 261 293 328 404 461
625 746 802 923 1,049 1,078 1,147 1,234 1,272 1,232 1,317 1,367
3 3 3 1
740 859 919 1,049 1,192 1,232 1,383 1,495 1,565 1,560 1,721 1,828
943 940 981 984 1,241 1,361 1,305 1,550 1,605 1,490 1,454 1,440
21,982 24,366 25,598 27,290 31,719 31,845 31,288 29,402 26,436 25,619 23,473 26,330
79 81 89 91 111 115 217 257 293 240 221 214
23,004 25,387 26,668 28,365 33,071 33,321 32,810 31,209 28,334 27,349 25,148 27,984
908 849 926 986 1,116 1,424 527 1,338 1,354 1,108 1,074 915
21,846 21,888 24,670 25,300 23,139 23,730 23,515 23,647 20,860 20,326 16,610 19,570
187 194 213 218 266 276 372 343 312 313 313 332
7 7 6 2
117 523 675 815 506
22,948 22,938 25,815 26,506 24,521 25,430 24,414 25,445 23,049 22,422 18,811 21,322
588 588 611 638 745 961 631 1,108 956 888 876 1,009
11,240 12,217 13,737 13,005 11,245 11,858 12,162 13,871 12,397 11,682 11,399 13,123
131 136 149 151 185 189 176 150 152 170 172 179
3 3 3 1
112 369 438 530 365
11,962 12,944 14,500 13,795 12,175 13,008 12,969 15,241 13,874 13,178 12,977 14,675
- - - - - 2,487 2,663 3,188 3,077 2,676
22,689 24,843 27,401 29,211 29,842 29,010 35,580 33,625 33,167 37,670 37,648 40,079
127 132 145 145 177 184 157 175 107 76 145 143
22,816 24,975 27,546 29,356 30,019 29,194 35,737 36,287 35,937 40,934 40,871 42,898
5,059 4,887 4,752 4,568 4,341 4,279 4,244 3,918 3,924 3,771 3,515 3,375
8,019 7,875 8,216 8,869 10,238 11,472 9,131 13,717 13,708 13,642 13,697 12,660
287,575 298,298 311,969 315,939 325,549 327,684 318,705 317,334 313,113 319,791 318,211 357,493
41,543 47,623 51,760 57,802 65,000 64,200 60,397 67,168 68,674 67,691 67,514 68,037
1,751 1,815 1,773 1,680 1,744 1,737 1,592 1,698 1,761 1,783 1,734 1,742
694 721 782 732 604 599 669 632 678 597 542 418
2,783 3,598 3,400 2,826 2,118 12,983 16,825 22,935 23,647 45,446 53,560 49,860
- - - - - - - - - - - -
- - - - - - - 229 892 1,113 1,345 870
347,424 364,817 382,652 392,416 409,594 422,954 411,563 427,631 426,397 453,834 460,119 494,454
Table 3.7 April 2017

CANADIAN LIQUID HYDROCARBON PRODUCTION1947-2016
Cubic Metres Per Day
CRUDE OIL:
Territories
British Columbia
Alberta
Saskatchewan
Manitoba
Ontario
Eastcoast Offshore
New Brunswick
Total
SYNTHETIC:
Mining
In-situ
BITUMEN:
Mining
In-Situ
CONDENSATE:
British Columbia
Alberta
Manitoba
Total
PENTANES PLUS:
British Columbia
Alberta
Saskatchewan
Total
PROPANE:
British Columbia
Alberta
Saskatchewan
Manitoba
Offshore Nova Scotia
Total
BUTANES:
British Columbia
Alberta
Saskatchewan
Manitoba
Offshore Nova Scotia
Total
ETHANE:
British Columbia
Alberta
Saskatchewan
Total
TOTAL LIQUID HYDROCARBONS:
Territories
British Columbia
Alberta
Saskatchewan
Manitoba
Ontario
Eastcoast Offshore
New Brunswick
Offshore Nova Scotia
Total
2005 2006 2007 2008 2009 2010 2011 2012 2013 2014 2015
2,986 2,966 2,786 2,573 2,469 2,390 1,668 2,068 1,791 1,757 1,584
5,312 4,577 4,190 3,677 3,490 3,464 3,234 3,326 3,139 3,413 3,324
90,804 86,311 83,355 79,930 73,257 72,957 77,884 88,371 92,515 93,687 84,261
66,577 68,051 68,007 69,642 67,159 66,906 68,440 74,640 77,255 81,691 77,193
2,209 3,016 3,532 3,748 4,166 5,133 6,566 8,355 8,081 7,817 7,233
377 342 300 269 241 230 216 221 192 187 152
48,467 48,278 58,577 54,405 42,547 43,859 42,369 31,355 36,408 34,346 27,299
- - 3 4 6 5 14 12 8 7 5
216,732 213,540 220,749 214,248 193,336 194,943 200,391 208,346 219,389 222,905 201,051
86,818 104,251 109,186 103,828 120,910 122,814 132,310 138,582 143,225 145,595 150,351
751 3,517 4,792 4,737 5,559 6,087 4,812
3,970 12,655 26,666
66,688 73,143 79,350 86,795 93,501 107,121 119,995 139,473 155,458 178,940 194,485
515 614 652 745 761 769 855 885 958 1,415 1,846
1,543 1,753 2,089 2,404 2,173 1,932 1,938 1,987 2,600 3,792 3,269
2,058 2,367 2,741 3,149 2,935 2,701 2,792 2,871 3,558 5,207 5,114
1,444 1,458 1,289 1,159 1,256 1,417 1,783 2,021 2,464 3,021 2,088
25,775 26,542 26,633 24,874 22,979 22,243 21,195 20,799 21,768 25,021 30,640
212 223 307 350 234 235 222 255 267 302 418
27,430 28,223 28,229 26,383 24,470 23,895 23,201 23,075 24,499 28,344 33,146
988 1,024 991 916 999 1,011 1,279 1,808 1,965 2,452 2,255
19,117 19,675 18,926 18,149 17,249 16,645 16,759 17,484 18,401 18,261 17,625
332 326 353 392 518 555 615 707 738 836 1,102
591 455 423 574 662 716 628 413 301 312 300
21,027 21,480 20,693 20,032 19,428 18,928 19,280 20,413 21,406 21,861 21,283
869 928 940 844 899 895 1,031 1,250 1,403 1,794 1,927
13,091 13,251 13,087 13,068 11,863 11,458 11,482 11,588 12,000 12,387 12,967
173 169 181 209 268 314 349 400 418 474 638
523 447 433 513 465 426 376 233 178 184 178
14,655 14,795 14,641 14,635 13,495 13,092 13,237 13,471 13,999 14,840 15,710
2,869 3,401 3,164 3,332 3,157 3,263 3,125 2,648 2,836 2,744 2,697
40,056 40,673 39,703 35,321 35,111 34,217 35,206 34,046 35,923 34,845 35,530
142 115 75 72 72 132 97 111 116 132 96
43,067 44,189 42,942 38,726 38,340 37,611 38,428 36,806 38,876 37,721 38,324
2,986 2,966 2,786 2,573 2,469 2,390 1,668 2,068 1,791 1,757 1,584
11,996 12,001 11,226 10,674 10,563 10,818 11,306 11,938 12,765 14,839 14,137
343,892 365,599 372,329 364,370 377,794 392,903 421,560 457,066 491,418 531,269 560,605
67,435 68,884 68,923 70,666 68,251 68,142 69,723 76,114 78,795 83,435 79,447
2,209 3,016 3,532 3,748 4,166 5,133 6,566 8,355 8,081 7,817 7,233
377 342 300 269 241 230 216 221 192 187 152
48,467 48,278 58,577 54,405 42,547 43,859 42,369 31,355 36,408 34,346 27,299
- - 3 4 6 5 14 12 8 7 5
1,114 902 856 1,088 1,127 1,142 1,003 646 480 496 478
478,475 501,988 518,531 507,797 507,165 524,621 554,426 587,775 629,938 674,153 690,940
Table 3.7 April 2017

CANADIAN LIQUID HYDROCARBON PRODUCTION1947-2016
Cubic Metres Per Day
CRUDE OIL:
Territories
British Columbia
Alberta
Saskatchewan
Manitoba
Ontario
Eastcoast Offshore
New Brunswick
Total
SYNTHETIC:
Mining
In-situ
BITUMEN:
Mining
In-Situ
CONDENSATE:
British Columbia
Alberta
Manitoba
Total
PENTANES PLUS:
British Columbia
Alberta
Saskatchewan
Total
PROPANE:
British Columbia
Alberta
Saskatchewan
Manitoba
Offshore Nova Scotia
Total
BUTANES:
British Columbia
Alberta
Saskatchewan
Manitoba
Offshore Nova Scotia
Total
ETHANE:
British Columbia
Alberta
Saskatchewan
Total
TOTAL LIQUID HYDROCARBONS:
Territories
British Columbia
Alberta
Saskatchewan
Manitoba
Ontario
Eastcoast Offshore
New Brunswick
Offshore Nova Scotia
Total
2016
1,426
3,668
70,560
72,944
6,377
144
33,337
1
188,456
147,550
188
29,464
206,052
1,825
7,650
9,475
2,454
32,244
395
35,093
2,910
20,124
1,159
272
24,465
1,922
12,932
636
177
15,667
2,690
35,433
96
38,219
1,426
15,468
562,197
75,230
6,377
144
33,337
1
449
694,629
Table 3.7 April 2017

Table 3.8
CANADIAN CRUDE OIL PRODUCTION BY MAJOR FIELDS
2016 Production (M3)
Cumulative
Production
Annual Daily Cubic Metres
NORTHWEST TERRITORIES
Norman Wells 521 992 1 426 43 306 244
BRITISH COLUMBIA
Boundary Lake 233 257 637 37 719 429
Peejay 14 924 41 10 903 169
Milligan Creek - - 7 396 444
Eagle West 18 134 50 7 054 079
Inga 3 632 10 6 915 522
Hay River 247 173 675 5 243 173
Heritage Montney 444 134 1 213 961 779
ALBERTA
Pembina 12 961 800 35 415 324 268 500
Swan Hills 688 500 1 881 146 915 300
Redwater 457 300 1 249 141 364 300
Rainbow 338 700 925 114 216 500
Provost 1 501 700 4 103 105 244 800
Bonnie Glen 2 400 7 82 968 600
Judy Creek 258 800 707 80 056 500
Nipisi 231 500 633 78 425 100
Mitsue 179 600 491 64 031 600
Swan Hills South 129 800 355 63 995 400
Leduc-Woodbend 325 100 888 63 645 700
Wizard Lake 3 400 9 54 354 600
Fenn Big Valley 38 700 106 53 828 600
Virginia Hills 160 600 439 36 566 400
Sturgeon Lake South 122 200 334 32 129 100
Golden Spike 6 500 18 30 981 800
Grand Forks 139 700 382 30 712 700
Willisden Green 500 400 1 367 30 292 400
Suffield 591 500 1 616 29 036 500
Carson Creek North 76 300 208 28 625 500
Lloydminster 1 002 200 2 738 26 418 800
Turner Valley 148 500 406 26 224 400
Countess 205 400 561 25 012 900
Valhalla 657 000 1 795 24 891 800
Westerose 9 500 26 23 681 800
Acheson 22 300 61 23 627 000
Kaybob 268 100 733 23 287 800
SASKATCHEWAN
Weyburn 1 534 288 4 192 90 466 261
Steelman 306 107 836 52 351 715
Midale 562 098 1 536 31 271 482
Viewfield North 2 362 557 6 455 30 162 801
Battrum 345 740 945 19 665 760
Dodsland 933 615 2 551 18 603 907
Celtic 642 258 1 755 18 036 828
Dollard 80 316 219 17 293 040
MANITOBA
Virden 156 241 427 18 549 443
Daly Sinclair* 1 279 430 3 496 16 752 056
Waskada 251 557 687 7 735 142
Pierson 226 667 619 3 802 054
ONTARIO
All Fields 52 648 144 14 685 982
EASTCOAST OFFSHORE
Hibernia 7 913 830 21 622 159 227 623
Terra Nova 1 915 380 5 233 61 650 330
White Rose/North Amethyst 2 372 203 6 481 41 328 967
Cohasset/Panuke - - 7 062 019
NEW BRUNSWICK
All Fields - - 155 715
* In 2009 the Daly and Sinclair fields were amalgamated
October 2017

CANADIAN NATURAL GAS PRODUCTION*
1947 - 2016
Thousand Cubic Metres at 101.325 kPa and 15°C
British Western New Eastcoast Eastern
Territories Columbia Alberta Saskatchewan Canada Ontario Quebec Brunswick Offshore Canada Canada
Pre 1947 41 402 47 274 654 41 188 47 357 244 12 145 650 625 315 12 770 965 60 128 209
1947 2 909 1 357 017 7 342 1 367 268 221 008 13 875 234 883 1 602 151
1948 4 427 1 593 682 12 314 1 610 423 241 058 11 908 252 966 1 863 389
1949 1 838 1 783 050 13 295 1 798 183 225 170 10 624 235 794 2 033 977
1950 1 870 2 029 993 22 988 2 054 851 224 756 10 251 235 007 2 289 858
1951 3 034 2 249 024 24 263 2 276 321 236 917 7 410 244 327 2 520 648
1952 3 811 2 574 545 32 093 2 610 449 232 970 5 723 238 693 2 849 142
1953 3 710 3 092 248 45 869 3 141 827 281 057 5 197 286 254 3 428 081
1954 4 057 1 686 3 634 406 135 919 3 776 068 275 996 5 017 281 013 4 057 081
1955 4 963 4 679 4 478 448 318 923 4 807 013 304 545 5 284 309 829 5 116 842
1956 7 719 7 470 5 296 219 554 913 5 866 321 359 510 5 391 364 901 6 231 222
1957 6 032 236 696 6 290 805 945 570 7 479 103 404 108 4 998 409 106 7 888 209
1958 8 052 1 773 816 7 648 174 1 200 730 10 630 772 453 133 3 511 456 644 11 087 416
1959 8 298 1 937 300 9 335 498 1 537 572 12 818 668 472 531 3 328 475 859 13 294 527
1960 9 278 2 392 037 11 569 662 1 496 208 15 467 185 512 305 2 796 515 101 15 982 286
1961 12 984 2 925 109 15 097 990 1 645 773 19 681 856 408 128 2 703 410 831 20 092 687
1962 18 380 3 626 744 22 070 363 1 746 607 27 462 094 437 582 2 687 440 269 27 902 363
1963 21 902 3 768 235 24 529 590 1 700 567 30 020 294 446 737 2 905 449 642 30 469 936
1964 21 640 4 138 738 27 997 982 1 795 408 33 953 768 387 694 2 948 390 642 34 344 410
1965 18 208 4 832 246 30 514 199 1 692 958 37 057 611 356 364 2 956 359 320 37 416 931
1966 19 847 5 618 469 32 291 058 1 866 244 39 795 618 435 993 84 2 733 438 810 40 234 428
1967 17 625 6 731 957 35 368 021 1 750 214 43 867 817 399 277 1 659 2 915 403 851 44 271 668
1968 19 968 7 681 132 40 437 057 1 928 260 50 066 417 338 583 3 860 3 170 345 613 50 412 030
1969 19 276 8 907 974 47 275 000 1 974 387 58 176 637 315 350 3 870 2 989 322 209 58 498 846
1970 25 273 9 560 782 54 441 500 2 271 334 66 298 889 467 205 4 653 3 680 475 538 66 774 427
1971 60 340 9 960 394 59 592 200 2 460 590 72 073 524 458 000 4 775 2 950 465 725 72 539 249
1972 451 427 12 412 936 67 967 400 2 204 520 83 036 283 350 563 5 243 2 725 358 531 83 394 814
1973 1 093 750 13 459 870 73 590 700 2 160 570 90 304 890 269 912 5 538 2 273 277 723 90 582 613
1974 966 334 11 624 793 73 354 200 2 018 796 87 964 123 213 507 5 163 2 469 221 139 88 185 262
1975 934 466 11 276 880 74 468 600 1 960 569 88 640 515 309 780 1 417 2 554 313 751 88 954 266
1976 1 025 769 10 829 493 75 237 500 1 902 526 88 995 288 140 439 249 2 816 143 504 89 138 792
1977 855 604 11 061 437 78 545 400 1 669 055 92 131 496 241 524 2 413 243 937 92 375 433
1978 618 833 9 989 327 77 493 700 1 553 650 89 655 510 352 999 2 408 355 407 90 010 917
1979 626 126 11 384 221 82 314 100 1 559 124 95 883 571 387 931 2 407 390 338 96 273 909
1980 494 183 8 966 949 77 358 300 1 590 646 88 410 078 445 232 354 2 406 447 992 88 858 070
1981 397 515 8 418 623 76 375 600 1 498 408 86 690 146 419 271 4 718 2 027 426 016 87 116 162
1982 261 509 7 878 862 78 522 400 1 620 413 88 283 184 436 451 3 678 1 663 441 792 88 724 976
1983 226 658 7 852 641 75 005 700 1 669 302 84 754 301 460 900 5 454 1 600 467 954 85 222 255
1984 234 616 8 275 865 81 112 100 2 126 406 91 748 987 608 000 1 200 609 200 92 358 187
1985 448 900 8 844 743 87 130 000 2 403 802 98 827 445 521 100 1 200 522 300 99 349 745
1986 393 000 8 489 812 82 272 000 2 747 803 93 902 615 503 800 1 200 505 000 94 407 615
1987 377 300 9 826 219 88 363 600 3 098 074 101 665 193 507 500 3 000 510 500 102 175 693
1988 293 000 10 312 123 100 805 700 4 687 692 116 098 515 503 422 1 700 505 122 116 603 637
1989 225 300 12 816 753 102 283 300 6 155 893 121 481 246 492 500 2 400 494 900 121 976 146
1990 200 000 11 799 958 104 220 200 6 938 944 123 159 102 449 100 2 400 451 500 123 610 602
1991 447 000 15 197 570 109 136 300 7 313 944 132 094 814 440 628 2 400 443 028 132 537 842
1992 722 000 16 228 698 121 277 300 7 472 216 145 700 214 427 100 2 400 429 500 146 129 714
1993 725 000 18 139 353 132 254 700 7 674 313 158 793 366 411 200 2 400 413 600 159 206 966
May 2017 Table 3.9

CANADIAN NATURAL GAS PRODUCTION*
1947 - 2016
Thousand Cubic Metres at 101.325 kPa and 15°C
British Western New Eastcoast Eastern
Territories Columbia Alberta Saskatchewan Canada Ontario Quebec Brunswick Offshore Canada Canada
1994 665 300 19 847 174 141 417 100 8 521 456 170 451 030 423 800 2 400 426 200 170 877 230
1995 639 000 21 818 492 148 198 600 8 718 458 179 374 550 456 300 2 400 458 700 179 833 250
1996 604 000 22 203 715 154 639 700 8 071 254 185 518 669 307 000 307 000 185 825 669
1997 571 000 23 762 261 156 674 700 7 819 744 188 827 706 269 000 269 000 189 096 706
1998 609 000 24 352 815 161 076 000 7 695 876 193 733 691 275 500 275 500 194 009 191
1999 639 000 24 802 952 165 186 500 7 911 247 198 539 699 421 700 421 700 198 961 399
2000 1 320 600 25 516 575 166 681 000 8 151 622 201 669 797 580 000 3 585 000 4 165 000 205 834 797
2001 1 946 551 29 072 320 163 527 000 8 288 934 202 834 805 354 900 5 375 348 5 730 248 208 565 053
2002 1 567 170 31 446 347 161 111 000 8 282 859 202 407 376 369 600 5 474 988 5 844 588 208 251 964
2003 1 235 500 29 653 157 157 581 733 8 848 279 197 318 669 384 600 11 794 4 557 339 4 953 733 202 272 402
2004 899 600 31 261 428 159 022 565 9 412 894 200 596 487 359 448 18 984 4 327 897 4 706 329 205 302 816
2005 701 363 31 847 342 159 828 625 9 501 465 201 878 795 346 554 18 081 4 221 847 4 586 482 206 465 277
2006 471 561 35 411 141 158 660 221 9 585 244 204 128 167 340 378 17 135 3 794 706 4 152 219 208 280 386
2007 424 858 31 932 619 157 588 344 8 870 336 198 816 156 292 731 157 317 4 403 035 4 853 083 203 669 239
2008 278 873 33 466 515 149 100 238 8 229 509 191 075 135 265 172 275 618 4 636 885 5 177 675 196 252 810
2009 253 198 32 929 762 137 790 020 7 670 082 178 643 061 238 662 238 437 3 582 579 4 059 679 182 702 740
2010 230 135 34 991 762 131 517 685 6 827 222 173 566 804 233 987 183 594 3 298 886 3 716 468 177 283 271
2011 209 467 41 441 414 123 052 814 6 167 443 170 871 138 224 781 162 810 2 829 809 3 217 400 174 088 538
2012 193 259 40 982 111 120 254 099 5 630 916 167 060 385 200 297 124 944 2 147 410 2 472 651 169 533 036
2013 133 483 44 567 314 117 775 308 5 538 343 168 014 448 185 720 111 790 1 921 106 2 218 616 170 233 064
2014 119 607 47 214 273 121 285 300 5 824 006 174 443 187 159 183 96 393 3 591 276 3 846 852 178 290 038
2015 86 272 48 971 333 124 753 971 5 796 902 179 608 478 160 648 56 683 2 157 699 2 375 030 181 983 507
2016 82 633 50 727 677 125 755 016 5 359 418 181 924 743 149 190 26 539 1 910 588 2 086 317 184 011 060
Total** 26 266 564 1 077 413 089 5 781 388 723 275 971 702 7 161 040 077 36 933 637 67 515 2 289 444 61 816 398 101 106 994 7 262 147 072
*Raw natural gas production less raw and processed gas injection.
May 2017 Table 3.9
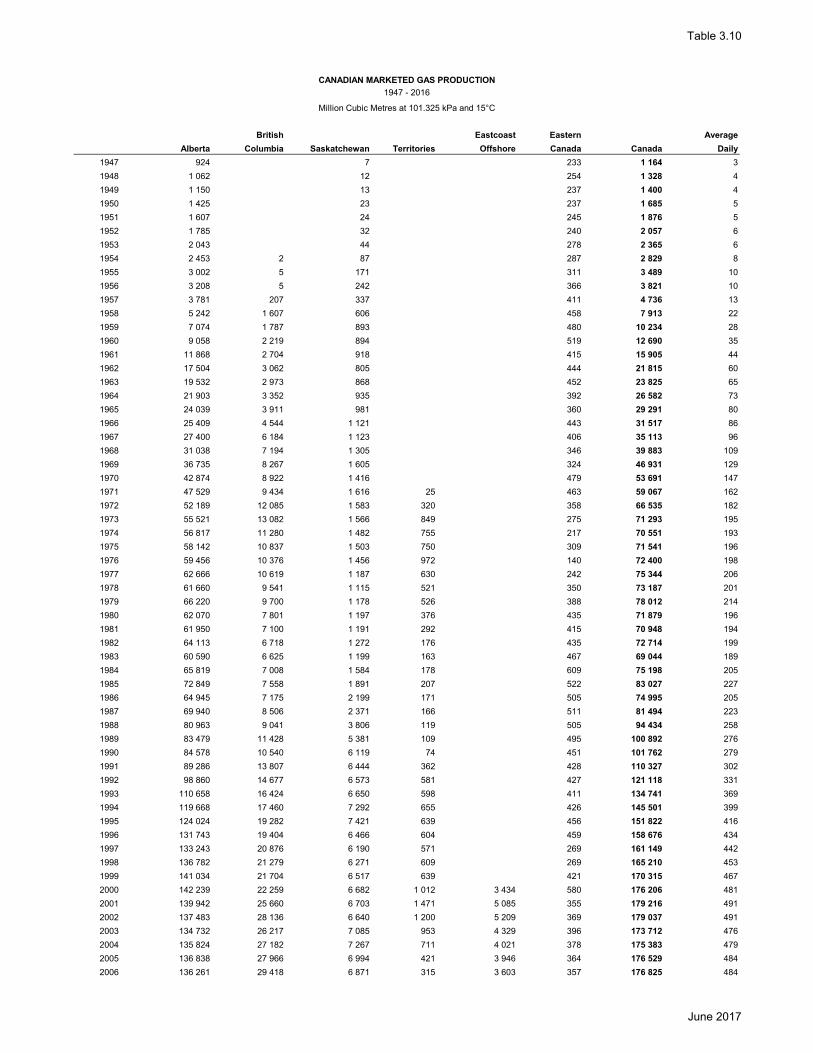
Table 3.10
1947 - 2016
Million Cubic Metres at 101.325 kPa and 15°C
British Eastcoast Eastern Average
Alberta Columbia Saskatchewan Territories Offshore Canada Canada Daily
1947 924 7 233 1 164 3
1948 1 062 12 254 1 328 4
1949 1 150 13 237 1 400 4
1950 1 425 23 237 1 685 5
1951 1 607 24 245 1 876 5
1952 1 785 32 240 2 057 6
1953 2 043 44 278 2 365 6
1954 2 453 2 87 287 2 829 8
1955 3 002 5 171 311 3 489 10
1956 3 208 5 242 366 3 821 10
1957 3 781 207 337 411 4 736 13
1958 5 242 1 607 606 458 7 913 22
1959 7 074 1 787 893 480 10 234 28
1960 9 058 2 219 894 519 12 690 35
1961 11 868 2 704 918 415 15 905 44
1962 17 504 3 062 805 444 21 815 60
1963 19 532 2 973 868 452 23 825 65
1964 21 903 3 352 935 392 26 582 73
1965 24 039 3 911 981 360 29 291 80
1966 25 409 4 544 1 121 443 31 517 86
1967 27 400 6 184 1 123 406 35 113 96
1968 31 038 7 194 1 305 346 39 883 109
1969 36 735 8 267 1 605 324 46 931 129
1970 42 874 8 922 1 416 479 53 691 147
1971 47 529 9 434 1 616 25 463 59 067 162
1972 52 189 12 085 1 583 320 358 66 535 182
1973 55 521 13 082 1 566 849 275 71 293 195
1974 56 817 11 280 1 482 755 217 70 551 193
1975 58 142 10 837 1 503 750 309 71 541 196
1976 59 456 10 376 1 456 972 140 72 400 198
1977 62 666 10 619 1 187 630 242 75 344 206
1978 61 660 9 541 1 115 521 350 73 187 201
1979 66 220 9 700 1 178 526 388 78 012 214
1980 62 070 7 801 1 197 376 435 71 879 196
1981 61 950 7 100 1 191 292 415 70 948 194
1982 64 113 6 718 1 272 176 435 72 714 199
1983 60 590 6 625 1 199 163 467 69 044 189
1984 65 819 7 008 1 584 178 609 75 198 205
1985 72 849 7 558 1 891 207 522 83 027 227
1986 64 945 7 175 2 199 171 505 74 995 205
1987 69 940 8 506 2 371 166 511 81 494 223
1988 80 963 9 041 3 806 119 505 94 434 258
1989 83 479 11 428 5 381 109 495 100 892 276
1990 84 578 10 540 6 119 74 451 101 762 279
1991 89 286 13 807 6 444 362 428 110 327 302
1992 98 860 14 677 6 573 581 427 121 118 331
1993 110 658 16 424 6 650 598 411 134 741 369
1994 119 668 17 460 7 292 655 426 145 501 399
1995 124 024 19 282 7 421 639 456 151 822 416
1996 131 743 19 404 6 466 604 459 158 676 434
1997 133 243 20 876 6 190 571 269 161 149 442
1998 136 782 21 279 6 271 609 269 165 210 453
1999 141 034 21 704 6 517 639 421 170 315 467
2000 142 239 22 259 6 682 1 012 3 434 580 176 206 481
2001 139 942 25 660 6 703 1 471 5 085 355 179 216 491
2002 137 483 28 136 6 640 1 200 5 209 369 179 037 491
2003 134 732 26 217 7 085 953 4 329 396 173 712 476
2004 135 824 27 182 7 267 711 4 021 378 175 383 479
2005 136 838 27 966 6 994 421 3 946 364 176 529 484
2006 136 261 29 418 6 871 315 3 603 357 176 825 484
CANADIAN MARKETED GAS PRODUCTION
June 2017

Table 3.10
1947 - 2016
Million Cubic Metres at 101.325 kPa and 15°C
British Eastcoast Eastern Average
Alberta Columbia Saskatchewan Territories Offshore Canada Canada Daily
CANADIAN MARKETED GAS PRODUCTION
2007 135 735 27 985 5 853 285 4 183 450 174 491 478
2008 127 953 28 919 5 786 187 4 405 541 167 790 458
2009 118 374 28 551 5 366 170 3 390 477 156 328 428
2010 112 804 30 578 4 402 154 3 122 418 151 478 415
2011 104 975 36 392 3 630 140 2 678 388 148 203 406
2012 102 521 36 457 2 976 129 2 032 325 144 441 395
2013 100 134 40 242 2 814 89 1 818 298 145 395 398
2014 102 389 42 682 2 546 80 3 399 256 151 351 415
2015 104 734 44 931 2 296 58 2 042 217 154 278 423
2016 105 427 47 130 2 583 55 1 808 176 157 179 429
Total 4 757 275 959 018 201 676 20 067 58 505 26 618 6 023 159
June 2017
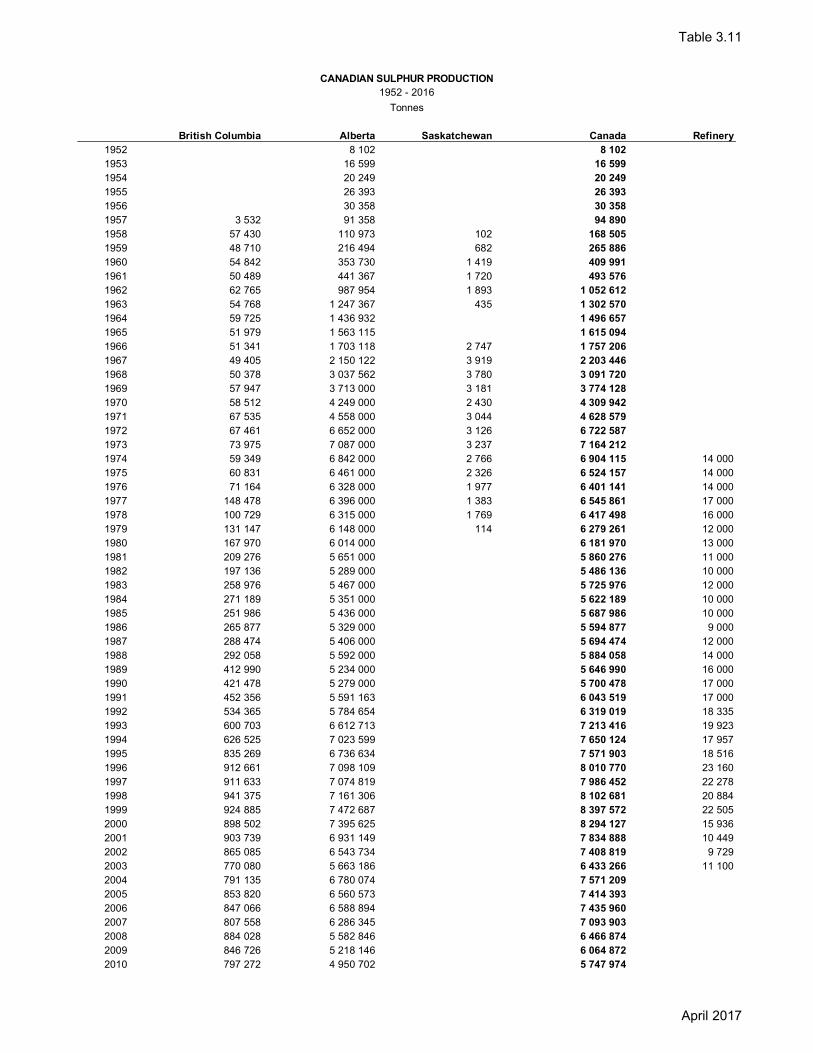
Table 3.11
British Columbia Alberta Saskatchewan Canada Refinery
1952 8 102 8 102
1953 16 599 16 599
1954 20 249 20 249
1955 26 393 26 393
1956 30 358 30 358
1957 3 532 91 358 94 890
1958 57 430 110 973 102 168 505
1959 48 710 216 494 682 265 886
1960 54 842 353 730 1 419 409 991
1961 50 489 441 367 1 720 493 576
1962 62 765 987 954 1 893 1 052 612
1963 54 768 1 247 367 435 1 302 570
1964 59 725 1 436 932 1 496 657
1965 51 979 1 563 115 1 615 094
1966 51 341 1 703 118 2 747 1 757 206
1967 49 405 2 150 122 3 919 2 203 446
1968 50 378 3 037 562 3 780 3 091 720
1969 57 947 3 713 000 3 181 3 774 128
1970 58 512 4 249 000 2 430 4 309 942
1971 67 535 4 558 000 3 044 4 628 579
1972 67 461 6 652 000 3 126 6 722 587
1973 73 975 7 087 000 3 237 7 164 212
1974 59 349 6 842 000 2 766 6 904 115 14 000
1975 60 831 6 461 000 2 326 6 524 157 14 000
1976 71 164 6 328 000 1 977 6 401 141 14 000
1977 148 478 6 396 000 1 383 6 545 861 17 000
1978 100 729 6 315 000 1 769 6 417 498 16 000
1979 131 147 6 148 000 114 6 279 261 12 000
1980 167 970 6 014 000 6 181 970 13 000
1981 209 276 5 651 000 5 860 276 11 000
1982 197 136 5 289 000 5 486 136 10 000
1983 258 976 5 467 000 5 725 976 12 000
1984 271 189 5 351 000 5 622 189 10 000
1985 251 986 5 436 000 5 687 986 10 000
1986 265 877 5 329 000 5 594 877 9 000
1987 288 474 5 406 000 5 694 474 12 000
1988 292 058 5 592 000 5 884 058 14 000
1989 412 990 5 234 000 5 646 990 16 000
1990 421 478 5 279 000 5 700 478 17 000
1991 452 356 5 591 163 6 043 519 17 000
1992 534 365 5 784 654 6 319 019 18 335
1993 600 703 6 612 713 7 213 416 19 923
1994 626 525 7 023 599 7 650 124 17 957
1995 835 269 6 736 634 7 571 903 18 516
1996 912 661 7 098 109 8 010 770 23 160
1997 911 633 7 074 819 7 986 452 22 278
1998 941 375 7 161 306 8 102 681 20 884
1999 924 885 7 472 687 8 397 572 22 505
2000 898 502 7 395 625 8 294 127 15 936
2001 903 739 6 931 149 7 834 888 10 449
2002 865 085 6 543 734 7 408 819 9 729
2003 770 080 5 663 186 6 433 266 11 100
2004 791 135 6 780 074 7 571 209
2005 853 820 6 560 573 7 414 393
2006 847 066 6 588 894 7 435 960
2007 807 558 6 286 345 7 093 903
2008 884 028 5 582 846 6 466 874
2009 846 726 5 218 146 6 064 872
2010 797 272 4 950 702 5 747 974
CANADIAN SULPHUR PRODUCTION
1952 - 2016
Tonnes
April 2017

Table 3.11
British Columbia Alberta Saskatchewan Canada Refinery
CANADIAN SULPHUR PRODUCTION
1952 - 2016
Tonnes
2011 829 415 4 719 532 5 548 947
2012 762 399 4 396 405 5 158 804
2013 727 218 4 469 046 5 196 265
2014 654 845 4 154 645 4 809 490
2015 653 999 4 023 973 4 677 972
2016 405 477 3 741 014 4 146 492
Total 24 568 040 292 800 366 42 050 317 410 456 448 772
Note: No production from gas plants prior to 1952.
Alberta excludes refinery production but includes oil sands plants.
Refinery production no longer available
April 2017

Table 3.12
1952 - 2016
Tonnes
British Columbia Alberta Saskatchewan Canada
1952 - 3 832 - 3 832
1953 - 14 580 - 14 580
1954 - 16 932 - 16 932
1955 - 23 565 - 23 565
1956 - 31 555 - 31 555
1957 - 84 665 - 84 665
1958 - 83 037 - 83 037
1959 41 020 87 670 340 129 030
1960 32 797 211 832 656 245 285
1961 48 156 307 606 2 710 358 472
1962 52 423 569 883 1 120 623 426
1963 68 763 1 060 908 47 1 129 718
1964 62 766 1 544 879 153 1 607 798
1965 80 544 1 765 777 958 1 847 279
1966 70 801 1 754 422 1 872 1 827 095
1967 50 657 2 169 259 3 850 2 223 766
1968 48 728 2 244 729 3 061 2 296 518
1969 49 031 2 610 000 2 751 2 661 782
1970 52 254 3 121 000 - 3 173 254
1971 53 680 2 715 000 1 025 2 769 705
1972 51 366 3 155 000 1 717 3 208 083
1973 55 016 4 064 000 2 860 4 121 876
1974 53 770 4 977 000 3 470 5 034 240
1975 38 530 3 835 000 3 638 3 877 168
1976 29 200 3 964 000 3 003 3 996 203
1977 41 749 5 137 000 2 308 5 181 057
1978 99 603 5 650 000 2 368 5 751 971
1979 146 189 6 147 000 2 440 6 295 629
1980 141 733 7 489 000 1 546 7 632 279
1981 244 068 7 709 000 - 7 953 068
1982 277 256 6 570 000 - 6 847 256
1983 258 427 6 228 000 - 6 486 427
1984 270 543 7 956 000 - 8 226 543
1985 263 733 7 831 000 - 8 094 733
1986 266 596 6 622 000 - 6 888 596
1987 298 877 6 936 000 - 7 234 877
1988 300 828 7 801 000 - 8 101 828
1989 433 261 5 786 000 - 6 219 261
1990 420 687 6 279 000 - 6 699 687
1991 453 190 6 265 372 - 6 718 562
1992 536 844 5 383 984 - 5 920 828
1993 597 720 4 257 156 - 4 854 876
1994 626 658 4 852 896 - 5 479 554
1995 835 268 5 952 813 - 6 788 081
1996 912 661 6 127 478 - 7 040 139
1997 910 518 6 618 329 - 7 528 847
1998 942 984 6 098 138 - 7 041 122
1999 924 887 6 852 076 - 7 776 963
2000 898 502 6 711 754 - 7 610 256
2001 901 773 5 640 888 - 6 542 661
2002 810 818 5 525 137 - 6 335 955
2003 740 106 6 168 463 - 6 908 569
2004 777 891 6 691 194 - 7 469 085
CANADIAN SULPHUR SALES
April 2017

Table 3.12
1952 - 2016
Tonnes
British Columbia Alberta Saskatchewan Canada
CANADIAN SULPHUR SALES
2005 847 561 6 348 445 - 7 196 006
2006 818 394 6 849 462 - 7 667 856
2007 828 444 6 521 690 - 7 350 134
2008 901 213 5 468 163 - 6 369 376
2009 842 980 4 249 327 - 5 092 306
2010 704 384 4 620 922 - 5 325 306
2011 809 880 3 280 288 - 4 090 168
2012 712 274 2 930 193 - 3 642 467
2013 716 621 2 753 138 - 3 469 759
2014 633 805 2 689 403 - 3 323 208
2015 665 483 2 869 597 - 3 535 080
2016 362 263 2 819 524 3 181 787
Total 24 116 173 269 102 958 41 893 293 261 024
April 2017

Table 3.13
Tonnes
British Columbia Alberta Saskatchewan Canada
1952 2 877 2 877
1953 5 324 5 324
1954 7 388 7 388
1955 10 346 10 346
1956 8 742 8 742
1957 3 532 15 811 19 343
1958 60 325 40 264 102 100 691
1959 67 789 167 501 443 235 733
1960 88 724 305 073 1 145 394 942
1961 91 764 437 022 207 528 993
1962 102 107 852 608 879 955 594
1963 87 531 1 031 031 1 261 1 119 823
1964 84 490 914 270 1 107 999 867
1965 55 916 697 916 753 832
1966 36 361 621 594 865 658 820
1967 35 137 624 205 935 660 277
1968 36 696 1 405 109 1 653 1 443 458
1969 45 829 2 460 000 2 083 2 507 912
1970 52 087 3 591 000 4 513 3 647 600
1971 80 536 5 392 000 6 556 5 479 092
1972 96 631 8 788 000 8 143 8 892 774
1973 115 590 11 808 000 8 572 11 932 162
1974 121 170 13 676 000 7 874 13 805 044
1975 143 478 16 280 000 6 562 16 430 040
1976 185 442 18 639 000 5 539 18 829 981
1977 292 170 19 944 000 4 607 20 240 777
1978 293 296 20 599 000 3 953 20 896 249
1979 278 254 20 577 000 1 546 20 856 800
1980 304 491 18 867 000 19 171 491
1981 269 699 16 967 000 17 236 699
1982 189 579 15 576 000 15 765 579
1983 190 128 14 739 000 14 929 128
1984 190 774 12 063 000 12 253 774
1985 179 027 9 729 000 9 908 027
1986 178 308 8 489 000 8 667 308
1987 167 905 7 080 000 7 247 905
1988 159 135 4 999 000 5 158 135
1989 138 864 4 400 000 4 538 864
1990 138 073 3 287 000 3 425 073
1991 137 239 2 831 192 2 968 431
1992 134 760 3 229 848 3 364 608
1993 137 743 5 561 593 5 699 336
1994 59 106 7 855 265 7 914 371
1995 67 425 8 675 073 8 742 498
CANADIAN SULPHUR INVENTORY
1952 - 2016
April 2017

Table 3.13
Tonnes
British Columbia Alberta Saskatchewan Canada
CANADIAN SULPHUR INVENTORY
1952 - 2016
1996 62 122 9 677 885 9 740 007
1997 67 930 10 153 983 10 221 913
1998 66 321 11 233 637 11 299 958
1999 68 869 11 865 680 11 934 549
2000 98 342 12 332 796 12 431 138
2001 130 507 13 829 023 13 959 530
2002 184 773 14 136 978 14 321 751
2003 238 011 13 862 132 14 100 143
2004 251 255 13 357 740 13 608 995
2005 257 514 12 691 492 12 949 006
2006 286 186 12 111 474 12 397 660
2007 265 300 11 816 234 12 081 535
2008 248 116 11 631 654 11 879 770
2009 251 862 12 253 946 12 505 808
2010 344 750 11 738 921 12 083 671
2011 363 730 11 273 132 11 636 862
2012 349 663 10 980 496 11 330 159
2013 360 651 10 920 178 11 280 829
2014 381 691 11 181 621 11 563 312
2015 370 207 11 155 492 11 525 699
2016 413 421 11 243 912 11 657 334
April 2017
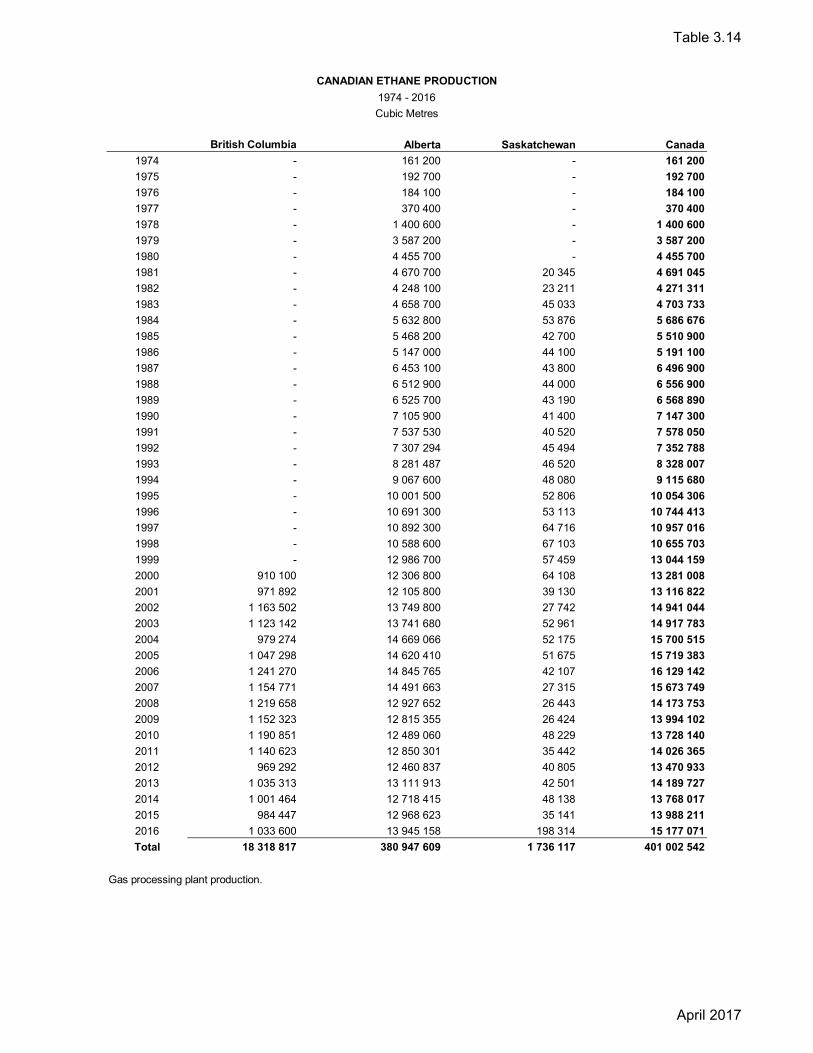
Table 3.14
British Columbia Alberta Saskatchewan Canada
1974 - 161 200 - 161 200
1975 - 192 700 - 192 700
1976 - 184 100 - 184 100
1977 - 370 400 - 370 400
1978 - 1 400 600 - 1 400 600
1979 - 3 587 200 - 3 587 200
1980 - 4 455 700 - 4 455 700
1981 - 4 670 700 20 345 4 691 045
1982 - 4 248 100 23 211 4 271 311
1983 - 4 658 700 45 033 4 703 733
1984 - 5 632 800 53 876 5 686 676
1985 - 5 468 200 42 700 5 510 900
1986 - 5 147 000 44 100 5 191 100
1987 - 6 453 100 43 800 6 496 900
1988 - 6 512 900 44 000 6 556 900
1989 - 6 525 700 43 190 6 568 890
1990 - 7 105 900 41 400 7 147 300
1991 - 7 537 530 40 520 7 578 050
1992 - 7 307 294 45 494 7 352 788
1993 - 8 281 487 46 520 8 328 007
1994 - 9 067 600 48 080 9 115 680
1995 - 10 001 500 52 806 10 054 306
1996 - 10 691 300 53 113 10 744 413
1997 - 10 892 300 64 716 10 957 016
1998 - 10 588 600 67 103 10 655 703
1999 - 12 986 700 57 459 13 044 159
2000 910 100 12 306 800 64 108 13 281 008
2001 971 892 12 105 800 39 130 13 116 822
2002 1 163 502 13 749 800 27 742 14 941 044
2003 1 123 142 13 741 680 52 961 14 917 783
2004 979 274 14 669 066 52 175 15 700 515
2005 1 047 298 14 620 410 51 675 15 719 383
2006 1 241 270 14 845 765 42 107 16 129 142
2007 1 154 771 14 491 663 27 315 15 673 749
2008 1 219 658 12 927 652 26 443 14 173 753
2009 1 152 323 12 815 355 26 424 13 994 102
2010 1 190 851 12 489 060 48 229 13 728 140
2011 1 140 623 12 850 301 35 442 14 026 365
2012 969 292 12 460 837 40 805 13 470 933
2013 1 035 313 13 111 913 42 501 14 189 727
2014 1 001 464 12 718 415 48 138 13 768 017
2015 984 447 12 968 623 35 141 13 988 211
2016 1 033 600 13 945 158 198 314 15 177 071
Total 18 318 817 380 947 609 1 736 117 401 002 542
Gas processing plant production.
CANADIAN ETHANE PRODUCTION
1974 - 2016
Cubic Metres
April 2017

Table 3.15
Conventional Mining/
Light & Heavy Upgrading In-situ Pentanes
Crude Oil Crude Oil Bitumen Plus Total
1947 4 4
1948 6 6
1949 10 10
1950 15 15
1951 25 25
1952 30 30
1953 50 50
1954 60 60
1955 80 80
1956 122 122
1957 139 139
1958 149 1 150
1959 156 1 157
1960 165 1 166
1961 173 2 175
1962 184 5 189
1963 196 8 204
1964 216 11 227
1965 260 12 272
1966 280 13 293
1967 289 13 302
1968 298 2 14 314
1969 308 4 17 329
1970 316 5 19 340
1971 318 7 20 345
1972 320 8 26 354
1973 323 8 27 358
1974 314 7 25 346
1975 293 7 1 24 325
1976 286 8 1 21 316
1977 271 7 1 21 300
1978 251 9 1 19 280
1979 226 14 2 19 261
1980 218 20 2 17 257
1981 211 17 2 16 246
1982 200 16 4 16 236
1983 199 24 4 15 242
1984 208 21 5 15 249
1985 213 26 8 16 263
Thousand Cubic Metres Per Day
CANADIAN CRUDE OIL & EQUIVALENT PRODUCTIVE CAPACITY
1947 - 2016
August 2017

Table 3.15
Conventional Mining/
Light & Heavy Upgrading In-situ Pentanes
Crude Oil Crude Oil Bitumen Plus Total
Thousand Cubic Metres Per Day
CANADIAN CRUDE OIL & EQUIVALENT PRODUCTIVE CAPACITY
1947 - 2016
1986 209 29 15 16 269
1987 204 29 18 17 268
1988 206 31 21 19 277
1989 195 36 20 19 270
1990 195 32 22 19 268
1991 190 36 19 19 264
1992 200 38 20 21 279
1993 207 39 21 23 290
1994 222 42 22 25 311
1995 226 44 24 27 321
1996 230 45 26 28 329
1997 230 46 38 33 347
1998 222 50 45 33 350
1999 215 53 45 33 346
2000 222 51 46 31 350
2001 222 61 49 32 364
2002 239 70 48 29 386
2003 233 82 56 26 397
2004 223 97 61 26 407
2005 217 88 72 28 405
2006 214 104 73 28 419
2007 221 109 79 28 438
2008 214 104 87 26 432
2009 193 121 107 24 446
2010 195 123 112 24 453
2011 200 132 125 23 481
2012 208 139 144 23 514
2013 219 147 161 24 552
2014 222 158 186 28 594
2015 226 151 212 29 619
2016 191 157 223 37 608
NOTE: Represents annual average capacity.
August 2017

Table 3.16
1971 - 2016
Thousand Cubic Metres Per Day
Light Pentanes Synthetic Crude Oil Heavy Crude Bitumen Total
1971 176.2 20.0 6.7 32.1 235.0
1972 202.5 25.8 8.1 33.0 269.4
1973 241.7 26.4 7.9 35.2 0.2 311.4
1974 229.4 25.3 7.3 30.4 0.2 292.6
1975 194.7 23.7 6.8 24.8 0.5 250.5
1976 174.1 20.8 7.6 25.5 1.2 229.2
1977 170.1 20.7 7.2 30.8 1.3 230.1
1978 167.4 18.5 8.9 31.1 1.2 227.1
1979 189.9 18.3 14.5 31.6 1.6 255.9
1980 175.2 16.5 20.4 30.6 1.5 244.2
1981 156.1 15.9 17.2 28.1 2.1 219.4
1982 151.5 15.6 16.4 27.7 3.5 214.7
1983 154.9 14.5 23.7 31.1 4.0 228.2
1984 165.3 15.0 21.3 36.6 5.3 243.5
1985 159.6 15.8 26.2 39.2 8.3 249.1
1986 149.7 16.1 29.4 39.9 14.8 249.9
1987 153.9 17.2 28.7 42.9 18.4 261.1
1988 158.1 18.3 31.9 45.4 20.6 274.3
1989 148.2 18.8 32.6 46.2 20.5 266.3
1990 142.1 18.4 33.1 49.8 21.5 264.9
1991 136.9 19.4 35.9 53.1 19.5 264.8
1992 136.0 21.4 37.6 60.5 20.1 275.6
1993 145.1 23.2 38.7 61.7 21.1 289.8
1994 149.3 24.0 41.6 64.6 21.4 300.9
1995 146.0 24.6 44.7 72.8 23.6 311.7
1996 141.8 27.0 44.6 78.8 26.0 318.2
1997 136.1 29.4 46.0 85.1 37.8 334.4
1998 140.4 29.8 49.0 87.0 44.9 351.1
1999 129.5 30.9 51.4 83.9 38.8 334.5
2000 131.6 30.9 50.8 89.0 45.8 348.2
2001 127.5 29.5 55.5 91.0 49.0 352.6
2002 141.3 25.9 69.8 88.0 47.9 373.0
2003 144.5 25.1 72.2 87.0 55.5 384.4
2004 136.1 28.0 102.4 86.9 59.3 412.7
2005 132.2 27.4 86.8 83.6 66.7 396.7
2006 143.3 22.0 104.3 72.6 74.4 416.5
2007 153.2 21.9 109.2 70.3 80.1 434.7
2008 152.1 20.7 103.8 65.3 87.5 429.4
2009 135.8 19.5 122.4 60.5 90.5 428.8
2010 138.0 18.8 127.4 59.7 108.1 452.0
2011 142.4 18.5 137.3 60.8 121.1 480.1
2012 146.6 18.1 143.5 64.6 142.3 515.2
2013 157.8 19.3 148.8 65.1 160.8 551.9
2014 161.9 22.6 151.7 66.2 192.6 595.0
2015 145.0 28.3 155.2 61.2 223.5 613.1
2016 144.0 30.4 147.7 58.0 236.1 616.2
CANADIAN CRUDE OIL & EQUIVALENT PRODUCTION BY TYPE
August 2017
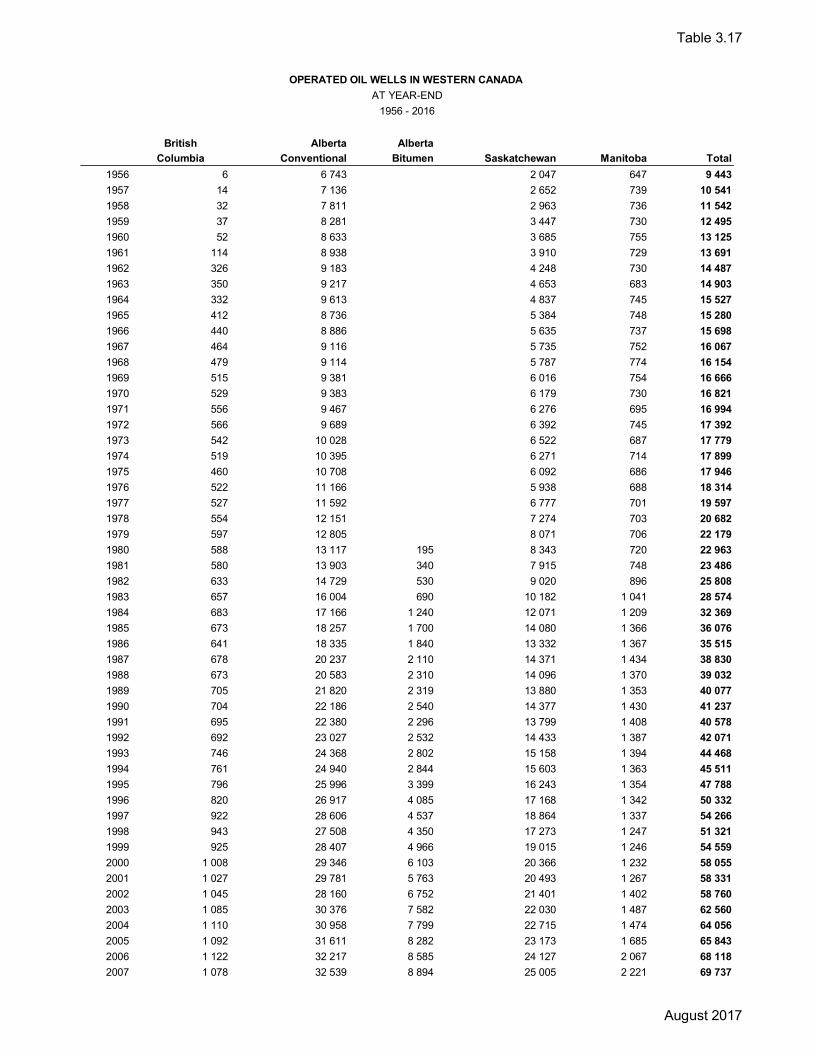
Table 3.17
British Alberta Alberta
Columbia Conventional Bitumen Saskatchewan Manitoba Total
1956 6 6 743 2 047 647 9 443
1957 14 7 136 2 652 739 10 541
1958 32 7 811 2 963 736 11 542
1959 37 8 281 3 447 730 12 495
1960 52 8 633 3 685 755 13 125
1961 114 8 938 3 910 729 13 691
1962 326 9 183 4 248 730 14 487
1963 350 9 217 4 653 683 14 903
1964 332 9 613 4 837 745 15 527
1965 412 8 736 5 384 748 15 280
1966 440 8 886 5 635 737 15 698
1967 464 9 116 5 735 752 16 067
1968 479 9 114 5 787 774 16 154
1969 515 9 381 6 016 754 16 666
1970 529 9 383 6 179 730 16 821
1971 556 9 467 6 276 695 16 994
1972 566 9 689 6 392 745 17 392
1973 542 10 028 6 522 687 17 779
1974 519 10 395 6 271 714 17 899
1975 460 10 708 6 092 686 17 946
1976 522 11 166 5 938 688 18 314
1977 527 11 592 6 777 701 19 597
1978 554 12 151 7 274 703 20 682
1979 597 12 805 8 071 706 22 179
1980 588 13 117 195 8 343 720 22 963
1981 580 13 903 340 7 915 748 23 486
1982 633 14 729 530 9 020 896 25 808
1983 657 16 004 690 10 182 1 041 28 574
1984 683 17 166 1 240 12 071 1 209 32 369
1985 673 18 257 1 700 14 080 1 366 36 076
1986 641 18 335 1 840 13 332 1 367 35 515
1987 678 20 237 2 110 14 371 1 434 38 830
1988 673 20 583 2 310 14 096 1 370 39 032
1989 705 21 820 2 319 13 880 1 353 40 077
1990 704 22 186 2 540 14 377 1 430 41 237
1991 695 22 380 2 296 13 799 1 408 40 578
1992 692 23 027 2 532 14 433 1 387 42 071
1993 746 24 368 2 802 15 158 1 394 44 468
1994 761 24 940 2 844 15 603 1 363 45 511
1995 796 25 996 3 399 16 243 1 354 47 788
1996 820 26 917 4 085 17 168 1 342 50 332
1997 922 28 606 4 537 18 864 1 337 54 266
1998 943 27 508 4 350 17 273 1 247 51 321
1999 925 28 407 4 966 19 015 1 246 54 559
2000 1 008 29 346 6 103 20 366 1 232 58 055
2001 1 027 29 781 5 763 20 493 1 267 58 331
2002 1 045 28 160 6 752 21 401 1 402 58 760
2003 1 085 30 376 7 582 22 030 1 487 62 560
2004 1 110 30 958 7 799 22 715 1 474 64 056
2005 1 092 31 611 8 282 23 173 1 685 65 843
2006 1 122 32 217 8 585 24 127 2 067 68 118
2007 1 078 32 539 8 894 25 005 2 221 69 737
OPERATED OIL WELLS IN WESTERN CANADA
AT YEAR-END
1956 - 2016
August 2017
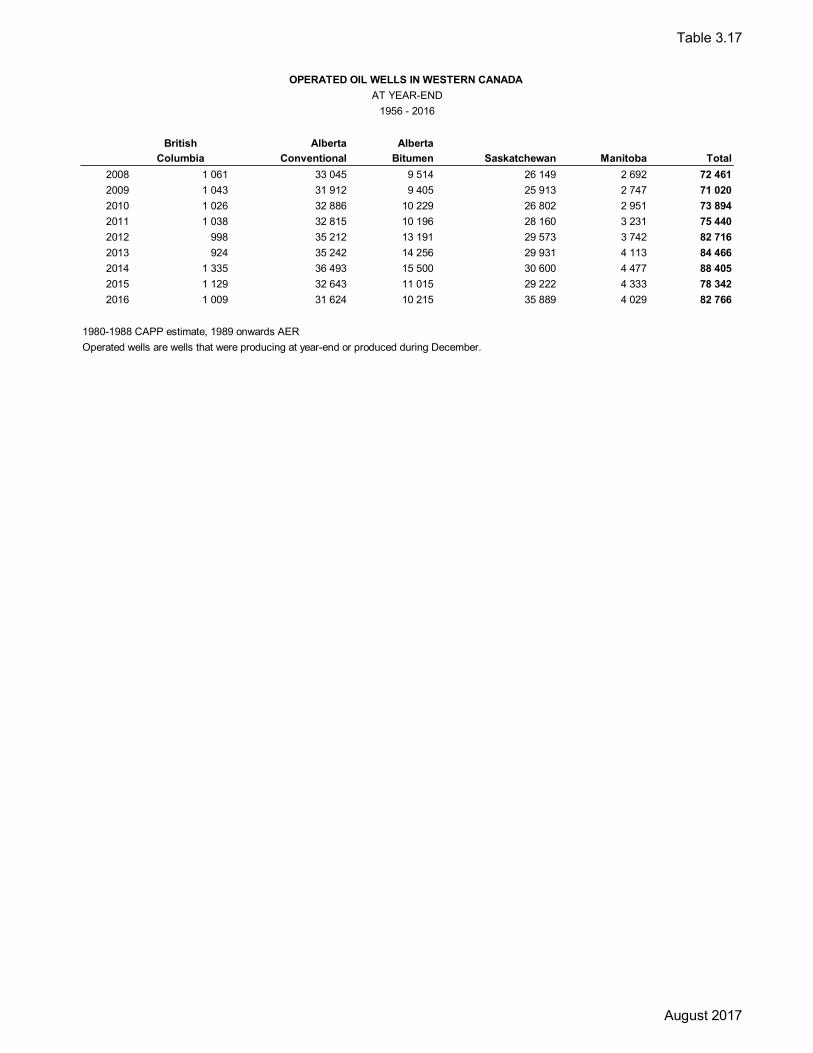
Table 3.17
British Alberta Alberta
Columbia Conventional Bitumen Saskatchewan Manitoba Total
OPERATED OIL WELLS IN WESTERN CANADA
AT YEAR-END
1956 - 2016
2008 1 061 33 045 9 514 26 149 2 692 72 461
2009 1 043 31 912 9 405 25 913 2 747 71 020
2010 1 026 32 886 10 229 26 802 2 951 73 894
2011 1 038 32 815 10 196 28 160 3 231 75 440
2012 998 35 212 13 191 29 573 3 742 82 716
2013 924 35 242 14 256 29 931 4 113 84 466
2014 1 335 36 493 15 500 30 600 4 477 88 405
2015 1 129 32 643 11 015 29 222 4 333 78 342
2016 1 009 31 624 10 215 35 889 4 029 82 766
1980-1988 CAPP estimate, 1989 onwards AER
Operated wells are wells that were producing at year-end or produced during December.
August 2017

Table 3.18
British Columbia Alberta ConventionalAlberta CBM
and ShaleSaskatchewan Western Canada
1956 1 368 61 430
1957 42 422 70 534
1958 77 575 88 740
1959 81 681 85 847
1960 104 758 98 960
1961 138 894 102 1,134
1962 175 995 95 1,265
1963 213 1,213 102 1,528
1964 226 1,372 149 1,747
1965 248 1,502 195 1,945
1966 245 1,527 217 1,989
1967 255 1,647 251 2,153
1968 270 1,924 294 2,488
1969 286 2,194 323 2,803
1970 282 2,490 364 3,136
1971 305 2,830 409 3,544
1972 321 3,318 439 4,078
1973 325 3,769 455 4,549
1974 340 4,508 503 5,351
1975 346 5,704 558 6,608
1976 395 7,753 605 8,753
1977 457 10,806 642 11,905
1978 572 12,785 576 13,933
1979 616 14,760 698 16,074
1980 604 16,661 724 17,989
1981 487 18,797 767 20,051
1982 591 20,611 795 21,997
1983 616 21,881 930 23,427
1984 621 22,839 1,357 24,817
1985 628 24,424 1,614 26,666
1986 637 24,648 1,915 27,200
1987 671 25,453 2,106 28,230
1988 675 27,167 3,215 31,057
1989 717 27,051 3,914 31,682
1990 733 27,291 4,917 32,941
1991 838 27,998 5,365 34,201
1992 886 30,074 5,531 36,491
1993 933 31,362 6,375 38,670
1994 989 34,126 7,299 42,414
1995 1,103 35,458 7,604 44,165
1996 1,215 36,940 7,488 45,643
1997 1,388 39,687 7,916 48,991
1998 1,601 42,627 8,357 52,585
1999 1,922 47,130 10,483 59,535
2000 2,302 53,263 9,406 64,971
2001 2,697 60,290 12,071 75,058
OPERATED GAS WELLS IN WESTERN CANADA
AT YEAR-END
1956 - 2016
August 2017

Table 3.18
British Columbia Alberta ConventionalAlberta CBM
and ShaleSaskatchewan Western Canada
OPERATED GAS WELLS IN WESTERN CANADA
AT YEAR-END
1956 - 2016
2002 3,066 69,429 13,710 86,205
2003 3,569 73,535 15,175 92,279
2004 4,385 85,071 16,611 106,067
2005 5,217 91,927 3,120 17,890 118,154
2006 6,608 101,684 5,971 18,691 132,954
2007 6,607 95,853 9,862 19,538 131,860
2008 7,157 101,073 10,742 20,348 139,320
2009 7,129 98,698 13,513 20,162 139,502
2010 7,307 97,430 15,308 19,740 139,785
2011 7,727 94,987 17,662 19,111 139,487
2012 7,310 101,009 18,747 18,127 145,193
2013 8,051 98,515 19,555 17,753 143,874
2014 9,563 103,879 20,901 16,932 151,275
2015 9,018 93,358 21,294 16,340 140,010
2016 8,550 89,950 21,384 16,897 136,781
Note: Operated wells are wells that were producing at year-end or produced during December.
August 2017

CAPP Statistical Handbook
Section 4
Expenditures/Revenue Table # Net Cash Expenditures of the Petroleum Industry by Province Current Year .......................................................................................................................................... 4.1 Net Cash Expenditures of the Petroleum Industry (Canada) 1947 – Present ...................................................................................................................................... 4.2 Net Cash Expenditures of the Petroleum Industry (Alberta) 1947 – Present ...................................................................................................................................... 4.3 Net Cash Expenditures of the Petroleum Industry (Saskatchewan) 1947 – Present ...................................................................................................................................... 4.4 Net Cash Expenditures of the Petroleum Industry (British Columbia) 1948 – Present ...................................................................................................................................... 4.5 Net Cash Expenditures of the Petroleum Industry (Territories & Arctic Islands) 1951 - Present ....................................................................................................................................... 4.6 Net Cash Expenditures of the Petroleum Industry (Manitoba) 1951 – Present ...................................................................................................................................... 4.7 Net Cash Expenditures of the Petroleum Industry (Ontario) 1968 - Present ....................................................................................................................................... 4.8 Net Cash Expenditures of the Petroleum Industry (Quebec) 1969 – Present ...................................................................................................................................... 4.9 Net Cash Expenditures of the Petroleum Industry (Atlantic Provinces) 1969 - Present ....................................................................................................................................... 4.10 Net Cash Expenditures of the Petroleum Industry (Eastcoast - Offshore) Discontinued 1967 - 1994 ............................................................................................................................................ 4.11 Net Cash Expenditures of the Petroleum Industry (Offshore Newfoundland) 1995-Present ......................................................................................................................................... 4.12
CAPP Statistical Handbook
Net Cash Expenditures of the Petroleum Industry (Offshore Nova Scotia) 1995-Present ......................................................................................................................................... 4.13 Canada Oil Sands Expenditures 1958 – Present ...................................................................................................................................... 4.16 Value of Producers' Sales (Territories) 1947 – Present ...................................................................................................................................... 4.17 Value of Producers' Sales (British Columbia) 1947 – Present ...................................................................................................................................... 4.18 Value of Producers' Sales (Alberta) 1947 – Present ...................................................................................................................................... 4.19 Value of Producers' Sales (Saskatchewan) 1947 – Present ...................................................................................................................................... 4.20 Value of Producers' Sales (Manitoba) 1947 – Present ...................................................................................................................................... 4.21 Value of Producers' Sales (Western Canada) 1947 – Present ...................................................................................................................................... 4.22 Value of Producers' Sales (Eastern Canada) 1947 – Present ...................................................................................................................................... 4.23 Value of Producers Sales (Eastcoast Offshore) 1992 - Present ....................................................................................................................................... 4.24 Value of Producers' Sales (Canada) 1947 – Present ...................................................................................................................................... 4.25

British Atlantic Newfoundland Nova Scotia
Alberta Saskatchewan Columbia Territories Manitoba Ontario Quebec Provinces Offshore Offshore CANADA
EXPLORATION
(a) Geological & geophysical 159 46 38 na 3 na na na 238 - 504
(b) Drilling 791 23 253 na 7 - na na 690 - 1 800
(c) Land acquisitions & rentals 687 108 52 na 13 - na - 15 - 876
Total 1 637 177 343 na 23 na na - 943 - 3 180
DEVELOPMENT
(a) Drilling 6 164 1 560 1 249 na 98 - - na 757 - 9 832
(b) Field equipment 2 695 933 653 na 108 na na - 3 747 0 8 138
(c) Enhanced recovery & pressure maintenance 45 131 3 - 18 - - - (0) - 197
(d) Natural gas plants 639 22 252 - (0) - - 4 - - 917
Total 9 543 2 646 2 158 na 224 na na na 4 504 0 19 084
TOTAL CAPITAL EXPENDITURES 11 180 2 823 2 500 46 247 1 11 8 5 447 0 22 264
OPERATING
(a) Field, well & gathering operations 10 016 2 585 1 983 na 156 na na na 821 111 15 709
(b) Natural gas plants 1 530 59 465 na 2 na na na - 90 2 153
Total 11 546 2 644 2 448 na 158 10 na na 821 201 17 862
ROYALTIES * 1 255 766 170 na 91 5 na na 485 9 2 789
TOTAL EXPENDITURES 23 981 6 233 5 119 80 496 16 11 16 6 753 210 42 915
NOTE: Net Cash Expenditures, except for royalties, do not include inter-industry transactions. This survey represents close to 95% of industry based on production.
Oil sands expenditures are published on Table 4.14
*Net of incentives
"na" due to Statistics Canada data suppression
2016 NET CASH EXPENDITURES OF THE PETROLEUM INDUSTRY
Million Dollars
October 2017 Table 4.1

Canada
EXPLORATION** DEVELOPMENT** CAPITAL EXPENDITURES OPERATING ROYALTIES* TOTAL
Geological &
Geophysical Drilling Land Other Total Drilling
Field
equipment EOR Gas Plants Other Total
Wells & flow
lines Gas Plants Other Total
1947 4 6 8 2 20 5 1 2 8 28 2 2 2 31
1948 11 9 12 2 33 20 6 4 30 63 4 1 5 2 70
1949 17 15 34 3 69 29 9 4 7 48 117 10 2 1 13 5 135
1950 29 14 55 5 102 42 12 4 12 69 171 13 4 1 17 7 194
1951 47 34 44 9 135 51 11 2 13 77 212 18 4 2 23 12 246
1952 67 44 66 12 188 67 17 2 13 99 287 24 4 2 29 16 332
1953 65 43 64 15 187 73 19 1 1 11 104 291 31 4 4 39 21 350
1954 60 50 117 13 240 63 17 1 3 15 99 338 36 3 4 43 27 408
1955 62 62 113 22 258 98 25 2 6 21 151 410 43 3 4 51 34 494
1956 57 72 128 23 280 136 38 2 19 26 219 499 55 4 8 67 46 612
1957 52 65 134 31 281 119 35 4 32 24 214 495 61 6 11 78 49 622
1958 54 73 114 33 274 99 27 6 41 9 182 456 70 9 16 95 42 592
1959 50 68 145 31 294 93 32 5 14 18 161 456 74 12 14 100 46 602
1960 51 70 114 31 265 116 33 7 21 16 192 457 80 12 22 114 49 620
1961 52 73 114 20 259 138 34 7 62 10 251 510 84 23 20 127 73 710
1962 49 72 103 33 256 116 29 11 21 16 194 450 91 31 23 146 91 686
1963 47 79 109 35 270 119 37 19 37 21 232 503 109 33 27 169 102 773
1964 51 90 173 21 335 124 48 16 43 18 248 582 109 38 26 173 111 866
1965 62 104 254 419 136 65 15 35 8 260 680 117 35 35 187 112 978
1966 88 113 224 424 121 54 17 57 5 254 678 137 40 27 205 130 1 013
1967 148 116 217 481 106 63 17 107 23 316 796 140 52 29 220 147 1 163
1968 149 128 231 507 100 76 18 91 18 304 811 155 57 28 239 165 1 215
1969 155 163 242 1 561 102 93 20 97 27 340 901 162 61 43 267 176 1 344
1970 174 173 164 1 512 96 99 16 180 16 408 920 196 73 31 300 195 1 415
1971 195 220 178 593 75 109 25 251 16 476 1 068 218 91 43 352 236 1 656
1972 200 331 177 708 100 139 38 129 24 430 1 138 246 113 47 406 272 1 815
1973 209 403 195 807 141 153 41 70 28 432 1 239 307 122 49 477 481 2 197
1974 242 454 217 912 168 176 26 138 25 533 1 445 400 145 61 606 1 344 3 395
1975 235 409 257 901 248 200 22 148 35 652 1 553 517 181 76 774 1 723 4 049
1976 274 558 344 1 176 333 401 22 171 31 959 2 134 632 218 120 970 2 203 5 307
1977 353 784 860 1 997 439 339 32 156 46 1 011 3 008 687 259 122 1 068 2 674 6 750
1978 502 1 238 1 015 2 754 625 472 57 219 77 1 449 4 203 830 296 161 1 286 3 388 8 878
1979 518 1 840 1 438 3 796 898 576 105 302 117 1 998 5 794 1 110 351 174 1 635 4 027 11 455
1980 715 2 706 1 499 4 920 1 309 888 178 312 298 2 984 7 904 1 387 405 248 2 040 4 708 14 651
1981 586 2 872 872 4 330 1 248 954 155 347 109 2 813 7 143 1 715 446 47 2 208 4 906 14 256
1982 563 2 671 568 3 802 1 194 1 026 209 523 2 952 6 754 2 088 505 2 593 5 645 14 992
1983 608 3 266 760 4 633 1 172 903 130 196 3 2 403 7 037 2 389 549 2 938 6 179 16 154
1984 756 3 598 1 049 5 402 1 349 894 262 215 102 2 820 8 223 3 124 695 3 818 6 731 18 773
1985 780 3 612 1 330 5 721 1 752 1 145 414 338 100 3 749 9 470 3 688 761 4 449 6 634 20 553
1986 616 2 337 551 3 504 1 222 981 273 217 2 693 6 197 3 665 744 4 409 3 825 14 432
1987 536 1 507 1 003 3 046 1 118 945 249 189 2 499 5 546 3 467 746 4 212 3 161 12 919
1988 708 1 740 871 3 319 1 486 1 244 378 255 3 364 6 682 3 851 845 4 696 2 830 14 208
1989 634 1 386 739 2 759 943 1 303 361 427 3 034 5 792 4 375 867 5 242 2 943 13 977
1990 688 1 356 842 2 886 1 118 1 506 312 484 3 420 6 305 4 442 972 5 414 3 606 15 325
1991 607 1 325 614 2 546 1 140 1 906 280 788 4 115 6 661 4 756 1 033 5 789 3 094 15 544
1992 452 775 458 1 685 969 1 782 235 656 3 642 5 327 4 607 991 5 598 3 155 14 080
1993 618 1 156 930 2 704 2 082 2 766 244 594 5 685 8 389 4 625 1 147 5 773 3 028 17 189
1994 876 1 931 1 697 4 504 3 077 4 150 150 1 035 8 411 12 915 5 049 1 048 6 096 3 500 22 511
1995 791 1 919 1 147 3 856 3 210 4 234 117 644 8 205 12 061 5 096 998 6 094 3 126 21 281
1996 819 2 074 1 390 4 283 3 664 3 479 143 499 7 786 12 068 5 398 1 056 6 454 4 360 22 882
1997 1 072 2 509 1 787 5 368 5 974 4 785 149 703 11 610 16 979 5 479 1 029 6 508 4 554 28 041
1998 886 3 132 1 036 5 054 4 400 5 024 78 439 9 941 14 995 5 540 1 020 6 559 3 376 24 930
1999 842 2 517 1 028 4 386 4 213 4 232 162 582 9 189 13 575 5 814 1 065 6 878 5 067 25 521
2000 1 241 3 337 1 993 6 571 6 287 4 865 176 721 12 049 18 619 6 708 1 146 7 854 11 117 37 590
NET CASH EXPENDITURES OF THE PETROLEUM INDUSTRY
Million dollars
1947-2016
October 2017 Table 4.2

Canada
EXPLORATION** DEVELOPMENT** CAPITAL EXPENDITURES OPERATING ROYALTIES* TOTAL
Geological &
Geophysical Drilling Land Other Total Drilling
Field
equipment EOR Gas Plants Other Total
Wells & flow
lines Gas Plants Other Total
NET CASH EXPENDITURES OF THE PETROLEUM INDUSTRY
Million dollars
1947-2016
2001 1 430 4 031 2 026 7 488 7 891 5 535 189 695 14 310 21 798 7 439 1 248 8 687 12 100 42 584
2002 1 159 3 066 1 280 5 505 6 750 4 801 127 803 12 480 17 986 7 998 1 408 9 406 7 968 35 359
2003 1 106 3 600 2 208 6 913 9 882 6 165 129 748 16 924 23 838 8 378 1 591 9 969 10 503 44 310
2004 1 042 4 084 1 668 6 794 11 892 7 105 229 808 20 035 26 828 8 719 1 719 10 437 11 825 49 091
2005 1 208 5 204 2 806 9 218 16 148 8 333 234 883 25 597 34 815 9 972 1 957 11 929 15 822 62 567
2006 1 365 6 085 2 665 10 115 17 811 9 369 260 1 019 28 459 38 574 11 351 2 248 13 599 12 975 65 148
2007 1 065 4 352 2 492 7 909 14 778 7 783 281 900 23 742 31 650 11 734 2 703 14 437 12 389 58 476
2008 1 214 4 306 5 221 10 741 16 230 8 429 367 561 25 586 36 327 12 725 2 808 15 533 17 525 69 386
2009 720 2 773 2 183 5 675 10 150 5 699 292 519 16 660 22 335 13 002 2 897 15 899 7 991 46 225
2010 1 120 4 130 4 564 9 814 16 408 8 403 356 685 25 852 35 666 14 316 2 810 17 127 8 336 61 129
2011 675 4 556 4 404 9 635 18 982 10 867 252 560 30 661 40 296 14 708 2 520 17 228 10 607 68 131
2012 609 4 922 1 669 7 199 19 361 11 938 449 786 32 534 39 733 15 836 2 166 18 002 8 468 66 202
2013 633 5 203 1 284 7 120 20 654 13 821 509 1 062 36 045 43 165 18 230 2 370 20 600 9 744 73 509
2014 669 4 447 1 397 6 513 22 929 15 525 492 1 413 40 359 46 872 18 788 2 441 21 229 10 644 78 745
2015 1 095 1 801 599 3 496 13 523 11 945 445 2 202 28 114 31 609 18 834 3 182 22 016 3 691 57 316
2016 504 1 800 876 3 180 9 832 8 138 197 917 19 084 22 264 15 709 2 153 17 862 2 789 42 915
Total 35 329 120 053 67 160 343 222 885 287 339 196 311 10 009 27 180 1 362 522 202 745 086 301 763 56 571 1 524 359 858 276 924 1 381 869
NOTE: Net Cash Expenditures, except for royalties, do not include inter-industry transactions.
* Net of incentive credits. ** Before PIP grants.
Excludes oil sands, see Table 4.16
October 2017 Table 4.2

Alberta
EXPLORATION** DEVELOPMENT** CAPITAL EXPENDITURES OPERATING ROYALTIES* TOTAL
Geological & Geophysical Drilling Land Other Total Drilling Field equipment EOR Plants Other Total Wells & flow lines etc Plants Other Total
1947 4 6 8 2 19 4 1 2 7 26 2 2 2 29
1948 11 8 12 2 32 20 6 4 29 61 4 1 5 2 67
1949 16 14 32 3 65 29 9 4 7 48 112 10 2 1 13 5 130
1950 25 11 52 4 92 41 12 4 12 68 159 12 4 1 17 7 182
1951 40 28 33 8 107 47 11 2 13 73 180 18 4 2 23 12 214
1952 54 27 44 10 134 57 14 2 13 85 219 23 4 2 28 16 262
1953 52 27 47 11 137 61 15 1 11 88 224 28 4 3 35 20 279
1954 45 35 94 10 184 46 13 1 3 15 77 261 31 3 4 38 25 323
1955 46 44 93 16 199 74 18 1 6 19 117 316 36 3 4 43 31 389
1956 41 46 103 15 204 101 28 1 19 24 172 376 43 4 8 55 41 472
1957 36 41 105 23 204 78 22 3 6 15 124 327 43 6 11 59 40 426
1958 37 54 88 23 202 78 19 5 29 8 139 341 51 9 13 73 30 443
1959 32 48 109 20 209 78 23 4 13 17 134 343 54 12 14 79 34 455
1960 33 44 91 21 189 99 26 7 21 14 165 354 60 11 22 92 35 481
1961 31 52 88 13 183 111 26 4 61 9 210 393 60 21 16 97 55 545
1962 33 47 84 15 178 84 19 6 20 15 144 321 64 28 17 109 66 496
1963 28 50 92 14 184 90 24 8 36 15 173 357 75 30 19 124 73 553
1964 32 57 135 15 239 91 31 8 29 14 172 411 74 35 22 131 80 622
1965 42 70 198 310 99 41 9 32 7 188 498 76 33 29 137 79 714
1966 68 76 170 314 88 35 10 44 1 179 493 86 36 23 145 91 729
1967 100 77 167 344 77 46 10 88 19 241 585 90 48 21 159 107 851
1968 87 88 174 349 74 61 10 87 15 247 596 107 51 22 180 126 901
1969 86 90 180 356 68 74 16 91 22 271 626 106 54 36 196 136 959
1970 80 84 117 281 72 71 11 162 11 328 608 132 64 24 220 154 982
1971 66 81 126 272 56 76 20 214 12 376 648 155 83 38 276 190 1 115
1972 71 102 124 298 69 107 34 110 14 333 631 182 102 39 324 226 1 181
1973 71 131 144 346 102 127 37 65 19 351 697 234 111 44 389 423 1 508
1974 112 147 157 416 136 153 24 126 17 455 872 300 132 57 488 1 107 2 467
1975 99 149 208 456 212 181 20 124 25 562 1 018 403 166 71 640 1 478 3 136
1976 146 257 256 658 277 368 21 155 24 846 1 503 511 201 114 826 1 974 4 304
1977 223 395 680 1 298 351 298 29 144 39 861 2 159 556 241 114 911 2 399 5 469
1978 350 645 741 1 735 477 385 52 166 49 1 129 2 865 676 279 149 1 103 3 055 7 023
1979 350 1 028 1 145 2 522 679 476 78 205 100 1 538 4 060 893 314 166 1 373 3 623 9 057
1980 452 1 622 1 177 3 250 1 063 684 136 241 217 2 341 5 591 1 089 354 236 1 679 4 248 11 518
1981 352 1 544 721 2 617 1 083 783 143 311 99 2 418 5 036 1 393 409 33 1 835 4 497 11 367
1982 325 1 076 466 1 867 943 840 132 494 2 408 4 275 1 717 469 2 185 5 098 11 559
1983 373 1 017 565 1 955 906 654 59 180 2 1 801 3 757 1 939 492 2 432 5 467 11 656
1984 472 1 130 790 2 393 997 681 193 181 84 2 136 4 529 2 521 616 3 137 5 958 13 624
1985 481 1 368 1 021 2 870 1 296 903 331 263 87 2 880 5 750 2 966 680 3 646 5 784 15 180
1986 449 1 021 447 1 918 983 853 229 181 2 247 4 164 3 006 669 3 675 3 362 11 200
1987 420 1 011 841 2 272 883 768 223 162 2 037 4 309 2 831 663 3 494 2 626 10 429
1988 521 1 089 677 2 287 1 165 1 005 351 208 2 729 5 016 3 166 753 3 919 2 457 11 392
1989 429 838 552 1 818 687 1 023 345 364 2 419 4 237 3 630 746 4 375 2 527 11 139
1990 452 950 614 2 016 831 1 089 286 360 2 567 4 583 3 605 841 4 445 3 085 12 114
1991 395 852 467 1 715 877 1 112 268 711 2 968 4 682 3 856 898 4 754 2 625 12 061
1992 330 575 345 1 249 735 842 225 613 2 415 3 665 3 682 843 4 525 2 686 10 876
1993 434 883 641 1 958 1 574 1 387 222 436 3 620 5 578 3 659 984 4 643 2 505 12 726
1994 679 1 450 1 218 3 347 2 316 2 162 124 703 5 305 8 651 3 984 890 4 874 2 858 16 383
1995 560 1 492 857 2 910 2 401 2 408 72 555 5 436 8 345 4 017 835 4 853 2 437 15 635
1996 574 1 547 1 051 3 172 2 667 2 042 92 395 5 195 8 367 4 144 889 5 033 3 474 16 875
1997 767 1 766 1 323 3 856 4 357 2 960 93 405 7 814 11 670 4 063 859 4 922 3 610 20 202
1998 610 2 472 821 3 903 3 167 2 955 58 246 6 426 10 329 3 916 826 4 742 2 731 17 802
1999 591 1 699 744 3 033 2 826 2 240 58 324 5 448 8 482 4 201 867 5 067 4 040 17 589
2000 824 2 365 1 557 4 746 4 197 3 218 91 600 8 106 12 852 4 832 919 5 751 8 886 27 489
2001 840 2 830 1 421 5 090 5 248 3 745 118 458 9 569 14 659 5 307 1 003 6 309 9 795 30 763
2002 658 1 966 767 3 390 4 770 2 995 67 522 8 353 11 743 5 442 1 099 6 541 6 085 24 368
2003 639 2 154 1 304 4 097 6 891 3 993 80 441 11 404 15 500 5 643 1 237 6 880 7 758 30 138
2004 632 2 785 1 212 4 629 8 376 4 846 142 543 13 907 18 535 5 907 1 336 7 244 8 790 34 569
NET CASH EXPENDITURES OF THE PETROLEUM INDUSTRY
Million dollars
1947-2016
October 2017 Table 4.3

Alberta
EXPLORATION** DEVELOPMENT** CAPITAL EXPENDITURES OPERATING ROYALTIES* TOTAL
Geological & Geophysical Drilling Land Other Total Drilling Field equipment EOR Plants Other Total Wells & flow lines etc Plants Other Total
NET CASH EXPENDITURES OF THE PETROLEUM INDUSTRY
Million dollars
1947-2016
2005 782 4 000 1 964 6 746 11 513 5 809 157 692 18 170 24 916 6 729 1 540 8 269 11 796 44 982
2006 822 4 124 1 766 6 712 12 703 6 728 191 830 20 452 27 164 7 532 1 768 9 300 9 198 45 662
2007 659 2 620 969 4 247 10 379 5 627 215 767 16 988 21 235 7 911 2 186 10 098 8 071 39 404
2008 711 2 085 1 171 3 967 11 160 5 724 196 427 17 507 21 474 8 768 2 233 11 001 10 667 43 142
2009 371 1 213 1 028 2 612 5 784 3 209 138 305 9 436 12 048 9 071 2 221 11 291 3 885 27 225
2010 716 2 145 2 990 5 851 9 858 5 247 155 340 15 600 21 452 10 055 2 043 12 098 3 502 37 052
2011 391 2 861 3 729 6 981 11 308 7 002 72 426 18 808 25 788 10 069 1 902 11 971 4 546 42 306
2012 401 3 404 1 284 5 089 12 585 7 692 221 479 20 977 26 065 10 729 1 677 12 406 3 544 42 015
2013 321 3 265 842 4 428 13 773 8 082 162 510 22 527 26 955 12 208 1 890 14 099 4 484 45 537
2014 327 3 138 649 4 115 13 675 8 033 103 751 22 563 26 678 11 746 1 799 13 545 5 454 45 677
2015 219 722 418 1 359 7 241 5 866 141 1 711 14 959 16 318 12 896 2 664 15 559 1 766 33 643
2016 159 791 687 1 637 6 164 2 695 45 639 9 543 11 180 10 016 1 530 11 546 1 255 23 981
Total 21 680 71 924 44 986 221 138 810 191 402 120 714 6 362 19 839 1 085 339 403 478 213 213 436 45 718 1 373 260 527 197 298 936 037
* Net of incentive credits. ** Before PIP grants.
NOTE: Net Cash Expenditures, except for royalties, do not include inter-industry transactions.
Excludes oil sands, see Table 4.14
October 2017 Table 4.3
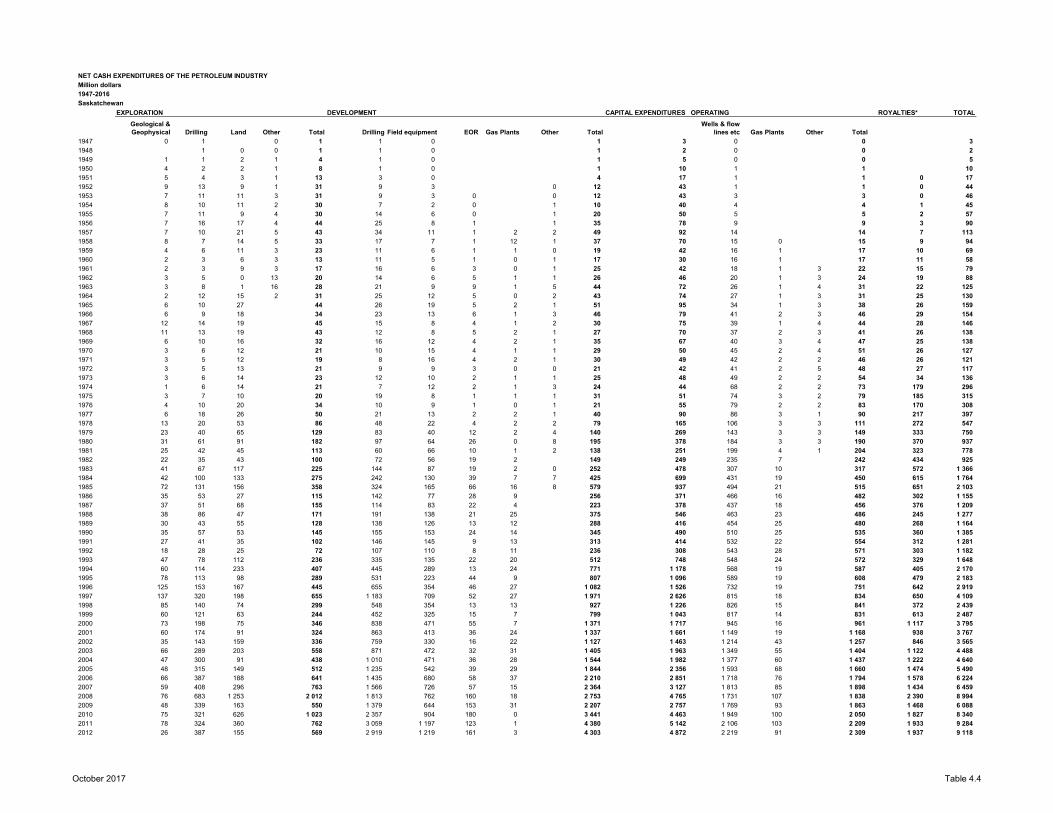
NET CASH EXPENDITURES OF THE PETROLEUM INDUSTRY
Million dollars
1947-2016
Saskatchewan
EXPLORATION DEVELOPMENT CAPITAL EXPENDITURES OPERATING ROYALTIES* TOTAL
Geological & Geophysical Drilling Land Other Total Drilling Field equipment EOR Gas Plants Other Total
Wells & flow lines etc Gas Plants Other Total
1947 0 1 0 1 1 0 1 3 0 0 3
1948 1 0 0 1 1 0 1 2 0 0 2
1949 1 1 2 1 4 1 0 1 5 0 0 5
1950 4 2 2 1 8 1 0 1 10 1 1 10
1951 5 4 3 1 13 3 0 4 17 1 1 0 17
1952 9 13 9 1 31 9 3 0 12 43 1 1 0 44
1953 7 11 11 3 31 9 3 0 0 12 43 3 3 0 46
1954 8 10 11 2 30 7 2 0 1 10 40 4 4 1 45
1955 7 11 9 4 30 14 6 0 1 20 50 5 5 2 57
1956 7 16 17 4 44 25 8 1 1 35 78 9 9 3 90
1957 7 10 21 5 43 34 11 1 2 2 49 92 14 14 7 113
1958 8 7 14 5 33 17 7 1 12 1 37 70 15 0 15 9 94
1959 4 6 11 3 23 11 6 1 1 0 19 42 16 1 17 10 69
1960 2 3 6 3 13 11 5 1 0 1 17 30 16 1 17 11 58
1961 2 3 9 3 17 16 6 3 0 1 25 42 18 1 3 22 15 79
1962 3 5 0 13 20 14 6 5 1 1 26 46 20 1 3 24 19 88
1963 3 8 1 16 28 21 9 9 1 5 44 72 26 1 4 31 22 125
1964 2 12 15 2 31 25 12 5 0 2 43 74 27 1 3 31 25 130
1965 6 10 27 44 26 19 5 2 1 51 95 34 1 3 38 26 159
1966 6 9 18 34 23 13 6 1 3 46 79 41 2 3 46 29 154
1967 12 14 19 45 15 8 4 1 2 30 75 39 1 4 44 28 146
1968 11 13 19 43 12 8 5 2 1 27 70 37 2 3 41 26 138
1969 6 10 16 32 16 12 4 2 1 35 67 40 3 4 47 25 138
1970 3 6 12 21 10 15 4 1 1 29 50 45 2 4 51 26 127
1971 3 5 12 19 8 16 4 2 1 30 49 42 2 2 46 26 121
1972 3 5 13 21 9 9 3 0 0 21 42 41 2 5 48 27 117
1973 3 6 14 23 12 10 2 1 1 25 48 49 2 2 54 34 136
1974 1 6 14 21 7 12 2 1 3 24 44 68 2 2 73 179 296
1975 3 7 10 20 19 8 1 1 1 31 51 74 3 2 79 185 315
1976 4 10 20 34 10 9 1 0 1 21 55 79 2 2 83 170 308
1977 6 18 26 50 21 13 2 2 1 40 90 86 3 1 90 217 397
1978 13 20 53 86 48 22 4 2 2 79 165 106 3 3 111 272 547
1979 23 40 65 129 83 40 12 2 4 140 269 143 3 3 149 333 750
1980 31 61 91 182 97 64 26 0 8 195 378 184 3 3 190 370 937
1981 25 42 45 113 60 66 10 1 2 138 251 199 4 1 204 323 778
1982 22 35 43 100 72 56 19 2 149 249 235 7 242 434 925
1983 41 67 117 225 144 87 19 2 0 252 478 307 10 317 572 1 366
1984 42 100 133 275 242 130 39 7 7 425 699 431 19 450 615 1 764
1985 72 131 156 358 324 165 66 16 8 579 937 494 21 515 651 2 103
1986 35 53 27 115 142 77 28 9 256 371 466 16 482 302 1 155
1987 37 51 68 155 114 83 22 4 223 378 437 18 456 376 1 209
1988 38 86 47 171 191 138 21 25 375 546 463 23 486 245 1 277
1989 30 43 55 128 138 126 13 12 288 416 454 25 480 268 1 164
1990 35 57 53 145 155 153 24 14 345 490 510 25 535 360 1 385
1991 27 41 35 102 146 145 9 13 313 414 532 22 554 312 1 281
1992 18 28 25 72 107 110 8 11 236 308 543 28 571 303 1 182
1993 47 78 112 236 335 135 22 20 512 748 548 24 572 329 1 648
1994 60 114 233 407 445 289 13 24 771 1 178 568 19 587 405 2 170
1995 78 113 98 289 531 223 44 9 807 1 096 589 19 608 479 2 183
1996 125 153 167 445 655 354 46 27 1 082 1 526 732 19 751 642 2 919
1997 137 320 198 655 1 183 709 52 27 1 971 2 626 815 18 834 650 4 109
1998 85 140 74 299 548 354 13 13 927 1 226 826 15 841 372 2 439
1999 60 121 63 244 452 325 15 7 799 1 043 817 14 831 613 2 487
2000 73 198 75 346 838 471 55 7 1 371 1 717 945 16 961 1 117 3 795
2001 60 174 91 324 863 413 36 24 1 337 1 661 1 149 19 1 168 938 3 767
2002 35 143 159 336 759 330 16 22 1 127 1 463 1 214 43 1 257 846 3 565
2003 66 289 203 558 871 472 32 31 1 405 1 963 1 349 55 1 404 1 122 4 488
2004 47 300 91 438 1 010 471 36 28 1 544 1 982 1 377 60 1 437 1 222 4 640
2005 48 315 149 512 1 235 542 39 29 1 844 2 356 1 593 68 1 660 1 474 5 490
2006 66 387 188 641 1 435 680 58 37 2 210 2 851 1 718 76 1 794 1 578 6 224
2007 59 408 296 763 1 566 726 57 15 2 364 3 127 1 813 85 1 898 1 434 6 459
2008 76 683 1 253 2 012 1 813 762 160 18 2 753 4 765 1 731 107 1 838 2 390 8 994
2009 48 339 163 550 1 379 644 153 31 2 207 2 757 1 769 93 1 863 1 468 6 088
2010 75 321 626 1 023 2 357 904 180 0 3 441 4 463 1 949 100 2 050 1 827 8 340
2011 78 324 360 762 3 059 1 197 123 1 4 380 5 142 2 106 103 2 209 1 933 9 284
2012 26 387 155 569 2 919 1 219 161 3 4 303 4 872 2 219 91 2 309 1 937 9 118
October 2017 Table 4.4

NET CASH EXPENDITURES OF THE PETROLEUM INDUSTRY
Million dollars
1947-2016
Saskatchewan
EXPLORATION DEVELOPMENT CAPITAL EXPENDITURES OPERATING ROYALTIES* TOTAL
Geological & Geophysical Drilling Land Other Total Drilling Field equipment EOR Gas Plants Other Total
Wells & flow lines etc Gas Plants Other Total
2013 92 436 117 646 3 271 1 330 304 2 4 908 5 554 2 713 80 2 794 2 129 10 477
2014 88 416 252 756 3 741 1 818 304 42 5 906 6 661 3 264 164 3 427 2 212 12 301
2015 40 26 87 153 2 542 1 468 198 48 4 256 4 409 2 597 122 2 719 971 8 099
2016 46 23 108 177 1 560 933 131 22 2 646 2 823 2 585 59 2 644 766 6 233
Total 2 245 7 304 6 686 65 16 299 37 834 18 464 2 631 639 61 59 628 75 927 43 337 1 730 58 45 125 35 711 156 763
NOTE: Net Cash Expenditures, except for royalties, do not include inter-industry transactions.
* Net of incentive credits.
October 2017 Table 4.4

British Columbia
EXPLORATION DEVELOPMENT CAPITAL EXPENDITURES OPERATING ROYALTIES* TOTAL
Geophysical Drilling Land Other Total Drilling Field equipment EOR Gas Plants Other Total Wells & flow lines etc Gas Plants Other Total
1948 1 1 1 1
1949 1 1 1
1950 1 1 1 2 2 2
1951 1 2 2 5 5 5
1952 3 3 2 8 8 8
1953 4 5 3 1 12 1 1 13 1 1 13
1954 6 3 2 1 12 1 1 13 14
1955 7 6 4 2 20 1 1 20 20
1956 8 9 5 3 24 2 3 27 27
1957 7 10 5 3 25 2 1 24 7 34 59 59
1958 7 11 9 4 31 2 1 3 34 3 3 1 37
1959 9 12 16 5 42 4 3 1 7 49 1 1 1 51
1960 9 18 13 7 47 5 2 1 7 54 1 1 1 56
1961 10 14 14 4 41 11 3 1 1 15 56 2 1 1 4 2 61
1962 8 15 17 4 43 18 4 1 1 24 66 4 2 3 9 5 80
1963 9 14 15 4 42 8 4 2 14 55 5 2 3 10 6 71
1964 8 11 22 3 43 7 5 3 14 2 30 73 5 2 1 7 5 85
1965 5 10 27 41 11 5 1 1 1 19 61 5 2 3 9 6 76
1966 7 17 26 50 9 5 2 11 1 28 78 7 3 1 11 8 97
1967 18 14 25 57 14 8 2 18 1 43 101 8 3 3 14 10 124
1968 15 15 26 56 11 6 2 2 22 78 7 3 2 13 11 101
1969 13 15 33 61 11 7 1 2 1 21 82 10 4 2 16 13 111
1970 15 13 26 54 14 11 1 8 34 88 13 4 1 18 13 119
1971 18 16 32 65 9 12 2 28 1 51 117 14 4 2 20 16 153
1972 17 28 30 75 9 6 2 7 24 100 15 5 2 22 16 138
1973 18 36 28 82 8 7 1 1 17 99 17 5 2 24 21 144
1974 18 34 37 88 13 8 10 1 32 120 21 7 2 30 51 201
1975 9 19 30 58 9 8 13 1 32 90 28 9 3 40 49 178
1976 23 34 59 116 30 23 7 6 66 182 30 9 3 42 47 270
1977 41 60 142 243 49 16 6 1 73 316 29 11 4 43 44 403
1978 65 113 197 375 66 54 41 1 163 538 37 9 3 49 44 630
1979 82 172 213 467 107 47 1 74 2 229 697 55 15 3 73 47 817
1980 116 298 212 626 90 75 4 34 18 221 847 82 28 3 113 64 1 024
1981 64 188 88 340 61 40 1 21 1 123 464 93 15 2 111 59 633
1982 36 99 48 183 40 29 21 89 273 100 17 117 79 468
1983 34 57 66 157 26 17 8 51 208 95 18 113 95 417
1984 35 101 114 250 33 16 25 2 75 325 123 32 155 106 585
1985 54 120 142 316 61 31 13 52 4 161 477 151 34 185 137 799
1986 29 103 68 199 59 34 14 15 123 322 123 31 154 126 602
1987 29 60 86 176 73 55 1 18 147 322 116 35 151 120 593
1988 62 110 140 312 93 61 4 16 174 486 132 40 171 98 755
1989 83 155 127 365 98 108 2 50 258 623 182 52 235 112 970
1990 136 188 168 491 108 140 2 55 304 796 211 69 280 119 1 194
1991 126 263 99 489 87 103 3 61 253 742 237 76 313 124 1 179
1992 77 128 71 277 56 92 1 28 177 454 215 80 296 130 880
1993 121 154 172 447 135 121 .. 100 356 803 235 100 335 164 1 301
1994 130 340 240 711 271 272 301 844 1 555 307 101 408 203 2 166
1995 113 275 165 553 242 221 1 78 542 1 095 302 107 409 176 1 680
1996 74 313 163 550 292 207 6 75 579 1 130 326 119 445 200 1 774
1997 86 338 256 680 333 286 5 269 892 1 572 397 120 517 257 2 346
1998 70 394 137 601 308 296 7 80 690 1 292 444 143 587 243 2 121
1999 51 281 218 550 280 207 5 68 559 1 109 449 140 590 372 2 070
2000 124 360 293 777 544 375 10 83 1 012 1 789 558 164 722 1 004 3 515
2001 149 511 489 1 148 1 117 665 5 195 1 982 3 130 607 155 762 1 246 5 137
2002 178 389 335 902 783 525 5 205 1 518 2 420 778 178 956 906 4 281
2003 200 640 689 1 530 1 388 662 206 2 257 3 787 784 220 1 004 1 413 6 204
2004 239 640 290 1 170 1 702 849 177 2 728 3 897 871 247 1 118 1 508 6 523
2005 237 542 599 1 378 2 444 972 3 137 3 555 4 934 992 275 1 267 1 967 8 167
2006 280 916 700 1 896 2 721 1 321 10 146 4 198 6 094 1 136 331 1 467 1 444 9 005
2007 186 957 1 109 2 252 2 012 1 113 8 117 3 250 5 502 1 153 351 1 504 1 255 8 261
2008 181 1 133 2 728 4 042 2 403 1 315 10 110 3 837 7 880 1 193 375 1 568 1 370 10 817
2009 123 995 953 2 071 1 908 1 012 182 3 102 5 173 1 236 490 1 726 500 7 399
2010 172 1 067 904 2 143 3 037 1 546 3 343 4 930 7 073 1 310 577 1 887 466 9 426
2011 126 1 041 289 1 456 3 474 1 604 16 132 5 226 6 682 1 358 428 1 786 444 8 912
2012 34 613 202 849 2 695 1 398 1 294 4 388 5 237 1 608 326 1 934 238 7 409
2013 97 822 289 1 209 2 377 1 600 8 548 4 534 5 743 1 906 339 2 245 385 8 373
2014 88 716 456 1 260 3 531 1 898 3 620 6 052 7 311 2 199 364 2 563 741 10 615
2015 68 366 81 516 2 645 1 344 3 437 4 428 4 944 2 024 258 2 282 225 7 450
2016 38 253 52 343 1 249 653 3 252 2 158 2 500 1 983 465 2 448 170 5 119
Total 4 504 16 657 14 297 41 35 499 39 204 21 504 178 5 827 52 66 766 102 265 26 330 6 996 51 33 377 18 678 154 320
NOTE: Net Cash Expenditures, except for royalties, do not include inter-industry transactions.
* Net of incentive credits.
NET CASH EXPENDITURES OF THE PETROLEUM INDUSTRY
Million dollars
1947-2016
October 2017 Table 4.5

British Columbia
EXPLORATION DEVELOPMENTCAPITAL EXPENDITURES OPERATING ROYALTIES* TOTAL
Geological &
Geophysical Drilling Land Other Total Drilling
Field
equipment EOR Gas Plants Other Total
Wells & flow
lines etc Gas Plants Other Total
NET CASH EXPENDITURES OF THE PETROLEUM INDUSTRYMillion dollars
1947-2015
1990 135.6 188.0 167.7 491.3 107.6 139.9 1.6 55.2 304.3 795.6 210.6 69.1 279.7 118.9 1 194.21991 125.9 263.2 99.4 488.5 86.5 102.9 3.0 60.7 253.1 741.6 236.9 76.0 312.9 124.0 1 178.51992 77.2 128.4 71.0 276.6 55.9 92.2 1.3 27.9 177.3 453.9 215.1 80.4 295.5 130.4 879.81993 121.0 153.7 172.4 447.1 135.1 121.2 .. 99.7 356.0 803.1 235.2 99.5 334.7 163.6 1 301.41994 130.2 340.1 240.4 710.7 270.8 271.9 0.1 301.1 843.9 1 554.6 307.1 100.6 407.7 203.3 2 165.61995 113.3 274.6 165.3 553.2 242.0 220.7 1.0 78.3 542.0 1 095.2 302.2 107.0 409.2 175.5 1 679.91996 74.2 312.8 163.2 550.2 291.7 206.7 6.3 74.7 579.4 1 129.6 325.5 119.0 444.5 200.2 1 774.31997 85.5 338.1 256.2 679.8 333.1 285.5 4.5 269.0 892.1 1 571.9 396.8 120.3 517.1 256.5 2 345.51998 70.0 394.2 137.1 601.3 307.6 295.9 6.7 80.1 690.3 1 291.6 444.1 142.5 586.6 242.7 2 120.91999 51.3 281.3 217.6 550.2 279.5 206.6 4.8 67.7 558.6 1 108.8 449.1 140.4 589.5 371.5 2 069.82000 123.9 359.7 293.2 776.8 544.3 374.7 10.1 82.8 1 011.9 1 788.7 558.1 164.0 722.1 1 003.7 3 514.52001 148.8 510.9 488.6 1 148.3 1 117.3 664.8 4.9 194.8 1 981.8 3 130.1 606.9 154.6 761.5 1 245.5 5 137.12002 178.1 389.1 334.7 901.9 783.0 525.1 5.1 204.8 1 518.0 2 419.9 778.0 177.5 955.5 905.5 4 280.92003 200.3 640.4 689.3 1 530.0 1 388.1 662.3 0.2 206.0 2 256.6 3 786.6 784.1 220.0 1 004.1 1 413.3 6 204.02004 239.1 640.3 290.1 1 169.5 1 701.6 848.9 0.2 177.2 2 727.9 3 897.4 871.0 247.0 1 118.0 1 507.6 6 523.02005 236.9 542.1 599.3 1 378.3 2 443.6 971.8 3.2 136.6 3 555.2 4 933.5 992.2 274.5 1 266.7 1 966.7 8 166.92006 280.0 915.9 700.2 1 896.1 2 720.9 1 321.1 10.2 146.1 4 198.3 6 094.4 1 135.6 331.1 1 466.7 1 444.3 9 005.42007 185.9 957.0 1 108.8 2 251.6 2 012.0 1 112.6 8.2 117.4 3 250.2 5 501.8 1 152.5 351.5 1 504.0 1 255.4 8 261.22008 180.8 1 133.2 2 728.4 4 042.3 2 403.0 1 314.8 10.0 109.5 3 837.3 7 879.6 1 193.1 374.6 1 567.7 1 369.9 10 817.22009 123.3 994.9 953.0 2 071.2 1 908.2 1 012.0 0.0 181.9 3 102.1 5 173.3 1 236.4 489.5 1 725.9 499.8 7 399.02010 172.2 1 066.6 904.3 2 143.1 3 037.4 1 546.3 3.1 343.3 4 930.1 7 073.2 1 310.0 576.7 1 886.7 465.6 9 425.52011 126.0 1 041.2 288.7 1 455.9 3 473.8 1 604.0 15.8 132.3 5 225.8 6 681.7 1 358.2 428.0 1 786.2 444.3 8 912.22012 33.8 613.2 202.1 849.1 2 694.5 1 397.8 0.8 294.5 4 387.5 5 236.6 1 607.5 326.2 1 933.7 238.5 7 408.72013 97.2 822.5 289.0 1 208.7 2 377.2 1 599.9 8.4 548.5 4 534.1 5 742.8 1 906.0 338.9 2 244.9 385.1 8 372.82014 87.6 716.3 455.6 1 259.6 3 531.2 1 898.2 2.6 619.6 6 051.6 7 311.2 2 198.6 364.0 2 562.7 740.7 10 614.62015 68.0 418.8 81.2 568.1 2 653.1 1 306.6 2.5 426.3 4 388.5 4 956.6 1 964.5 256.9 2 221.5 225.1 7 403.2
Total 4 465.8 16 456.4 14 245.2 41.0 35 208.4 37 963.5 20 813.4 175.3 5 564.9 52.3 64 569.4 99 777.8 24 287.2 6 530.6 50.8 30 868.6 18 507.7 149 154.0NOTE: Net Cash Expenditures, except for royalties, do not include inter-industry transactions.* Net of incentive credits.
October 2016 Table 4.5

Territories
EXPLORATION** DEVELOPMENT**
CAPITAL
EXPENDITURES OPERATING ROYALTIES* TOTAL
Geological &
Geophysical Drilling Land Other Total Drilling
Field
equipment EOR Gas Plants Other Total
Wells & flow
lines etc Gas Plants Other Total
1951 1 1 1 1
1952 1 1 1 1
1953 2 2 2 2
1954 1 2 2 2
1955 1 1 1 2
1956 2 2 3 3
1957 1 2 1 1 4 1 1 5 5
1958 3 1 1 1 5 5 6
1959 5 2 8 2 17 17 17
1960 6 5 3 1 15 1 1 15 1 16
1961 9 4 2 1 16 16 1 1 17
1962 6 5 1 1 13 13 1 1 14
1963 7 7 1 1 15 15 1 1 2 17
1964 9 9 1 1 20 1 20 21
1965 8 13 2 23 23 23
1966 6 11 8 24 24 1 25
1967 11 7 5 23 23 1 1 24
1968 24 9 6 39 3 2 6 44 1 1 45
1969 38 33 6 77 6 3 9 86 1 1 2 87
1970 58 45 4 107 1 1 4 5 113 1 2 3 115
1971 80 81 4 165 1 4 2 7 172 2 2 175
1972 84 135 6 225 2 5 4 9 20 244 3 3 248
1973 92 159 5 256 6 1 7 14 271 2 3 1 274
1974 87 192 5 283 9 2 5 16 299 2 3 1 303
1975 102 165 4 272 4 1 8 13 284 3 3 4 291
1976 82 201 3 286 11 8 20 306 3 3 6 5 317
1977 56 278 4 338 7 8 2 3 20 358 4 2 1 7 5 369
1978 42 374 5 421 22 6 5 21 55 476 2 2 4 8 4 488
1979 30 374 6 410 15 7 15 3 5 44 454 7 1 9 5 468
1980 42 407 7 456 38 55 12 29 133 589 18 1 5 24 5 618
1981 57 683 8 747 16 52 2 1 71 818 14 1 10 26 5 848
1982 68 788 2 858 104 82 57 243 1 101 17 1 18 2 1 121
1983 75 902 977 50 123 51 224 1 201 18 18 1 1 220
1984 99 933 4 1 036 30 49 28 7 114 1 150 14 14 2 1 166
1985 104 770 874 25 32 3 1 61 935 41 41 8 983
1986 42 486 2 530 17 5 1 1 24 553 38 38 5 596
1987 30 165 195 27 28 2 57 252 48 48 7 307
1988 62 201 1 264 12 21 1 34 297 53 . . 53 5 355
1989 71 232 1 304 1 4 1 6 310 74 4 78 6 394
1990 42 57 2 101 14 13 27 128 74 5 79 9 216
1991 23 38 1 62 9 12 4 25 87 86 6 93 8 187
1992 15 8 1 24 7 8 15 39 70 5 74 9 122
1993 11 3 1 14 1 6 7 21 43 6 50 7 77
1994 1 1 3 8 7 12 27 30 45 5 50 8 88
1995 9 11 20 12 6 1 19 38 43 4 47 8 93
1996 21 11 32 16 20 36 67 35 2 37 14 118
1997 8 24 33 11 22 33 65 31 2 33 10 108
1998 7 44 1 51 12 17 29 80 32 7 38 7 125
1999 24 108 132 3 21 5 29 161 33 9 42 9 212
2000 52 58 56 165 46 110 156 321 36 9 46 19 385
2001 202 106 3 311 18 26 43 355 37 11 47 43 445
2002 161 101 3 264 9 25 23 57 321 59 10 69 22 412
2003 37 113 1 150 35 55 32 122 272 60 8 68 30 370
2004 40 139 17 197 34 81 28 143 340 58 6 65 24 428
2005 34 193 26 253 55 194 1 250 502 63 8 71 20 594
NET CASH EXPENDITURES OF THE PETROLEUM INDUSTRY
Million dollars
1951-2016
October 2017 Table 4.6
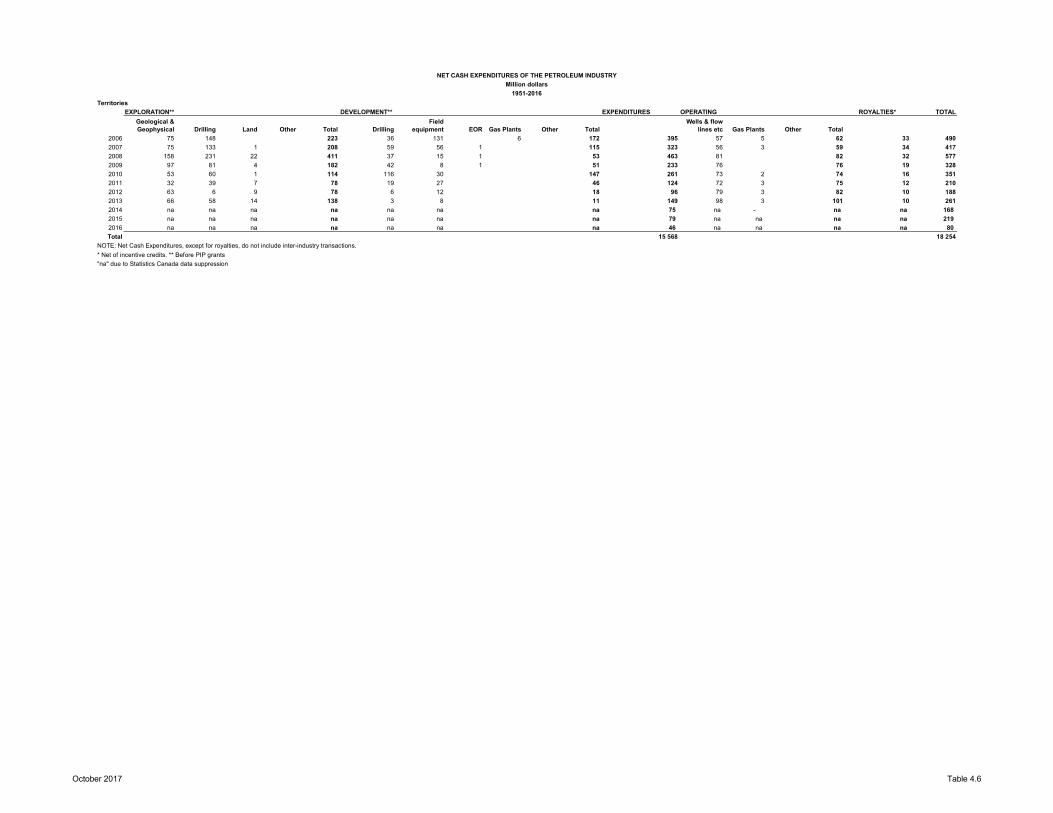
Territories
EXPLORATION** DEVELOPMENT**
CAPITAL
EXPENDITURES OPERATING ROYALTIES* TOTAL
Geological &
Geophysical Drilling Land Other Total Drilling
Field
equipment EOR Gas Plants Other Total
Wells & flow
lines etc Gas Plants Other Total
NET CASH EXPENDITURES OF THE PETROLEUM INDUSTRY
Million dollars
1951-2016
2006 75 148 223 36 131 6 172 395 57 5 62 33 490
2007 75 133 1 208 59 56 1 115 323 56 3 59 34 417
2008 158 231 22 411 37 15 1 53 463 81 82 32 577
2009 97 81 4 182 42 8 1 51 233 76 76 19 328
2010 53 60 1 114 116 30 147 261 73 2 74 16 351
2011 32 39 7 78 19 27 46 124 72 3 75 12 210
2012 63 6 9 78 6 12 18 96 79 3 82 10 188
2013 66 58 14 138 3 8 11 149 98 3 101 10 261
2014 na na na na na na na 75 na - na na 168
2015 na na na na na na na 79 na na na na 219
2016 na na na na na na na 46 na na na na 80
Total 15 568 18 254
NOTE: Net Cash Expenditures, except for royalties, do not include inter-industry transactions.
* Net of incentive credits. ** Before PIP grants
"na" due to Statistics Canada data suppression
October 2017 Table 4.6
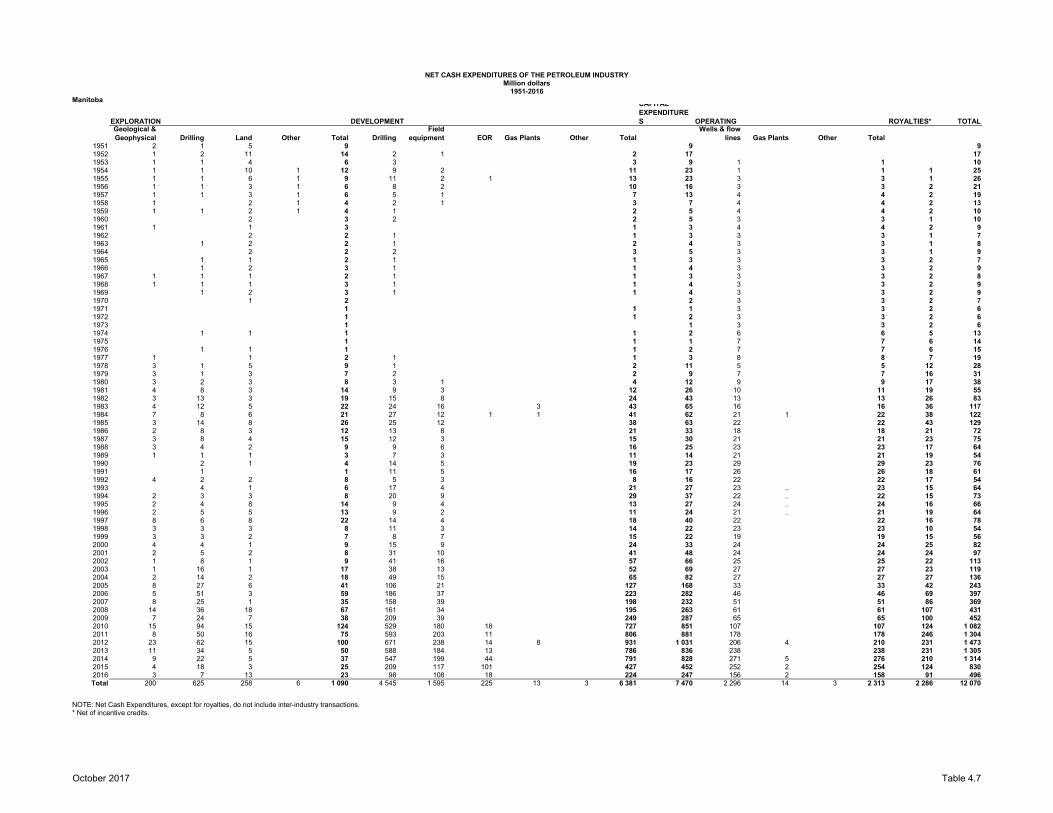
Manitoba
EXPLORATION DEVELOPMENT
CAPITAL
EXPENDITURES OPERATING ROYALTIES* TOTAL
Geological & Geophysical Drilling Land Other Total Drilling
Field equipment EOR Gas Plants Other Total
Wells & flow lines Gas Plants Other Total
1951 2 1 5 9 9 91952 1 2 11 14 2 1 2 17 171953 1 1 4 6 3 3 9 1 1 101954 1 1 10 1 12 9 2 11 23 1 1 1 251955 1 1 6 1 9 11 2 1 13 23 3 3 1 261956 1 1 3 1 6 8 2 10 16 3 3 2 211957 1 1 3 1 6 5 1 7 13 4 4 2 191958 1 2 1 4 2 1 3 7 4 4 2 131959 1 1 2 1 4 1 2 5 4 4 2 101960 2 3 2 2 5 3 3 1 101961 1 1 3 1 3 4 4 2 91962 2 2 1 1 3 3 3 1 71963 1 2 2 1 2 4 3 3 1 81964 2 2 2 3 5 3 3 1 91965 1 1 2 1 1 3 3 3 2 71966 1 2 3 1 1 4 3 3 2 91967 1 1 1 2 1 1 3 3 3 2 81968 1 1 1 3 1 1 4 3 3 2 91969 1 2 3 1 1 4 3 3 2 91970 1 2 2 3 3 2 71971 1 1 1 3 3 2 61972 1 1 2 3 3 2 61973 1 1 3 3 2 61974 1 1 1 1 2 6 6 5 131975 1 1 1 7 7 6 141976 1 1 1 1 2 7 7 6 151977 1 1 2 1 1 3 8 8 7 191978 3 1 5 9 1 2 11 5 5 12 281979 3 1 3 7 2 2 9 7 7 16 311980 3 2 3 8 3 1 4 12 9 9 17 381981 4 8 3 14 9 3 12 26 10 11 19 551982 3 13 3 19 15 8 24 43 13 13 26 831983 4 12 5 22 24 16 3 43 65 16 16 36 1171984 7 8 6 21 27 12 1 1 41 62 21 1 22 38 1221985 3 14 8 26 25 12 38 63 22 22 43 1291986 2 8 3 12 13 8 21 33 18 18 21 721987 3 8 4 15 12 3 15 30 21 21 23 751988 3 4 2 9 9 6 16 25 23 23 17 641989 1 1 1 3 7 3 11 14 21 21 19 541990 2 1 4 14 5 19 23 29 29 23 761991 1 1 11 5 16 17 26 26 18 611992 4 2 2 8 5 3 8 16 22 22 17 541993 4 1 6 17 4 21 27 23 .. 23 15 641994 2 3 3 8 20 9 29 37 22 .. 22 15 731995 2 4 8 14 9 4 13 27 24 .. 24 16 661996 2 5 5 13 9 2 11 24 21 .. 21 19 641997 8 6 8 22 14 4 18 40 22 22 16 781998 3 3 3 8 11 3 14 22 23 23 10 541999 3 3 2 7 8 7 15 22 19 19 15 562000 4 4 1 9 15 9 24 33 24 24 25 822001 2 5 2 8 31 10 41 48 24 24 24 972002 1 8 1 9 41 16 57 66 25 25 22 1132003 1 16 1 17 38 13 52 69 27 27 23 1192004 2 14 2 18 49 15 65 82 27 27 27 1362005 8 27 6 41 106 21 127 168 33 33 42 2432006 5 51 3 59 186 37 223 282 46 46 69 3972007 8 25 1 35 158 39 198 232 51 51 86 3692008 14 36 18 67 161 34 195 263 61 61 107 4312009 7 24 7 38 209 39 249 287 65 65 100 4522010 15 94 15 124 529 180 18 727 851 107 107 124 1 0822011 8 50 16 75 593 203 11 806 881 178 178 246 1 3042012 23 62 15 100 671 238 14 8 931 1 031 206 4 210 231 1 4732013 11 34 5 50 588 184 13 786 836 238 238 231 1 3052014 9 22 5 37 547 199 44 791 828 271 5 276 210 1 3142015 4 18 3 25 209 117 101 427 452 252 2 254 124 8302016 3 7 13 23 98 108 18 224 247 156 2 158 91 496Total 200 625 258 6 1 090 4 545 1 595 225 13 3 6 381 7 470 2 296 14 3 2 313 2 286 12 070
NOTE: Net Cash Expenditures, except for royalties, do not include inter-industry transactions.* Net of incentive credits.
NET CASH EXPENDITURES OF THE PETROLEUM INDUSTRYMillion dollars
1951-2016
October 2017 Table 4.7

Manitoba
EXPLORATION DEVELOPMENT
CAPITAL
EXPENDITURES OPERATING ROYALTIES* TOTALGeological &
Geophysical Drilling Land Other Total Drilling
Field
equipment EOR
Gas
Plants Other Total
Wells &
flow lines Gas Plants Other Total
NET CASH EXPENDITURES OF THE PETROLEUM INDUSTRYMillion dollars
1951-2015
1998 2.5 2.5 2.7 7.7 10.6 3.4 14.0 21.7 23.0 23.0 9.7 54.41999 2.5 2.8 2.0 7.3 7.5 7.3 0.1 14.9 22.2 19.3 19.3 14.5 56.02000 4.2 3.5 1.1 8.8 15.4 8.8 0.1 24.3 33.1 23.6 23.6 24.9 81.62001 1.6 4.5 1.6 7.7 30.5 10.2 40.7 48.4 24.3 24.3 23.8 96.52002 0.6 7.8 0.7 9.1 40.5 15.6 0.4 56.5 65.6 24.5 24.5 22.4 112.52003 0.7 15.5 0.9 17.1 38.4 13.4 51.8 68.9 27.2 27.2 22.7 118.82004 1.7 14.1 2.1 17.9 49.2 15.3 64.5 82.4 26.9 26.9 26.5 135.82005 7.7 26.7 6.3 40.7 105.6 21.3 126.9 167.6 33.0 33.0 41.9 242.52006 5.2 51.1 2.6 58.9 186.2 37.0 223.2 282.1 46.1 46.1 68.8 397.02007 8.4 25.0 1.2 34.5 158.2 39.3 197.6 232.1 50.9 50.9 86.3 369.22008 13.5 35.9 17.8 67.2 161.1 34.2 195.4 262.6 61.3 61.3 106.8 430.72009 6.8 24.0 7.2 38.0 209.3 39.2 248.5 286.5 65.4 65.4 99.8 451.72010 15.3 93.7 14.9 123.9 529.1 180.4 17.8 727.3 851.2 106.9 106.9 123.7 1 081.82011 8.2 50.0 16.5 74.7 592.7 202.7 10.6 806.0 880.6 177.7 177.7 246.1 1 304.42012 23.5 62.0 14.8 100.3 671.4 237.8 13.8 7.7 930.7 1 031.0 205.9 4.5 210.4 231.2 1 472.62013 11.1 33.6 5.4 50.1 588.3 184.1 13.3 0.0 785.6 835.6 238.5 0.0 238.5 231.0 1 305.12014 9.3 22.5 5.1 36.9 547.4 199.3 44.5 0.0 791.2 828.1 270.5 5.2 275.8 210.2 1 314.12015 3.8 18.3 2.6 24.6 208.7 116.8 101.5 0.3 427.3 452.0 252.3 1.8 254.0 123.7 829.6Total 197.6 618.1 245.1 5.9 1 066.7 4 447.1 1 486.4 207.5 12.9 3.2 6 157.2 7 223.8 2 139.6 12.5 3.0 2 155.1 2 193.9 11 572.9
NOTE: Net Cash Expenditures, except for royalties, do not include inter-industry transactions.* Net of incentive credits.
October 2016 Table 4.7

Ontario
EXPLORATION DEVELOPMENT CAPITAL EXPENDITURES OPERATING ROYALTIES* TOTALGeological & Geophysical Drilling Land Other Total Drilling Field equipment EOR Gas Plants Other Total
Wells & flow lines Gas Plants Other Total
1968 2 2 2 6 1 1 0 0 0 2 8 2 0 0 2 1 11
1969 1 3 1 4 1 1 - 2 0 4 8 2 0 0 3 0 11
1970 1 1 1 3 0 1 - 9 0 11 14 2 3 0 5 1 19
1971 1 3 1 5 2 2 0 7 0 10 15 2 2 1 5 1 20
1972 2 4 1 7 1 8 - 8 0 17 24 2 3 0 5 1 30
1973 2 3 1 5 2 8 - 2 0 12 18 2 3 1 6 1 24
1974 2 5 2 9 3 1 0 2 0 6 14 2 4 0 6 1 21
1975 2 4 2 8 3 1 0 9 1 14 22 2 3 - 5 1 28
1976 3 6 4 12 5 1 - 0 0 6 18 3 2 - 5 1 24
1977 7 5 4 16 9 3 0 1 2 15 31 4 3 1 8 1 40
1978 7 10 10 27 10 4 - 5 1 18 46 4 4 1 9 2 56
1979 5 10 3 18 13 4 - 19 0 36 54 5 17 2 23 3 80
1980 8 17 5 30 18 8 - 36 0 63 92 5 19 1 25 3 120
1981 2 10 4 16 19 - 14 7 40 56 6 17 0 23 4 83
1982 1 12 3 16 21 6 - 6 - 33 49 6 12 18 6 72
1983 1 15 5 21 22 2 1 3 0 29 50 13 29 42 8 99
1984 1 21 2 24 21 5 1 2 1 29 53 13 28 40 13 106
1985 2 21 3 26 20 3 0 6 0 30 56 14 26 40 11 107
1986 2 15 2 19 7 5 1 11 - 23 42 14 29 43 10 95
1987 1 9 3 13 9 6 0 4 - 19 33 14 29 43 9 84
1988 5 24 3 31 16 7 - 6 - 29 61 15 29 43 8 113
1989 2 24 3 29 12 3 - 1 - 16 44 13 39 53 10 107
1990 4 17 4 25 11 6 - 42 - 59 84 14 31 45 11 140
1991 4 25 3 32 11 7 - 0 - 18 50 18 31 49 8 106
1992 2 19 5 26 11 4 - 4 - 20 46 16 36 52 7 105
1993 2 23 4 29 21 6 - 38 - 64 93 15 34 48 5 146
1994 0 18 1 19 18 12 - 7 - 37 56 15 33 48 6 110
1995 1 17 1 18 12 11 - 3 - 25 43 15 32 47 7 97
1996 1 9 2 12 15 4 - 3 - 22 33 18 28 46 7 86
1997 1 12 2 14 10 3 - 1 - 14 28 22 29 51 10 89
1998 0 17 1 18 16 1 - 1 - 18 36 23 29 52 7 94
1999 0 17 0 18 16 4 - 1 - 21 39 16 35 51 6 95
2000 2 34 3 39 32 12 - - - 44 83 17 34 50 15 148
2001 3 28 3 34 38 8 0 - - 46 80 15 30 45 12 137
2002 2 12 2 17 26 12 0 - - 38 55 14 27 42 13 110
2003 2 19 3 23 22 9 - 0 - 31 54 16 28 44 20 118
2004 2 18 3 23 29 10 0 - - 38 61 15 27 42 19 123
2005 2 9 1 12 13 12 0 - - 25 37 15 28 43 19 99
2006 2 36 1 39 26 10 - - - 36 75 15 27 42 16 133
2007 0 12 2 14 8 3 - - - 10 24 15 25 40 15 79
2008 0 4 1 6 6 3 - 6 - 15 21 14 27 41 16 78
2009 0 3 1 4 4 2 - 1 - 6 10 13 27 41 8 59
2010 0 15 1 17 26 2 - 1 - 29 45 14 30 44 9 99
2011 1 15 0 16 22 4 0 - - 26 42 7 28 35 12 88
2012 0 0 - 0 2 0 0 - - 3 3 3 28 30 9 42
2013 0 0 - 0 1 0 0 - - 1 2 3 20 23 10 35
2014 - 0 - 0 5 0 - - - 5 5 na na 55 8 68
2015 - - - - - na - - - na 0 na na 25 6 32
2016 - - - - 1 na - - - na 1 na na 10 5 16
Total 90 602 107 - 799 613 5 261 14 1 913 8 1 591 381 3 885
NOTE: Net Cash Expenditures, except for royalties, do not include inter-industry transactions.
* Net of incentive credits.
"na" due to Statistics Canada data suppression
NET CASH EXPENDITURES OF THE PETROLEUM INDUSTRY
Million dollars
1968-2016
October 2017 Table 4.8

Quebec
EXPLORATION DEVELOPMENT CAPITAL EXPENDITURES OPERATING
ROYAL-
TIES* TOTALGeological &
Geophysical Drilling Land Other Total Drilling
Field
equipment EOR Gas Plants Other Total
Wells & flow
lines Gas Plants Other Total
1969 1 1 3 3 3
1970 3 1 1 5 5 5
1971 8 3 1 11 11 11
1972 4 6 1 11 11 11
1973 1 2 1 3 3 3
1974 4 4 4 4
1975 1 3 4 4 4
1976 2 2 4 4 4
1977 1 5 2 7 7 7
1978 1 6 8 8 8
1979 1 8 9 9 9
1980 2 6 9 9 9
1981 2 6 9 9 9
1982 7 4 1 11 11 11
1983 1 1 2 2 2
1984 1 1 1 1
1985 1 1 1 1 2 2
1986 1 1 1 2
1987 1 1 1 1
1988 1 1 1 1
1989 1 1 1 1
1990 1 1 1
1991 3 4 8 8 8
1992 2 7 8 8 8
1993 1 6 7 7 7
1994 1 1 1
1995
1996
1997 2 2 2 2
1998 5 5 10 10 10
1999 6 7 7 7
2000
2001
2002 3 3 3 3
2003 10 5 1 16 16 16
2004 1 2 3 3 3
2005 3 7 10 10 10
2006 4 11 16 8 8 24 24
2007 7 14 21 6 5 11 32 32
2008 16 34 23 73 9 1 10 83 83
2009 7 33 40 1 1 41 41
2010 7 24 1 31 8 2 .. 10 41 41
NET CASH EXPENDITURES OF THE PETROLEUM INDUSTRY
Million dollars
1969-2016
October 2017Table 4.9
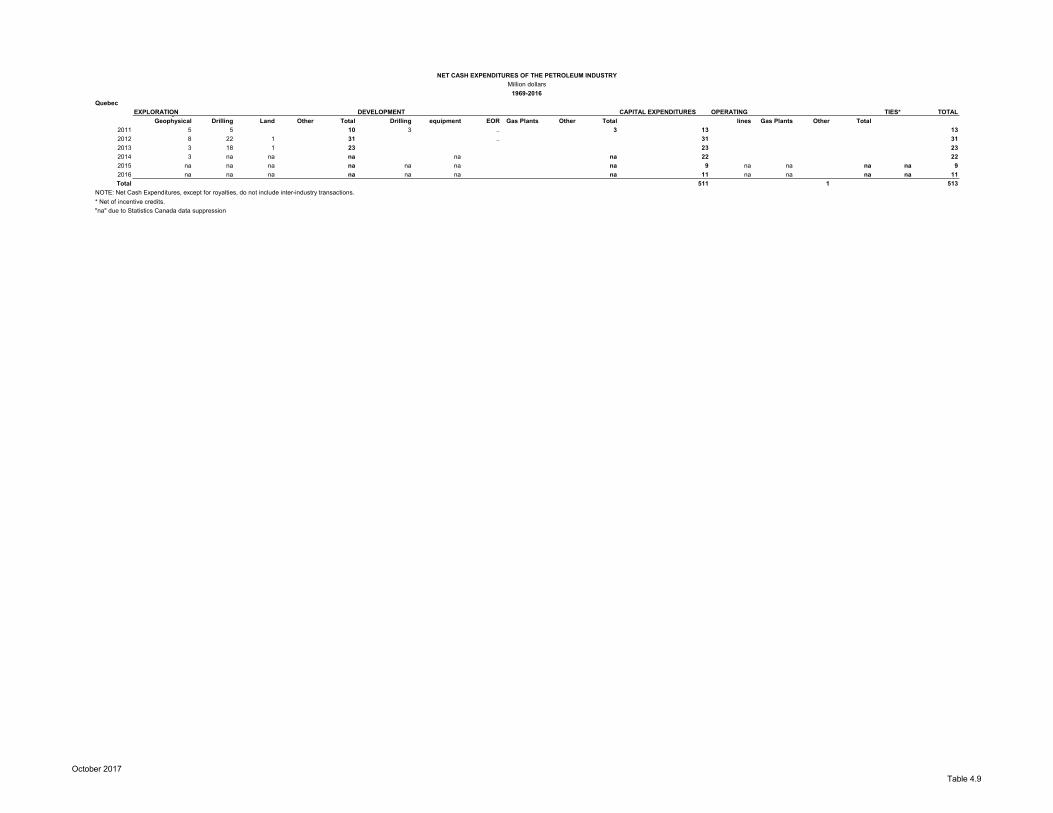
Quebec
EXPLORATION DEVELOPMENT CAPITAL EXPENDITURES OPERATING
ROYAL-
TIES* TOTALGeological &
Geophysical Drilling Land Other Total Drilling
Field
equipment EOR Gas Plants Other Total
Wells & flow
lines Gas Plants Other Total
NET CASH EXPENDITURES OF THE PETROLEUM INDUSTRY
Million dollars
1969-2016
2011 5 5 10 3 .. 3 13 13
2012 8 22 1 31 .. 31 31
2013 3 18 1 23 23 23
2014 3 na na na na na 22 22
2015 na na na na na na na 9 na na na na 9
2016 na na na na na na na 11 na na na na 11
Total 511 1 513
NOTE: Net Cash Expenditures, except for royalties, do not include inter-industry transactions.
* Net of incentive credits.
"na" due to Statistics Canada data suppression
October 2017Table 4.9

Atlantic ProvincesCAPITAL EXPENDITURES OPERATING ROYALTIES* TOTAL
Geological & Geophysical Drilling Land Other Total Drilling
Field equipment EOR
Gas Plants Other Total
Wells & flow lines
Gas Plants Other Total
1969 1 1 2 2
1970 1 1 2 2 2
1971 1 1 1
1972 1 2 1 4 4 4
1973 1 4 5 5 5
1974 2 2 2 2
1975 1 4 6 6 6
1976 1 1 1
1977 1 1 2 2 1 1 3
1978 1 1 2 1 1 3 3
1979 2 4 1 7 7 7
1980 4 2 6 6 6
1981 6 3 9 9 9
1982 6 6 12 12 12
1983 7 1 9 9 9
1984 4 2 7 7 7
1985 1 6 7 7 7
1986 1 3 4 4 4
1987 1 1 1 2 2
1988 1 1 2 2
1989
1990
1991
1992 1 1 1 1
1993
1994 3 6 9 9 9
1995 10 18 1 28 29 29
1996
1997
1998 1 .. 1 1 1
1999 1 12 13 13 13
2000 15 15 15 15
2001 3 33 36 1 1 37 37
2002 1 10 .. 10 10 10
2003 2 5 .. 7 2 3 4 11 12
2004 3 8 1 12 12 1 13
2005 4 15 20 4 17 21 40 1 1 42
2006 10 17 2 29 29 45 74 103 1 1 1 104
2007 2 35 1 38 58 46 104 141 4 5 9 6 157
2008 4 39 1 45 68 8 76 121 10 14 24 2 147
2009 6 16 22 19 4 22 44 13 4 17 3 64
1969-2016
NET CASH EXPENDITURES OF THE PETROLEUM INDUSTRYMillion dollars
DEVELOPMENTEXPLORATION
October 2017 Table 4.10

Atlantic ProvincesCAPITAL EXPENDITURES OPERATING ROYALTIES* TOTAL
Geological & Geophysical Drilling Land Other Total Drilling
Field equipment EOR
Gas Plants Other Total
Wells & flow lines
Gas Plants Other Total
1969-2016
NET CASH EXPENDITURES OF THE PETROLEUM INDUSTRYMillion dollars
DEVELOPMENTEXPLORATION
2010 4 39 43 8 5 13 56 9 3 12 1 69
2011 2 14 17 1 2 3 20 10 4 14 1 35
2012 1 2 1 3 1 1 4 7 4 11 15
2013 1 1 1 2 1 2 4 6 4 9 1 14
2014 na na na na na na 31 na na na na 68
2015 na na na na na na 5 na na na na 12
2016 na na na na na na 8 na na na na 16
Total 130 4 1 804 973
* Net of incentive credits
October 2017 Table 4.10


Eastcoast Offshore
EXPLORATION** DEVELOPMENT** OPERATINGROYALTIES
* TOTALGeological &
Geophysical Drilling Land Other Total Drilling
Field
equipment EOR
Gas
Plants Other Total
Wells &
flow lines Gas Plants Other Total
1967 6.4 2.5 0.4 0.3 9.6 0.2 0.2 0.0 9.81968 6.8 0.5 0.4 0.3 8.0 0.0 0.0 8.01969 7.3 5.9 2.4 0.7 16.3 0.0 0.0 16.31970 10.6 20.9 2.7 1.2 35.4 0.0 0.0 35.41971 17.9 31.5 2.3 51.7 0.6 0.3 0.9 0.0 52.61972 16.9 48.5 1.5 66.9 9.8 3.5 1.0 14.3 0.0 81.21973 18.5 58.8 1.0 78.3 11.7 0.5 0.1 12.3 0.0 90.61974 17.4 54.3 1.7 73.4 0.0 0.0 73.41975 17.4 56.6 1.4 75.4 0.0 0.0 75.41976 15.1 48.2 1.4 64.7 0.0 0.6 0.6 65.31977 17.0 23.8 1.6 42.4 1.0 1.0 0.2 0.2 43.61978 19.1 69.6 3.4 92.1 2.0 2.0 0.1 0.1 94.21979 21.4 204.2 1.7 227.3 1.9 5.7 7.6 0.4 0.4 0.8 235.71980 57.7 292.7 2.9 353.3 0.5 25.9 26.4 0.2 0.6 0.8 380.51981 74.1 388.3 3.0 465.4 10.1 10.1 0.1 0.1 475.61982 87.4 638.2 2.5 728.1 6.4 6.4 0.0 734.51983 67.6 1 192.7 1 260.3 3.1 3.1 0.0 1 263.41984 91.8 1 301.8 1 393.6 0.6 0.6 0.0 1 394.21985 62.4 1 142.5 1 204.9 0.0 0.0 1 204.91986 47.8 644.7 1.9 694.4 0.0 0.0 694.41987 14.2 202.4 2.0 218.6 0.1 0.1 0.0 218.71988 17.1 224.1 1.6 242.8 6.9 6.9 0.0 249.71989 18.6 93.0 111.6 0.3 36.1 36.4 0.0 148.01990 18.4 83.3 0.5 102.2 98.4 98.4 0.0 200.61991 29.7 100.9 8.4 139.0 521.7 521.7 0.1 0.1 660.81992 4.1 8.1 8.5 20.7 48.1 722.4 770.5 58.0 58.0 2.1 851.31993 1.7 4.4 6.1 (1) 1 106.9 1 106.9 102.9 102.9 3.4 1 219.31994 0.8 0.8 (1) 1 398.8 1 398.8 107.7 107.7 4.1 1 511.4Total 784.4 6 942.4 54.0 2.5 7 783.3 70.0 3 917.8 0.0 0.0 36.8 4 024.6 269.4 0.0 1.9 271.3 9.6 12 088.8
* Net of incentive credits.** Before PIP grantsNote: Effective 1995, Eastcoast split into Newfoundland & Nova Scotia Offshore. See Tables 12a & 13a.
NET CASH EXPENDITURES OF THE PETROLEUM INDUSTRY (Discontinued: see 4.12 and 4.13)Million dollars
1967-1994
November 2006 Table 4.11

Offshore Newfoundland & Labrador
EXPLORATION** DEVELOPMENT**CAPITAL EXPENDITURES OPERATING ROYALTIES* TOTAL
Geological & Geophysical Drilling Land Other Total Drilling Field equipment EOR Gas Plants Other Total Total
Wells & flow lines Gas Plants Other Total
1995 17 7 23 (1) 1 359 1 359 1 382 1 382
1996 15 37 1 52 (1) 846 846 898 898
1997 53 44 97 55 764 819 916 18 18 934
1998 54 40 94 107 771 878 972 181 181 4 1 157
1999 44 218 262 256 871 84 1 211 1 473 177 177 12 1 662
2000 62 110 172 383 597 20 1 000 1 172 167 167 45 1 384
2001 54 52 11 117 365 544 31 940 1 057 158 158 31 1 246
2002 58 125 14 196 275 620 39 933 1 129 320 320 65 1 514
2003 62 168 4 234 442 666 17 1 125 1 359 376 376 115 1 849
2004 42 3 11 56 599 531 52 1 182 1 237 351 351 208 1 797
2005 90 59 16 165 614 561 35 1 210 1 375 425 425 410 2 209
2006 100 395 1 495 639 140 779 1 274 719 719 404 2 397
2007 63 149 212 532 140 672 883 565 565 1 224 2 672
2008 50 61 111 560 503 1 063 1 174 706 706 2 394 4 273
2009 18 69 12 99 591 424 1 015 1 114 583 583 1 857 3 553
2010 15 364 4 382 239 256 .. 496 878 653 653 2 193 3 723
2011 30 207 1 238 504 685 30 1 219 1 457 774 774 3 246 5 477
2012 53 425 2 480 482 1 342 52 1 876 2 356 868 868 2 440 5 664
2013 41 569 14 623 639 2 577 21 3 237 3 860 874 874 2 452 7 185
2014 101 126 25 252 1 392 3 554 37 4 983 5 235 938 938 1 971 8 143
2015 720 638 1 1 359 883 3 145 1 4 029 5 388 736 736 572 6 696
2016 238 690 15 943 757 3 747 4 504 5 447 821 821 485 6 753
Total 1 977 4 546 137 6 660 10 312 24 644 419 35 376 42 035 10 407 10 407 20 125 72 568
* Net of incentive credits.** Before PIP grants
Note: Prior to 1995, Newfoundland & Nova Scotia Offshore combined into Eastcoast Offshore on Table 4.11
Note: Net Cash Expenditures, except for royalties, do not include inter-industry transactions.
(1) Development drilling & Field Equipment combined.
NET CASH EXPENDITURES OF THE PETROLEUM INDUSTRY
Million dollars
1995-2016
October 2017 Table 4.12

Offshore Nova Scotia
EXPLORATION** DEVELOPMENT**CAPITAL EXPENDITURES OPERATING ROYALTIES* TOTAL
Geological & Geophysical Drilling Land Other Total Drilling Field equipment EOR Gas Plants Other Total Total
Wells & flow lines Gas Plants Other Total
1995 1 1 3 3 6 7 107 107 4 118
1996 8 8 10 5 16 24 122 122 4 149
1997 10 10 11 38 49 59 111 111 2 172
1998 52 17 69 231 628 100 958 1 027 96 96 3 1 126
1999 68 51 119 373 557 177 1 108 1 227 102 102 1 1 330
2000 101 193 7 302 231 75 31 336 638 129 5 133 7 778
2001 118 294 8 419 211 124 18 352 772 142 31 174 11 956
2002 67 311 1 378 88 278 31 398 776 145 53 198 10 984
2003 88 192 2 283 195 293 36 525 807 123 43 166 23 996
2004 34 174 42 250 94 303 32 429 679 112 42 154 27 860
2005 1 37 44 82 166 205 25 396 478 122 39 161 94 733
2006 1 1 4 7 37 268 305 312 128 40 169 230 711
2007 6 1 113 119 30 1 31 150 166 46 213 264 627
2008 3 3 7 12 64 77 83 162 52 214 548 845
2009 43 15 58 213 357 570 628 175 62 237 151 1 016
2010 64 22 87 228 230 459 546 147 57 204 198 947
2011 3 3 145 145 147 134 53 187 167 500
2012 1 37 38 38 117 34 151 58 247
2013 1 1 40 40 41 183 34 217 41 299
2014 9 16 25 25 208 98 306 37 368
2015 1 5 7 7 254 50 304 15 326
2016 111 90 201 9 210
Total 670 1 271 261 2 202 2 113 3 697 457 6 268 8 470 3 093 829 3 923 1 902 14 295
* Net of incentive credits.** Before PIP grants
Note: Prior to 1995, Newfoundland & Nova Scotia Offshore combined into Eastcoast Offshore on Table 4.11a
Note: Net Cash Expenditures, except for royalties, do not include inter-industry transactions.
NET CASH EXPENDITURES OF THE PETROLEUM INDUSTRY
Million dollars
1995-2016
October 2017 Table 4.13

In-situ Mining Upgraders In-situ Mining Upgraders In-situ Mining Capital Operating Royalties Total
1958 1 1
1959 1 1
1960 1 1
1961 2 2
1962 25 25
1963 41 41
1964 80 80
1965 82 82
1966 132 132
1967 73 0 73
1968 39 10 1 49
1969 17 37 2 56
1970 25 36 1 63
1971 27 47 2 75
1972 14 49 4 66
1973 28 61 8 96
1974 102 77 21 200
1975 443 91 25 558
1976 623 145 32 799
1977 550 251 53 854
1978 400 550 60 1 010
1979 245 540 56 841
1980 431 771 248 1 450
1981 541 756 238 1 535
1982 386 1 052 274 1 711
1983 423 1 048 396 1 867
1984 510 1 064 179 1 754
1985 1 132 1 226 221 2 578
1986 613 1 208 12 1 833
1987 540 1 147 23 1 709
1988 864 1 483 19 2 366
1989 422 1 515 28 1 965
1990 731 1 539 47 2 317
1991 1 091 1 554 27 2 672
1992 639 1 579 46 2 265
1993 341 1 575 83 1 999
1994 273 1 679 185 2 137
1995 572 1 681 298 2 551
1996 1 286 1 888 518 3 693
1997 1 062 847 6 418 1 208 38 63 207 1 915 1 665 270 3 849
1998 642 883 18 434 1 125 96 32 35 1 543 1 654 67 3 264
1999 208 2 019 144 431 1 240 114 179 91 2 372 1 784 269 4 425
2000 645 3 419 159 477 1 654 158 154 662 4 223 2 289 816 7 328
2001 1 096 3 684 1 127 518 2 043 192 16 249 5 907 2 753 265 8 926
2002 1 457 4 170 1 124 423 1 976 158 120 62 6 751 2 557 182 9 490
2003 1 180 3 535 333 517 2 989 288 160 114 5 048 3 794 274 9 117
2004 1 986 4 105 92 715 3 310 316 268 501 6 183 4 341 769 11 293
2005 4 191 6 019 227 1 684 4 005 616 228 591 10 437 6 305 819 17 561
2006 7 569 5 992 776 2 153 5 165 734 624 1 563 14 337 8 051 2 187 24 575
Total
CANADA OIL SANDS EXPENDITURES
1958 - 2016
Million Dollars
Capital Expenditures Operating Costs Royalties
October 2017 Table 4.14

In-situ Mining Upgraders In-situ Mining Upgraders In-situ Mining Capital Operating Royalties Total
Total
CANADA OIL SANDS EXPENDITURES
1958 - 2016
Million Dollars
Capital Expenditures Operating Costs Royalties
2007 5 372 6 074 6 619 1 673 5 074 1 388 386 2 330 18 065 8 135 2 716 28 916
2008 5 565 7 126 5 423 3 574 5 725 1 807 1 242 2 303 18 113 11 105 3 545 32 763
2009 3 654 5 431 2 143 2 250 7 774 1 758 1 232 878 11 227 11 781 2 110 25 119
2010 5 236 8 751 3 207 3 119 6 980 3 177 2 338 1 409 17 195 13 275 3 747 34 217
2011 11 942 8 343 2 403 5 695 7 137 5 351 2 830 1 637 22 688 18 183 4 467 45 338
2012 13 804 10 984 2 411 6 928 7 561 5 599 2 466 1 217 27 199 20 089 3 683 50 971
2013 19 069 8 618 3 122 8 694 9 147 6 212 2 595 1 834 30 809 24 053 4 429 59 291
2014 19 734 12 968 1 165 8 937 10 065 5 303 3 898 1 945 33 868 24 305 5 843 64 016
2015 8 851 10 391 3 687 7 199 10 256 4 398 994 497 22 929 21 853 1 491 46 274
2016 4 245 8 211 2 969 5 981 10 519 3 607 737 151 15 426 20 108 888 36 422
289 974 232 741 41 942 564 656
Note: Includes the bi-provincial upgrader effective 1990.
Effective 2009, two projects previously included with in situ now combined with mining.
Note: Net Cash Expenditures, except for royalties, do not include inter-industry transactions.
Note: In the 1947-57 period, oil sands expenditures were nominal and are included in the conventional table (Table 4.2 & 3).
October 2017 Table 4.14

Table 4.15
1947 - 2016
Thousand Dollars
Territories
Crude Oil & Natural Pentanes
Condensate Gas Plus Propane Butanes Sulphur Total
1947 500 500
1948 677 677
1949 353 353
1950 335 335
1951 330 330
1952 379 379
1953 257 257
1954 385 385
1955 1 040 1 040
1956 940 940
1957 253 253
1958 839 839
1959 765 765
1960 644 644
1961 713 713
1962 624 624
1963 457 457
1964 565 565
1965 742 742
1966 853 853
1967 533 533
1968 909 909
1969 548 548
1970 1 142 1 142
1971 1 202 113 1 315
1972 1 058 1 443 2 501
1973 2 240 3 653 5 893
1974 3 241 3 796 7 037
1975 4 479 18 408 22 887
1976 3 581 32 178 35 759
1977 4 176 34 613 38 789
1978 6 241 31 085 37 326
1979 7 573 39 200 46 773
1980 10 771 41 955 52 726
1981 8 363 39 359 47 722
1982 11 133 16 901 28 034
1983 20 016 14 758 34 774
1984 16 277 15 430 31 707
1985 180 286 27 300 207 586
1986 106 700 13 100 119 800
1987 147 264 8 545 155 809
1988 122 153 4 592 126 745
1989 169 665 5 333 174 998
VALUE OF PRODUCERS' SALES
September 2017

Table 4.15
1947 - 2016
Thousand Dollars
Territories
Crude Oil & Natural Pentanes
Condensate Gas Plus Propane Butanes Sulphur Total
VALUE OF PRODUCERS' SALES
1990 247 807 3 972 251 779
1991 202 437 14 180 216 617
1992 189 729 26 900 216 629
1993 164 866 27 095 191 961
1994 171 634 33 281 204 915
1995 193 668 33 548 227 216
1996 243 309 29 596 272 905
1997 228 418 25 122 253 540
1998 163 744 47 867 211 611
1999 218 051 50 654 268 705
2000 361 681 171 372 533 053
2001 317 261 305 256 622 517
2002 329 545 158 652 488 197
2003 336 814 195 365 532 179
2004 366 674 152 801 519 475
2005 424 908 123 079 547 987
2006 450 531 67 371 517 902
2007 452 740 65 479 518 219
2008 564 573 52 306 616 879
2009 338 269 24 744 363 013
2010 410 930 21 249 432 179
2011 349 751 17 508 367 259
2012 378 427 10 685 389 112
2013 361 627 9 672 371 299
2014 360 918 12 462 373 380
2015 190 803 5 467 196 270
2016 160 512 3 849 164 361
Total 9 020 829 2 041 294 11 062 123
September 2017

Table 4.16
1947 - 2016Thousand Dollars
British Columbia
Crude Oil & Natural Pentanes
Condensate Gas Plus Propane Butanes Sulphur Ethane Total
1947 -1948 -1949 -1950 -1951 -1952 -1953 -1954 3 31955 1 9 101956 299 15 3141957 698 462 66 1 2261958 1 010 3 442 587 16 29 5 0841959 1 573 3 922 1 021 31 72 880 7 4991960 1 531 7 102 1 494 44 103 648 10 9221961 1 901 8 797 1 619 54 113 960 13 4441962 15 120 10 219 1 743 76 136 764 28 0581963 22 809 10 719 2 146 72 143 785 36 6741964 21 476 12 193 2 038 94 162 682 36 6451965 26 739 14 493 2 094 138 167 1 100 44 7311966 34 182 17 340 2 173 129 175 1 501 55 5001967 42 606 21 667 2 235 160 206 1 517 68 3911968 48 148 24 516 2 055 154 185 1 657 76 7151969 56 207 27 890 2 030 130 146 1 106 87 5091970 58 589 29 768 2 157 161 108 436 91 2191971 63 696 31 946 3 064 182 111 415 99 4141972 58 750 43 358 3 020 194 119 278 105 7191973 65 192 46 689 3 795 435 240 285 116 6361974 99 563 61 299 3 995 541 232 900 166 5301975 87 451 77 342 510 365 437 146 166 2511976 100 329 118 632 594 424 509 170 220 6581977 123 156 220 888 762 544 653 218 346 2211978 135 755 232 734 876 626 751 250 370 9921979 157 739 277 711 934 667 801 267 438 1191980 187 953 245 263 1 397 1 164 721 838 437 3361981 238 784 262 558 1 708 1 423 1 537 1 025 507 0351982 337 230 293 644 1 865 1 554 1 678 1 119 637 0901983 405 487 299 582 2 044 1 703 1 840 1 226 711 8821984 437 527 349 980 2 744 2 287 2 470 1 646 796 6541985 420 939 412 138 5 584 4 654 5 026 3 351 851 6921986 247 300 323 664 14 700 11 700 10 300 32 800 640 4641987 306 009 383 425 27 231 9 051 9 879 20 380 755 9751988 207 412 387 497 21 851 12 007 11 572 18 238 658 5771989 249 387 554 715 31 843 13 739 10 157 11 209 871 0501990 296 288 500 755 31 880 14 416 9 663 12 953 865 9551991 266 623 602 537 26 478 19 548 14 878 13 922 943 9861992 247 951 603 812 61 166 27 275 23 756 1 444 965 4041993 240 482 822 021 33 962 29 477 19 194 317 1 145 4531994 238 839 920 638 45 029 24 005 18 166 921 1 247 5981995 278 992 778 607 53 972 29 651 19 073 8 132 1 168 4271996 380 863 856 299 59 668 50 877 26 705 6 853 1 381 2651997 435 492 1 122 466 70 814 38 823 24 309 1 995 1 693 8991998 328 321 1 179 921 66 269 26 970 16 961 5 007 1 623 4491999 376 674 1 660 239 93 511 19 005 26 291 4 787 2 180 5072000 692 412 3 973 454 166 361 100 969 94 136 2 857 132 583 5 162 7722001 593 209 4 852 563 134 217 71 915 50 057 379 120 224 5 822 5642002 576 763 3 529 380 139 086 52 834 56 014 1 986 152 046 4 508 1092003 668 686 5 526 019 136 912 80 133 72 898 7 756 195 825 6 688 2292004 748 716 5 876 477 168 696 69 902 85 897 6 006 174 300 7 129 9942005 848 878 8 003 869 212 879 90 904 85 255 15 188 244 460 9 501 4332006 803 244 6 576 100 223 687 96 393 101 216 8 650 224 402 8 033 6922007 757 783 6 429 145 199 311 113 483 128 220 13 976 250 431 7 892 3492008 954 933 7 977 807 258 726 70 191 135 459 258 191 318 562 9 973 8692009 572 229 3 978 010 193 481 79 563 115 684 241 432 147 437 5 327 8362010 709 279 3 957 256 273 720 106 062 141 879 31 729 151 043 5 370 9682011 842 890 4 427 286 431 692 153 026 207 879 71 508 139 068 6 273 3492012 945 208 3 109 792 463 770 129 490 218 216 69 346 77 975 5 013 7972013 847 453 4 226 802 587 080 176 311 250 368 40 968 108 553 6 237 5352014 1 007 869 6 412 302 703 434 238 826 241 997 39 572 149 829 8 793 8292015 618 835 4 097 474 262 888 29 265 148 395 46 305 90 056 5 293 2182016 665 439 4 433 502 295 690 61 351 174 780 16 868 97 544 5 745 174Total 19 541 460 96 816 653 5 546 354 2 065 184 2 568 124 1 035 845 2 774 338 135 446 899
VALUE OF PRODUCERS' SALES
September 2017

Table 4.17
Alberta
Crude Oil & Condensate Oil Sands Natural Gas Pentanes Plus Propane Butanes Sulphur Ethane Total
1947 17 099 2 205 979 20 283
1948 33 578 2 448 1 549 10 37 585
1949 57 403 2 559 1 597 62 61 621
1950 80 568 2 930 1 648 162 46 85 354
1951 115 809 3 494 1 664 284 112 121 363
1952 139 658 5 936 1 663 453 189 85 147 984
1953 193 118 6 724 1 766 516 280 321 202 725
1954 228 012 8 038 1 979 711 348 373 239 461
1955 274 708 9 976 2 463 978 639 520 289 284
1956 355 682 10 960 2 637 1 084 641 666 371 670
1957 358 554 13 735 2 693 1 415 605 2 117 379 119
1958 285 922 20 080 2 887 1 481 644 1 826 312 840
1959 312 295 24 010 3 900 1 747 1 276 1 881 345 109
1960 318 418 31 300 4 579 2 348 1 649 4 182 362 476
1961 379 984 50 908 10 306 3 098 1 875 6 133 452 304
1962 388 483 78 869 23 062 4 067 2 279 8 308 505 068
1963 424 785 96 563 50 972 4 469 3 078 12 108 591 975
1964 450 322 113 193 60 209 5 901 5 938 16 790 652 353
1965 472 311 122 514 67 366 10 771 7 183 24 122 704 267
1966 522 688 135 465 71 084 15 752 9 700 37 225 791 914
1967 588 771 1 157 150 562 73 513 21 032 11 776 64 951 911 762
1968 644 742 15 743 170 961 84 038 21 732 13 284 76 318 1 026 818
1969 712 577 27 790 200 408 97 564 21 305 13 050 58 926 1 131 620
1970 844 066 32 831 243 877 114 373 26 911 14 961 27 435 1 304 454
1971 1 011 793 46 511 266 289 130 785 34 978 19 389 19 284 1 529 029
1972 1 210 465 62 283 307 328 173 285 44 110 26 464 17 738 1 841 673
1973 1 822 517 72 207 367 644 222 885 78 603 40 967 22 841 2 627 664
1974 2 878 934 108 853 594 325 352 459 177 091 108 409 67 492 4 287 563
1975 3 086 745 123 378 1 267 158 395 072 220 495 144 440 86 153 5 323 441
1976 3 262 137 159 874 2 101 022 403 076 233 309 171 107 69 291 6 399 816
1977 3 895 234 180 659 2 862 954 481 050 284 268 211 453 79 256 7 994 874
1978 4 617 278 261 529 3 241 397 513 179 260 123 198 742 99 587 9 191 835
1979 5 693 217 744 614 3 962 726 545 876 345 790 319 658 155 255 11 767 136
1980 6 185 126 1 676 690 5 121 089 586 216 466 298 423 324 433 616 14 892 359
1981 6 744 563 1 464 552 5 401 466 677 698 530 285 478 934 626 140 15 923 638
1982 8 800 431 1 860 031 6 046 401 885 919 492 614 524 191 551 424 19 161 011
1983 11 089 834 2 349 116 6 082 625 1 021 901 575 898 551 133 406 603 22 077 110
1984 12 601 912 2 027 133 6 823 809 1 123 032 661 651 580 872 582 926 24 401 335
1985 12 897 609 2 267 752 7 212 051 1 229 017 613 415 511 839 677 217 25 408 900
1986 6 268 100 1 710 000 5 048 900 709 400 405 400 297 400 683 200 331 400 15 453 800
1987 7 846 817 2 203 506 4 195 309 872 948 316 527 320 418 596 080 309 749 16 661 354
1988 6 087 782 1 696 201 4 373 621 699 994 286 860 260 234 583 102 312 619 14 300 413
1989 6 896 720 2 161 150 4 572 145 860 620 307 219 201 141 396 732 213 064 15 608 791
1990 8 209 930 2 799 416 4 667 014 1 061 809 564 306 332 258 368 108 351 600 18 354 441
1991 6 632 909 2 254 699 4 343 764 926 284 501 281 347 539 329 504 340 772 15 676 752
1992 6 834 737 2 455 312 4 812 505 1 018 284 499 332 332 932 100 361 387 360 16 440 823
1993 6 428 488 2 376 483 6 648 333 1 081 889 710 377 366 626 - 7 749 559 083 18 163 530
1994 6 868 172 2 672 068 8 091 072 1 178 144 614 117 371 599 77 793 491 827 20 364 792
1995 7 579 326 3 257 291 6 199 960 1 423 280 797 842 433 059 149 175 716 707 20 556 640
1996 9 124 475 4 033 080 7 759 663 1 855 870 1 306 123 544 401 76 533 733 510 25 433 655
1997 7 995 076 4 037 333 9 454 923 2 114 612 993 914 486 588 73 912 761 372 25 917 730
1998 5 289 170 3 076 306 9 586 956 1 537 142 606 399 340 326 49 802 608 950 21 095 051
1999 7 062 244 4 886 992 12 506 895 1 986 852 848 687 506 312 84 486 885 953 28 768 421
2000 10 756 814 8 044 464 23 091 079 3 132 047 1 783 429 1 178 251 80 273 1 784 240 49 850 597
2001 8 387 553 6 863 582 27 763 093 2 631 379 1 468 055 876 538 - 19 179 1 371 224 49 342 245
2002 8 455 043 9 258 239 19 176 129 2 412 277 969 515 736 947 50 038 1 796 824 42 855 012
2003 8 598 532 11 158 750 30 263 502 2 479 519 1 237 907 965 565 147 556 2 372 473 57 223 804
2004 9 858 369 14 939 911 31 081 965 3 625 838 1 590 900 1 333 286 193 191 2 604 319 65 227 779
2005 11 884 683 17 742 325 41 197 626 4 413 949 1 902 191 1 566 218 210 287 3 439 598 82 356 877
2006 12 247 584 23 258 822 32 819 824 4 703 480 1 994 999 1 771 641 132 332 2 704 134 79 632 816
2007 12 643 763 24 058 649 31 987 310 4 427 502 2 158 925 1 780 074 195 651 3 165 693 80 417 567
2008 17 481 340 37 770 107 36 321 192 6 418 642 2 439 239 2 578 604 1 566 104 3 376 540 107 951 768
2009 10 441 473 28 187 153 16 911 498 3 652 158 1 373 743 1 526 556 1 217 023 1 657 885 64 967 489
2010 12 302 458 36 689 960 15 564 696 4 535 183 1 842 426 1 914 279 208 223 1 565 847 74 623 072
2011 15 835 009 49 201 573 13 159 874 5 138 780 2 014 244 2 307 861 290 651 1 497 526 89 445 518
2012 16 377 538 48 664 547 8 663 030 4 714 080 1 263 479 1 994 893 400 480 950 473 83 028 520
2013 18 228 304 56 811 903 10 857 892 5 187 427 1 635 707 2 120 780 153 455 1 307 914 96 303 382
2014 19 358 227 69 894 721 15 921 669 5 741 307 1 813 162 1 692 741 167 698 1 823 058 116 412 583
2015 10 040 876 44 073 231 9 876 104 3 865 157 221 362 1 000 856 202 435 1 123 498 70 403 519
2016 8 170 090 40 418 875 7 507 208 3 880 249 253 444 1 033 850 116 047 1 006 462 62 386 225
Total 404 188 950 580 139 352 517 590 750 97 712 043 39 886 328 35 920 248 13 112 414 40 551 674 1 729 101 759
Does not include experimental crude and Alberta ethane until 1986.
Oil Sands does not represent the true value of all synthetic crude oil and includes bitumen
VALUE OF PRODUCERS' SALES
1947 - 2016
Thousand Dollars
September 2017

Table 4.18
Saskatchewan
Crude Oil & Natural Pentanes
Condensate Gas Plus Propane Butanes Total NGLs Sulphur Ethane Total
1947 537 25 562
1948 897 43 940
1949 709 46 755
1950 929 80 1 009
1951 1 460 85 1 545
1952 2 046 119 2 165
1953 3 483 162 3 645
1954 7 637 310 7 947
1955 17 481 561 18 042
1956 34 943 806 35 749
1957 77 600 1 105 78 705
1958 95 678 1 663 34 32 28 94 97 435
1959 97 416 3 101 294 379 258 931 8 101 456
1960 102 665 3 175 449 543 331 1 323 14 107 177
1961 115 037 3 272 453 609 347 1 409 59 119 777
1962 140 957 2 951 591 662 359 1 612 19 145 539
1963 159 284 3 267 648 823 456 1 927 1 164 479
1964 185 544 3 528 679 1 225 653 2 557 2 191 631
1965 199 817 3 963 580 1 703 709 2 992 13 206 785
1966 211 137 5 027 563 1 231 570 2 364 43 218 571
1967 211 032 5 410 689 1 271 621 2 581 89 219 112
1968 206 237 6 127 766 1 448 676 2 890 75 215 329
1969 195 462 6 245 820 1 341 522 2 683 49 204 439
1970 199 046 6 518 867 1 293 488 2 648 - 208 212
1971 216 665 7 438 781 1 307 542 2 630 6 226 739
1972 211 991 7 220 548 1 502 511 2 561 13 221 785
1973 261 823 7 536 688 1 358 822 2 868 21 272 248
1974 394 640 7 730 949 1 343 1 612 3 904 35 406 309
1975 404 183 9 033 1 021 1 741 1 770 4 532 43 417 791
1976 441 940 10 667 1 122 3 592 1 987 6 701 36 459 344
1977 576 697 12 957 1 369 4 290 2 397 8 056 35 597 745
1978 686 027 16 882 1 746 4 506 2 296 8 548 38 711 495
1979 724 904 17 231 1 879 4 680 5 213 11 772 36 753 943
1980 860 544 19 628 1 928 4 536 3 906 10 370 31 890 573
1981 818 716 19 720 1 340 3 368 1 831 6 539 1 198 846 173
1982 1 422 109 24 257 4 549 1 359 1 452 274
1983 1 783 478 50 171 7 613 3 730 1 844 992
1984 2 175 060 88 590 15 481 4 025 2 283 156
1985 2 375 722 112 148 16 285 3 114 2 507 269
1986 1 172 400 118 152 17 600 700 1 308 852
1987 1 511 466 153 167 18 080 1 682 713
1988 1 034 704 192 355 10 187 2 112 1 239 358
1989 1 237 286 265 606 8 022 1 410 1 512 324
1990 1 523 880 331 527 13 044 2 138 1 870 589
1991 1 186 480 342 305 11 676 1 832 1 542 293
1992 1 415 130 348 763 11 586 2 412 1 777 891
1993 1 489 127 350 056 13 270 3 141 1 855 594
1994 1 868 421 485 428 12 828 2 608 2 369 285
1995 2 288 783 382 478 16 096 3 784 2 691 141
1996 3 098 149 344 965 22 194 3 643 3 468 951
1997 2 959 671 387 618 22 937 4 524 3 374 750
1998 1 994 946 395 097 18 088 3 859 2 411 990
1999 3 086 785 644 536 25 050 4 613 3 760 984
2000 5 077 162 1 097 858 47 808 9 458 6 232 286
2001 3 818 710 1 307 269 48 154 8 495 5 182 628
2002 4 680 770 925 815 37 218 9 148 5 652 951
2003 4 950 163 1 523 275 21 208 9 138 6 503 784
2004 5 574 475 1 640 962 24 632 9 228 7 249 297
2005 6 698 478 1 999 514 29 764 12 052 8 739 808
2006 7 580 497 1 556 488 89 453 7 431 9 233 869
2007 8 106 294 1 350 229 104 720 5 936 9 567 179
2008 13 386 296 1 587 236 156 026 6 907 15 136 465
2009 8 976 920 727 089 143 442 3 381 9 850 832
2010 10 312 617 599 030 139 771 6 116 11 057 534
2011 12 334 344 455 218 170 785 4 375 12 964 722
2012 12 981 545 308 012 156 940 3 097 13 449 594
VALUE OF PRODUCERS' SALES
1947 - 2016
Thousand Dollars
September 2017

Table 4.18
Saskatchewan
Crude Oil & Natural Pentanes
Condensate Gas Plus Propane Butanes Total NGLs Sulphur Ethane Total
VALUE OF PRODUCERS' SALES
1947 - 2016
Thousand Dollars
2013 13 810 996 304 142 203 380 4 686 14 323 204
2014 15 391 248 394 609 217 337 7 483 16 010 677
2015 8 058 954 216 409 109 337 3 303 8 388 003
2016 6 757 501 181 946 110 042 13 861 7 063 350
Total 189 985 731 21 385 951 20 804 44 783 28 905 2 169 095 666 174 297 213 715 740
September 2017

Table 4.19
Manitoba
Crude Oil & Natural Pentanes
Condensate Gas Plus Propane Butanes Sulphur Total
1947
1948
1949
1950
1951 25 25
1952 182 182
1953 1 658 1 658
1954 5 566 5 566
1955 9 517 9 517
1956 13 417 13 417
1957 15 231 15 231
1958 14 265 14 265
1959 11 615 11 615
1960 10 690 10 690
1961 10 133 10 133
1962 9 500 9 500
1963 9 183 9 183
1964 10 694 10 694
1965 12 270 12 270
1966 13 087 13 087
1967 13 974 13 974
1968 15 561 15 561
1969 15 615 15 615
1970 14 858 14 858
1971 15 445 15 445
1972 14 586 14 586
1973 17 155 17 155
1974 27 182 27 182
1975 31 453 31 453
1976 33 533 33 533
1977 40 457 40 457
1978 45 953 45 953
1979 48 403 48 403
1980 54 958 54 958
1981 64 055 64 055
1982 100 537 100 537
1983 152 350 152 350
1984 169 296 169 296
1985 180 049 180 049
1986 95 400 300 100 95 800
1987 109 142 173 113 109 428
1988 78 655 151 101 78 907
1989 90 341 216 105 90 662
1990 114 980 398 186 115 564
1991 83 601 244 118 83 963
1992 86 476 227 107 86 810
1993 77 621 214 107 77 942
1994 82 377 190 104 82 671
1995 90 461 180 104 90 745
1996 106 601 113 46 106 760
1997 105 116 105 116
1998 73 958 73 958
1999 96 572 96 572
2000 165 411 165 411
2001 138 166 138 166
2002 149 777 149 777
2003 159 826 159 826
2004 195 667 195 667
2005 324 736 324 736
2006 465 105 465 105
VALUE OF PRODUCERS' SALES
1947 - 2016
Thousand Dollars
September 2017

Table 4.19
Manitoba
Crude Oil & Natural Pentanes
Condensate Gas Plus Propane Butanes Sulphur Total
VALUE OF PRODUCERS' SALES
1947 - 2016
Thousand Dollars
2007 618 712 618 712
2008 830 122 830 122
2009 616 146 616 146
2010 852 535 852 535
2011 1 371 048 1 371 048
2012 1 564 286 1 564 286
2013 1 697 531 1 697 531
2014 1 670 537 1 670 537
2015 939 364 939 364
2016 741 604 741 604
Total 14 994 327 2 406 1 191 14 997 924
September 2017

Table 4.20
VALUE OF PRODUCERS' SALES
1947 - 2016
Thousand Dollars
Western Canada*
Crude Oil & Natural Pentanes
Condensate Oil Sands Gas Plus Propane Butanes Total NGLs Sulphur Ethane Total
1947 18 136 2 230 979 979 21 345
1948 35 152 2 491 1 549 10 1 559 39 202
1949 58 465 2 605 1 597 62 1 659 62 729
1950 81 832 3 010 1 648 162 46 1 856 86 698
1951 117 624 3 579 1 664 284 112 2 060 123 263
1952 142 265 6 055 1 663 453 189 2 305 85 150 710
1953 198 516 6 886 1 766 516 280 2 562 321 208 285
1954 241 600 8 351 1 979 711 348 3 038 373 253 362
1955 302 747 10 546 2 463 978 639 4 080 520 317 893
1956 405 281 11 781 2 637 1 084 641 4 362 666 422 090
1957 452 336 15 302 2 759 1 415 605 4 779 2 117 474 534
1958 397 714 25 185 3 508 1 529 701 5 738 1 826 430 463
1959 423 664 31 033 5 215 2 157 1 606 8 978 2 769 466 444
1960 433 948 41 577 6 522 2 935 2 083 11 540 4 844 491 909
1961 507 768 62 977 12 378 3 761 2 335 18 474 7 152 596 371
1962 554 684 92 039 25 396 4 805 2 774 32 975 9 091 688 789
1963 616 518 110 549 53 766 5 364 3 677 62 807 12 894 802 768
1964 668 601 128 914 62 926 7 220 6 753 76 899 17 474 891 888
1965 711 879 140 970 70 040 12 612 8 059 90 711 25 235 968 795
1966 781 947 157 832 73 820 17 112 10 445 101 377 38 769 1 079 925
1967 856 916 1 157 177 639 76 437 22 463 12 603 111 503 66 557 1 213 772
1968 915 597 15 743 201 604 86 859 23 334 14 145 124 338 78 050 1 335 332
1969 980 409 27 790 234 543 100 414 22 776 13 718 136 908 60 081 1 439 731
1970 1 117 701 32 831 280 163 117 397 28 365 15 557 161 319 27 871 1 619 885
1971 1 308 801 46 511 305 786 134 630 36 467 20 042 191 139 19 705 1 871 942
1972 1 496 850 62 683 359 349 176 853 45 806 27 094 249 753 18 029 2 186 664
1973 2 168 927 72 207 425 522 227 368 80 396 42 029 349 793 23 147 3 039 596
1974 3 403 560 108 853 667 150 357 403 178 975 110 253 646 631 68 427 4 894 621
1975 3 614 311 123 378 1 371 941 396 603 222 601 146 647 765 851 86 342 5 961 823
1976 3 841 520 159 874 2 262 499 404 792 237 325 173 603 815 720 69 497 7 149 110
1977 4 639 720 180 659 3 131 412 483 181 289 102 214 503 986 786 79 509 9 018 086
1978 5 491 254 261 529 3 522 098 515 801 265 255 201 789 982 845 99 875 10 357 601
1979 6 631 836 744 614 4 296 868 548 689 351 137 325 672 1 225 498 155 558 13 054 374
1980 7 299 342 1 676 690 5 427 935 589 541 471 998 427 951 1 489 490 434 485 16 327 942
1981 7 874 481 1 464 552 5 723 103 680 746 535 076 482 302 1 698 124 627 165 1 198 17 388 623
1982 10 671 440 1 860 031 6 381 203 1 912 370 552 543 1 359 21 378 946
1983 13 451 165 2 349 116 6 447 136 2 162 132 407 829 3 730 24 821 108
1984 15 400 072 2 027 133 7 277 809 2 428 028 584 572 4 025 27 721 639
1985 16 054 605 2 267 752 7 763 637 2 378 057 680 568 3 114 29 147 733
1986 7 889 900 1 710 000 5 503 816 1 466 900 716 000 332 100 17 618 716
1987 9 920 698 2 203 506 4 740 446 1 574 420 616 460 309 749 19 365 279
1988 7 530 706 1 696 201 4 958 065 1 302 957 601 340 314 731 16 404 000
1989 8 643 399 2 161 150 5 397 799 1 433 062 407 941 214 474 18 257 825
1990 10 392 985 2 799 416 5 503 268 2 027 960 381 061 353 738 21 458 428
1991 8 372 050 2 254 699 5 302 786 1 848 046 343 426 342 604 18 463 611
1992 8 774 023 2 455 312 5 791 980 1 974 665 101 805 389 772 19 487 557
1993 8 400 584 2 376 483 7 847 505 2 255 116 - 7 432 562 224 21 434 480
1994 9 229 443 2 672 068 9 530 419 2 264 182 78 714 494 435 24 269 261
1995 10 431 230 3 257 291 7 394 593 2 773 257 157 307 720 491 24 734 169
1996 12 953 397 4 033 080 8 990 523 3 865 997 83 386 737 153 30 663 536
1997 11 723 773 4 037 333 10 990 129 3 751 997 75 907 765 896 31 345 035
1998 7 850 139 3 076 306 11 209 841 2 612 155 54 809 612 909 25 416 159
1999 10 840 326 4 886 992 14 862 324 3 505 708 89 273 890 566 35 075 189
2000 17 053 480 8 044 464 28 333 763 6 503 001 83 130 1 926 281 61 944 119
2001 13 254 899 6 863 582 34 228 181 5 280 315 - 18 800 1 499 943 61 108 120
2002 14 191 898 9 258 239 23 789 976 4 403 891 52 024 1 958 018 53 654 046
2003 14 714 021 11 158 750 37 508 161 5 031 761 155 312 2 577 436 71 145 441
2004 16 743 901 14 939 911 38 752 205 6 943 994 199 197 2 787 847 80 367 055
2005 20 181 683 17 742 325 51 324 088 8 355 760 225 475 3 696 110 101 525 441
2006 21 546 961 23 258 822 41 019 783 8 980 869 122 281 2 935 967 97 864 683
2007 22 579 292 24 058 649 39 832 163 8 912 235 209 627 3 422 060 99 014 026
2008 33 217 264 37 770 107 45 938 541 12 056 646 1 824 295 3 703 053 134 509 906
2009 20 945 037 28 187 153 21 641 341 7 078 076 1 458 455 1 810 693 81 120 755
2010 24 587 819 36 689 960 20 142 231 8 980 046 239 952 1 726 654 92 366 662
2011 30 733 042 49 325 138 18 059 886 10 472 911 362 159 1 646 269 110 599 405
2012 32 312 851 49 031 062 12 036 828 8 962 238 338 966 1 032 027 103 713 972
2013 34 945 911 56 811 903 15 410 597 10 161 053 194 423 1 421 153 118 945 040
2014 37 788 799 69 894 721 22 755 996 10 648 804 207 270 1 980 370 143 275 960
2015 19 848 832 44 073 231 14 200 770 5 637 260 248 740 1 216 857 85 225 690
2016 16 495 146 40 418 875 12 128 291 5 809 406 132 915 1 117 867 76 102 500
Total 638 462 673 580 629 832 642 247 604 5 230 989 2 874 246 2 269 201 186 129 711 13 999 364 43 512 873 2 104 982 057
Note: Effective 1982 NGL represents value of pentanes plus, propane and butanes.
*Does not include experimental crude and Alberta ethane until 1986.
**Does not represent the true value of all synthetic crude oil and includes bitumen
Ethane represents value of Saskatchewan production only until 1985.
September 2017
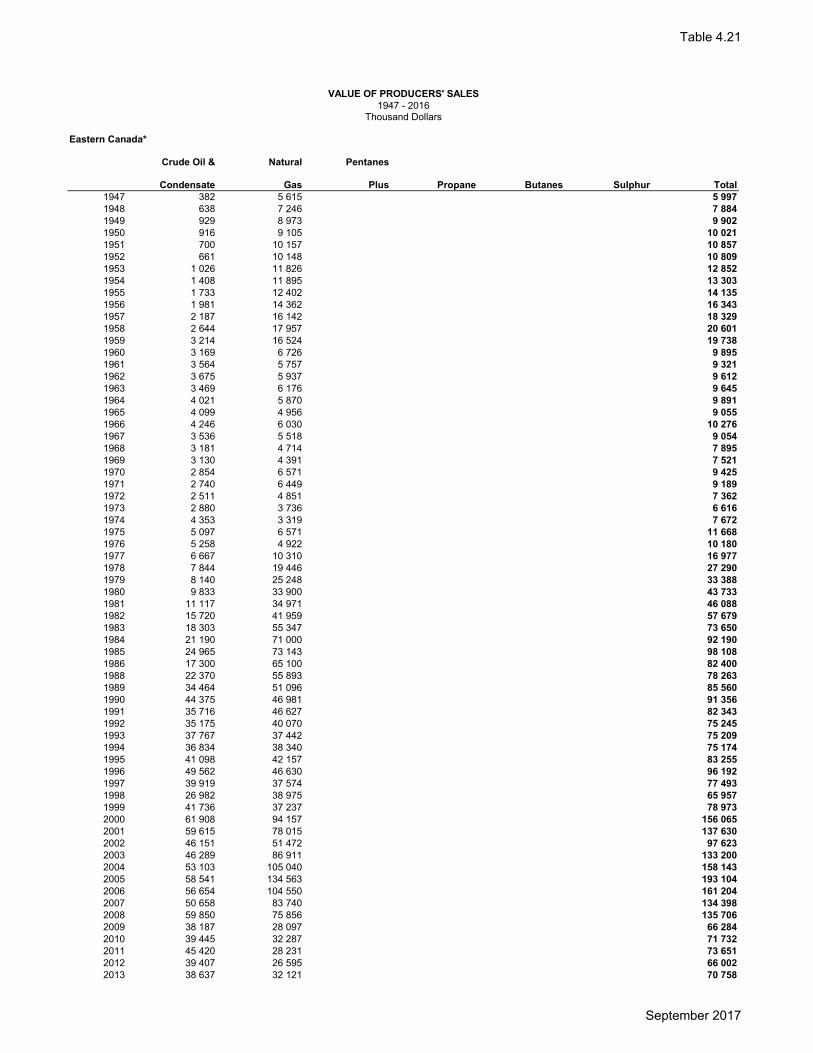
Table 4.21
VALUE OF PRODUCERS' SALES1947 - 2016
Thousand Dollars
Eastern Canada*
Crude Oil & Natural Pentanes
Condensate Gas Plus Propane Butanes Sulphur Total1947 382 5 615 5 9971948 638 7 246 7 8841949 929 8 973 9 9021950 916 9 105 10 0211951 700 10 157 10 8571952 661 10 148 10 8091953 1 026 11 826 12 8521954 1 408 11 895 13 3031955 1 733 12 402 14 1351956 1 981 14 362 16 3431957 2 187 16 142 18 3291958 2 644 17 957 20 6011959 3 214 16 524 19 7381960 3 169 6 726 9 8951961 3 564 5 757 9 3211962 3 675 5 937 9 6121963 3 469 6 176 9 6451964 4 021 5 870 9 8911965 4 099 4 956 9 0551966 4 246 6 030 10 2761967 3 536 5 518 9 0541968 3 181 4 714 7 8951969 3 130 4 391 7 5211970 2 854 6 571 9 4251971 2 740 6 449 9 1891972 2 511 4 851 7 3621973 2 880 3 736 6 6161974 4 353 3 319 7 6721975 5 097 6 571 11 6681976 5 258 4 922 10 1801977 6 667 10 310 16 9771978 7 844 19 446 27 2901979 8 140 25 248 33 3881980 9 833 33 900 43 7331981 11 117 34 971 46 0881982 15 720 41 959 57 6791983 18 303 55 347 73 6501984 21 190 71 000 92 1901985 24 965 73 143 98 1081986 17 300 65 100 82 4001988 22 370 55 893 78 2631989 34 464 51 096 85 5601990 44 375 46 981 91 3561991 35 716 46 627 82 3431992 35 175 40 070 75 2451993 37 767 37 442 75 2091994 36 834 38 340 75 1741995 41 098 42 157 83 2551996 49 562 46 630 96 1921997 39 919 37 574 77 4931998 26 982 38 975 65 9571999 41 736 37 237 78 9732000 61 908 94 157 156 0652001 59 615 78 015 137 6302002 46 151 51 472 97 6232003 46 289 86 911 133 2002004 53 103 105 040 158 1432005 58 541 134 563 193 1042006 56 654 104 550 161 2042007 50 658 83 740 134 3982008 59 850 75 856 135 7062009 38 187 28 097 66 2842010 39 445 32 287 71 7322011 45 420 28 231 73 6512012 39 407 26 595 66 0022013 38 637 32 121 70 758
September 2017
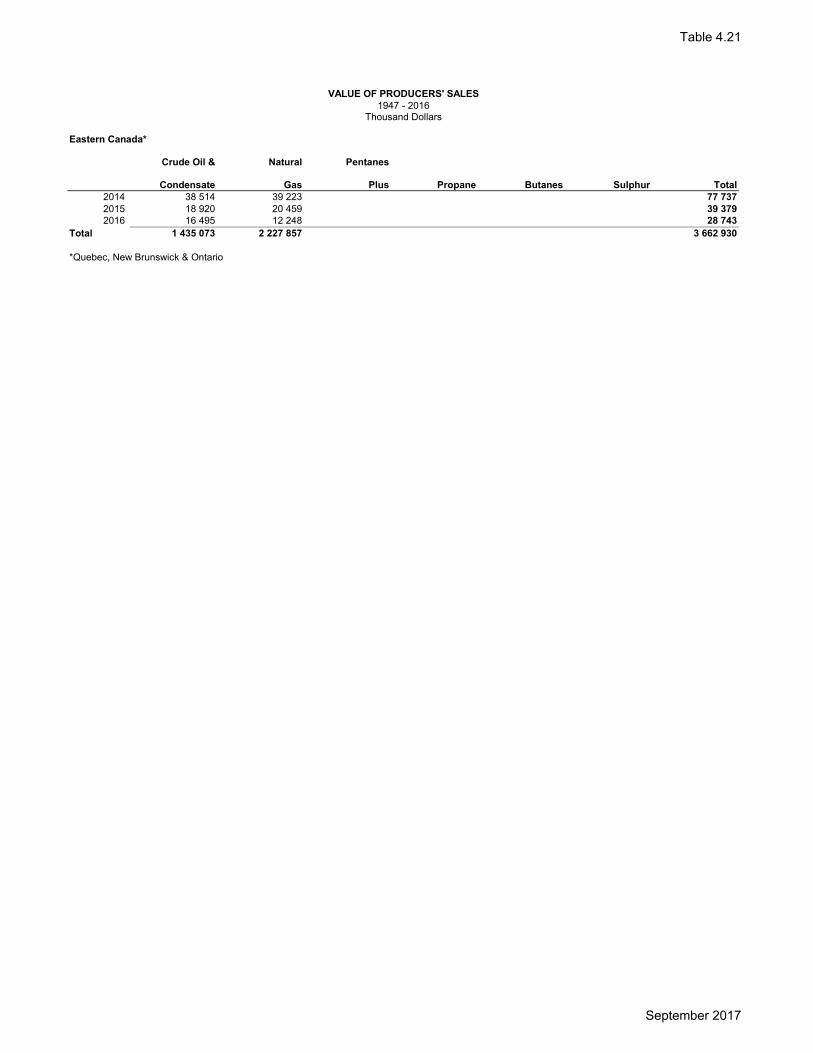
Table 4.21
VALUE OF PRODUCERS' SALES1947 - 2016
Thousand Dollars
Eastern Canada*
Crude Oil & Natural Pentanes
Condensate Gas Plus Propane Butanes Sulphur Total2014 38 514 39 223 77 7372015 18 920 20 459 39 3792016 16 495 12 248 28 743
Total 1 435 073 2 227 857 3 662 930
*Quebec, New Brunswick & Ontario
September 2017

Table 4.22
1992 - 2016Thousand Dollars
Eastcoast Offshore
Natural Pentanes
Nova Scotia Newfoundland Gas Plus Propane Butanes Sulphur Total
1992 96 097 96 097
1993 160 929 160 929
1994 201 244 201 244
1995 196 714 196 714
1996 195 309 195 309
1997 102 712 23 999 126 711
1998 119 482 443 612 563 094
1999 55 590 997 530 1 053 120
2000 2 203 329 778 041 2 981 370
2001 2 037 826 938 030 28 847 20 654 3 025 357
2002 4 079 916 805 363 32 278 34 722 4 952 279
2003 5 030 106 1 120 605 59 086 54 524 6 264 321
2004 5 651 785 1 029 457 40 579 40 898 6 762 719
2005 7 026 278 1 286 593 61 274 70 838 8 444 983
2006 7 426 216 922 872 48 466 68 222 8 465 776
2007 10 231 902 1 000 323 51 293 67 923 11 351 441
2008 12 282 515 1 276 326 76 561 111 462 13 746 864
2009 6 618 585 443 751 55 799 55 750 7 173 885
2010 8 285 891 437 517 75 306 63 257 8 861 971
2011 10 771 879 342 836 76 203 70 291 11 261 209
2012 8 214 449 165 784 30 259 38 488 8 448 980
2013 9 398 736 197 458 29 431 30 393 9 656 018
2014 7 089 538 549 900 33 322 24 000 7 696 760
2015 4 188 361 199 262 3 497 12 885 4 404 005
2016 4 438 305 133 736 5 261 11 559 4 588 861
Total 1 128 077 116 440 758 11 627 854 707 462 775 866 130 680 017
Crude Oil & Condensate
VALUE OF PRODUCERS' SALES
September 2017

Table 4.23
VALUE OF PRODUCERS' SALES
1947 - 2016
Thousand Dollars
Canada*
Crude Oil & Natural Pentanes
Condensate Oil Sands Gas Plus Propane Butanes Total NGLs Sulphur Ethane Total
1947 18 518 7 845 979 979 27 342
1948 35 790 9 737 1 549 10 1 559 47 086
1949 59 394 11 578 1 597 62 1 659 72 631
1950 82 748 12 115 1 648 162 46 1 856 96 719
1951 118 324 13 736 1 664 284 112 2 060 134 120
1952 142 926 16 203 1 663 453 189 2 305 85 161 519
1953 199 542 18 712 1 766 516 280 2 562 321 221 137
1954 243 008 20 246 1 979 711 348 3 038 373 266 665
1955 304 480 22 948 2 463 978 639 4 080 520 332 028
1956 407 262 26 143 2 637 1 084 641 4 362 666 438 433
1957 454 523 31 444 2 759 1 415 605 4 779 2 117 492 863
1958 400 358 43 142 3 508 1 529 701 5 738 1 826 451 064
1959 426 878 47 557 5 215 2 157 1 606 8 978 2 769 486 182
1960 437 117 48 303 6 522 2 935 2 083 11 540 4 844 501 804
1961 511 332 68 734 12 378 3 761 2 335 18 474 7 152 605 692
1962 558 359 97 976 25 396 4 805 2 774 32 975 9 091 698 401
1963 619 987 116 725 53 766 5 364 3 677 62 807 12 894 812 413
1964 672 622 134 784 62 926 7 220 6 753 76 899 17 474 901 779
1965 715 978 145 926 70 040 12 612 8 059 90 711 25 235 977 850
1966 786 193 163 862 73 820 17 112 10 445 101 377 38 769 1 090 201
1967 860 452 1 157 183 157 76 437 22 463 12 603 111 503 66 557 1 222 826
1968 918 778 15 743 206 318 86 859 23 334 14 145 124 338 78 050 1 343 227
1969 983 539 27 790 238 934 100 414 22 776 13 718 136 908 60 081 1 447 252
1970 1 120 555 32 831 286 734 117 397 28 365 15 557 161 319 27 871 1 629 310
1971 1 311 541 46 511 312 235 134 630 36 467 20 042 191 139 19 705 1 881 131
1972 1 499 361 62 283 364 200 176 853 45 806 27 094 249 753 18 029 2 193 626
1973 2 171 807 72 207 429 258 227 368 80 396 42 029 349 793 23 147 3 046 212
1974 3 407 913 108 853 670 469 357 403 178 975 110 253 646 631 68 427 4 902 293
1975 3 619 408 123 378 1 378 512 396 603 222 601 146 647 765 851 86 342 5 973 491
1976 3 846 778 159 874 2 267 421 404 792 237 325 173 603 815 720 69 497 7 159 290
1977 4 646 387 180 659 3 141 722 483 181 289 102 214 503 986 786 79 509 9 035 063
1978 5 499 098 261 529 3 541 544 515 801 265 255 201 789 982 845 99 875 10 384 891
1979 6 639 976 744 614 4 322 116 548 689 351 137 325 672 1 225 498 155 558 13 087 762
1980 7 309 175 1 676 690 5 461 835 589 541 471 998 427 951 1 489 490 434 485 16 371 675
1981 7 885 598 1 464 552 5 762 074 680 746 535 076 482 302 1 698 124 627 165 1 198 17 438 711
1982 10 687 160 1 860 031 6 423 162 1 912 370 552 543 1 359 21 436 625
1983 13 469 468 2 349 116 6 502 483 2 162 132 407 829 3 730 24 894 758
1984 15 421 262 2 027 133 7 348 809 2 428 028 584 572 4 025 27 813 829
1985 16 079 570 2 267 752 7 836 780 2 378 057 680 568 3 114 29 245 841
1986 7 907 200 1 710 000 5 568 916 1 466 900 716 000 332 100 17 701 116
1987 9 939 956 2 203 506 4 802 400 1 574 420 616 460 309 749 19 446 491
1988 7 553 076 1 696 201 5 013 958 1 302 957 601 340 314 731 16 482 263
1989 8 677 863 2 161 150 5 448 895 1 433 062 407 941 214 474 18 343 385
1990 10 437 260 2 799 416 5 550 249 2 027 960 381 061 353 738 21 549 684
1991 8 407 766 2 254 699 5 349 413 1 848 046 343 426 342 604 18 545 954
1992 8 905 295 2 455 312 5 832 050 1 974 665 101 805 389 772 19 658 899
1993 8 598 980 2 376 483 7 884 947 2 255 116 - 7 432 562 224 21 670 318
1994 9 467 521 2 672 068 9 568 759 2 264 182 78 714 494 435 24 545 679
1995 10 669 042 3 257 291 7 436 750 2 773 257 157 307 720 491 25 014 138
1996 13 198 268 4 033 080 9 037 153 3 865 997 83 386 737 153 30 955 037
1997 11 890 402 4 037 333 11 027 703 3 751 997 75 907 765 896 31 549 238
1998 8 440 215 3 076 306 11 248 816 2 612 155 54 809 612 809 26 045 110
1999 11 935 182 4 886 992 14 899 561 3 505 708 89 273 890 566 36 207 282
2000 19 318 717 8 044 464 29 205 961 6 503 001 83 130 1 926 281 65 081 554
2001 15 352 240 6 863 582 35 244 226 5 329 816 - 18 800 1 499 943 64 271 007
2002 18 317 965 9 258 239 24 646 811 4 470 891 52 024 1 958 018 58 703 948
2003 19 790 416 11 158 750 38 715 677 5 145 371 155 312 2 577 436 77 542 962
2004 22 448 789 14 939 911 39 886 702 7 025 471 199 197 2 787 847 87 287 917
2005 27 266 502 17 742 325 52 745 244 8 487 872 225 475 3 696 110 110 163 528
2006 29 029 831 23 258 822 42 047 205 9 097 557 140 982 2 935 967 106 510 364
2007 32 861 852 24 058 649 40 916 226 9 031 451 209 627 3 422 060 110 499 865
2008 45 559 629 37 770 107 47 290 723 12 244 669 1 824 295 3 703 053 148 392 476
2009 27 601 809 28 187 153 22 113 189 7 189 625 1 458 455 1 810 693 88 360 924
2010 32 913 155 36 689 960 20 612 035 9 118 609 239 952 1 726 654 101 300 365
2011 41 550 341 49 325 138 18 430 953 10 598 240 362 159 1 646 269 121 913 100
2012 40 566 707 49 031 062 12 218 942 9 030 985 338 966 1 032 027 112 218 689
2013 44 383 284 56 811 903 15 628 087 10 220 877 194 423 1 421 153 128 659 727
2014 44 916 851 69 894 721 23 330 165 10 706 126 207 270 1 980 370 151 035 503
2015 24 056 113 44 073 231 14 415 175 5 653 642 248 740 1 216 857 89 663 758
2016 20 949 946 40 418 875 12 272 489 5 826 226 132 915 1 117 867 80 718 318
Total 757 485 338 580 629 432 656 124 859 5 230 989 2 874 246 2 269 201 187 591 874 14 018 065 43 512 773 2 239 362 341
Note: Effective 1982 NGL represents value of pentanes plus, propane and butanes.
*Does not include experimental crude and Alberta ethane until 1986.
Oil Sands does not represent the true value of all synthetic crude oil and includes bitumen
Ethane represents value of Saskatchewan production only until 1985.
September 2017

CAPP Statistical Handbook
Section 5
Prices
Table Western Canada Average Prices of Crude Oil & Natural Gas & Consumer Price Index 1947 – Present ...................................................................................................................................... 5.1 Average Prices of Crude Oil & Natural Gas by Province 1951 - Present ...................................................................................................................................... 5.2 Representative Retail Prices - Regular Unleaded Gasoline 1990 - Present ....................................................................................................................................... 5.3 Reference Crude Oil Prices & US Foreign Exchange Rates by Month 1986 – Current ....................................................................................................................................... 5.4 Reference Natural Gas Prices 1990 – Current ....................................................................................................................................... 5.5

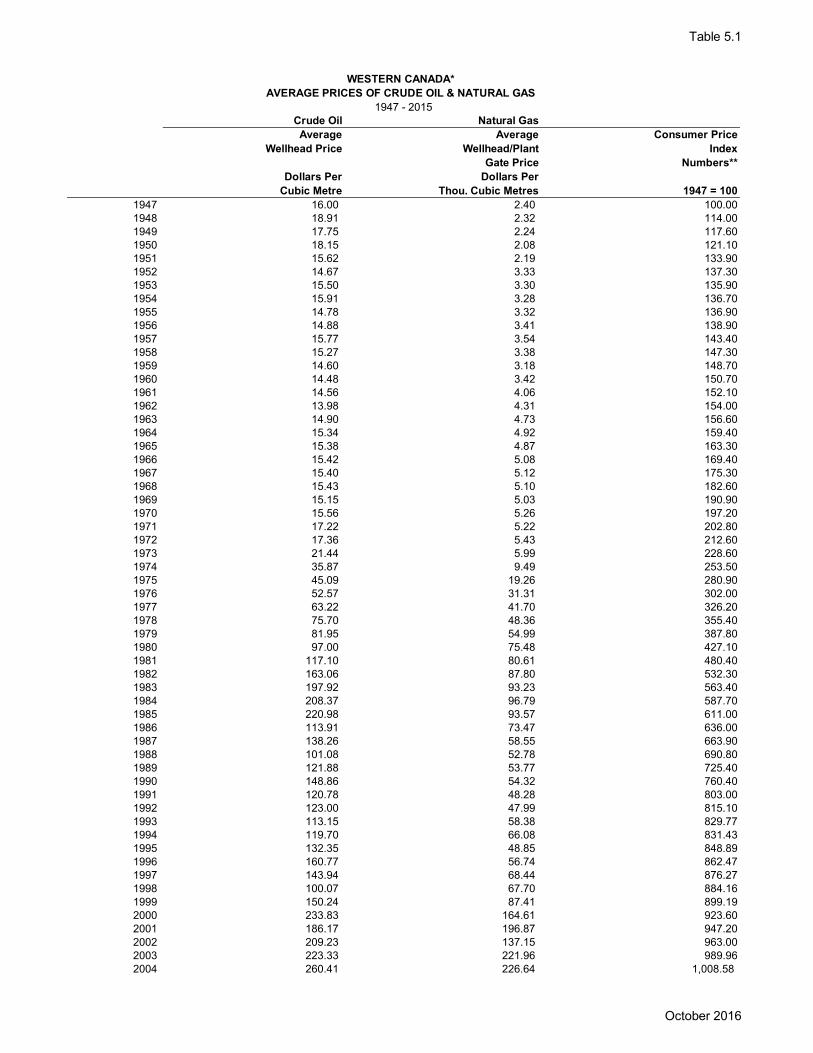
Table 5.1
WESTERN CANADA*
AVERAGE PRICES OF CRUDE OIL & NATURAL GAS
1947 - 2015Crude Oil Natural Gas
Average Average Consumer Price
Wellhead Price Wellhead/Plant Index
Gate Price Numbers**
Dollars Per Dollars Per
Cubic Metre Thou. Cubic Metres 1947 = 100
1947 16.00 2.40 100.001948 18.91 2.32 114.001949 17.75 2.24 117.601950 18.15 2.08 121.101951 15.62 2.19 133.901952 14.67 3.33 137.301953 15.50 3.30 135.901954 15.91 3.28 136.701955 14.78 3.32 136.901956 14.88 3.41 138.901957 15.77 3.54 143.401958 15.27 3.38 147.301959 14.60 3.18 148.701960 14.48 3.42 150.701961 14.56 4.06 152.101962 13.98 4.31 154.001963 14.90 4.73 156.601964 15.34 4.92 159.401965 15.38 4.87 163.301966 15.42 5.08 169.401967 15.40 5.12 175.301968 15.43 5.10 182.601969 15.15 5.03 190.901970 15.56 5.26 197.201971 17.22 5.22 202.801972 17.36 5.43 212.601973 21.44 5.99 228.601974 35.87 9.49 253.501975 45.09 19.26 280.901976 52.57 31.31 302.001977 63.22 41.70 326.201978 75.70 48.36 355.401979 81.95 54.99 387.801980 97.00 75.48 427.101981 117.10 80.61 480.401982 163.06 87.80 532.301983 197.92 93.23 563.401984 208.37 96.79 587.701985 220.98 93.57 611.001986 113.91 73.47 636.001987 138.26 58.55 663.901988 101.08 52.78 690.801989 121.88 53.77 725.401990 148.86 54.32 760.401991 120.78 48.28 803.001992 123.00 47.99 815.101993 113.15 58.38 829.771994 119.70 66.08 831.431995 132.35 48.85 848.891996 160.77 56.74 862.471997 143.94 68.44 876.271998 100.07 67.70 884.161999 150.24 87.41 899.192000 233.83 164.61 923.602001 186.17 196.87 947.202002 209.23 137.15 963.002003 223.33 221.96 989.962004 260.41 226.64 1,008.58
October 2016
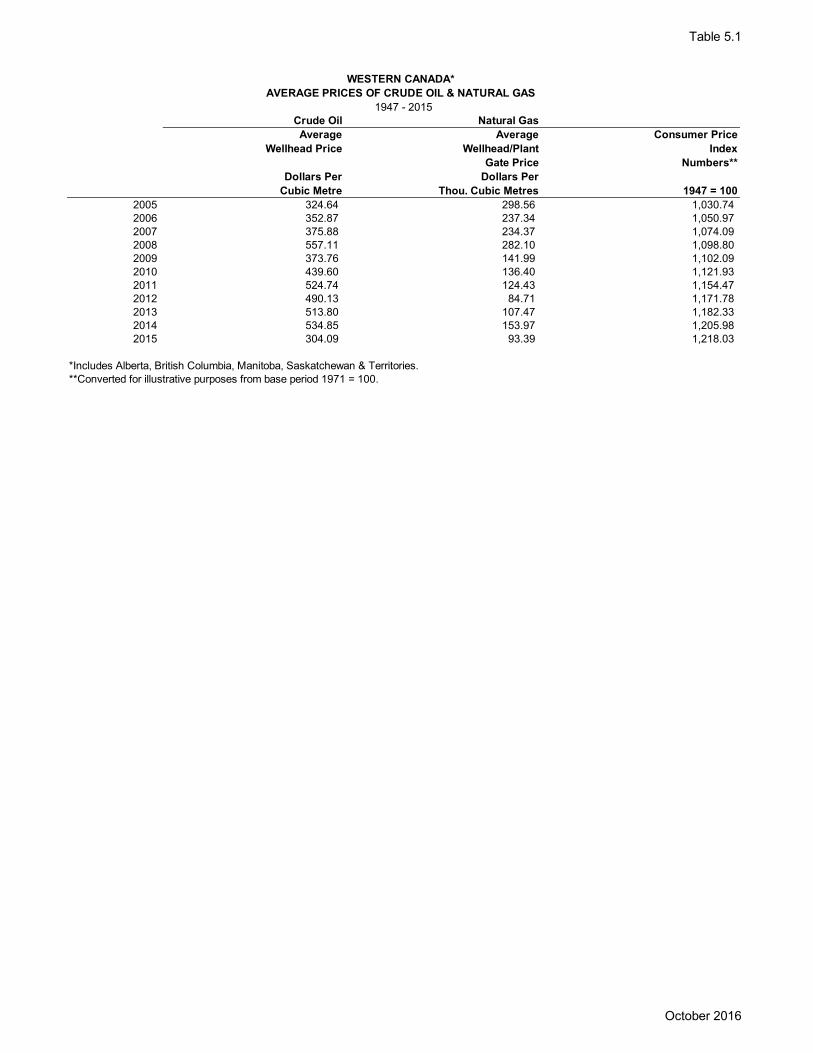
Table 5.1
WESTERN CANADA*
AVERAGE PRICES OF CRUDE OIL & NATURAL GAS
1947 - 2015Crude Oil Natural Gas
Average Average Consumer Price
Wellhead Price Wellhead/Plant Index
Gate Price Numbers**
Dollars Per Dollars Per
Cubic Metre Thou. Cubic Metres 1947 = 100
2005 324.64 298.56 1,030.74 2006 352.87 237.34 1,050.97 2007 375.88 234.37 1,074.09 2008 557.11 282.10 1,098.80 2009 373.76 141.99 1,102.09 2010 439.60 136.40 1,121.93 2011 524.74 124.43 1,154.47 2012 490.13 84.71 1,171.78 2013 513.80 107.47 1,182.33 2014 534.85 153.97 1,205.98 2015 304.09 93.39 1,218.03
*Includes Alberta, British Columbia, Manitoba, Saskatchewan & Territories.**Converted for illustrative purposes from base period 1971 = 100.
October 2016
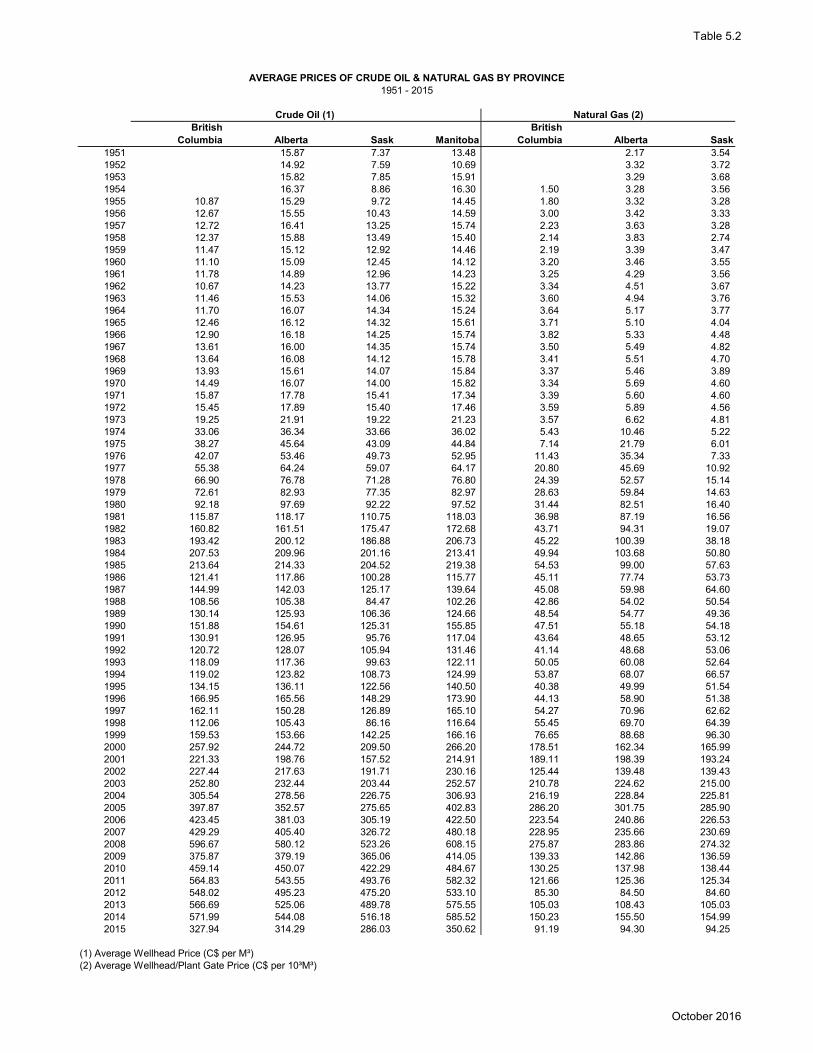
Table 5.2
Crude Oil (1) Natural Gas (2)
British British
Columbia Alberta Sask Manitoba Columbia Alberta Sask
1951 15.87 7.37 13.48 2.17 3.541952 14.92 7.59 10.69 3.32 3.721953 15.82 7.85 15.91 3.29 3.681954 16.37 8.86 16.30 1.50 3.28 3.561955 10.87 15.29 9.72 14.45 1.80 3.32 3.281956 12.67 15.55 10.43 14.59 3.00 3.42 3.331957 12.72 16.41 13.25 15.74 2.23 3.63 3.281958 12.37 15.88 13.49 15.40 2.14 3.83 2.741959 11.47 15.12 12.92 14.46 2.19 3.39 3.471960 11.10 15.09 12.45 14.12 3.20 3.46 3.551961 11.78 14.89 12.96 14.23 3.25 4.29 3.561962 10.67 14.23 13.77 15.22 3.34 4.51 3.671963 11.46 15.53 14.06 15.32 3.60 4.94 3.761964 11.70 16.07 14.34 15.24 3.64 5.17 3.771965 12.46 16.12 14.32 15.61 3.71 5.10 4.041966 12.90 16.18 14.25 15.74 3.82 5.33 4.481967 13.61 16.00 14.35 15.74 3.50 5.49 4.821968 13.64 16.08 14.12 15.78 3.41 5.51 4.701969 13.93 15.61 14.07 15.84 3.37 5.46 3.891970 14.49 16.07 14.00 15.82 3.34 5.69 4.601971 15.87 17.78 15.41 17.34 3.39 5.60 4.601972 15.45 17.89 15.40 17.46 3.59 5.89 4.561973 19.25 21.91 19.22 21.23 3.57 6.62 4.811974 33.06 36.34 33.66 36.02 5.43 10.46 5.221975 38.27 45.64 43.09 44.84 7.14 21.79 6.011976 42.07 53.46 49.73 52.95 11.43 35.34 7.331977 55.38 64.24 59.07 64.17 20.80 45.69 10.921978 66.90 76.78 71.28 76.80 24.39 52.57 15.141979 72.61 82.93 77.35 82.97 28.63 59.84 14.631980 92.18 97.69 92.22 97.52 31.44 82.51 16.401981 115.87 118.17 110.75 118.03 36.98 87.19 16.561982 160.82 161.51 175.47 172.68 43.71 94.31 19.071983 193.42 200.12 186.88 206.73 45.22 100.39 38.181984 207.53 209.96 201.16 213.41 49.94 103.68 50.801985 213.64 214.33 204.52 219.38 54.53 99.00 57.631986 121.41 117.86 100.28 115.77 45.11 77.74 53.731987 144.99 142.03 125.17 139.64 45.08 59.98 64.601988 108.56 105.38 84.47 102.26 42.86 54.02 50.541989 130.14 125.93 106.36 124.66 48.54 54.77 49.361990 151.88 154.61 125.31 155.85 47.51 55.18 54.181991 130.91 126.95 95.76 117.04 43.64 48.65 53.121992 120.72 128.07 105.94 131.46 41.14 48.68 53.061993 118.09 117.36 99.63 122.11 50.05 60.08 52.641994 119.02 123.82 108.73 124.99 53.87 68.07 66.571995 134.15 136.11 122.56 140.50 40.38 49.99 51.541996 166.95 165.56 148.29 173.90 44.13 58.90 51.381997 162.11 150.28 126.89 165.10 54.27 70.96 62.621998 112.06 105.43 86.16 116.64 55.45 69.70 64.391999 159.53 153.66 142.25 166.16 76.65 88.68 96.302000 257.92 244.72 209.50 266.20 178.51 162.34 165.992001 221.33 198.76 157.52 214.91 189.11 198.39 193.242002 227.44 217.63 191.71 230.16 125.44 139.48 139.432003 252.80 232.44 203.44 252.57 210.78 224.62 215.002004 305.54 278.56 226.75 306.93 216.19 228.84 225.812005 397.87 352.57 275.65 402.83 286.20 301.75 285.902006 423.45 381.03 305.19 422.50 223.54 240.86 226.532007 429.29 405.40 326.72 480.18 228.95 235.66 230.692008 596.67 580.12 523.26 608.15 275.87 283.86 274.322009 375.87 379.19 365.06 414.05 139.33 142.86 136.592010 459.14 450.07 422.29 484.67 130.25 137.98 138.442011 564.83 543.55 493.76 582.32 121.66 125.36 125.342012 548.02 495.23 475.20 533.10 85.30 84.50 84.602013 566.69 525.06 489.78 575.55 105.03 108.43 105.032014 571.99 544.08 516.18 585.52 150.23 155.50 154.992015 327.94 314.29 286.03 350.62 91.19 94.30 94.25
(1) Average Wellhead Price (C$ per M³)(2) Average Wellhead/Plant Gate Price (C$ per 10³M³)
AVERAGE PRICES OF CRUDE OIL & NATURAL GAS BY PROVINCE
1951 - 2015
October 2016


Table 5.3
REPRESENTATIVE RETAIL PRICES - REGULAR UNLEADED GASOLINE - SELF SERVICE STATIONS
1990 - 2016
Cents per litre
St John
Charlotte/
Summerside Halifax Saint John Montreal Toronto Winnipeg Regina Edmonton Vancouver
Newfoundland P.E.I Nova Scotia N.B Quebec Ontario Manitoba Sask. Alberta B.C.
1990 61.5 57.8 62.8 55.7 55.3 54.7 53.6 61.4
1991 63.6 63.3 64.3 53.8 52.8 47.4 49.8 57.8
1992 60.8 60.8 60.2 52.4 49.5 49.4 47.6 53.8
1993 57.0 56.8 50.7 54.7 57.4 51.1 52.1 53.6 45.7 54.8
1994 58.6 55.0 52.0 53.6 55.2 49.8 52.3 55.6 45.4 55.6
1995 62.8 59.3 54.3 56.0 56.8 52.4 54.6 57.5 47.6 58.4
1996 61.4 59.2 54.8 55.1 60.6 56.1 56.9 59.3 49.6 59.2
1997 67.7 60.6 60.6 60.2 61.9 56.1 57.4 60.0 52.1 58.8
1998 64.4 53.6 57.1 55.4 56.3 51.6 53.3 55.6 47.0 50.6
1999 66.2 52.9 60.8 59.2 63.0 57.5 57.3 60.5 51.4 54.3
2000 83.0 70.1 76.1 73.3 77.2 70.8 66.7 71.7 63.5 69.1
2001 79.1 71.9 72.8 70.0 73.8 67.8 65.0 72.2 61.3 68.9
2002 77.0 68.2 73.4 72.5 71.4 67.3 63.2 72.7 63.4 70.4
2003 82.8 74.0 78.0 78.8 76.7 70.9 67.6 76.0 67.4 76.8
2004 91.7 84.1 87.5 88.0 85.8 76.7 76.7 82.5 75.9 86.0
2005 102.1 96.4 97.9 97.9 96.4 89.0 90.0 92.7 85.1 97.1
2006 107.6 103.0 103.7 102.2 100.8 93.4 96.6 99.6 91.0 103.8
2007 111.0 104.2 106.8 101.4 104.3 97.4 102.2 104.7 96.7 108.1
2008 123.6 114.5 118.4 113.7 118.8 110.2 115.8 117.3 109.2 121.3
2009 102.3 93.3 96.2 91.4 97.7 91.6 94.4 97.0 86.5 104.0
2010 110.8 101.2 105.8 99.9 107.8 101.9 97.5 101.9 90.2 115.3
2011 129.2 119.3 125.6 121.6 130.5 124.1 114.6 121.7 107.8 132.4
2012 131.9 124.3 131.3 127.5 136.5 126.7 118.3 122.4 109.6 135.3
2013 128.9 129.5 131.0 126.7 136.9 127.8 120.4 120.0 109.0 137.5
2014 130.6 131.4 131.4 127.7 136.9 128.4 118.0 121.1 110.0 138.0
2015 109.3 105.7 105.7 103.9 116.4 106.4 97.3 100.0 92.8 123.7
2016 113.7 98.8 98.8 98.4 108.3 100.7 92.1 91.3 85.1 118.3
Note: Includes all taxes.
August 2017

Table 5.4
West Texas Intermediate on
NYMEX - Cushing ($US/Bbl)
825/0.5%s*
Canadian Par at Edmonton
($Cdn/Bbl) 825/0.5%s** WCS @ Hardisty ($Cdn/Bbl)**
Canadian
Light/Heavy
Differential
Exchange Rate
($US/$Cdn)
1986 Jan 23.02 33.86 0.711
Feb 15.63 23.44 0.713
Mar 12.56 17.44 0.714
Apr 12.81 16.65 0.721
May 15.38 19.29 0.727
Jun 13.50 18.10 not available 0.720
Jul 11.49 14.83 0.724
Aug 15.20 18.86 0.720
Sep 14.96 20.05 0.721
Oct 14.89 19.35 0.720
Nov 15.17 19.71 0.722
Dec 16.08 20.70 0.725
1987 Jan 18.69 23.81 19.80 4.01 0.735
Feb 17.75 23.08 19.06 4.02 0.750
Mar 18.45 22.37 18.97 3.40 0.758
Apr 18.65 22.90 20.23 2.67 0.758
May 19.40 24.13 21.34 2.79 0.746
Jun 20.05 24.97 22.46 2.51 0.747
Jul 21.30 26.09 23.55 2.54 0.754
Aug 20.20 26.12 23.28 2.84 0.754
Sep 19.50 24.19 20.86 3.33 0.760
Oct 19.85 24.42 21.40 3.02 0.764
Nov 18.85 23.90 20.41 3.49 0.760
Dec 17.30 21.99 17.16 4.83 0.765
1988 Jan 17.11 20.55 15.47 5.08 0.778
Feb 16.75 20.08 14.80 5.28 0.789
Mar 16.20 18.76 13.42 5.34 0.801
Apr 17.85 20.11 16.18 3.93 0.810
May 17.40 20.51 17.49 3.02 0.809
Jun 16.60 19.44 15.18 4.26 0.821
Jul 15.50 17.40 13.64 3.76 0.828
Aug 15.55 17.74 14.27 3.47 0.817
Sep 14.45 16.98 13.23 3.75 0.815
Oct 13.80 15.57 10.76 4.81 0.830
Nov 14.00 15.59 11.14 4.45 0.821
Dec 16.30 17.16 12.74 4.42 0.836
1989 Jan 18.00 20.14 15.28 4.86 0.839
Feb 17.80 19.87 14.97 4.91 0.841
Mar 19.45 21.70 17.01 4.70 0.837
Apr 20.95 23.57 19.06 4.51 0.841
May 20.05 23.29 18.78 4.51 0.838
Jun 20.00 23.12 18.95 4.17 0.835
Jul 19.75 22.92 19.08 3.85 0.841
Aug 18.55 21.02 17.34 3.68 0.851
Sep 19.60 22.08 17.58 4.51 0.846
Oct 20.10 22.75 17.96 4.78 0.851
Nov 19.80 22.41 17.64 4.77 0.855
Dec 21.10 23.33 17.76 5.57 0.861
1990 Jan 22.65 25.36 18.85 6.51 0.854
Feb 22.10 25.92 19.21 6.71 0.836
Mar 20.40 23.68 17.62 6.05 0.848
Apr 18.60 21.10 13.93 7.18 0.859
May 18.45 21.03 13.75 7.28 0.851
Jun 16.85 18.84 12.69 6.15 0.853
Jul 18.65 20.35 15.03 5.31 0.864
Aug 27.15 29.97 24.77 5.20 0.874
Sep 33.70 37.71 31.74 5.98 0.863
Oct 35.90 40.73 33.76 6.96 0.862
Nov 32.30 36.61 27.50 9.12 0.860
Dec 27.15 30.39 20.84 9.55 0.862
1991 Jan 24.70 27.47 16.93 10.54 0.865
Feb 20.55 22.58 10.98 11.60 0.866
Mar 19.90 21.75 12.33 9.42 0.868
Apr 20.80 22.81 12.41 10.40 0.867
May 21.25 23.21 13.82 9.39 0.870
Jun 20.20 21.93 14.20 7.73 0.874
Jul 21.42 23.48 16.63 6.86 0.870
Aug 21.69 23.60 15.90 7.70 0.874
Sep 21.85 23.48 16.58 6.90 0.880
Oct 23.25 24.97 15.89 9.09 0.887
Nov 22.60 24.13 15.51 8.62 0.885
Dec 19.55 21.24 12.51 8.72 0.873
Reference Crude Oil Prices & Foreign Exchange Rates
1986-2017
January 2018

Table 5.4
West Texas Intermediate on
NYMEX - Cushing ($US/Bbl)
825/0.5%s*
Canadian Par at Edmonton
($Cdn/Bbl) 825/0.5%s** WCS @ Hardisty ($Cdn/Bbl)**
Canadian
Light/Heavy
Differential
Exchange Rate
($US/$Cdn)
Reference Crude Oil Prices & Foreign Exchange Rates
1986-2017
1992 Jan 18.80 20.36 13.20 7.16 0.865
Feb 19.00 21.01 14.83 6.18 0.846
Mar 18.95 21.03 14.90 6.13 0.839
Apr 20.25 22.58 16.66 5.92 0.842
May 21.00 23.84 17.96 5.88 0.834
Jun 22.35 25.45 19.17 6.28 0.836
Jul 21.75 24.63 18.30 6.33 0.839
Aug 21.30 24.09 17.99 6.10 0.840
Sep 21.90 25.72 19.01 6.71 0.818
Oct 21.70 25.95 18.94 7.01 0.803
Nov 20.35 24.47 17.29 7.18 0.789
Dec 19.40 23.11 15.70 7.41 0.786
1993 Jan 19.05 22.26 14.87 7.39 0.783
Feb 20.05 23.35 16.01 7.34 0.794
Mar 20.35 23.26 16.74 6.52 0.802
Apr 20.30 23.56 17.73 5.83 0.792
May 20.00 23.40 17.65 5.75 0.787
Jun 19.15 22.72 17.02 5.70 0.782
Jul 17.90 20.87 15.59 5.28 0.780
Aug 18.00 21.32 16.16 5.16 0.764
Sep 17.50 21.13 16.03 5.09 0.757
Oct 18.15 22.19 17.60 4.59 0.754
Nov 16.75 20.07 15.49 4.58 0.759
Dec 14.55 17.27 12.55 4.72 0.751
1994 Jan 15.00 17.50 13.06 4.44 0.759
Feb 14.75 17.63 12.99 4.64 0.745
Mar 14.65 18.20 13.79 4.41 0.733
Apr 16.30 20.94 16.99 3.95 0.723
May 17.85 23.16 19.38 3.78 0.724
Jun 19.05 24.97 21.19 3.78 0.723
Jul 19.65 25.73 21.82 3.90 0.723
Aug 18.35 23.96 19.94 4.02 0.726
Sep 17.45 22.24 18.01 4.23 0.739
Oct 17.65 22.47 18.55 3.92 0.741
Nov 18.10 23.30 19.64 3.66 0.733
Dec 17.15 22.33 19.16 3.17 0.720
1995 Jan 17.95 23.98 20.93 3.05 0.708
Feb 18.55 24.59 21.54 3.05 0.714
Mar 18.55 24.78 21.99 2.78 0.711
Apr 19.95 26.05 23.59 2.46 0.727
May 19.75 25.52 22.25 3.27 0.735
Jun 18.40 24.09 21.42 2.67 0.726
Jul 17.25 22.37 19.65 2.72 0.735
Aug 17.80 23.09 20.41 2.68 0.738
Sep 18.20 23.64 19.82 3.82 0.740
Oct 17.40 22.36 18.04 4.32 0.744
Nov 18.00 23.22 18.14 5.08 0.739
Dec 19.04 24.90 19.75 5.15 0.731
1996 Jan 18.70 24.42 19.48 4.94 0.732
Feb 18.78 24.85 20.11 4.74 0.727
Mar 21.18 28.00 23.95 4.05 0.733
Apr 23.24 31.04 27.30 3.74 0.736
May 21.09 28.26 24.94 3.32 0.731
Jun 20.43 27.14 24.14 3.00 0.732
Jul 21.31 28.34 25.13 3.21 0.730
Aug 21.90 29.39 25.93 3.46 0.729
Sep 23.88 32.06 28.45 3.61 0.730
Oct 24.90 32.99 28.34 4.65 0.740
Nov 23.55 30.78 25.26 5.52 0.747
Dec 25.12 33.45 27.31 6.14 0.734
1997 Jan 25.18 33.25 27.18 6.07 0.742
Feb 22.17 29.38 23.42 5.96 0.738
Mar 20.97 28.05 21.93 6.12 0.729
Apr 19.73 26.74 20.29 6.45 0.717
May 20.87 28.06 21.25 6.81 0.724
Jun 19.22 25.73 19.33 6.40 0.723
Jul 19.66 26.12 20.21 5.91 0.726
Aug 19.95 26.75 21.27 5.48 0.719
Sep 19.78 26.44 20.79 5.65 0.721
Oct 21.28 28.52 21.95 6.57 0.721
Nov 20.22 27.54 20.70 6.84 0.708
Dec 18.32 25.09 16.30 8.79 0.701
January 2018

Table 5.4
West Texas Intermediate on
NYMEX - Cushing ($US/Bbl)
825/0.5%s*
Canadian Par at Edmonton
($Cdn/Bbl) 825/0.5%s** WCS @ Hardisty ($Cdn/Bbl)**
Canadian
Light/Heavy
Differential
Exchange Rate
($US/$Cdn)
Reference Crude Oil Prices & Foreign Exchange Rates
1986-2017
1998 Jan 16.73 23.06 14.64 8.42 0.695
Feb 16.08 22.02 13.82 8.20 0.696
Mar 15.03 20.21 13.01 7.20 0.706
Apr 15.47 20.94 13.70 7.24 0.699
May 14.93 20.33 12.96 7.37 0.692
Jun 13.67 18.74 12.45 6.29 0.682
Jul 14.09 19.45 14.93 4.52 0.672
Aug 13.38 19.16 15.82 3.34 0.651
Sep 14.97 21.41 18.23 3.18 0.657
Oct 14.42 20.93 17.71 3.22 0.647
Nov 12.99 18.76 15.37 3.39 0.650
Dec 11.31 15.98 12.87 3.11 0.648
1999 Jan 12.49 17.61 14.88 2.73 0.658
Feb 12.02 16.75 15.27 1.48 0.668
Mar 14.68 20.91 19.41 1.50 0.659
Apr 17.30 24.39 20.17 4.22 0.672
May 17.77 24.57 20.32 4.25 0.684
Jun 17.92 24.73 20.59 4.15 0.681
Jul 20.10 28.40 24.41 3.99 0.672
Aug 21.28 30.33 27.00 3.33 0.670
Sep 23.79 34.01 31.45 2.56 0.677
Oct 22.67 32.54 27.60 4.94 0.677
Nov 24.77 35.68 28.42 7.26 0.681
Dec 26.10 38.31 30.64 7.67 0.679
2000 Jan 27.01 38.87 32.05 6.82 0.690
Feb 29.30 41.85 36.28 5.57 0.689
Mar 29.89 43.36 36.94 6.42 0.685
Apr 25.54 36.32 30.61 5.71 0.681
May 28.81 42.23 36.37 5.86 0.669
Jun 31.53 45.76 39.54 6.22 0.677
Jul 29.72 43.14 36.31 6.83 0.677
Aug 31.14 45.62 38.54 7.08 0.675
Sep 33.87 50.12 41.12 9.00 0.673
Oct 32.93 49.58 31.65 17.93 0.661
Nov 34.26 52.35 30.99 21.36 0.648
Dec 28.40 42.74 21.83 20.91 0.657
2001 Jan 29.26 43.55 25.45 18.10 0.665
Feb 29.64 44.28 26.52 17.76 0.657
Mar 27.27 41.03 25.55 15.48 0.642
Apr 27.62 41.60 26.12 15.48 0.642
May 28.66 42.74 26.68 16.06 0.649
Jun 27.58 42.21 26.20 16.01 0.656
Jul 26.43 40.47 29.28 11.19 0.653
Aug 27.31 41.39 35.52 5.87 0.649
Sep 25.69 39.49 25.08 14.41 0.638
Oct 22.21 33.87 18.65 15.22 0.636
Nov 19.67 30.16 17.53 12.63 0.628
Dec 19.40 29.32 18.24 11.08 0.634
2002 Jan 19.73 30.54 21.39 9.15 0.625
Feb 20.76 32.27 25.20 7.07 0.627
Mar 24.44 38.03 32.21 5.82 0.630
Apr 26.26 40.54 34.34 6.20 0.632
May 26.95 41.01 32.51 8.50 0.645
Jun 25.55 38.80 30.38 8.42 0.653
Jul 26.93 41.33 35.52 5.81 0.647
Aug 28.20 43.11 36.52 6.59 0.638
Sep 29.67 45.19 35.37 9.82 0.635
Oct 28.86 43.93 32.05 11.88 0.634
Nov 26.19 39.75 29.22 10.53 0.636
Dec 29.38 44.76 35.37 9.39 0.641
2003 Jan 32.70 49.87 40.95 8.92 0.649
Feb 35.73 53.71 41.84 11.87 0.661
Mar 33.16 49.26 36.57 12.69 0.678
Apr 28.14 41.59 29.69 11.90 0.686
May 28.07 39.61 31.10 8.51 0.722
Jun 30.52 42.16 33.45 8.71 0.739
Jul 30.70 42.10 31.24 10.86 0.724
Aug 31.60 43.24 33.13 10.11 0.716
Sep 28.31 37.44 27.55 9.89 0.734
Oct 30.35 38.47 27.96 10.51 0.757
Nov 31.06 39.38 27.10 12.28 0.762
Dec 32.14 40.82 30.54 10.28 0.762
January 2018

Table 5.4
West Texas Intermediate on
NYMEX - Cushing ($US/Bbl)
825/0.5%s*
Canadian Par at Edmonton
($Cdn/Bbl) 825/0.5%s** WCS @ Hardisty ($Cdn/Bbl)**
Canadian
Light/Heavy
Differential
Exchange Rate
($US/$Cdn)
Reference Crude Oil Prices & Foreign Exchange Rates
1986-2017
2004 Jan 34.22 43.17 34.05 9.12 0.772
Feb 34.48 44.93 34.73 10.20 0.752
Mar 36.72 48.71 36.02 12.69 0.753
Apr 36.60 48.86 34.36 14.50 0.745
May 40.28 52.50 39.71 12.79 0.726
Jun 38.05 50.46 38.12 12.34 0.737
Jul 40.81 52.23 41.57 10.66 0.756
Aug 44.88 57.78 43.97 13.81 0.762
Sep 45.94 58.74 40.34 18.40 0.777
Oct 53.09 64.52 47.57 16.95 0.802
Nov 48.48 57.61 34.46 23.16 0.836
Dec 43.26 50.99 26.27 24.72 0.820
2005 Jan 46.85 56.62 36.05 19.42 0.816
Feb 48.05 60.09 35.26 23.70 0.807
Mar 54.63 67.65 44.39 24.33 0.822
Apr 53.22 66.25 38.34 26.90 0.809
May 49.87 61.60 34.48 25.53 0.796
Jun 56.42 69.43 47.33 20.09 0.806
Jul 59.03 72.13 54.75 15.82 0.818
Aug 64.99 78.73 58.14 19.99 0.831
Sep 65.55 78.66 49.61 26.56 0.849
Oct 62.27 75.24 48.89 24.95 0.849
Nov 58.34 70.83 40.56 30.31 0.847
Dec 59.45 67.45 38.06 29.18 0.861
2006 Jan 65.54 71.81 45.16 26.65 0.864
Feb 61.93 67.31 33.16 34.15 0.870
Mar 62.97 67.77 42.86 24.90 0.864
Apr 70.16 74.88 58.90 15.98 0.874
May 70.96 80.91 63.67 17.24 0.901
Jun 70.97 79.85 57.68 22.17 0.898
Jul 74.46 85.62 65.36 20.27 0.886
Aug 73.08 80.41 62.51 17.91 0.894
Sep 63.90 71.21 46.35 24.85 0.896
Oct 59.14 62.54 41.73 20.81 0.886
Nov 59.40 62.97 44.33 18.64 0.880
Dec 62.09 67.95 50.51 17.44 0.867
2007 Jan 54.35 64.19 44.83 19.36 0.850
Feb 59.39 68.50 51.79 16.70 0.854
Mar 60.74 68.58 52.96 15.62 0.856
Apr 64.04 71.52 49.83 21.69 0.882
May 63.53 70.70 50.68 20.02 0.913
Jun 67.53 73.57 50.15 23.43 0.939
Jul 74.15 81.06 56.00 25.06 0.952
Aug 72.36 78.91 56.06 22.85 0.945
Sep 79.63 79.89 54.72 25.17 0.975
Oct 85.66 80.47 53.06 27.41 1.025
Nov 94.63 89.15 63.90 25.25 1.034
Dec 91.74 89.63 50.04 39.59 0.997
2008 Jan 92.93 94.48 69.35 23.66 0.989
Feb 95.35 93.09 71.54 20.08 1.001
Mar 105.42 104.94 89.22 14.65 0.998
Apr 112.46 116.73 95.79 19.53 0.986
May 125.46 125.04 104.07 19.60 1.001
Jun 134.02 136.45 110.11 25.17 0.984
Jul 133.48 138.04 116.26 20.26 0.987
Aug 116.69 121.00 106.58 12.91 0.948
Sep 103.76 106.50 88.76 16.12 0.945
Oct 76.72 85.52 68.81 14.94 0.844
Nov 57.44 63.19 45.73 15.74 0.821
Dec 42.04 40.93 28.62 12.32 0.810
2009 Jan 41.92 42.93 36.77 4.35 0.815
Feb 39.26 45.56 39.50 4.34 0.803
Mar 48.06 60.47 51.36 7.06 0.791
Apr 49.95 59.95 53.49 4.60 0.817
May 59.31 64.33 59.71 3.20 0.869
Jun 69.70 73.42 68.92 2.83 0.888
Jul 64.29 68.20 60.98 5.54 0.891
Aug 71.14 73.80 65.83 6.48 0.919
Sep 69.47 72.50 64.44 6.62 0.924
Oct 75.82 76.93 68.88 6.50 0.948
Nov 78.14 78.30 68.94 7.91 0.944
Dec 74.60 74.46 65.14 7.94 0.948
January 2018

Table 5.4
West Texas Intermediate on
NYMEX - Cushing ($US/Bbl)
825/0.5%s*
Canadian Par at Edmonton
($Cdn/Bbl) 825/0.5%s** WCS @ Hardisty ($Cdn/Bbl)**
Canadian
Light/Heavy
Differential
Exchange Rate
($US/$Cdn)
Reference Crude Oil Prices & Foreign Exchange Rates
1986-2017
2010 Jan 78.40 78.66 72.27 6.40 0.959
Feb 76.45 80.13 71.80 8.33 0.946
Mar 81.29 81.42 73.55 7.87 0.978
Apr 84.58 82.41 72.40 10.01 0.995
May 74.12 70.72 59.76 10.96 0.962
Jun 75.40 72.41 64.71 7.70 0.963
Jul 76.38 74.52 67.01 7.50 0.959
Aug 76.67 75.92 64.46 11.46 0.960
Sep 75.55 72.84 57.25 15.59 0.968
Oct 81.93 74.77 57.71 17.06 0.982
Nov 84.31 80.64 70.42 10.21 0.987
Dec 89.23 85.57 75.44 10.13 0.992
2011 Jan 89.58 83.44 70.73 12.72 1.006
Feb 89.53 83.55 62.60 20.94 1.013
Mar 102.98 96.93 77.25 19.68 1.024
Apr 110.04 110.72 85.87 24.86 1.044
May 101.36 100.89 82.87 18.03 1.033
Jun 96.29 97.60 77.54 20.06 1.024
Jul 97.31 95.22 74.79 20.43 1.047
Aug 86.34 88.15 65.34 22.81 1.017
Sep 85.61 91.85 71.76 20.09 0.997
Oct 86.43 93.11 78.02 15.09 0.981
Nov 97.16 101.13 89.54 11.59 0.975
Dec 98.58 97.81 88.89 8.93 0.977
2012 Jan 100.32 96.63 87.58 9.05 0.987
Feb 102.26 94.47 82.72 11.75 1.003
Mar 106.21 85.59 74.52 11.07 1.006
Apr 103.35 83.94 69.86 14.08 1.007
May 94.72 87.21 75.81 11.40 0.990
Jun 82.41 80.69 68.20 12.49 0.973
Jul 87.93 75.81 65.08 10.73 0.986
Aug 94.16 86.58 68.46 18.12 1.008
Sep 94.56 90.60 76.44 14.16 1.022
Oct 89.57 91.95 78.81 13.13 1.013
Nov 86.73 85.79 72.22 13.57 1.003
Dec 88.25 74.23 57.25 16.98 1.011
2013 Jan 94.83 87.40 61.60 25.80 1.008
Feb 95.32 88.00 58.95 29.05 0.990
Mar 92.96 89.09 68.35 20.75 0.976
Apr 92.07 90.76 70.12 20.63 0.982
May 94.80 95.16 82.56 12.60 0.981
Jun 95.80 91.73 79.28 12.45 0.969
Jul 104.70 105.53 95.46 10.07 0.961
Aug 106.54 105.71 95.70 10.01 0.961
Sep 106.24 102.82 88.29 14.53 0.967
Oct 100.55 94.14 74.01 20.12 0.965
Nov 93.93 81.31 64.35 16.96 0.953
Dec 97.89 83.38 64.40 18.97 0.940
2014 Jan 94.86 89.28 71.88 17.40 0.914
Feb 100.68 105.73 88.29 17.44 0.905
Mar 100.51 104.19 86.87 17.33 0.900
Apr 102.03 102.91 85.81 17.10 0.910
May 101.79 104.05 83.01 21.04 0.918
Jun 105.15 106.56 89.62 16.94 0.923
Jul 102.39 101.83 84.98 16.84 0.931
Aug 96.04 93.34 77.00 16.34 0.915
Sep 93.03 93.15 81.87 11.27 0.908
Oct 84.34 87.37 79.16 8.21 0.892
Nov 75.81 76.57 71.19 5.38 0.883
Dec 59.29 55.54 49.72 5.83 0.867
2015 Jan 47.33 44.95 36.89 8.06 0.825
Feb 50.72 51.92 45.57 6.36 0.800
Mar 47.85 52.36 43.90 8.46 0.792
Apr 54.63 61.89 49.67 12.22 0.811
May 59.37 71.82 57.87 13.95 0.821
Jun 59.83 76.48 63.31 13.18 0.809
Jul 50.93 65.57 55.73 9.84 0.777
Aug 42.89 52.75 36.34 16.41 0.761
Sep 45.47 54.09 37.70 16.39 0.754
Oct 46.29 58.67 42.78 15.89 0.765
Nov 42.92 55.03 36.93 18.10 0.753
Dec 37.33 47.64 31.12 16.52 0.730
January 2018

Table 5.4
West Texas Intermediate on
NYMEX - Cushing ($US/Bbl)
825/0.5%s*
Canadian Par at Edmonton
($Cdn/Bbl) 825/0.5%s** WCS @ Hardisty ($Cdn/Bbl)**
Canadian
Light/Heavy
Differential
Exchange Rate
($US/$Cdn)
Reference Crude Oil Prices & Foreign Exchange Rates
1986-2017
2016 Jan 31.78 39.74 25.58 14.16 0.703
Feb 30.62 37.30 22.82 14.49 0.725
Mar 37.96 48.01 32.79 15.22 0.756
Apr 41.12 50.02 35.76 14.26 0.780
May 46.80 57.22 41.61 15.61 0.773
Jun 48.85 62.12 47.62 14.50 0.775
Jul 44.80 56.48 42.65 13.83 0.766
Aug 44.80 53.17 40.79 12.38 0.770
Sep 45.21 57.74 40.46 17.28 0.763
Oct 49.94 63.53 47.60 15.93 0.755
Nov 45.76 57.53 42.65 14.88 0.744
Dec 52.17 64.53 49.23 15.30 0.750
2017 Jan 52.61 64.12 49.05 15.07 0.758
Feb 53.46 65.77 51.53 14.24 0.763
Mar 49.67 62.51 47.61 14.90 0.747
Apr 51.12 64.34 50.44 13.90 0.744
May 48.54 63.94 52.13 11.81 0.735
Jun 45.20 57.18 47.06 10.12 0.752
Jul 46.68 55.16 46.31 8.85 0.788
Aug 48.06 60.47 48.70 11.77 0.793
Sep 49.88 57.34 49.48 7.86 0.814
Oct 51.69 64.55 51.58 12.97 0.793
Nov 56.54 71.62 58.32 13.30 0.783
Dec 57.95 72.28 65.12 7.16 0.783
1986 15.06 20.19 0.720
1987 19.17 24.00 20.71 3.29 0.754
1988 15.96 18.32 14.02 4.30 0.812
1989 19.60 22.18 17.62 4.56 0.845
1990 24.49 27.64 20.81 6.83 0.857
1991 21.48 23.39 14.47 8.92 0.873
1992 20.56 23.52 16.99 6.53 0.827
1993 18.48 21.78 16.12 5.66 0.775
1994 17.16 21.87 17.88 3.99 0.732
1995 18.40 24.05 20.63 3.42 0.729
1996 22.00 29.23 25.03 4.20 0.733
1997 20.61 27.64 21.22 6.42 0.722
1998 14.39 20.08 14.63 5.45 0.675
1999 19.24 27.35 23.35 4.00 0.671
2000 30.20 44.33 34.35 9.98 0.679
2001 25.90 39.13 25.07 14.06 0.646
2002 26.08 39.91 31.67 8.24 0.637
2003 31.04 43.14 32.68 10.46 0.716
2004 41.40 52.54 37.60 14.94 0.770
2005 56.56 68.72 43.82 23.90 0.83
2006 66.22 72.77 51.02 21.75 0.88
2007 72.31 76.35 52.84 23.51 0.94
2008 99.65 102.16 82.90 17.92 0.94
2009 61.80 65.90 58.66 5.61 0.88
2010 79.53 77.50 67.23 10.27 0.97
2011 95.10 95.03 77.10 17.94 1.01
2012 94.21 86.12 73.08 13.05 1.00
2013 97.97 92.92 75.26 17.66 0.97
2014 92.99 93.38 79.12 14.26 0.906
2015 48.80 57.76 44.82 12.95 0.783
2016 43.32 53.95 39.13 14.82 0.755
2017 YTD 50.95 63.27 51.44 11.83 0.771
* Calendar average of NYMEX near-month futures price (US$/bbl)
** Prior to 2014 was Bow River calendar average of refiners postings
January 2018

Table 5.5
Henry Hub ($US)* AECO-C ($US)**
AECO-C Cash
($US)***
ADOE Reference
Price($Cdn)
1990 Jan 1.71
Feb 1.73
Mar 1.68
Apr 1.61
May 1.62
Jun 1.560 1.045 1.58
Jul 1.525 1.030 1.58
Aug 1.440 1.038 1.56
Sep 1.426 1.048 1.56
Oct 1.758 1.064 1.60
Nov 1.897 1.117 1.67
Dec 2.447 1.123 1.73
1991 Jan 1.962 1.131 1.73
Feb 1.498 1.122 1.68
Mar 1.361 0.973 1.57
Apr 1.388 0.906 1.50
May 1.369 0.854 1.46
Jun 1.335 0.875 1.37
Jul 1.192 0.954 1.32
Aug 1.221 0.951 1.25
Sep 1.342 0.972 1.25
Oct 1.737 0.969 1.29
Nov 2.017 0.976 1.40
Dec 1.995 1.033 1.43
1992 Jan 1.723 0.998 1.43
Feb 1.201 0.888 1.33
Mar 1.178 0.828 1.29
Apr 1.256 0.767 1.31
May 1.443 0.769 1.33
Jun 1.741 0.776 1.33
Jul 1.584 0.802 1.28
Aug 1.744 0.815 1.35
Sep 1.846 0.910 1.35
Oct 2.337 1.209 1.53
Nov 2.542 1.275 1.53
Dec 2.287 1.504 1.52
1993 Jan 2.069 2.329 1.54
Feb 1.650 1.440 1.50
Mar 1.860 1.868 1.55
Apr 2.090 1.809 1.61
May 2.710 2.618 1.68
Jun 2.250 1.373 1.476 1.65
Jul 2.070 1.497 1.160 1.57
Aug 2.100 1.271 1.402 1.58
Sep 2.430 1.526 1.157 1.64
Oct 2.150 1.430 1.360 1.61
Nov 2.130 1.780 2.033 1.92
Dec 2.340 2.323 1.736 2.17
Reference Natural Gas Prices
1990-2017
($/MMBtu)
January 2018

Table 5.5
Henry Hub ($US)* AECO-C ($US)**
AECO-C Cash
($US)***
ADOE Reference
Price($Cdn)
Reference Natural Gas Prices
1990-2017
($/MMBtu)
1994 Jan 2.065 1.872 1.881 2.04
Feb 2.342 1.716 2.326 2.15
Mar 2.383 1.916 1.623 2.18
Apr 2.055 1.596 1.495 1.92
May 2.116 1.536 1.474 1.90
Jun 1.904 1.408 1.333 1.75
Jul 2.023 1.372 1.404 1.83
Aug 1.843 1.328 1.262 1.75
Sep 1.543 1.205 1.090 1.58
Oct 1.448 1.098 1.176 1.42
Nov 1.612 1.327 1.274 1.61
Dec 1.655 1.356 0.938 1.65
1995 Jan 1.601 0.984 0.704 1.47
Feb 1.410 0.725 0.730 1.32
Mar 1.415 0.682 0.785 1.27
Apr 1.560 0.761 0.952 1.26
May 1.694 0.891 0.981 1.32
Jun 1.742 0.954 0.839 1.34
Jul 1.554 0.834 0.771 1.16
Aug 1.429 0.753 0.806 1.13
Sep 1.570 0.805 0.848 1.27
Oct 1.618 0.850 0.956 1.32
Nov 1.763 0.941 0.975 1.36
Dec 2.141 0.954 1.029 1.47
1996 Jan 3.129 1.046 1.191 1.71
Feb 2.426 1.150 1.159 1.70
Mar 2.605 1.098 1.011 1.69
Apr 2.794 1.011 0.916 1.59
May 2.350 0.920 0.840 1.49
Jun 2.342 0.826 0.853 1.44
Jul 2.634 0.840 0.905 1.46
Aug 2.357 0.899 0.926 1.46
Sep 1.911 0.880 0.862 1.27
Oct 1.889 0.903 1.091 1.35
Nov 2.571 1.109 1.550 1.89
Dec 3.611 1.594 1.637 2.49
1997 Jan 4.254 1.673 2.230 2.92
Feb 2.868 2.113 1.411 2.40
Mar 1.879 1.306 1.114 1.47
Apr 1.846 1.110 1.354 1.52
May 2.099 1.331 1.304 1.66
Jun 2.331 1.271 1.196 1.74
Jul 2.219 1.180 1.154 1.68
Aug 2.163 1.116 1.139 1.66
Sep 2.506 1.123 1.126 1.82
Oct 3.189 1.318 1.338 2.18
Nov 3.501 1.489 1.249 2.50
Dec 2.682 1.274 0.996 2.06
January 2018
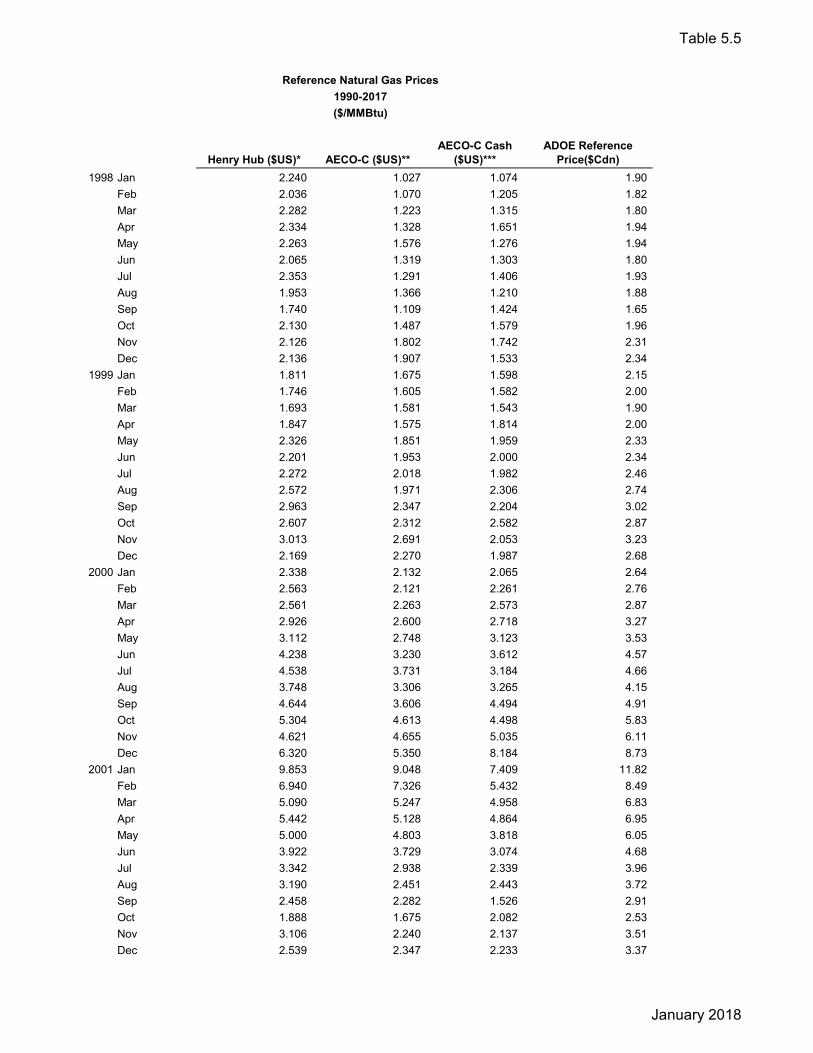
Table 5.5
Henry Hub ($US)* AECO-C ($US)**
AECO-C Cash
($US)***
ADOE Reference
Price($Cdn)
Reference Natural Gas Prices
1990-2017
($/MMBtu)
1998 Jan 2.240 1.027 1.074 1.90
Feb 2.036 1.070 1.205 1.82
Mar 2.282 1.223 1.315 1.80
Apr 2.334 1.328 1.651 1.94
May 2.263 1.576 1.276 1.94
Jun 2.065 1.319 1.303 1.80
Jul 2.353 1.291 1.406 1.93
Aug 1.953 1.366 1.210 1.88
Sep 1.740 1.109 1.424 1.65
Oct 2.130 1.487 1.579 1.96
Nov 2.126 1.802 1.742 2.31
Dec 2.136 1.907 1.533 2.34
1999 Jan 1.811 1.675 1.598 2.15
Feb 1.746 1.605 1.582 2.00
Mar 1.693 1.581 1.543 1.90
Apr 1.847 1.575 1.814 2.00
May 2.326 1.851 1.959 2.33
Jun 2.201 1.953 2.000 2.34
Jul 2.272 2.018 1.982 2.46
Aug 2.572 1.971 2.306 2.74
Sep 2.963 2.347 2.204 3.02
Oct 2.607 2.312 2.582 2.87
Nov 3.013 2.691 2.053 3.23
Dec 2.169 2.270 1.987 2.68
2000 Jan 2.338 2.132 2.065 2.64
Feb 2.563 2.121 2.261 2.76
Mar 2.561 2.263 2.573 2.87
Apr 2.926 2.600 2.718 3.27
May 3.112 2.748 3.123 3.53
Jun 4.238 3.230 3.612 4.57
Jul 4.538 3.731 3.184 4.66
Aug 3.748 3.306 3.265 4.15
Sep 4.644 3.606 4.494 4.91
Oct 5.304 4.613 4.498 5.83
Nov 4.621 4.655 5.035 6.11
Dec 6.320 5.350 8.184 8.73
2001 Jan 9.853 9.048 7.409 11.82
Feb 6.940 7.326 5.432 8.49
Mar 5.090 5.247 4.958 6.83
Apr 5.442 5.128 4.864 6.95
May 5.000 4.803 3.818 6.05
Jun 3.922 3.729 3.074 4.68
Jul 3.342 2.938 2.339 3.96
Aug 3.190 2.451 2.443 3.72
Sep 2.458 2.282 1.526 2.91
Oct 1.888 1.675 2.082 2.53
Nov 3.106 2.240 2.137 3.51
Dec 2.539 2.347 2.233 3.37
January 2018

Table 5.5
Henry Hub ($US)* AECO-C ($US)**
AECO-C Cash
($US)***
ADOE Reference
Price($Cdn)
Reference Natural Gas Prices
1990-2017
($/MMBtu)
2002 Jan 2.787 2.341 1.925 3.34
Feb 1.984 1.886 2.005 2.86
Mar 2.381 2.053 3.067 3.41
Apr 3.386 2.812 2.868 4.12
May 3.344 2.935 2.716 4.12
Jun 3.377 2.743 1.987 3.73
Jul 3.276 2.235 1.897 3.34
Aug 2.938 1.749 2.007 3.09
Sep 3.463 2.303 2.695 3.70
Oct 3.641 2.915 3.443 4.50
Nov 4.145 3.618 3.443 5.11
Dec 4.220 3.485 3.917 5.21
2003 Jan 5.043 4.098 4.536 6.21
Feb 5.500 4.692 6.159 7.20
Mar 8.701 6.775 5.887 9.43
Apr 5.107 4.821 4.655 6.20
May 5.358 4.708 4.986 6.04
Jun 5.988 5.079 4.988 6.25
Jul 5.621 5.051 4.234 5.88
Aug 4.700 4.207 4.369 5.36
Sep 5.016 4.417 4.177 5.47
Oct 4.520 4.223 4.171 5.19
Nov 4.486 4.178 4.028 4.85
Dec 4.725 4.237 4.936 5.39
2004 Jan 6.224 5.189 5.357 6.43
Feb 5.739 5.184 4.587 6.15
Mar 5.118 4.617 4.658 5.79
Apr 5.365 4.752 4.924 5.95
May 5.858 4.934 5.362 6.62
Jun 6.683 5.410 5.163 6.82
Jul 6.326 5.179 5.155 6.51
Aug 5.998 5.164 4.744 6.32
Sep 5.190 4.675 4.341 5.49
Oct 5.459 4.455 5.340 5.58
Nov 7.973 6.530 5.231 6.94
Dec 7.167 6.385 5.574 7.07
2005 Jan 6.567 5.651 5.373 6.35
Feb 6.360 5.263 5.327 6.26
Mar 6.239 5.345 6.153 6.64
Apr 7.149 6.143 6.295 7.16
May 7.007 6.175 5.579 6.87
Jun 6.326 5.515 5.912 6.69
Jul 7.158 6.012 6.138 7.25
Aug 7.452 6.171 7.832 7.86
Sep 10.136 7.984 9.497 9.98
Oct 13.001 9.819 10.605 12.00
Nov 14.070 10.875 7.768 11.40
Dec 11.471 9.204 10.865 11.12
January 2018

Table 5.5
Henry Hub ($US)* AECO-C ($US)**
AECO-C Cash
($US)***
ADOE Reference
Price($Cdn)
Reference Natural Gas Prices
1990-2017
($/MMBtu)
2006 Jan 11.579 10.413 7.384 10.040
Feb 8.363 7.372 6.392 7.783
Mar 7.296 6.298 5.704 6.823
Apr 7.246 5.690 5.811 6.518
May 7.337 5.778 5.070 6.022
Jun 5.955 5.032 5.242 5.579
Jul 5.988 5.164 5.152 5.505
Aug 6.779 5.425 5.762 6.159
Sep 6.815 5.537 4.209 5.400
Oct 4.401 3.988 5.311 4.640
Nov 7.448 5.982 6.850 6.866
Dec 8.011 7.003 6.227 7.435
2007 Jan 6.195 6.308 5.894 6.612
Feb 6.999 6.139 6.756 7.192
Mar 7.676 6.761 6.317 7.298
Apr 7.438 6.391 6.646 7.108
May 7.598 6.677 6.542 6.971
Jun 7.525 6.694 6.120 6.549
Jul 6.915 6.103 5.125 5.727
Aug 5.993 5.075 4.804 5.073
Sep 5.468 4.746 4.895 4.661
Oct 6.384 5.244 6.093 5.231
Nov 7.225 5.903 6.242 5.843
Dec 7.494 6.542 6.449 6.169
2008 Jan 7.090 6.336 7.348 6.528
Feb 7.960 7.209 7.874 7.087
Mar 9.179 7.575 8.609 7.931
Apr 9.440 8.381 9.281 8.553
May 10.845 9.258 10.023 9.407
Jun 11.785 10.195 11.039 10.346
Jul 12.989 11.239 9.453 10.377
Aug 9.155 8.702 7.037 7.751
Sep 8.166 7.087 5.859 6.623
Oct 7.625 6.026 5.704 6.612
Nov 6.259 5.467 5.520 6.591
Dec 6.585 5.785 5.359 6.707
2009 Jan 5.900 5.360 4.775 6.085
Feb 4.490 4.600 3.860 4.915
Mar 4.130 3.777 3.325 4.229
Apr 3.959 3.271 2.890 3.596
May 3.290 2.821 3.222 3.301
Jun 3.530 3.147 2.788 3.132
Jul 3.851 2.861 2.694 3.101
Aug 3.506 2.820 2.546 2.869
Sep 2.878 2.473 2.789 2.615
Oct 3.890 2.830 4.005 3.586
Nov 4.453 4.584 3.524 3.976
Dec 4.461 4.500 5.217 4.510
January 2018

Table 5.5
Henry Hub ($US)* AECO-C ($US)**
AECO-C Cash
($US)***
ADOE Reference
Price($Cdn)
Reference Natural Gas Prices
1990-2017
($/MMBtu)
2010 Jan 5.847 5.196 5.356 5.147
Feb 5.459 5.312 4.964 4.936
Mar 4.844 4.865 3.983 4.271
Apr 3.898 3.952 3.701 3.438
May 4.275 3.705 3.684 3.554
Jun 4.074 3.561 3.958 3.681
Jul 4.781 3.890 3.508 3.607
Aug 4.687 3.611 3.264 3.427
Sep 3.862 3.151 3.450 3.311
Oct 3.916 3.471 3.249 3.079
Nov 3.321 3.308 3.632 3.206
Dec 4.331 3.742 3.903 3.522
2011 Jan 4.160 3.825 4.016 3.681
Feb 4.427 3.916 3.729 3.586
Mar 3.856 3.588 3.793 3.364
Apr 4.347 3.711 3.888 3.480
May 4.384 3.913 4.008 3.575
Jun 4.350 3.941 4.103 3.702
Jul 4.281 4.000 3.871 3.607
Aug 4.375 3.849 3.706 3.501
Sep 3.906 3.684 3.641 3.417
Oct 3.803 3.585 3.308 3.343
Nov 3.671 3.347 3.167 3.153
Dec 3.455 3.477 2.905 3.079
2012 Jan 3.103 3.083 2.475 2.700
Feb 2.671 2.456 2.152 2.246
Mar 2.591 2.104 1.816 1.930
Apr 2.239 1.797 1.677 1.719
May 2.056 1.667 2.036 1.666
Jun 2.548 1.998 1.908 1.846
Jul 2.745 1.945 2.332 2.025
Aug 3.062 2.379 2.231 2.162
Sep 2.656 2.197 2.375 2.046
Oct 2.928 2.509 3.146 2.489
Nov 3.435 3.277 3.376 3.058
Dec 3.732 3.447 3.198 3.143
2013 Jan 3.502 3.139 3.085 2.911
Feb 3.320 3.017 3.058 2.837
Mar 3.377 3.000 3.356 3.006
Apr 3.923 3.376 3.617 3.311
May 4.162 3.579 3.526 3.417
Jun 4.115 3.505 3.217 3.343
Jul 3.698 3.077 2.722 2.932
Aug 3.553 2.658 2.293 2.499
Sep 3.538 2.365 2.059 2.257
Oct 3.494 2.504 3.144 2.626
Nov 3.591 3.342 3.245 3.227
Dec 3.792 3.203 3.659 3.396
January 2018
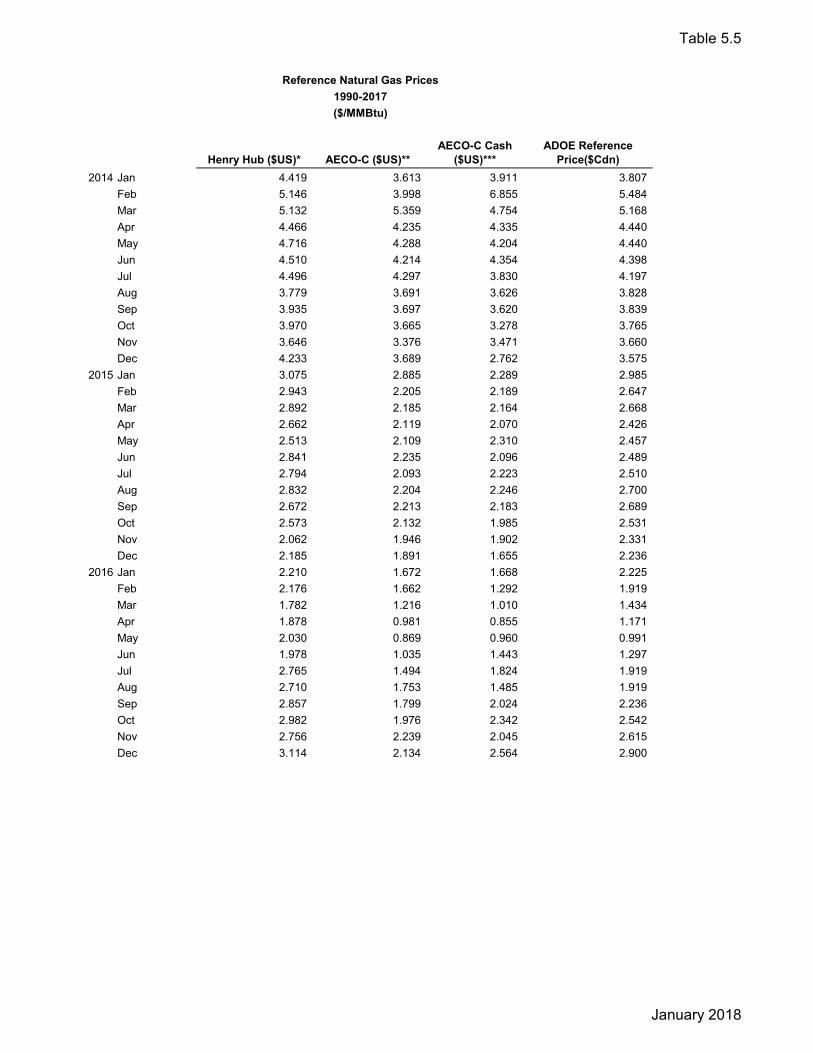
Table 5.5
Henry Hub ($US)* AECO-C ($US)**
AECO-C Cash
($US)***
ADOE Reference
Price($Cdn)
Reference Natural Gas Prices
1990-2017
($/MMBtu)
2014 Jan 4.419 3.613 3.911 3.807
Feb 5.146 3.998 6.855 5.484
Mar 5.132 5.359 4.754 5.168
Apr 4.466 4.235 4.335 4.440
May 4.716 4.288 4.204 4.440
Jun 4.510 4.214 4.354 4.398
Jul 4.496 4.297 3.830 4.197
Aug 3.779 3.691 3.626 3.828
Sep 3.935 3.697 3.620 3.839
Oct 3.970 3.665 3.278 3.765
Nov 3.646 3.376 3.471 3.660
Dec 4.233 3.689 2.762 3.575
2015 Jan 3.075 2.885 2.289 2.985
Feb 2.943 2.205 2.189 2.647
Mar 2.892 2.185 2.164 2.668
Apr 2.662 2.119 2.070 2.426
May 2.513 2.109 2.310 2.457
Jun 2.841 2.235 2.096 2.489
Jul 2.794 2.093 2.223 2.510
Aug 2.832 2.204 2.246 2.700
Sep 2.672 2.213 2.183 2.689
Oct 2.573 2.132 1.985 2.531
Nov 2.062 1.946 1.902 2.331
Dec 2.185 1.891 1.655 2.236
2016 Jan 2.210 1.672 1.668 2.225
Feb 2.176 1.662 1.292 1.919
Mar 1.782 1.216 1.010 1.434
Apr 1.878 0.981 0.855 1.171
May 2.030 0.869 0.960 0.991
Jun 1.978 1.035 1.443 1.297
Jul 2.765 1.494 1.824 1.919
Aug 2.710 1.753 1.485 1.919
Sep 2.857 1.799 2.024 2.236
Oct 2.982 1.976 2.342 2.542
Nov 2.756 2.239 2.045 2.615
Dec 3.114 2.134 2.564 2.900
January 2018

Table 5.5
Henry Hub ($US)* AECO-C ($US)**
AECO-C Cash
($US)***
ADOE Reference
Price($Cdn)
Reference Natural Gas Prices
1990-2017
($/MMBtu)
2017 Jan 3.370 2.612 2.206 3.016
Feb 2.830 2.180 1.938 2.521
Mar 2.700 1.846 1.965 2.320
Apr 3.080 1.942 2.10 2.468
May 3.130 2.022 2.20 2.594
Jun 2.920 2.195 1.90 2.521
Jul 2.940 1.869 1.28 1.930
Aug 2.890 1.710 1.38 1.814
Sep 2.950 1.245 0.80 1.266
Oct 2.900 1.253 0.59 1.171
Nov 2.940 1.671 1.81
Dec 2.760 1.691 1.59
2018 Jan 1.543
1991 1.535 0.976 1.438
1992 1.740 0.962 1.382
1993 2.154 1.772 1.475 1.668
1994 1.916 1.478 1.440 1.815
1995 1.625 0.845 0.865 1.308
1996 2.552 1.023 1.078 1.628
1997 2.628 1.359 1.301 1.968
1998 2.138 1.375 1.393 1.939
1999 2.268 1.987 1.968 2.477
2000 3.909 3.363 3.751 4.503
2001 4.398 4.101 3.526 5.402
2002 3.245 2.590 2.664 3.878
2003 5.397 4.707 4.760 6.123
2004 6.092 5.206 5.036 6.306
2005 8.578 7.013 7.279 8.297
2006 7.268 6.140 5.759 6.564
2007 6.909 6.049 5.990 6.203
2008 8.923 7.772 7.759 7.876
2009 4.028 3.587 3.469 3.826
2010 4.441 3.980 3.888 3.765
2011 4.085 3.736 3.678 3.457
2012 2.814 2.405 2.393 2.252
2013 3.672 3.064 3.082 2.980
2014 4.383 4.039 4.204 4.275
2015 2.670 2.185 2.109 2.556
2016 2.437 1.569 1.626 1.931
2017 2.951 1.853 1.647 2.162
2018 YTD 1.543
*Effective Jan 1/17 Monthly Weighted Average (was average of last 3 days of near month contract)
**Weighted average of all deals completed in previous month for next month delivery
***Daily spot price averages
January 2018

CAPP Statistical Handbook
Section 6
Demand/Consumption Table Canadian Consumption of Crude Oil & Products 1947 – Present ...................................................................................................................................... 6.1 Sales of Natural Gas in Canada 1947 – Present ...................................................................................................................................... 6.2 Natural Gas Sales in Canada by Province 1960 - Present ....................................................................................................................................... 6.3 Canadian Demand for Motor Gasoline, Diesel & Heavy Fuel Oil 1972 - Present ....................................................................................................................................... 6.4 Canadian Demand for Total Refined Petroleum Products 2000 – Present ...................................................................................................................................... 6.5 Sources of Canadian Energy Consumption 1950 - Present ....................................................................................................................................... 6.6


Table 6.1
CANADIAN CONSUMPTION OF CRUDE OIL & PRODUCTS
1947 - 2016
Cubic Metres Per Day
Apparent
Consumption
Refinery Crude Product Product of Crude Oil
Runs* Imports Exports & Products
1947 33 656 7 087 508 40 235
1948 37 948 9 646 922 46 672
1949 41 890 7 580 350 49 120
1950 47 518 8 804 16 56 306
1951 55 395 11 902 67 297
1952 60 228 10 100 563 69 765
1953 67 181 9 466 76 647
1954 73 798 8 253 186 81 865
1955 84 815 16 528 421 100 922
1956 98 572 15 790 1 093 113 269
1957 103 871 15 024 1 333 117 562
1958 104 679 12 757 533 116 903
1959 116 011 16 741 923 131 829
1960 121 696 15 646 1 385 135 957
1961 129 085 12 919 839 141 165
1962 134 809 13 085 1 898 145 996
1963 144 242 14 224 2 398 156 068
1964 148 534 19 011 3 783 163 762
1965 154 508 25 670 1 167 179 011
1966 165 492 25 973 1 156 190 309
1967 169 848 29 694 1 318 198 224
1968 180 353 32 313 2 021 210 645
1969 188 653 32 532 1 873 219 312
1970 202 986 31 269 2 554 231 701
1971 221 641 24 265 5 834 240 072
1972 243 450 22 280 14 822 250 908
1973 266 075 19 241 18 086 267 230
1974 281 215 13 181 17 212 277 184
1975 270 681 6 461 13 748 263 394
1976 271 173 5 767 9 282 267 658
1977 286 909 7 210 12 264 281 855
1978 288 666 7 943 20 642 275 967
1979 309 629 5 087 18 120 296 596
1980 300 960 6 888 20 118 287 730
1981 279 690 6 882 19 362 267 210
1982 239 402 7 273 14 402 232 273
1983 228 534 8 908 20 103 217 339
March 2017

Table 6.1
CANADIAN CONSUMPTION OF CRUDE OIL & PRODUCTS
1947 - 2016
Cubic Metres Per Day
Apparent
Consumption
Refinery Crude Product Product of Crude Oil
Runs* Imports Exports & Products
1984 229 468 14 442 22 113 221 797
1985 223 599 13 700 25 619 211 680
1986 218 613 18 703 23 424 213 892
1987 229 649 22 067 26 993 224 723
1988 241 175 24 453 36 902 228 726
1989 246 070 28 077 33 950 240 197
1990 251 785 24 085 38 288 237 582
1991 238 154 23 654 43 199 218 609
1992 231 792 23 614 37 896 217 510
1993 244 761 21 919 40 108 226 572
1994 251 207 20 108 37 454 233 861
1995 249 516 22 476 39 763 232 229
1996 261 370 22 964 46 665 237 670
1997 269 306 27 810 49 398 247 718
1998 271 778 28 588 46 083 254 284
1999 272 493 26 889 47 717 251 665
2000 280 674 25 282 48 220 257 736
2001 288 015 31 606 62 637 256 983
2002 295 982 27 440 67 346 256 075
2003 298 839 35 237 68 649 265 428
2004 311 202 38 774 71 014 278 962
2005 299 294 44 475 70 495 273 275
2006 291 773 46 125 67 107 270 792
2007 321 307 41 992 69 796 293 502
2008 308 673 50 183 70 081 288 775
2009 299 090 37 772 66 611 270 251
2010 305 349 35 524 66 638 274 236
2011 289 961 48 634 61 937 276 658
2012 297 920 34 046 74 496 257 470
2013 292 490 33 933 80 336 246 087
2014 283 014 34 253 73 125 244 143
2015 290 788 35 645 73 468 252 966
2016 294 005 38 663 68 791 263 878
*Includes condensate and pentanes plus and propane/butane/mixes
Note: Export/Import numbers above do not reflect total foreign trade transactions
March 2017

Table 6.2
SALES OF NATURAL GAS IN CANADA
1947 - 2016
Million Cubic Metres Per Day
Residential Commercial Industrial Direct Total
1947 1.5 0.7 0.9 3.1
1948 1.6 0.8 0.9 3.3
1949 1.7 0.8 1.1 3.6
1950 2.1 1.0 1.4 4.5
1951 2.2 1.1 1.7 5.0
1952 2.2 1.2 1.8 5.2
1953 2.4 1.2 2.1 5.7
1954 2.9 1.5 2.9 7.3
1955 3.6 1.8 3.9 9.3
1956 4.0 2.0 5.1 11.1
1957 4.6 2.3 5.5 12.4
1958 5.7 2.8 7.2 15.7
1959 7.4 3.3 10.8 21.5
1960 8.4 3.9 12.6 24.9
1961 9.3 4.4 15.1 28.8
1962 10.5 4.9 16.6 32.0
1963 11.3 5.4 18.3 35.0
1964 12.7 6.5 19.9 39.1
1965 14.5 7.8 22.1 44.4
1966 15.2 9.0 25.2 49.4
1967 15.8 10.2 27.9 53.9
1968 16.6 11.1 31.5 59.2
1969 18.0 13.1 34.5 65.6
1970 18.8 14.4 38.0 71.2
1971 19.5 16.1 42.2 77.8
1972 21.7 18.7 48.2 88.6
1973 21.1 19.1 55.2 95.4
1974 22.7 21.4 57.9 102.0
1975 23.2 22.2 57.4 102.8
1976 24.2 22.8 59.1 106.1
1977 24.4 23.1 63.6 2.9 114.0
1978 25.5 24.7 64.1 2.7 117.0
1979 26.3 25.4 67.5 2.8 122.0
1980 26.3 27.6 64.3 5.0 123.2
1981 26.8 27.7 62.9 0.7 118.1
1982 33.6 27.3 59.3 0.9 121.1
1983 31.2 26.0 62.9 0.6 120.7
1984 33.1 27.5 69.3 0.4 130.3
1985 35.0 29.2 73.1 0.1 137.4
1986 33.4 28.4 69.9 2.1 133.8
1987 31.4 26.7 67.9 5.0 131.0
1988 34.9 29.3 69.7 10.0 143.9
1989 38.0 31.5 74.8 11.5 155.8
1990 37.0 30.7 70.6 10.9 149.2
1991 37.4 30.8 68.4 13.2 149.8
1992 38.9 31.3 67.2 17.9 155.3
1993 40.7 31.6 68.7 22.2 163.2
1994 42.6 31.6 67.5 25.4 167.1
1995 43.3 31.7 67.3 31.9 174.2
1996 47.7 34.3 67.0 34.3 183.3
1997 45.2 31.9 66.7 40.8 184.6
1998 38.7 26.6 59.4 50.7 175.4
1999 39.2 28.1 56.1 58.1 181.5
2000 47.3 35.3 60.4 55.8 198.8
April 2017
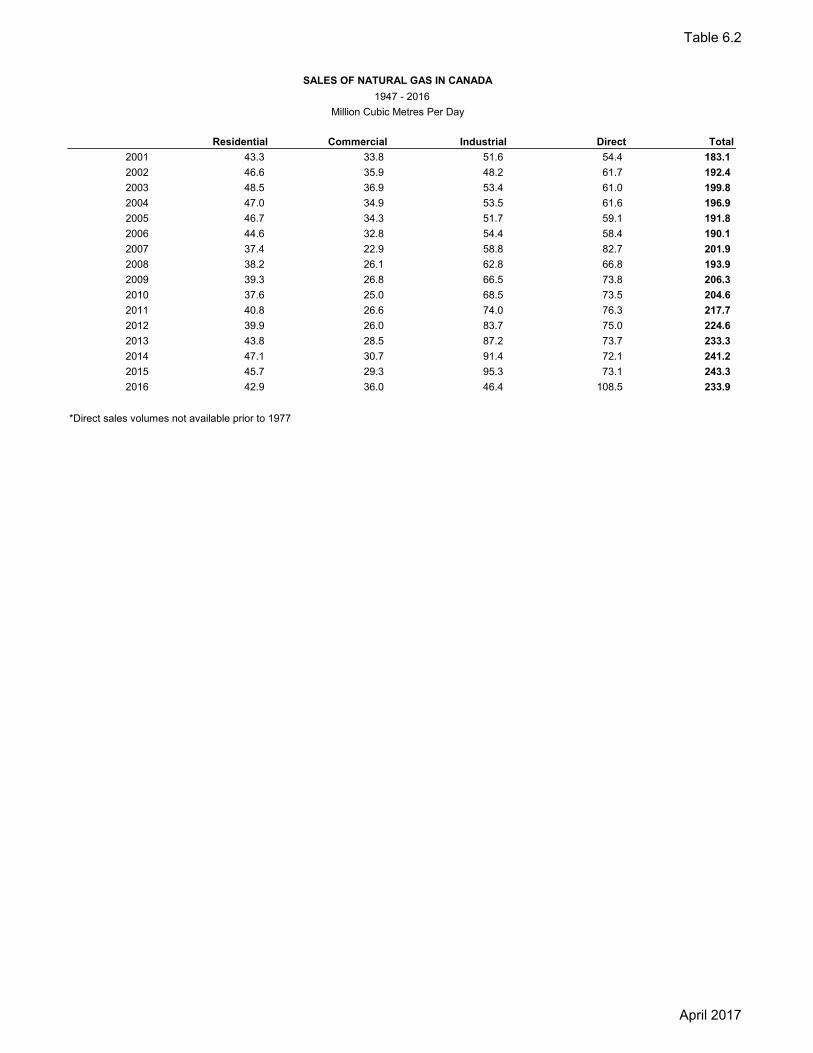
Table 6.2
SALES OF NATURAL GAS IN CANADA
1947 - 2016
Million Cubic Metres Per Day
Residential Commercial Industrial Direct Total
2001 43.3 33.8 51.6 54.4 183.1
2002 46.6 35.9 48.2 61.7 192.4
2003 48.5 36.9 53.4 61.0 199.8
2004 47.0 34.9 53.5 61.6 196.9
2005 46.7 34.3 51.7 59.1 191.8
2006 44.6 32.8 54.4 58.4 190.1
2007 37.4 22.9 58.8 82.7 201.9
2008 38.2 26.1 62.8 66.8 193.9
2009 39.3 26.8 66.5 73.8 206.3
2010 37.6 25.0 68.5 73.5 204.6
2011 40.8 26.6 74.0 76.3 217.7
2012 39.9 26.0 83.7 75.0 224.6
2013 43.8 28.5 87.2 73.7 233.3
2014 47.1 30.7 91.4 72.1 241.2
2015 45.7 29.3 95.3 73.1 243.3
2016 42.9 36.0 46.4 108.5 233.9
*Direct sales volumes not available prior to 1977
April 2017

Table 6.3
1960 - 2016
Million Cubic Metres at 101.325 kPa and 15°C
Nova New British
Scotia Brunswick Quebec Ontario Manitoba Saskatchewan Alberta Columbia Canada
1960 2 345 2 942 327 862 3 876 731 9 085
1961 2 686 3 545 467 1 004 3 988 810 10 502
1962 2 655 4 223 525 1 077 4 275 915 11 672
1963 2 769 4 748 643 1 186 4 439 1 005 12 792
1964 2 940 5 503 787 1 298 4 556 1 207 14 293
1965 2 885 6 209 935 1 620 4 936 1 646 16 233
1966 2 921 6 801 1 066 1 842 5 236 2 135 18 003
1967 2 1 000 7 909 1 182 1 942 5 530 2 127 19 692
1968 2 1 251 8 728 1 282 2 295 5 692 2 450 21 700
1969 2 1 439 9 956 1 343 2 233 6 425 2 531 23 929
1970 2 1 436 11 501 1 460 2 257 6 592 2 742 25 990
1971 2 1 569 13 018 1 555 2 326 7 037 2 859 28 366
1972 2 1 649 15 654 1 697 2 493 7 615 3 348 32 458
1973 1 1 819 16 405 1 767 2 632 7 962 4 240 34 826
1974 2 2 272 18 447 1 810 2 623 8 425 3 652 37 231
1975 2 2 334 18 059 1 708 2 609 8 712 4 102 37 526
1976 2 2 277 19 178 1 725 2 671 9 079 3 903 38 835
1977 2 2 309 18 823 1 719 2 884 11 000 3 810 40 547
1978 2 2 460 18 674 1 818 2 791 12 062 3 938 41 745
1979 2 2 765 18 915 1 928 2 830 12 868 4 186 43 494
1980 2 2 921 18 641 1 783 2 762 12 819 4 327 43 255
1981 2 3 191 18 489 1 697 2 618 12 767 4 121 42 885
1982 2 2 970 17 800 1 817 2 786 14 061 4 453 43 889
1983 2 3 589 17 778 1 721 2 623 13 178 4 402 43 293
1984 1 4 206 18 991 1 776 2 798 15 066 4 720 47 558
1985 1 4 872 19 599 1 852 2 838 15 964 4 996 50 122
1986 1 4 939 19 245 1 769 2 553 15 030 4 515 48 052
1987 1 5 008 19 478 1 551 2 381 14 516 4 855 47 790
1988 5 195 21 149 1 827 2 793 16 288 5 429 52 681
1989 5 372 22 398 1 879 2 761 17 795 6 663 56 868
1990 5 588 20 689 1 948 2 792 17 420 6 034 54 471
1991 5 452 21 064 1 847 3 146 17 146 6 016 54 671
1992 5 693 22 203 1 779 3 664 17 185 6 342 56 866
1993 5 745 22 685 1 824 4 225 17 776 7 304 59 559
1994 5 656 23 340 1 799 4 377 18 465 7 362 60 999
1995 5 996 24 150 1 896 4 470 19 365 7 724 63 601
1996 6 292 25 253 2 028 4 753 21 004 7 764 67 094
1997 6 408 25 878 1 900 4 697 20 786 7 646 67 315
1998 6 032 23 486 1 797 4 786 20 302 7 577 63 980
1999 6 165 25 304 2 016 4 793 20 297 7 686 66 261
2000 6 372 27 450 2 161 5 218 22 887 8 466 72 554
2001 3 42 5 258 25 488 2 045 4 923 20 633 8 406 66 798
2002 544 464 5 829 26 837 2 223 5 143 21 806 7 376 70 222
2003 55 576 5 600 27 854 2 155 5 708 24 044 6 960 72 952
2004 44 624 5 740 26 844 2 177 5 639 24 188 7 096 72 352
2005 74 665 5 368 26 710 2 075 5 490 22 739 7 013 70 134
2006 137 797 5 658 25 254 1 970 5 428 23 534 6 722 69 500
2007 333 736 6 472 26 720 2 117 5 495 27 336 7 495 76 704
2008 428 778 5 423 25 811 2 196 5 647 28 857 7 192 76 332
2009 550 946 5 339 24 610 2 124 5 568 29 251 6 906 75 294
2010 755 1 023 5 362 24 265 1 886 5 606 29 596 6 169 74 661
2011 841 1 102 5 526 25 921 2 017 5 775 31 924 6 361 79 467
2012 763 1 065 5 500 25 087 1 903 6 166 35 175 6 308 81 967
2013 546 1 122 5 772 26 561 2 205 6 515 36 264 6 155 85 140
2014 613 1 193 5 988 27 310 2 170 6 738 38 060 5 958 88 029
2015 640 1 151 5 930 26 053 1 953 7 514 38 884 5 705 87 832
2016r 622 1 150 5 987 24 177 2 025 6 182 41 747 6 855 88 746
r=revised
* NOTE: Direct sales not included prior to 1987.
NATURAL GAS SALES IN CANADA BY PROVINCE
January 2018

CANADIAN DEMAND FOR MOTOR GASOLINE, DIESEL HEAVY FUEL OIL
1972 - 2016
Cubic Metres per Day
1972 1973 1974 1975 1976 1977 1978 1979 1980 1981 1982 1983 1984 1985 1986 1987
MOTOR GASOLINE:
Atlantic 6 688 7 676 7 787 8 131 8 077 8 264 8 575 8 934 8 912 8 463 7 899 7 512 7 509 7 458 7 417 7 594
Quebec 19 348 21 526 21 645 23 031 23 255 23 354 23 755 24 033 23 800 22 369 19 416 18 589 18 516 18 447 18 679 18 803
Ontario 29 412 32 267 32 988 33 816 34 547 34 458 35 430 36 470 36 484 35 273 32 829 32 164 32 297 32 429 32 888 33 547
Manitoba 3 764 4 145 4 233 4 041 4 230 4 381 4 531 4 578 4 399 4 226 4 110 4 032 4 043 4 017 3 966 3 937
Alberta 7 828 8 564 9 230 9 983 10 644 11 333 12 245 13 364 13 781 13 922 13 138 12 737 12 124 12 084 11 848 12 120
British Columbia 8 272 9 123 9 763 9 833 9 960 10 412 11 059 11 522 12 048 12 003 11 054 10 409 10 187 9 861 9 863 9 684
Saskatchewan 4 593 4 886 5 041 5 538 5 623 5 658 5 610 5 737 5 626 5 480 5 219 5 227 5 119 5 105 5 116 5 042
NWT/Yukon/Nunavet 219 234 245 265 246 251 260 254 238 260 250 251 276 271 268 298
Canada 80 124 88 421 90 932 94 639 96 582 98 111 101 465 104 891 105 288 101 996 93 916 90 922 90 071 89 673 90 045 91 025
DIESEL FUEL:
Atlantic 3 311 3 421 3 749 3 701 3 900 3 760 3 605 4 009 3 971 3 951 3 741 3 901 4 120 4 077 3 995 4 270
Quebec 4 139 5 404 5 781 5 526 6 151 6 771 6 966 7 807 7 311 7 315 5 834 5 813 6 559 6 566 6 911 7 363
Ontario 5 296 6 108 6 811 6 960 7 311 7 912 8 373 9 241 9 147 9 262 8 869 9 773 10 487 10 580 10 835 11 462
Manitoba 1 662 1 768 1 898 1 808 1 893 1 833 2 003 2 083 2 099 2 098 1 989 2 193 2 178 2 306 2 275 2 413
Alberta 3 077 3 248 3 699 4 430 4 884 5 444 6 049 7 119 8 041 7 701 7 196 7 029 7 277 7 795 7 397 7 483
British Columbia 4 126 4 641 4 992 4 443 4 840 5 182 5 668 6 392 6 954 6 674 5 983 5 927 5 998 6 368 5 988 6 533
Saskatchewan 1 891 1 977 2 156 2 387 2 368 2 529 2 730 2 955 2 964 2 878 2 846 3 079 3 076 3 232 3 162 3 219
NWT/Yukon/Nunavut 624 611 628 644 564 586 551 595 602 628 636 526 785 751 609 493
Canada 23 502 26 567 29 086 29 255 31 346 33 431 35 393 39 606 40 487 39 878 36 458 37 716 39 696 40 924 40 562 42 743
HEAVY FUEL OIL:
Atlantic 12 812 12 770 11 087 11 573 12 049 12 635 13 237 13 687 13 380 9 598 8 728 5 986 6 371 6 112 6 488 8 414
Quebec 19 031 19 574 18 678 16 912 16 980 15 859 14 705 16 035 16 039 14 112 11 813 9 102 7 579 5 386 5 177 4 444
Ontario 11 576 11 900 11 631 9 624 10 924 12 345 11 084 9 644 7 742 7 037 3 917 3 935 3 517 2 314 3 186 3 341
Manitoba 377 397 571 585 484 434 408 360 348 348 481 380 227 219 200 180
Alberta 284 345 304 504 65 53 44 59 38 55 75 103 83 68 105 92
British Columbia 3 741 4 061 4 550 3 602 3 970 3 857 3 156 3 698 3 708 4 331 3 664 2 352 1 843 1 822 2 051 2 227
Saskatchewan 270 233 118 94 52 29 26 40 55 44 47 57 99 96 90 92
NWT/Yukon/Nunavut 61 71 65 75 68 54 55 62 59 52 57 70 56 59 52 44
Canada 48 152 49 352 47 003 42 968 44 591 45 264 42 715 43 585 41 370 35 577 28 782 21 984 19 776 16 077 17 349 18 834
* Effective 1987-1993, NWT included
with Saskatchewan. 1994 onwards,
Saskatchewan only.
* some are estimates or not available
(na) due to suppression by Statistics
Canada due to confidentiality
requirements of the Statistics Act
May 2017 Table 6.4

CANADIAN DEMAND FOR MOTOR GASOLINE, DIESEL HEAVY FUEL OIL
1972 - 2016
Cubic Metres per Day
MOTOR GASOLINE:
Atlantic
Quebec
Ontario
Manitoba
Alberta
British Columbia
Saskatchewan
NWT/Yukon/Nunavet
Canada
DIESEL FUEL:
Atlantic
Quebec
Ontario
Manitoba
Alberta
British Columbia
Saskatchewan
NWT/Yukon/Nunavut
Canada
HEAVY FUEL OIL:
Atlantic
Quebec
Ontario
Manitoba
Alberta
British Columbia
Saskatchewan
NWT/Yukon/Nunavut
Canada
* Effective 1987-1993, NWT included
with Saskatchewan. 1994 onwards,
Saskatchewan only.
* some are estimates or not available
(na) due to suppression by Statistics
Canada due to confidentiality
requirements of the Statistics Act
1988 1989 1990 1991 1992 1993 1994 1995 1996 1997 1998 1999 2000 2001 2002 2003 2004
7 899 7 845 7 946 7 589 7 669 7 832 7 978 7 933 7 956 7 951 8 116 8 407 8 284 8 281 8 480 8 608 8 654
19 500 20 303 19 857 18 822 19 433 20 081 20 636 20 737 21 087 21 114 21 642 22 031 21 876 22 111 22 828 23 484 23 711
34 798 35 536 34 271 33 485 33 545 34 195 34 970 34 996 35 312 36 592 37 658 39 308 39 873 40 319 41 459 42 210 43 217
3 844 3 836 3 715 3 827 3 820 3 786 3 830 3 918 3 824 3 765 3 819 3 922 3 895 3 871 3 922 3 990 4 101
12 606 12 642 12 611 11 515 11 634 11 649 12 132 12 055 12 269 12 885 13 443 13 618 13 535 14 492 14 528 14 213 14 538
9 859 10 205 9 773 9 934 10 201 10 799 11 258 11 476 11 681 12 313 12 850 12 789 12 635 12 425 12 430 12 650 13 367
4 671 4 721 4 550 4 497 4 515 4 564 4 759 4 647 4 725 4 531 4 583 4 643 4 567 4 572 4 615 4 821 4 776
274 257 271 258 262 305 292 274 284 285 260 254 253 261 230 240 221
93 452 95 346 92 994 89 928 91 079 93 210 95 855 96 035 97 138 99 435 102 371 104 971 104 918 106 333 108 492 110 216 112 584
4 576 4 711 4 874 4 683 4 665 4 772 4 975 5 028 5 129 5 414 5 689 6 290 6 754 6 582 6 609 6 710 7 111
8 211 8 760 8 136 7 691 7 798 8 208 9 061 9 350 9 053 9 732 10 238 10 487 10 427 9 568 9 715 10 551 11 171
12 236 12 292 12 000 11 094 11 237 11 829 12 676 13 368 14 076 15 074 15 545 16 807 18 084 17 246 17 531 17 771 19 081
2 393 2 370 2 455 2 129 2 095 2 177 2 326 2 514 2 578 2 437 2 292 2 241 2 313 2 275 2 218 2 425 2 655
7 355 7 698 7 673 7 095 6 848 7 574 8 768 9 239 9 969 11 486 11 711 11 832 12 799 13 162 12 188 13 495 14 365
7 036 7 282 7 024 6 936 7 046 7 171 7 669 8 299 8 577 8 756 8 446 8 586 8 606 8 634 8 796 8 991 9 490
3 303 3 359 3 297 3 315 3 268 3 490 4 032 4 113 4 375 4 646 4 069 4 116 4 260 3 740 3 886 4 199 4 384
511 633 642 510 434 475 543 599 820 757 811 355 718 956 819 822 863
45 111 46 472 45 458 42 943 42 958 45 221 50 050 52 510 54 577 58 302 58 800 60 713 63 961 62 164 61 761 64 963 69 121
9 503 12 032 10 452 9 681 10 994 9 525 7 531 8 138 6 949 9 175 10 476 9 585 9 817 8 694 5 878 8 514 7 449
5 969 7 594 7 345 5 810 5 242 4 854 4 660 3 923 4 578 5 068 7 207 6 002 6 333 7 631 7 035 9 011 9 180
3 857 4 147 5 027 2 877 3 356 3 396 3 515 3 122 3 156 2 503 3 429 2 546 2 396 2 986 2 129 2 725 2 933
176 168 177 201 185 218 211 115 142 248 265 217 209 251 225 183 186
94 104 196 147 183 93 157 425 319 170 134 150 90 85 83 158 209
2 518 2 797 3 108 3 081 2 311 2 105 1 981 1 660 1 414 1 513 1 645 1 807 1 833 2 461 2 400 2 982 3 072
88 106 114 81 76 45 100 103 121 166 185 200 202 240 361 507 374
21 1 20 28 100 1 1 1 1 1 0.4000 0.1315 - - - - -
22 227 26 949 26 439 21 906 22 446 20 238 18 156 17 489 16 680 18 845 23 340 20 506 20 879 22 348 18 112 24 080 23 402
May 2017 Table 6.4
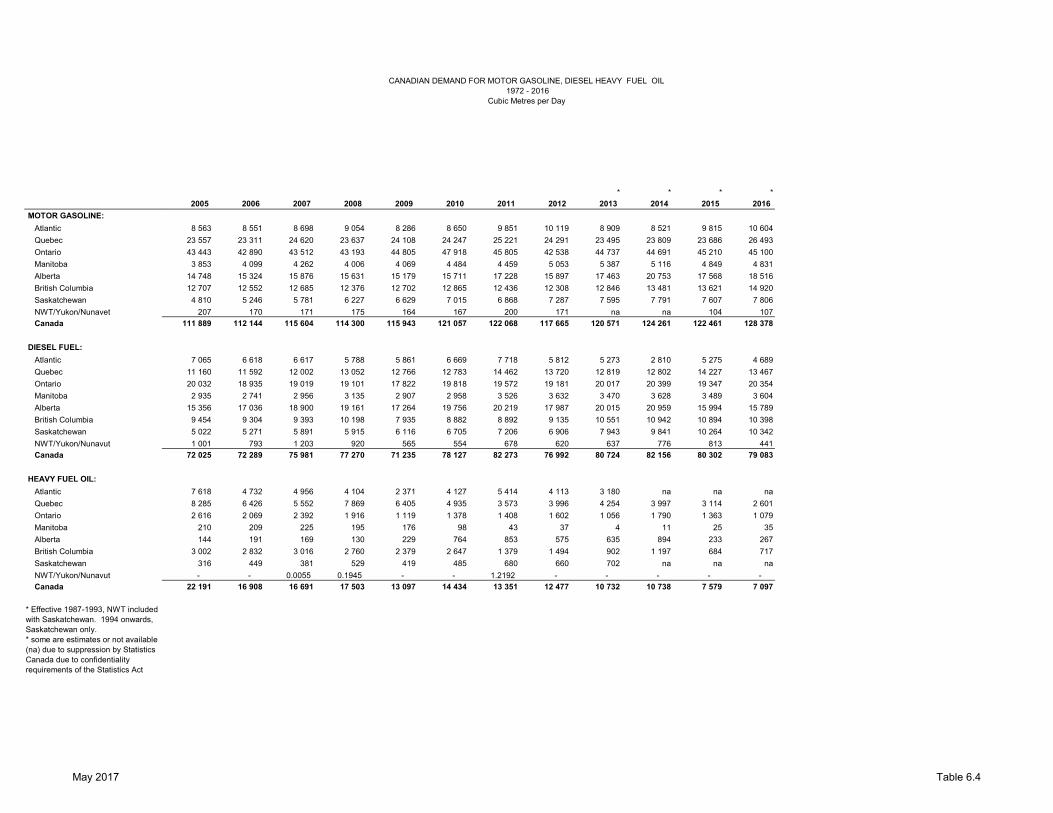
CANADIAN DEMAND FOR MOTOR GASOLINE, DIESEL HEAVY FUEL OIL
1972 - 2016
Cubic Metres per Day
MOTOR GASOLINE:
Atlantic
Quebec
Ontario
Manitoba
Alberta
British Columbia
Saskatchewan
NWT/Yukon/Nunavet
Canada
DIESEL FUEL:
Atlantic
Quebec
Ontario
Manitoba
Alberta
British Columbia
Saskatchewan
NWT/Yukon/Nunavut
Canada
HEAVY FUEL OIL:
Atlantic
Quebec
Ontario
Manitoba
Alberta
British Columbia
Saskatchewan
NWT/Yukon/Nunavut
Canada
* Effective 1987-1993, NWT included
with Saskatchewan. 1994 onwards,
Saskatchewan only.
* some are estimates or not available
(na) due to suppression by Statistics
Canada due to confidentiality
requirements of the Statistics Act
* * * *
2005 2006 2007 2008 2009 2010 2011 2012 2013 2014 2015 2016
8 563 8 551 8 698 9 054 8 286 8 650 9 851 10 119 8 909 8 521 9 815 10 604
23 557 23 311 24 620 23 637 24 108 24 247 25 221 24 291 23 495 23 809 23 686 26 493
43 443 42 890 43 512 43 193 44 805 47 918 45 805 42 538 44 737 44 691 45 210 45 100
3 853 4 099 4 262 4 006 4 069 4 484 4 459 5 053 5 387 5 116 4 849 4 831
14 748 15 324 15 876 15 631 15 179 15 711 17 228 15 897 17 463 20 753 17 568 18 516
12 707 12 552 12 685 12 376 12 702 12 865 12 436 12 308 12 846 13 481 13 621 14 920
4 810 5 246 5 781 6 227 6 629 7 015 6 868 7 287 7 595 7 791 7 607 7 806
207 170 171 175 164 167 200 171 na na 104 107
111 889 112 144 115 604 114 300 115 943 121 057 122 068 117 665 120 571 124 261 122 461 128 378
7 065 6 618 6 617 5 788 5 861 6 669 7 718 5 812 5 273 2 810 5 275 4 689
11 160 11 592 12 002 13 052 12 766 12 783 14 462 13 720 12 819 12 802 14 227 13 467
20 032 18 935 19 019 19 101 17 822 19 818 19 572 19 181 20 017 20 399 19 347 20 354
2 935 2 741 2 956 3 135 2 907 2 958 3 526 3 632 3 470 3 628 3 489 3 604
15 356 17 036 18 900 19 161 17 264 19 756 20 219 17 987 20 015 20 959 15 994 15 789
9 454 9 304 9 393 10 198 7 935 8 882 8 892 9 135 10 551 10 942 10 894 10 398
5 022 5 271 5 891 5 915 6 116 6 705 7 206 6 906 7 943 9 841 10 264 10 342
1 001 793 1 203 920 565 554 678 620 637 776 813 441
72 025 72 289 75 981 77 270 71 235 78 127 82 273 76 992 80 724 82 156 80 302 79 083
7 618 4 732 4 956 4 104 2 371 4 127 5 414 4 113 3 180 na na na
8 285 6 426 5 552 7 869 6 405 4 935 3 573 3 996 4 254 3 997 3 114 2 601
2 616 2 069 2 392 1 916 1 119 1 378 1 408 1 602 1 056 1 790 1 363 1 079
210 209 225 195 176 98 43 37 4 11 25 35
144 191 169 130 229 764 853 575 635 894 233 267
3 002 2 832 3 016 2 760 2 379 2 647 1 379 1 494 902 1 197 684 717
316 449 381 529 419 485 680 660 702 na na na
- - 0.0055 0.1945 - - 1.2192 - - - - -
22 191 16 908 16 691 17 503 13 097 14 434 13 351 12 477 10 732 10 738 7 579 7 097
May 2017 Table 6.4

CANADIAN DEMAND FOR TOTAL REFINED PETROLEUM PRODUCTS2000-2016
Cubic Metres Per Day
2000 2001 2002 2003 2004 2005 2006 2007 2008 2009
Newfoundland and Labrador 6 010 7 010 6 943 7 189 6 809 6 735 5 570 6 561 6 424 5 586
Prince Edward Island 1 504 1 427 1 454 1 496 1 517 1 458 1 375 1 442 1 360 1 326
Nova Scotia 11 712 10 797 10 416 12 528 12 855 12 033 10 808 10 164 9 663 8 986
New Brunswick 13 528 11 948 9 956 10 788 10 488 10 777 9 255 9 083 8 698 7 719
Atlantic provinces 32 754 31 183 28 769 32 000 31 669 31 004 27 008 27 250 26 145 23 616
Atlantic provinces and Other
Quebec 52 467 53 256 55 989 60 156 60 650 60 200 58 961 60 488 60 279 56 787
Ontario 86 895 84 933 86 614 88 049 93 839 90 550 89 680 90 866 89 585 83 759
Manitoba 7 471 7 406 7 396 7 592 7 895 7 946 7 990 8 447 8 350 8 261
Saskatchewan 10 361 9 782 10 236 10 780 10 657 11 405 12 334 13 396 14 113 14 752
Alberta 37 205 38 775 36 789 39 044 41 719 43 237 45 466 49 036 49 393 46 301
British Columbia 30 257 29 813 30 397 30 998 32 983 31 959 31 288 31 572 32 233 29 018
Yukon 363 365 367 389 376 348 355 352 306 274
Northwest Territories 794 1 023 961 1 022 1 072 1 173 1 026 1 470 1 164 781
Nunavut 336 459 263 194 169 159 4 1
Canada 258 904 256 995 257 783 270 225 280 092 277 983 274 113 282 878 281 570 263 549
na=Statistics Canada data suppression
* estimates
April 2017 Table 6.5

CANADIAN DEMAND FOR TOTAL REFINED PETROLEUM PRODUCTS2000-2016
Cubic Metres Per Day
Newfoundland and Labrador
Prince Edward Island
Nova Scotia
New Brunswick
Atlantic provinces
Atlantic provinces and Other
Quebec
Ontario
Manitoba
Saskatchewan
Alberta
British Columbia
Yukon
Northwest Territories
Nunavut
Canada
na=Statistics Canada data suppression
* estimates
2010 2011 2012 2013 2014 2015 2016
6 306 6 681 6 667 6 575 na na na
1 357 1 591 1 370 1 251 na na na
9 092 10 817 9 995 9 906 na na na
11 105 14 938 11 910 7 429 na na na
27 860 34 027 29 941 25 161 na na na
26 969 26 756 26 302
55 468 61 116 57 514 55 838 55 268 54 632 56 508
94 860 91 504 90 952 92 352 94 115 94 024 96 230
9 065 9 380 9 877 10 118 9 890 9 712 9 885
15 852 16 685 16 585 18 506 18 917 19 318 18 860
50 935 53 139 56 176 56 031 57 396 49 410 48 103
30 821 29 072 27 793 30 128 30 540 30 123 31 337
252 313 289 286 302 na na
774 901 850 853 989 1 139 761
354 129 na 164 0
285 886 296 492 289 978 289 402 294 388 285 276 287 986
April 2017 Table 6.5

Table 6.6
Natural Electricity Total
Petroleum(1) Gas Coal Hydro & Nuclear Other(2) Petajoules
1950 32.6 3.1 49.2 7.2 7.9 2 546
1955 49.2 5.8 31.5 8.5 5.0 3 058
1960 54.4 13.2 16.9 10.8 4.7 3 350
1965 57.4 15.2 15.1 9.8 2.5 4 369
1970 54.2 18.1 11.6 9.2 6.9 6 097
1971 53.6 18.8 10.7 9.1 7.9 6 379
1972 54.0 20.4 9.7 9.5 6.3 6 717
1973 53.7 20.6 9.5 9.9 6.3 7 030
1974 53.3 20.9 9.2 10.5 6.2 7 272
1975 53.5 21.6 9.3 10.5 5.0 7 084
1976 53.0 21.4 9.8 10.8 4.9 7 310
1977 52.2 21.8 10.4 10.9 4.8 7 537
1978 52.4 25.1 0.9 17.5 4.2 5 910
1979 51.8 25.2 0.8 17.2 5.1 6 171
1980 51.5 24.7 0.8 18.0 5.0 6 157
1981 49.7 25.4 0.8 19.2 4.8 5 949
1982 46.8 27.2 0.8 20.0 5.1 5 683
1983 45.0 27.4 0.8 21.5 5.3 5 515
1984 42.8 28.6 0.8 22.3 5.5 5 736
1985 40.9 30.2 0.9 22.4 5.2 5 847
1986 41.2 29.2 0.8 23.8 5.0 5 867
1987 41.1 28.7 0.8 24.5 4.8 5 918
1988 40.6 29.8 0.8 24.2 4.6 6 309
1989 40.6 30.1 0.8 24.0 4.5 6 499
1990 40.1 30.3 0.8 24.7 4.1 6 299
1991 38.4 31.1 0.6 25.4 4.5 6 209
1992 37.9 31.8 0.6 25.2 4.4 6 328
1993 37.9 32.4 0.6 25.2 3.9 6 447
1994 38.3 32.4 0.6 24.8 3.9 6 655
1995 37.7 32.6 0.6 24.6 4.2 6 785
1996 37.6 33.6 0.6 24.2 3.9 7 040
1997 38.3 32.8 0.7 24.1 3.8 7 095
1998 39.8 31.1 0.7 24.5 3.7 6 956
1999 39.8 31.3 0.7 24.3 3.7 7 133
2000 39.2 31.8 0.7 24.4 3.7 7 376
2001 40.2 30.1 0.7 24.8 3.8 7 175
2002 39.1 31.5 0.7 24.8 3.5 7 385
2003 39.8 31.2 0.7 24.6 3.4 7 586
2004 40.6 30.4 0.7 24.4 3.4 7 682
2005 40.7 29.8 0.7 25.1 3.7 7 641
2006 40.8 29.2 0.8 25.1 4.1 7 513
2007 40.3 30.2 0.7 24.8 3.9 7 915
2008 39.8 30.4 0.7 25.1 4.0 7 886
2009 41.0 31.6 0.6 23.4 3.4 7 373
2010 41.7 31.0 0.7 23.1 3.4 7 555
2011 40.6 32.2 0.7 22.7 3.7 7 820
2012 40.8 31.8 0.7 22.7 4.0 7 788
SOURCES OF CANADIAN PRIMARY & SECONDARY ENERGY CONSUMPTION
1950 - 2016
Percent
November 2017

Table 6.6
Natural Electricity Total
Petroleum(1) Gas Coal Hydro & Nuclear Other(2) Petajoules
SOURCES OF CANADIAN PRIMARY & SECONDARY ENERGY CONSUMPTION
1950 - 2016
Percent
2013 40.5 33.1 0.6 22.5 3.3 7 975
2014 39.4 34.3 0.6 22.4 3.3 8 080
2015 39.8 34.1 0.6 22.4 3.1 8 018
2016 39.8 33.8 0.5 22.7 3.2 7 953
(1) Includes LPG
(2) Waste wood and spent pulping liquor and other unspecified fuels. Primary steam is included 1973 onwards.
November 2017

CAPP Statistical Handbook
Section 7
Refining
Table Refinery Run to Stills - Canada 1947 – Present ...................................................................................................................................... 7.1 Oil Imports and Refinery Receipts - Canada 1947 – Present ...................................................................................................................................... 7.2 Refinery and Upgrader Capacity - Canada 1947 – Present ...................................................................................................................................... 7.3 Petroleum Refineries and Upgraders in Canada Current Year ......................................................................................................................................... 7.4 Refinery Closures - Canada 1970 - Present ....................................................................................................................................... 7.5 Refinery Utilization Rate - Canada 1947 – Present ...................................................................................................................................... 7.6 Yields of Refined Petroleum Products in Canada 1952 - Present ....................................................................................................................................... 7.7


Atlantic BC, SK,
Provinces Quebec Ontario MB & NWT Alberta Canada
1947 33 656
1948 37 948
1949 41 890
1950 47 518
1951 25 734 11 708 10 467 7 486 55 395
1952 26 634 13 493 11 399 8 702 60 228
1953 27 987 16 452 13 237 9 505 67 181
1954 28 655 19 284 16 901 8 958 73 798
1955 33 359 22 092 19 714 9 650 84 815
1956 41 766 24 980 20 120 11 706 98 572
1957 44 897 25 305 22 414 11 255 103 871
1958 43 970 28 309 21 386 11 014 104 679
1959 48 352 33 098 22 982 11 579 116 011
1960 52 708 32 854 23 886 12 248 121 696
1961 56 353 36 222 24 130 12 380 129 085
1962 13 767 44 823 37 030 26 257 12 932 134 809
1963 15 287 47 743 41 725 25 923 13 564 144 242
1964 16 791 45 392 45 066 27 979 13 306 148 534
1965 16 683 46 143 48 097 28 771 14 814 154 508
1966 17 342 51 002 49 989 31 920 15 239 165 492
1967 17 354 53 574 49 906 33 103 15 911 169 848
1968 17 222 59 858 52 161 34 611 16 501 180 353
1969 19 848 62 713 54 397 34 097 17 598 188 653
1970 21 442 68 207 58 962 36 466 17 909 202 986
1971 31 692 73 762 60 087 36 276 19 824 221 641
1972 41 344 83 112 59 257 35 735 24 002 243 450
1973 46 886 89 308 65 355 38 062 26 464 266 075
1974 56 138 85 070 71 925 39 382 28 700 281 215
1975 49 909 80 947 70 589 36 088 33 148 270 681
1976 41 619 86 099 71 960 33 881 37 614 271 173
1977 45 048 88 588 80 052 33 340 39 881 286 909
1978 44 893 83 396 85 871 33 910 40 596 288 666
1979 50 206 80 707 95 550 37 772 45 394 309 629
1980 43 588 79 412 94 116 38 543 45 301 300 960
1981 34 247 75 390 87 929 37 676 44 448 279 690
1982 22 203 65 883 76 073 33 442 39 831 237 432
1983 22 259 54 405 77 323 27 860 43 935 225 782
1984 22 238 49 468 80 759 24 171 49 213 225 850
1985 23 085 44 641 77 741 23 955 49 464 218 886
1986 29 510 39 565 73 690 23 426 48 416 214 607
1987 34 242 40 366 75 063 22 382 50 992 223 045
1988 45 500 41 473 75 261 20 459 53 127 235 820
1989 45 468 41 339 79 714 17 981 55 762 240 265
1990 47 492 46 593 76 275 25 814 55 612 251 787
1991 44 896 43 634 69 952 26 707 51 922 237 112
1992 40 257 42 787 71 034 29 623 48 726 232 427
1993 51 039 46 088 70 292 24 822 52 534 244 774
1994 47 097 51 772 70 508 23 687 58 142 251 207
1995 47 491 51 389 69 970 20 461 60 206 249 516
1996 51 570 53 567 72 713 18 384 65 298 261 531
1997 52 793 54 353 76 210 17 772 68 178 269 307
1998 50 594 57 735 78 532 19 124 65 793 271 778
1999 53 453 56 411 75 205 18 781 68 642 272 493
2000 52 711 60 274 78 408 19 690 70 359 281 443
2001 62 407 59 338 79 207 19 489 67 576 288 016
2002 65 397 63 160 78 478 19 029 69 999 296 063
2003 67 871 66 277 77 141 21 528 66 024 298 840
REFINERY RUN TO STILLS* - CANADA
1947 - 2016
Cubic Metres Per Day
May 2017 Table 7.1

Atlantic BC, SK,
Provinces Quebec Ontario MB & NWT Alberta Canada
REFINERY RUN TO STILLS* - CANADA
1947 - 2016
Cubic Metres Per Day
2004 68 141 65 613 81 206 23 514 73 516 311 991
2005 68 584 68 507 66 484 22 781 72 937 299 294
2006 64 781 67 435 63 465 24 819 71 273 291 773
2007 68 520 68 488 66 404 25 216 74 792 303 419
2008 69 096 68 195 64 626 23 423 66 985 292 325
2009 67 613 65 595 57 776 25 840 65 116 281 940
2010 69 277 61 901 64 177 24 191 71 692 291 237
2011 66 255 53 485 62 269 24 291 69 400 275 699
2012 73 254 57 025 70 629 26 351 69 848 297 106
2013 76 766 52 660 72 097 17 529 71 455 290 507
2014 na 46 003 na na 73 854 283 014
2015 53 693 45 531 53 742 na 64 242 290 788
2016 na 44 587 50 584 na 44 334 293 202
* includes condensate, pentanes lus and propane/butanes mixNote: 1951-1961 Quebec included Atlantic Provinces
May 2017 Table 7.1

OIL IMPORTS & REFINERY RECEIPTS* - CANADA
1947 - 2016Cubic Metres Per Day
Received From
Middle East
Iran/ Saudi Total
Iran Iraq Iraq Kuwait Arabi Libya Algeria Nigeria Venezuela Norway U.K. U.S. Mexico Other** Imported Canada TOTAL
1947 12 494 17 038 869 30 401 3 110 33 511
1948 1 792 17 253 14 451 81 33 577 5 193 38 770
1949 4 022 15 539 12 910 377 32 848 8 938 41 786
1950 7 773 13 910 13 603 324 35 610 11 465 47 075
1951 5 842 19 665 9 176 1 512 36 195 20 543 56 738
1952 3 638 22 047 8 708 1 412 35 805 25 571 61 376
1953 3 007 25 179 6 233 1 022 35 441 30 191 65 632
1954 2 847 25 874 3 428 1 275 33 424 40 350 73 774
1955 3 667 29 790 3 103 1 208 37 768 45 736 83 504
1956 476 2 716 5 157 33 869 2 389 1 548 46 155 54 530 100 685
1957 36 3 424 2 801 38 347 3 516 596 48 720 55 254 103 974
1958 164 7 966 5 762 31 271 746 870 46 779 58 563 105 342
1959 2 636 6 754 7 246 32 464 90 1 461 50 651 65 962 116 613
1960 6 445 6 197 9 251 31 836 75 1 260 55 064 64 806 119 870
1961 5 598 5 198 10 135 35 720 1 351 58 002 68 432 126 434
1962 7 996 2 533 9 205 37 431 1 769 58 934 75 583 134 517
1963 10 135 1 535 9 258 39 530 3 361 63 819 81 047 144 866
1964 7 969 3 607 3 204 44 790 2 929 62 499 86 600 149 099
1965 9 510 3 265 9 876 203 37 515 2 324 62 693 90 810 153 503
1966 14 513 1 581 7 521 2 346 5 678 34 413 2 975 69 027 95 867 164 894
1967 7 520 1 627 539 5 927 2 351 4 017 45 347 1 242 2 432 71 002 97 698 168 700
1968 9 784 104 1 313 8 238 1 514 52 930 3 571 77 454 102 425 179 879
1969 7 096 2 249 1 958 5 300 1 730 3 510 55 008 90 5 988 82 929 105 375 188 304
1970 8 812 3 730 2 157 4 672 7 742 57 944 5 649 90 706 112 746 203 452
1971 14 181 3 977 6 420 197 8 992 64 347 8 214 106 328 114 606 220 934
1972 15 605 2 610 406 11 711 5 360 9 272 61 841 18 565 125 370 118 634 244 004
1973 21 055 3 372 11 477 5 462 8 200 63 095 24 068 136 729 130 665 267 394
1974 30 953 1 511 5 047 16 908 1 313 1 991 55 739 16 836 130 298 150 769 281 067
1975 33 098 5 995 4 881 26 046 2 017 3 724 40 869 13 919 130 549 139 533 270 082
1976 24 985 4 631 374 17 357 3 235 4 481 42 918 16 710 114 691 154 595 269 286
1977 19 285 2 976 638 24 951 723 41 052 268 16 460 106 353 179 233 285 586
1978 17 536 3 897 21 172 33 168 14 218 383 7 410 97 784 186 451 284 235
1979 7 262 1 346 2 788 30 877 1 232 33 591 323 14 033 5 587 97 039 211 648 308 687
1980 205 3 088 1 902 34 660 878 415 26 313 823 15 810 3 966 88 060 211 945 300 005
1981 1 743 26 120 1 403 594 21 895 5 045 9 786 8 341 6 022 80 949 195 152 276 101
1982 1 502 45 8 545 217 675 18 226 3 713 9 177 8 610 3 160 53 870 182 291 236 161
1983 6 897 452 982 836 2 321 8 861 2 771 2 635 9 014 4 553 39 322 184 272 223 594
1984 1 342 827 3 713 11 913 5 614 2 465 7 107 5 820 38 801 187 009 225 810
1985 1 717 908 2 803 10 050 14 449 3 605 5 074 6 421 45 027 173 625 218 652
1986 4 817 3 914 6 442 6 494 2 847 24 016 3 783 2 887 1 176 56 376 157 985 214 361
1987 3 641 1 599 2 375 6 427 5 637 2 098 32 359 2 627 2 771 4 775 64 309 159 891 224 200
1988 1 733 236 5 214 6 643 4 679 3 842 40 177 2 172 1 686 4 748 71 130 163 767 234 897
1989 2 762 2 130 6 052 9 715 5 208 11 675 31 684 4 150 1 791 2 221 77 388 163 135 240 523
1990 1 723 9 914 7 807 4 590 18 822 33 505 2 829 1 973 4 074 85 237 161 760 246 997
1991 256 11 571 8 349 5 689 23 912 30 345 651 2 379 3 265 86 417 144 707 231 124
1992 1 264 12 066 8 312 4 886 23 593 23 774 825 4 920 1 903 81 543 140 928 222 471
1993 4 541 61 11 110 13 112 4 864 17 393 28 388 284 4 681 9 754 94 188 142 238 236 426
1994 1 667 1 443 12 648 11 158 8 232 23 516 29 731 980 3 137 6 366 98 878 146 438 245 316
1995 1 962 9 263 9 196 11 310 24 662 24 823 151 1 825 10 683 93 875 146 301 240 176
1996 6 044 11 675 4 818 8 304 28 780 27 335 3 945 3 242 14 709 108 852 144 688 253 540
1997 5 190 2 225 11 830 3 668 14 855 32 820 23 531 10 375 5 038 11 537 121 069 143 125 264 194
1998 2 157 70 13 343 3 680 16 478 31 980 19 177 14 550 5 082 15 915 122 432 139 031 261 463
1999 4 363 9 826 4 110 16 271 41 303 26 804 8 643 3 803 15 514 130 637 134 942 265 579
2000 7 502 9 229 4 634 14 484 42 145 42 553 3 718 4 236 16 805 145 306 129 855 275 161
2001 12 292 9 061 2 606 12 840 38 969 45 039 4 983 3 823 17 008 146 621 135 777 282 398
2002 14 043 8 732 19 211 2 831 10 045 39 952 34 640 2 075 3 734 9 222 144 484 144 929 289 413
2003 12 093 9 500 24 834 5 034 4 206 41 934 27 455 2 174 4 309 17 174 148 713 147 535 296 248
2004 11 290 10 910 27 163 4 200 7 537 42 450 26 017 4 994 3 768 11 008 149 337 154 580 303 917
2005 9 594 12 018 27 587 3 906 8 319 37 835 25 884 6 176 6 414 17 946 155 681 146 943 302 624
2006 10 883 10 826 28 840 5 211 4 843 29 218 23 210 6 004 5 777 18 936 143 748 148 336 292 084
2007 9 999 10 893 29 416 3 514 5 546 28 096 25 022 6 253 3 688 21 854 144 280 158 210 302 490
2008 9 586 10 443 31 489 4 019 4 612 24 089 20 611 10 076 4 137 24 088 143 149 148 575 291 724
2009 8 539 10 010 23 890 2 880 5 959 19 497 14 390 12 616 2 870 40 077 140 728 146 335 287 063
2010 10 283 11 039 19 155 8 576 3 590 11 843 15 946 7 486 4 028 38 345 130 292 159 418 289 709
April 2017 Table 7.2

OIL IMPORTS & REFINERY RECEIPTS* - CANADA
1947 - 2016Cubic Metres Per Day
Received From
Middle East
Iran/ Saudi Total
Iran Iraq Iraq Kuwait Arabi Libya Algeria Nigeria Venezuela Norway U.K. U.S. Mexico Other** Imported Canada TOTAL
2011 10 254 10 767 22 269 9 505 1 170 13 119 7 464 8 290 3 419 34 877 121 133 157 520 278 654
2012 16 155 10 047 23 741 7 719 747 11 968 3 168 10 801 3 336 33 613 121 296 164 086 285 382
2013 13 175 454 11 050 13 757 4 412 1 337 12 093 4 511 21 591 3 851 24 025 110 258 170 167 280 425
2014 7 677 11 641 5 380 1 650 5 393 940 54 007 3 268 11 246 101 202 169 812 271 014
2015 13 353 6 301 6 516 288 6 220 260 75 179 12 624 120 741 170 754 291 496
2016 13 784 13 476 11 717 6 652 1 568 65 631 8 071 120 899 161 711 282 609
* Includes crude oil, condensate and pentanes plus.
** Includes Middle East imports not elsewhere specified and others.
April 2017 Table 7.2

No. M³/CD No. M³/CD No. M³/CD No. M³/CD No. M³/CD No. M³/CD No. M³/CD No. M³/CD No. M³/CD No. M³/CD No. M³/CD No. M³/CD
1947 1 5 400 1 50 4 11 600 6 13 980 3 720 7 3 120 6 3 380 3 3 540 1 180 32 41 970
1948 1 3 970 1 50 4 17 000 6 14 100 3 720 7 3 120 7 5 680 3 4 240 1 180 33 49 060
1949 1 3 500 1 50 4 19 710 5 13 300 3 1 160 7 4 260 7 6 860 3 4 240 1 180 32 53 260
1950 1 3 500 1 50 4 22 720 4 11 950 3 1 240 7 4 750 7 7 450 3 4 580 1 200 31 56 440
1951 1 3 500 1 50 4 25 430 4 12 620 4 3 180 7 5 430 11 9 800 3 4 580 1 200 36 64 790
1952 1 2 860 1 50 4 26 060 5 16 610 4 3 180 7 6 960 12 10 810 3 4 580 1 200 38 71 310
1953 1 2 860 1 50 4 27 970 6 21 450 4 3 180 9 8 150 10 10 990 3 4 580 1 200 39 79 430
1954 1 2 860 1 50 4 27 970 6 22 610 4 3 180 9 10 300 10 10 990 4 8 820 1 200 40 86 980
1955 1 2 860 1 50 5 33 370 6 23 650 4 4 740 9 10 540 10 12 320 5 10 570 1 200 42 98 300
1956 1 6 670 1 50 5 39 250 6 26 140 4 5 100 9 11 010 11 13 330 5 10 960 1 200 43 112 710
1957 1 6 990 1 50 5 40 590 6 31 540 4 5 560 9 11 040 11 13 620 5 11 840 1 210 43 121 440
1958 1 7 790 1 50 5 43 030 7 37 820 4 5 560 9 11 040 11 13 670 6 15 450 1 210 45 134 620
1959 1 7 790 1 50 5 43 030 7 42 110 4 5 560 7 10 580 11 13 670 6 15 450 1 210 43 138 450
1960 1 7 790 2 6 400 6 46 710 7 42 540 4 5 400 6 9 980 11 15 650 6 15 450 1 240 44 150 160
1961 1 1 350 1 7 790 2 6 400 6 46 960 7 42 540 3 5 990 6 11 200 10 14 410 6 15 540 1 240 43 152 420
1962 1 1 350 1 7 950 2 7 990 6 48 390 8 49 970 3 5 990 6 11 240 10 15 120 6 15 570 1 240 44 163 810
1963 1 1 350 1 7 950 2 7 990 6 48 630 8 48 700 3 6 260 6 11 240 7 13 580 6 15 580 1 240 41 161 520
1964 1 1 350 2 11 440 1 7 950 6 51 120 7 48 130 3 6 500 6 11 280 7 13 780 6 16 210 1 300 40 168 060
1965 1 1 350 2 11 440 1 7 950 6 52 710 7 50 920 3 6 530 6 11 070 7 14 780 6 16 110 1 300 40 173 160
1966 1 1 350 2 11 440 1 7 950 6 58 990 7 51 230 3 6 800 6 12 010 7 15 140 6 16 110 1 300 40 181 320
1967 1 1 830 2 10 250 1 7 950 6 58 590 7 55 680 3 6 960 6 12 010 8 25 900 7 17 440 1 300 42 196 910
1968 1 2 070 2 11 140 1 7 950 6 62 440 7 56 640 3 6 960 6 12 200 8 26 220 7 17 590 1 300 42 203 510
1969 1 2 070 2 11 140 1 7 950 6 69 750 7 58 650 2 7 340 6 12 200 8 26 540 7 17 790 1 300 41 213 730
1970 1 2 070 2 12 080 1 7 950 6 71 680 7 59 830 2 7 470 6 12 770 8 27 810 7 19 930 1 430 41 222 020
1971 1 2 070 3 24 960 1 19 070 7 88 930 7 61 530 2 7 710 5 10 900 7 27 041 7 19 930 1 440 41 262 581 1 10 329
1972 1 2 220 3 24 960 1 19 070 7 90 990 7 64 230 2 7 710 4 10 580 7 27 041 7 20 490 1 440 40 267 731 1 10 329
1973 2 18 910 3 28 600 1 19 070 7 92 100 7 65 820 2 7 790 4 11 380 7 28 091 7 21 280 1 460 41 293 501 1 10 329
1974 2 18 910 3 28 890 1 18 120 7 102 510 7 82 740 2 7 690 4 12 470 7 28 411 7 23 230 1 460 41 323 431 1 10 329
1975 2 18 910 3 28 890 1 18 120 7 102 510 7 85 540 1 4 770 3 7 600 6 41 551 7 23 850 1 440 38 332 181 1 10 329
1976 1 2 220 3 29 240 1 39 730 7 102 780 7 87 100 1 4 770 2 6 560 6 42 905 7 26 040 1 480 36 341 825 1 7 945
1977 1 2 220 3 29 380 1 39 730 7 102 780 7 86 140 1 4 770 2 6 560 6 44 015 7 26 220 1 480 36 342 295 1 7 945
1978 1 2 220 3 29 380 1 39 730 7 98 400 8 102 080 1 4 770 2 7 830 6 40 650 7 26 860 1 480 37 352 400 1 11 920
1979 1 2 220 3 29 390 1 39 730 7 98 285 8 101 116 1 4 770 2 7 830 6 44 526 7 26 460 1 460 37 354 787 2 25 260
1980 1 2 220 2 16 180 1 39 730 7 98 545 8 101 066 1 4 770 2 7 830 6 45 311 7 26 490 1 460 36 342 602 2 34 410
1981 1 2 220 2 16 180 1 39 730 7 97 895 8 100 216 1 4 600 2 7 830 6 46 011 7 28 330 1 460 36 343 472 2 34 490
1982 1 2 220 2 16 580 1 39 730 6 84 820 7 92 274 1 4 770 2 8 610 7 55 186 7 28 060 1 460 35 332 710 2 35 680
1983 - - 2 16 580 1 39 730 4 61 420 6 82 944 2 8 610 6 60 796 6 27 260 1 500 28 297 840 2 34 500
1984 - - 2 16 280 1 39 730 4 61 520 6 82 544 2 8 610 6 64 345 6 27 260 1 500 28 300 789 2 36 000
1985 - - 2 16 280 1 39 730 4 61 520 6 82 544 2 8 610 6 62 445 6 27 260 1 500 28 298 889 2 36 000
1986 - - 2 16 280 1 39 730 3 49 350 6 79 434 2 8 610 6 62 345 6 26 950 1 500 27 283 199 2 36 000
1987 1 15 900 2 16 280 1 39 730 3 49 350 6 79 334 2 8 610 6 62 345 6 27 160 1 600 28 299 309 2 38 700
1988 1 15 890 2 16 280 1 39 730 3 49 350 6 76 394 2 9 295 6 61 455 6 24 790 1 600 28 293 784 2 43 980
1989 1 17 490 2 16 280 1 39 730 3 49 450 6 78 474 2 9 295 6 62 648 6 25 760 1 600 28 299 727 2 43 980
1990 1 17 490 2 16 280 1 39 730 3 52 078 6 80 288 2 9 725 6 63 220 6 25 766 1 600 28 305 177 2 43 980
1991 1 17 490 2 16 280 1 39 730 3 52 078 6 80 098 2 9 725 6 63 237 5 23 324 1 600 27 302 562 2 43 980
1992 1 16 620 2 16 511 1 39 730 3 52 853 6 80 588 2 9 725 5 61 855 5 25 376 1 600 26 303 858 2 46 400
1993 1 16 620 2 16 598 1 39 730 3 55 238 5 73 988 2 9 725 5 61 855 3 15 654 1 600 23 290 008 2 48 600
1994 1 16 620 1 13 100 1 39 730 3 57 710 5 74 060 2 9 725 5 63 220 3 16 450 1 600 22 291 215 2 50 100
1995 1 15 850 1 13 100 1 39 730 3 58 010 5 74 060 2 10 865 5 63 220 2 9 450 1 600 21 284 885 2 53 450
1996 1 16 700 1 13 410 1 39 730 3 59 210 5 73 920 2 10 800 5 64 060 2 9 450 20 287 280 2 53 945
1997 1 16 700 1 13 410 1 39 730 3 58 710 5 73 920 2 10 800 5 65 180 2 9 450 20 287 900 2 64 445
1998 1 16 700 1 13 355 1 39 730 3 61 210 5 74 320 2 10 475 5 67 705 2 9 750 20 293 245 2 64 445
1999 1 16 700 1 13 355 1 39 730 3 62 785 5 74 955 2 10 475 5 68 055 2 9 850 20 295 905 2 66 000
2000 1 16 700 1 13 355 1 39 730 3 62 785 5 74 760 2 10 475 5 68 055 2 9 950 20 295 810 2 66 000
2001 1 16 700 1 13 355 1 39 730 3 71 540 5 74 060 2 10 475 5 69 015 2 9 950 20 304 825 2 91 800
2002 1 16 700 1 13 355 1 39 730 3 71 590 5 74 060 2 10 475 5 69 815 2 9 950 20 305 675 2 91 800
2003 1 16 700 1 13 100 1 39 730 3 71 590 5 74 760 2 15 265 5 70 275 2 9 975 20 311 395 3 116 445
2004 1 16 700 1 13 100 1 39 730 3 71 590 5 67 865 2 15 265 5 70 275 2 9 975 20 304 500 3 116 445
2005 1 16 700 1 13 100 1 39 730 3 75 525 4 60 860 2 15 265 5 70 275 2 9 975 19 301 430 3 123 945
British Columbia
Northwest
Territories CANADA
Alberta Oil Sands
Upgrader **
REFINERY CRUDE OIL AND OIL SANDS MINING UPGRADER CAPACITY - CANADA
1947 - 2016
Newfoundland Nova Scotia New Brunswick Quebec Ontario * Manitoba Saskatchewan Alberta
April 2017 Table 7.3

No. M³/CD No. M³/CD No. M³/CD No. M³/CD No. M³/CD No. M³/CD No. M³/CD No. M³/CD No. M³/CD No. M³/CD No. M³/CD No. M³/CD
British Columbia
Northwest
Territories CANADA
Alberta Oil Sands
Upgrader **
REFINERY CRUDE OIL AND OIL SANDS MINING UPGRADER CAPACITY - CANADA
1947 - 2016
Newfoundland Nova Scotia New Brunswick Quebec Ontario * Manitoba Saskatchewan Alberta
2006 1 18 275 1 13 100 1 39 730 3 75 526 4 60 860 2 16 595 5 70 275 2 9 975 19 304 336 3 150 045
2007 1 18 275 1 13 100 1 39 730 3 74 816 4 59 566 2 17 325 5 70 275 2 10 050 19 303 137 3 150 045
2008 1 18 275 1 13 060 1 39 730 3 81 970 4 59 566 2 17 325 5 70 275 2 10 050 19 310 251 4 189 595
2009 1 18 275 1 13 037 1 39 730 3 81 970 4 61 989 2 17 325 5 71 797 2 10 050 19 314 173 4 189 595
2010 1 18 275 1 13 280 1 47 500 2 63 106 4 62 501 2 17 325 5 72 135 2 10 050 18 304 172 4 189 595
2011 1 18 275 1 13 514 1 47 500 2 58 330 4 62 195 3 34 375 4 73 599 2 10 908 18 318 696 4 189 595
2012 1 18 275 1 13 514 1 47 500 2 58 330 4 62 720 3 37 375 4 71 714 2 10 908 18 320 336 4 205 491
2013 1 18 275 1 47 500 2 58 330 4 62 720 3 36 182 4 73 142 2 10 608 17 306 757 4 203 147
2014 1 18 275 1 47 500 2 58 330 4 62 720 3 36 182 4 73 142 2 10 608 17 306 757 4 203 147
2015 1 18 275 1 47 500 2 58 330 4 62 720 3 36 396 4 73 142 2 10 608 17 306 971 4 203 147
2016 1 18 275 1 47 500 2 58 330 4 62 719 3 36 543 4 73 460 2 10 608 17 307 435 4 215 073
*** ***
* Excludes crude distillation associated with the Polysar petrochemical complex.
** Represents oil sands facilities. Crude capacity is bitumen to upgrader.
*** The Husky Heavy Oil Upgrader is located in Saskatchewan. Historically it had been counted as an Alberta refinery.
April 2017 Table 7.3
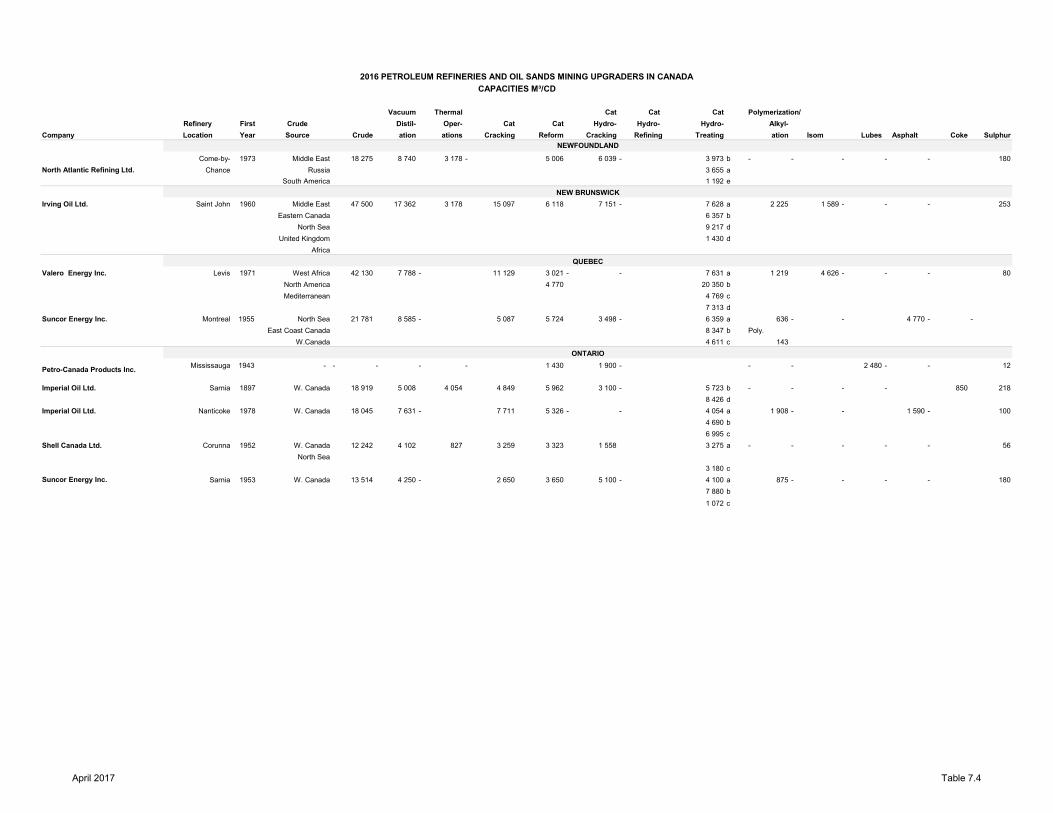
Vacuum Thermal Cat Cat Cat Polymerization/
Refinery First Crude Distil- Oper- Cat Cat Hydro- Hydro- Hydro- Alkyl-
Company Location Year Source Crude ation ations Cracking Reform Cracking Refining Treating ation Isom Lubes Asphalt Coke Sulphur
Come-by- 1973 Middle East 18 275 8 740 3 178 - 5 006 6 039 - 3 973 b - - - - - 180
Chance Russia 3 655 a
South America 1 192 e
Irving Oil Ltd. Saint John 1960 Middle East 47 500 17 362 3 178 15 097 6 118 7 151 - 7 628 a 2 225 1 589 - - - 253
Eastern Canada 6 357 b
North Sea 9 217 d
United Kingdom 1 430 d
Africa
Valero Energy Inc. Levis 1971 West Africa 42 130 7 788 - 11 129 3 021 - - 7 631 a 1 219 4 626 - - - 80
North America 4 770 20 350 b
Mediterranean 4 769 c
7 313 d
Suncor Energy Inc. Montreal 1955 North Sea 21 781 8 585 - 5 087 5 724 3 498 - 6 359 a 636 - - 4 770 - -
East Coast Canada 8 347 b Poly.
W.Canada 4 611 c 143
Mississauga 1943 - - - - - 1 430 1 900 - - - 2 480 - - 12
Imperial Oil Ltd. Sarnia 1897 W. Canada 18 919 5 008 4 054 4 849 5 962 3 100 - 5 723 b - - - - 850 218
8 426 d
Imperial Oil Ltd. Nanticoke 1978 W. Canada 18 045 7 631 - 7 711 5 326 - - 4 054 a 1 908 - - 1 590 - 100
4 690 b
6 995 c
Shell Canada Ltd. Corunna 1952 W. Canada 12 242 4 102 827 3 259 3 323 1 558 3 275 a - - - - - 56
North Sea
3 180 c
Suncor Energy Inc. Sarnia 1953 W. Canada 13 514 4 250 - 2 650 3 650 5 100 - 4 100 a 875 - - - - 180
7 880 b
1 072 c
2016 PETROLEUM REFINERIES AND OIL SANDS MINING UPGRADERS IN CANADA
CAPACITIES M³/CD
North Atlantic Refining Ltd.
Petro-Canada Products Inc.
QUEBEC
ONTARIO
NEW BRUNSWICK
NEWFOUNDLAND
April 2017 Table 7.4

Vacuum Thermal Cat Cat Cat Polymerization/
Refinery First Crude Distil- Oper- Cat Cat Hydro- Hydro- Hydro- Alkyl-
Company Location Year Source Crude ation ations Cracking Reform Cracking Refining Treating ation Isom Lubes Asphalt Coke Sulphur
2016 PETROLEUM REFINERIES AND OIL SANDS MINING UPGRADERS IN CANADA
CAPACITIES M³/CD
Regina 1935 W. Canada 21 500 6 000 1 430 7 600 1 550 4 100 5 300 *** 2 200 a - 635 - 700 385 420
2 000 b (Polymerization 1400)
1 300 c
5 600 f
Husky Energy Lloydminster 1992 W. Canada 12 360 4 400 3 000 6 240 10 680 1 000 380
Hvy Oil Upgrader 36 543
Moose Jaw Refinery Moose Jaw 1934 W.Canada 2 683 1 541 - - - - - - - - - 1 142 - -
Shell Canada Ltd.** Scotford 2003 W. Canada 38 197 32 529 20 966 a 6 480 - - - - - - -
Fort McMurray 1967 W. Canada 69 600 65 000 41 700 - - - 9 600 b - - - - - 13 500 1 800
11 900 c
11 500 d
Fort McMurray 1978 W. Canada 73 900 45 300 46 100 - - 8 300 13 600 c - - - - - 8 900 2 700
29 400 b
23 800 d
Fort McMurray 2008 W. Canada 33 376
Husky Energy Lloydminster 1947 W. Canada 4 620 3 590 - - Other units shut down 1971-07-01 - - - - 2 495 - -
Suncor Energy Inc. Edmonton 1971 W. Canada 22 576 7 552 2 719 6 495 1 860 3 402 - 5 310 a 2 337 - - - 127 370
9 969 b
2 258 d
5 739 f - -
Imperial Oil Ltd. Strathcona 1974 W. Canada 30 366 11 049 - 10 413 3 339 - - 8 267 a 2 464 1 033 318 1 749 - 49
12 798 b
- 4 849 c
Shell Canada Ltd. Scotford 1984 W. Canada 15 898 - - - 5 520 11 040 - 5 280 a - - - - 325
8 160 b
Chevron Canada Ltd. North Burnaby 1936 W. Canada 8 700 1 900 - 2 800 1 550 - - 2 300 a 450 1 550 - 350 - 17
2 650 b
2 250 c
Husky Energy Prince George 1967 W. Canada 1 908 600 - 540 280 - - 1 725 abc - 150 - - - 6
LEGEND: a = Pretreating reformer feeds; b = Distillate; c = Naphtha; d = Misc.; f = desulphurization **Bitumen to upgrader *Coker Charge ***Atmospheric Residual Desulphurization
(1) Total Naphtha Hydrotreating (810) includes 400 for Isom FD.
BRITISH COLUMBIA
Canadian Natural Resources Ltd.** Not available
ALBERTA
SASKATCHEWAN
Consumers' Co-op Refineries Ltd.
Suncor Oil Sands Group**
Syncrude Canada Ltd.**
April 2017 Table 7.4

Table 7.5
Year of
Closure Company Location First Year of Operation
Crude Oil
Capacity M³/D
1970 Husky Oil Ltd. Moose Jaw, Saskatchewan 1954 560
1971 Gulf Oil Canada Ltd. Saskatoon, Saskatchewan 1933 1 180
1971 Gulf Oil Canada Ltd. Edmonton, Alberta 1951 2 000
1975 Imperial Oil Edmonton, Alberta 1948 6 000
1975 Imperial Oil Winnipeg, Manitoba 1951 3 400
1975 Imperial Oil Regina, Saskatchewan 1916 4 880
1975 Imperial Oil Calgary, Alberta 1923 3 370
1976 Petro-Canda Products Inc.* Come-By-Chance, Newfoundland 1973 15 900
1976 Northern Petro Div Cdn Propane Gas & Oil Kamsack, Saskatchewan 1936 1 670
1978 Texaco Canada Inc. Port Credit, Ontario 1938 1 200
1980 Gulf Canada Ltd. Point Tupper, Nova Scotia 1971 12 870
1982 Texaco Canada Inc. Montreal, Quebec 1927 11 840
1983 Petro-Canda Products Inc. Montreal, Quebec 1960 11 280
1983 Gulf Canada Ltd. Calgary, Alberta 1939 2 050
1983 Gulf Canada Ltd. Kamloops, British Columbia 1954 1 510
1983 Imperial Oil Ltd. Montreal, Quebec 1916 13 200
1983 Shell Canada Ltd. St. Boniface, Manitoba 1927 4 770
1983 Shell Canada Ltd. Oakville, Ontario 1963 7 000
1983 Ultramar Canada Inc. Holyrood, Newfoundland 1961 2 220
1984 Texaco Canada Inc. Edmonton, Alberta 1951 4 451
1986 Gulf Canada Ltd. ** Montreal, Quebec 1931 11 770
1991 Petro-Canada Products Taylor, British Columbia 1960 2 460
1992 Turbo Resources (Pay Less Holdings) Balzac, Alberta 1982 4 565
1993 Petro-Canada Port Moody, British Columbia*** 1958 5 902
1993 Petro-Canada Mississauga, Ontario*** 1943 6 600
1993 Shell Canada Ltd. N. Burnaby, British Columbia 1932 3 820
1994 Ultramar Canada Inc. Halifax, Nova Scotia 1963 3 498
1995 Imperial Oil Ltd. Port Moody, British Columbia 1915 7 000
1996 Imperial Oil Ltd. Norman Wells, Northwest Territories 1921 600
2005 Petro-Canada Products Oakville, Ontario*** 1958 13 200
2010 Shell Canada Products Montreal, Quebec*** 1933 20 000
2012 Parkland Refining Ltd. Bowden, Alberta *** 1960 1 033
2013 Imperial Oil Ltd. Dartmouth, Nova Scotia 1918 13 514
*Re-opened in 1987 as Newfoundland Processing Ltd. Renamed to North Atlantic Refining Ltd. Currently owned by KNOC (Dec '09).
**Re-opened as Kemtec Inc. with no crude capacity.
***Terminal Facility
REFINERY/UPGRADER CLOSURES - CANADA
1970 - 2016
March 2017

Table 7.6
Canada
1947 80
1948 77
1949 79
1950 84
1951 86
1952 85
1953 85
1954 85
1955 86
1956 88
1957 86
1958 78
1959 84
1960 81
1961 85
1962 82
1963 89
1964 88
1965 89
1966 91
1967 86
1968 93
1969 92
1970 95
1971 83
1972 89
1973 91
1974 88
1975 82
1976 77
1977 75
1978 75
1979 83
1980 84
1981 79
1982 70
1983 77
REFINERY UTILIZATION RATE - CANADA
May 2017
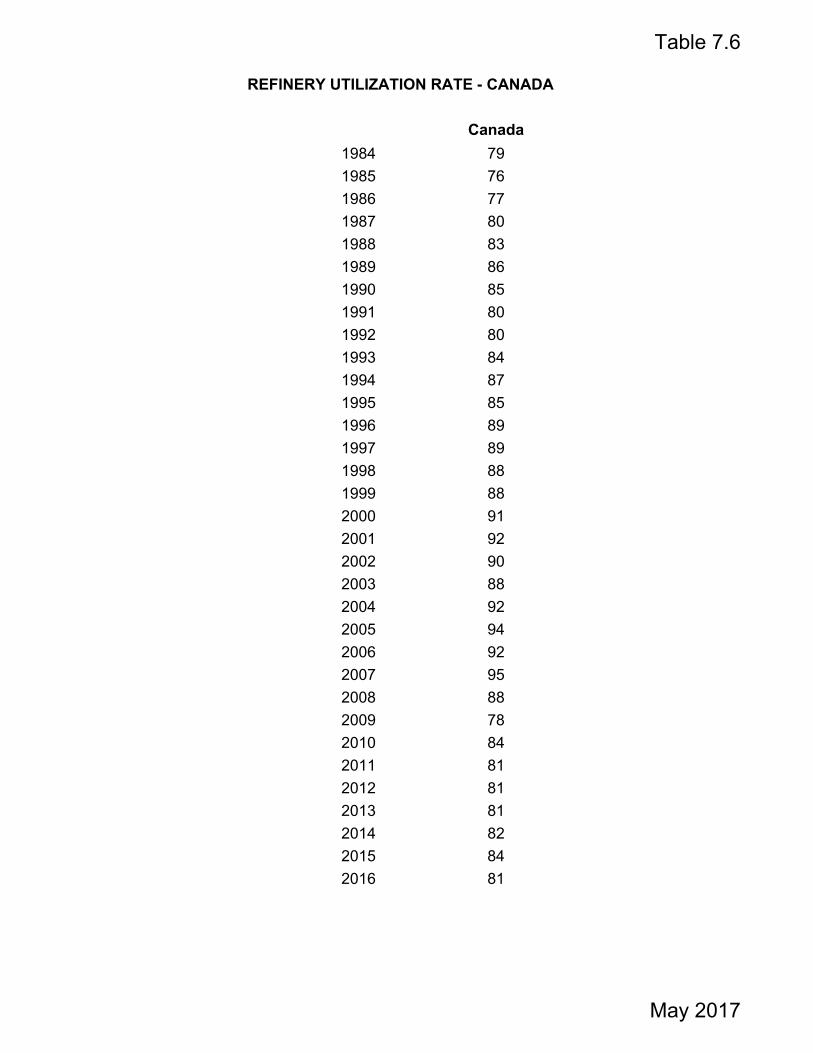
Table 7.6
Canada
REFINERY UTILIZATION RATE - CANADA
1984 79
1985 76
1986 77
1987 80
1988 83
1989 86
1990 85
1991 80
1992 80
1993 84
1994 87
1995 85
1996 89
1997 89
1998 88
1999 88
2000 91
2001 92
2002 90
2003 88
2004 92
2005 94
2006 92
2007 95
2008 88
2009 78
2010 84
2011 81
2012 81
2013 81
2014 82
2015 84
2016 81
May 2017

Table 7.7
Motor Heavy Fuel Oil Light Fuel Oil Diesel Fuel Petro-Chem Aviation
Gasoline (NOS. 4-6) (NOS. 2&3) Oil Feedstock Fuel(1) Others Total
1952 42.0 19.9 11.1 7.1 0.6 1.1 18.2 100
1955 39.6 20.1 16.6 6.8 1.0 1.7 14.2 100
1960 36.2 16.5 19.9 8.4 2.2 2.1 14.7 100
1965 36.1 17.1 19.9 8.6 2.8 2.3 13.2 100
1967 36.0 17.3 15.8 11.4 1.9 2.7 14.9 100
1968 35.6 17.8 15.9 11.6 1.7 2.7 14.7 100
1969 35.8 17.9 15.8 11.5 1.9 2.9 14.2 100
1970 35.1 18.2 15.6 11.8 2.1 3.3 13.9 100
1971 32.8 20.5 15.5 11.9 2.1 3.4 13.8 100
1972 33.0 22.0 14.9 11.5 2.4 3.4 12.8 100
1973 32.9 21.4 15.0 11.4 2.0 3.7 13.6 100
1974 32.9 21.5 14.4 11.2 1.6 3.9 14.5 100
1975 35.4 20.2 13.4 11.6 1.4 4.2 13.8 100
1976 35.7 18.6 13.5 12.2 2.1 4.3 13.6 100
1977 34.3 19.1 13.2 12.6 3.6 4.1 13.1 100
1978 34.8 18.2 12.4 12.9 4.7 4.5 12.5 100
1979 35.0 17.6 14.6 13.2 4.7 4.5 10.4 100
1980 36.1 16.4 14.5 13.6 4.6 4.6 10.2 100
1981 37.4 15.7 12.6 14.1 5.0 4.7 10.5 100
1982 39.5 13.6 12.1 14.6 5.3 4.8 10.1 100
1983 39.3 11.1 10.5 16.1 5.1 4.8 13.1 100
1984 40.9 10.7 10.3 18.8 4.9 4.9 9.5 100
1985 37.3 8.1 8.3 17.4 5.1 5.3 18.5 100
1986 37.1 7.7 9.5 16.6 6.0 5.6 17.5 100
1987 36.6 7.7 8.5 17.3 4.5 5.9 19.5 100
1988 36.5 8.3 7.6 18.5 4.3 5.5 19.3 100
1989 35.4 8.4 7.7 18.2 4.5 5.6 20.2 100
1990 35.1 8.5 7.6 18.5 5.1 5.5 19.7 100
1991 35.5 8.1 7.9 18.1 5.4 4.9 20.1 100
1992 35.8 7.6 8.2 17.3 5.5 4.8 20.8 100
1993 36.6 7.2 10.4 16.4 4.8 4.3 20.3 100
1994 36.9 6.5 9.6 17.7 4.5 4.2 20.6 100
1995 37.4 6.2 9.4 17.4 5.2 4.5 19.9 100
1996 36.9 6.3 9.9 18.0 5.0 4.9 19.0 100
1997 35.9 6.6 8.5 19.4 4.7 5.2 19.7 100
1998 35.7 7.0 7.2 19.8 5.3 5.3 19.5 100
1999 37.3 6.1 7.3 21.0 3.5 5.4 19.4 100
2000 37.5 6.1 7.4 21.8 3.1 4.9 19.2 100
2001 38.0 6.7 8.0 18.3 5.9 4.6 18.6 100
2002 38.6 6.1 7.4 21.1 3.1 4.1 19.5 100
2003 37.1 6.8 7.5 21.8 3.1 4.2 19.4 100
2004 35.9 7.3 7.1 22.2 3.0 4.6 20.0 100
2005 36.1 7.1 7.2 22.2 3.3 4.5 19.6 100
2006 35.1 6.8 6.9 22.9 3.2 4.0 21.1 100
2007 36.1 7.2 7.0 22.6 3.1 4.1 20.0 100
2008 34.7 7.0 7.3 23.1 3.0 4.4 20.4 100
2009 36.4 5.8 7.4 23.6 2.7 4.3 19.8 100
2010 35.7 6.0 6.8 23.9 4.6 4.2 18.8 100
2011 35.1 6.3 7.8 23.9 4.1 3.7 19.1 100
2012 35.5 6.8 6.7 25.8 4.2 4.2 16.8 100
2013 35.4 6.6 7.3 25.6 3.7 4.5 16.9 100
2014* 36.7 6.1 na 26.8 4.3 5.0 21.1 100
2015* 38.2 4.6 na 26.2 4.5 4.9 21.6 100
2016* 39.7 4.0 na 25.6 4.8 5.2 20.7 100
(1) Includes aviation gasoline and turbo fuel - kero & naptha type.
* Statistics Canada data supression
YIELDS OF REFINED PETROLEUM PRODUCTS IN CANADA
1952 - 2016
Percent
May 2017

CAPP Statistical Handbook
Section 8
Imports/Exports
Table Exports from Canada - Crude Oil & Equivalent & Natural Gas 1952 – Present ................................................................................................................................ 8.1 Canadian Exports of Energy Materials 1961 – Present ................................................................................................................................ 8.2 Canadian Imports of Energy Materials 1961 – Present ................................................................................................................................ 8.3 Note: Refer to Section 7 Table 7.2 for imports by country


Table 8.1
Total Daily Average Million Dollars Total Daily Average Million Dollars
1952 226 1 225 1
1953 398 1 266 1
1954 373 1 198 1
1955 2 357 6 319 1
1956 6 818 19 304 1
1957 8 847 24 446 1
1958 5 034 14 2 464 7
1959 5 302 15 2 401 7
1960 6 712 18 2 579 7
1961 10 194 28 4 764 13
1962 14 553 40 9 053 25
1963 14 441 40 9 658 26
1964 16 091 44 11 448 31
1965 17 164 47 11 442 31
1966 19 656 54 12 074 33
1967 23 891 65 14 310 39
1968 26 616 73 16 944 46
1969 31 359 86 18 974 52
1970 38 280 105 21 759 60
1971 43 057 118 25 581 70
1972 54 228 149 28 528 78
1973 66 752 183 29 204 80
1974 52 990 145 27 215 75
1975 41 707 114 26 896 74
1976 29 030 80 27 026 74
1977 19 211 53 28 152 77
1978 15 570 43 25 002 68
1979 16 727 46 27 906 76
1980 12 426 34 22 563 62 4 036
1981 9 505 26 21 584 59 4 408
1982 12 164 33 22 197 61 4 809
1983 16 778 46 20 169 55 3 941
1984 20 873 57 21 402 59 3 818
1985 28 300 78 26 153 72 4 010
1986 33 957 93 21 090 58 2 566
1987 36 024 99 28 009 77 2 559
1988 41 284 113 35 913 98 2 959
1989 37 548 103 4 462 37 903 104 3 023
1990 37 976 104 5 532 40 689 111 3 267
1991 44 240 121 6 042 47 688 131 3 590
1992 48 725 133 6 679 57 897 158 4 730
1993 53 285 146 6 904 63 017 173 5 903
1994 57 001 156 7 426 71 403 196 6 428
1995 61 374 168 9 756 79 150 217 5 649
1996 65 258 178 11 078 80 117 219 7 433
1997 70 711 194 11 418 81 795 224 8 626
EXPORTS FROM CANADA
1952 - 2016
NATURAL GAS
Million Cubic Metres
at 101.325 kPa and 15°C
CRUDE OIL &
EQUIVALENT
Thousand Cubic Metres
April 2017

Table 8.1
Total Daily Average Million Dollars Total Daily Average Million Dollars
EXPORTS FROM CANADA
1952 - 2016
NATURAL GAS
Million Cubic Metres
at 101.325 kPa and 15°C
CRUDE OIL &
EQUIVALENT
Thousand Cubic Metres
1998 77 376 212 8 767 89 164 244 8 967
1999 72 824 200 10 121 95 121 261 10 951
2000 80 317 219 19 332 101 246 277 20 554
2001 79 571 218 16 083 108 240 297 25 595
2002 84 917 233 18 015 107 728 295 18 359
2003 89 512 245 20 514 101 472 278 26 084
2004 94 150 257 25 174 105 261 288 27 039
2005 91 642 251 29 994 106 271 291 35 911
2006 102 771 282 37 942 102 102 280 27 798
2007 106 231 291 41 830 108 844 298 28 050
2008 108 693 298 67 439 103 983 285 32 575
2009 109 024 299 42 741 95 240 261 15 958
2010 110 833 304 51 899 95 589 262 15 619
2011 126 210 346 68 798 92 716 254 13 463
2012 136 972 374 74 735 88 290 241 8 858
2013 148 517 407 81 733 82 450 226 10 857
2014 167 102 458 97 449 78 169 214 16 020
2015 176 123 483 64 144 78 162 214 10 026
2016 176 862 483 52 353 81 825 224 8 662
* Includes exchanges with the United States.
April 2017
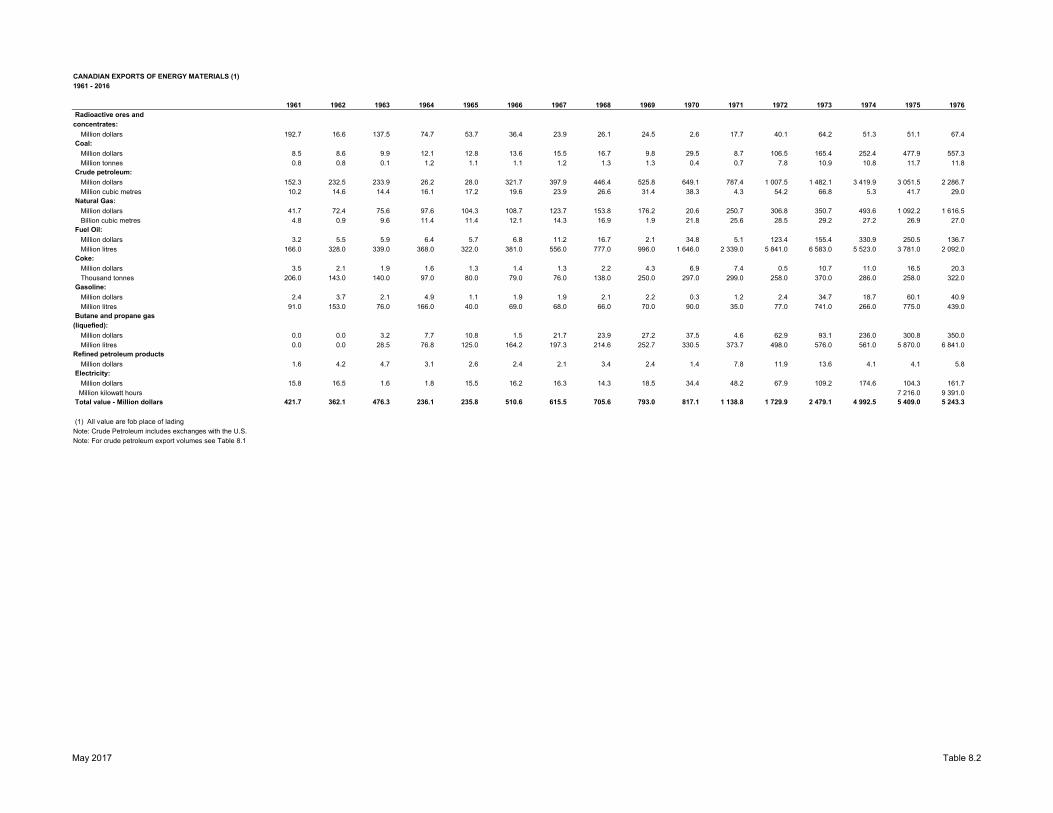
CANADIAN EXPORTS OF ENERGY MATERIALS (1)
1961 - 2016
1961 1962 1963 1964 1965 1966 1967 1968 1969 1970 1971 1972 1973 1974 1975 1976
Radioactive ores and
concentrates:
Million dollars 192.7 16.6 137.5 74.7 53.7 36.4 23.9 26.1 24.5 2.6 17.7 40.1 64.2 51.3 51.1 67.4
Coal:
Million dollars 8.5 8.6 9.9 12.1 12.8 13.6 15.5 16.7 9.8 29.5 8.7 106.5 165.4 252.4 477.9 557.3
Million tonnes 0.8 0.8 0.1 1.2 1.1 1.1 1.2 1.3 1.3 0.4 0.7 7.8 10.9 10.8 11.7 11.8
Crude petroleum:
Million dollars 152.3 232.5 233.9 26.2 28.0 321.7 397.9 446.4 525.8 649.1 787.4 1 007.5 1 482.1 3 419.9 3 051.5 2 286.7
Million cubic metres 10.2 14.6 14.4 16.1 17.2 19.6 23.9 26.6 31.4 38.3 4.3 54.2 66.8 5.3 41.7 29.0
Natural Gas:
Million dollars 41.7 72.4 75.6 97.6 104.3 108.7 123.7 153.8 176.2 20.6 250.7 306.8 350.7 493.6 1 092.2 1 616.5
Billion cubic metres 4.8 0.9 9.6 11.4 11.4 12.1 14.3 16.9 1.9 21.8 25.6 28.5 29.2 27.2 26.9 27.0
Fuel Oil:
Million dollars 3.2 5.5 5.9 6.4 5.7 6.8 11.2 16.7 2.1 34.8 5.1 123.4 155.4 330.9 250.5 136.7
Million litres 166.0 328.0 339.0 368.0 322.0 381.0 556.0 777.0 996.0 1 646.0 2 339.0 5 841.0 6 583.0 5 523.0 3 781.0 2 092.0
Coke:
Million dollars 3.5 2.1 1.9 1.6 1.3 1.4 1.3 2.2 4.3 6.9 7.4 0.5 10.7 11.0 16.5 20.3
Thousand tonnes 206.0 143.0 140.0 97.0 80.0 79.0 76.0 138.0 250.0 297.0 299.0 258.0 370.0 286.0 258.0 322.0
Gasoline:
Million dollars 2.4 3.7 2.1 4.9 1.1 1.9 1.9 2.1 2.2 0.3 1.2 2.4 34.7 18.7 60.1 40.9
Million litres 91.0 153.0 76.0 166.0 40.0 69.0 68.0 66.0 70.0 90.0 35.0 77.0 741.0 266.0 775.0 439.0
Butane and propane gas
(liquefied):
Million dollars 0.0 0.0 3.2 7.7 10.8 1.5 21.7 23.9 27.2 37.5 4.6 62.9 93.1 236.0 300.8 350.0
Million litres 0.0 0.0 28.5 76.8 125.0 164.2 197.3 214.6 252.7 330.5 373.7 498.0 576.0 561.0 5 870.0 6 841.0
Refined petroleum products
Million dollars 1.6 4.2 4.7 3.1 2.6 2.4 2.1 3.4 2.4 1.4 7.8 11.9 13.6 4.1 4.1 5.8
Electricity:
Million dollars 15.8 16.5 1.6 1.8 15.5 16.2 16.3 14.3 18.5 34.4 48.2 67.9 109.2 174.6 104.3 161.7
Million kilowatt hours 7 216.0 9 391.0
Total value - Million dollars 421.7 362.1 476.3 236.1 235.8 510.6 615.5 705.6 793.0 817.1 1 138.8 1 729.9 2 479.1 4 992.5 5 409.0 5 243.3
(1) All value are fob place of lading
Note: Crude Petroleum includes exchanges with the U.S.
Note: For crude petroleum export volumes see Table 8.1
May 2017 Table 8.2

CANADIAN EXPORTS OF ENERGY MATERIALS (1)
1961 - 2016
Radioactive ores and
concentrates:
Million dollars
Coal:
Million dollars
Million tonnes
Crude petroleum:
Million dollars
Million cubic metres
Natural Gas:
Million dollars
Billion cubic metres
Fuel Oil:
Million dollars
Million litres
Coke:
Million dollars
Thousand tonnes
Gasoline:
Million dollars
Million litres
Butane and propane gas
(liquefied):
Million dollars
Million litres
Refined petroleum products
Million dollars
Electricity:
Million dollars
Million kilowatt hours
Total value - Million dollars
(1) All value are fob place of lading
Note: Crude Petroleum includes exchanges with the U.S.
Note: For crude petroleum export volumes see Table 8.1
1977 1978 1979 1980 1981 1982 1983 1984 1985 1986 1987 1988 1989 1990 1991 1992
75.4 207.2 378.9 230.7 179.4 358.6 62.6 333.7 231.9 166.8 278.1 671.1 581.6 405.3 396.6 462.6
596.4 690.2 731.7 793.6 1 036.7 1 176.3 1 232.0 1 820.5 1 996.4 1 851.0 1 670.0 1 935.1 2 077.2 2 110.3 2 044.3 1 677.6
12.1 13.7 13.9 14.3 16.3 15.5 17.0 24.4 27.6 25.9 25.5 29.5 31.8 32.0 32.4 26.1
1 750.6 1 572.7 2 404.6 2 899.1 2 505.0 2 728.0 3 456.9 4 404.2 5 916.5 3 774.0 4 855.1 4 010.3 4 462.0 5 532.0 6 042.0 6 679.0
19.2 15.6 16.7 12.4 9.0 12.0 16.8 20.9 27.5 33.6 35.8
2 028.1 2 190.3 2 889.1 3 983.9 4 370.1 4 754.7 3 847.5 3 923.0 3 912.2 2 482.9 2 527.3 2 959.1 3 016.9 3 278.7 3 581.1 4 729.6
28.2 25.0 27.9 22.8 21.7 22.1 19.3 21.4 25.3 20.9 27.7
113.3 414.7 931.1 1 042.7 970.6 636.7 937.3 1 140.4 1 155.3 801.6 950.8
1 457.0 4 232.0 4 654.0 4 273.0 3 847.0 2 722.0 3 826.0 4 425.0 4 669.0 4 731.0 5 712.0 7 577.9 7 416.8 8 016.5 8 903.4 7 617.5
27.9 27.8 29.7 46.3 44.2 28.5 10.0 15.0 19.6 13.7 18.7 13.6 11.6 20.5 6.3 12.3
356.0 352.0 354.0 470.0 393.0 236.0 106.0 171.0 215.0 155.0 205.0 234.3 142.4 140.5 49.7 94.0
38.9 117.8 207.6 197.5 185.3 170.3 339.0 429.2 663.5 380.4 357.8
388.0 972.0 913.0 706.0 601.0 536.0 1 240.0 1 584.0 2 375.0 2 046.0 2 022.0 3 355.3 2 901.7 3 868.5 4 673.6 4 204.3
448.3 391.5 524.8 698.7 938.7 1 094.8 1 051.0 1 105.9 991.2 685.9 663.2 584.8 491.6 667.9 729.5 702.8
7 452.0 5 752.0 7 789.0 6 443.0 7 005.0 8 086.0 6 546.0 7 166.0 6 323.0 5 646.0 6 492.0 6 972.0 6 216.0 6 016.0 7 073.0 5 915.0
11.7 57.5 189.1 332.9 492.5 591.3 466.8 485.0 495.2 206.7 198.0 1 642.8 1 862.9 2 651.2 2 640.8 2 199.7
377.0 478.9 729.2 773.0 1 122.6 1 119.6 1 228.4 1 377.8 1 408.1 1 079.7 1 199.8 897.8 661.5 538.3 556.8 714.0
16 715.0 20 640.0 30 645.0 28 323.0 33 986.0 33 211.0 36 742.0 37 323.0 41 370.0 34 998.0 45 318.0 30 441.0 18 459.0 16 231.0 19 784.0 26 217.0
5 467.6 6 148.6 9 015.8 10 998.4 11 845.1 12 658.8 12 631.5 15 034.7 16 789.9 11 442.7 12 718.8 12 714.6 13 165.3 15 204.2 15 997.4 17 177.6
May 2017 Table 8.2

CANADIAN EXPORTS OF ENERGY MATERIALS (1)
1961 - 2016
Radioactive ores and
concentrates:
Million dollars
Coal:
Million dollars
Million tonnes
Crude petroleum:
Million dollars
Million cubic metres
Natural Gas:
Million dollars
Billion cubic metres
Fuel Oil:
Million dollars
Million litres
Coke:
Million dollars
Thousand tonnes
Gasoline:
Million dollars
Million litres
Butane and propane gas
(liquefied):
Million dollars
Million litres
Refined petroleum products
Million dollars
Electricity:
Million dollars
Million kilowatt hours
Total value - Million dollars
(1) All value are fob place of lading
Note: Crude Petroleum includes exchanges with the U.S.
Note: For crude petroleum export volumes see Table 8.1
1993 1994 1995 1996 1997 1998 1999 2000 2001 2002 2003 2004 2005 2006 2007 2008
467.0 605.6 677.8 829.1 836.2 665.4 691.4 607.8 600.1 792.1 812.9 880.9 368.3 699.6 1 426.6 1 224.6
1 847.7 2 039.4 2 212.1 2 139.8 2 587.1 2 344.3 1 880.6 1 659.7 1 824.5 1 669.7 1 545.7 1 704.6 3 204.2 3 210.5 2 915.5 6 114.1
28.3 31.2 33.8 33.6 35.8 33.0 33.7 31.5 29.6 26.2 25.0 25.7 28.1 27.6 30.6 31.3
6 904.0 7 426.0 9 756.0 11 078.0 11 418.0 8 767.0 10 121.0 19 332.0 16 083.0 18 015.0 20 514.0 25 174.0 29 994.6 37 952.4 41 848.8 67 448.5
5 901.8 6 427.8 5 663.4 7 432.9 8 625.5 8 967.1 10 951.4 20 622.1 25 595.1 18 372.0 25 998.9 27 438.3 35 912.0 27 803.2 28 050.8 32 576.6
7 948.9 7 100.0 7 474.3 8 694.3 8 629.5 8 029.9 8 697.2 8 030.1 10 145.8 10 936.7 11 825.5 12 724.2 12 156.4 12 339.6 13 069.4 14 001.3
23.5 28.5 54.7 29.8 21.5 34.4 30.1 33.7 15.4 11.8 14.0 42.3 66.5 20.4 43.8 19.1
219.8 230.5 186.0 198.5 140.4 165.0 183.4 149.8 58.0 97.1 117.8 133.4 239.7 78.6 178.0 37.7
3 797.1 4 110.7 4 808.8 6 170.8 6 277.9 5 314.1 5 921.0 6 134.3 8 877.7 9 512.2 9 347.1 9 110.8 9 357.3 8 066.6 8 560.7 7 525.2
1 263.5 1 395.7 1 924.5 2 365.3 2 203.4 1 051.7 1 093.9 2 121.0 2 128.0 1 750.0 2 229.0 2 200.0 2 374.9 2 307.8 2 295.7 2 870.7
9 216.0 9 998.0 19 003.0 17 927.0 14 271.0 10 953.0 8 524.0 11 347.0 9 600.0 11 279.0 10 939.0 9 441.0 8 605.9 8 123.3 7 425.3 7 734.2
2 494.4 2 371.2 2 562.0 3 694.6 3 805.3 3 187.2 3 331.2 5 598.9 6 563.5 6 478.3 7 549.1 8 793.3 10 340.2 7 700.6 7 930.8 11 465.1
857.4 1 311.1 1 174.9 1 213.5 1 356.0 1 546.9 1 978.5 4 059.0 4 217.6 1 797.3 1 821.0 1 955.0 3 107.5 2 396.0 3 096.1 3 788.2
29 364.0 44 308.0 40 378.0 41 583.0 42 718.0 38 710.0 45 003.0 48 410.0 38 425.0 37 269.0 28 046.0 32 310.0 42 332.4 39 703.5 49 322.0 55 714.4
19 759.3 21 605.3 24 025.4 28 783.1 30 853.0 26 564.0 30 078.1 54 034.2 57 027.3 48 886.2 60 484.6 68 188.3 85 368.1 82 090.5 87 608.0 125 507.0
May 2017 Table 8.2

CANADIAN EXPORTS OF ENERGY MATERIALS (1)
1961 - 2016
Radioactive ores and
concentrates:
Million dollars
Coal:
Million dollars
Million tonnes
Crude petroleum:
Million dollars
Million cubic metres
Natural Gas:
Million dollars
Billion cubic metres
Fuel Oil:
Million dollars
Million litres
Coke:
Million dollars
Thousand tonnes
Gasoline:
Million dollars
Million litres
Butane and propane gas
(liquefied):
Million dollars
Million litres
Refined petroleum products
Million dollars
Electricity:
Million dollars
Million kilowatt hours
Total value - Million dollars
(1) All value are fob place of lading
Note: Crude Petroleum includes exchanges with the U.S.
Note: For crude petroleum export volumes see Table 8.1
2009 2010 2011 2012 2013 2014 2015 2016
977.2 869.1 974.7 841.1 819.9 752.0 651.6 941.6
4 835.7 5 968.5 8 002.4 6 325.7 5 508.1 4 167.0 3 449.9 4 439.9
26.9 33.0 33.4 34.7 39.0 34.2 30.2 30.2
42 834.6 51 949.7 68 804.3 74 735.1 81 735.9 97 467.6 64 087.9 52 313.1
15 957.8 15 619.7 13 462.8 8 859.1 10 856.9 16 020.2 10 026.3 8 662.6
12 289.7 11 559.2 10 755.5 13 728.4 na na na na
56.3 15.5 101.6 152.6 5.1 7.5 14.1 8.4
211.9 73.2 297.7 420.1 28.5 60.6 76.4 44.0
7 910.6 8 689.7 7 599.7 8 075.2 8 377.6 8 225.9 9 734.3 9 917.5
1 920.0 1 923.1 2 050.7 1 857.5 1 866.0 2 197.9 1 371.0 1 366.4
6 774.4 6 048.7 5 752.1 6 401.4 6 535.6 6 532.3 7 004.3 8 512.3
7 247.2 8 927.1 10 510.1 14 204.2 12 840.0 11 564.3 10 226.9 6 720.3
2 382.8 2 022.4 2 031.3 1 926.6 2 443.6 2 945.8 3 136.8 2 914.1
51 722.6 43 798.6 51 076.8 57 971.1 61 991.7 58 794.0 68 446.2 75 531.9
76 211.6 87 295.0 105 938.0 108 901.9 116 075.4 135 122.3 92 964.5 77 366.4
May 2017 Table 8.2

CANADIAN IMPORTS OF ENERGY MATERIALS (1)
1961 - 2016
1961 1962 1963 1964 1965 1966 1967 1968 1969 1970
Radioactive ores
and concentrates:
Million dollars
Coal:
Million dollars 71.7 74.3 78.8 86.5 126.2 141.0 145.5 160.4 144.6 150.8
Million tonnes 10.3 10.6 11.4 13.0 14.5 14.4 14.2 15.1 15.3 16.8
Crude Petroleum:*
Million dollars 291.2 304.9 334.8 320.6 312.3 299.0 355.4 372.6 393.5 415.2
Million cubic metres 21.2 21.4 23.5 22.8 22.9 23.2 27.1 28.2 30.7 33.0
Natural Gas:
Million dollars 1.7 1.8 2.4 2.9 5.8 17.6 19.9 35.4 16.0 5.1
Million cubic metres 158.0 158.0 195.0 228.0 444.0 1.2 1.5 2.5 1.1 336.0
Crude bituminous
substances, nes:
Million dollars 1.1 0.8 1.0 0.3 0.1 0.1 0.1 0.2 0.1 0.1
Aviation gasoline and
motor gasoline, nes:
Million dollars 10.2 8.0 10.0 9.3 9.6 10.8 17.3 16.8 25.8 20.1
Million litres 283.0 234.0 392.0 382.0 377.0 408.0 717.0 685.0 989.0 827.0
Aviation turbine fuel,
kerosene, fuel oil,
diesel fuel:
Million dollars 67.1 66.3 71.5 77.0 109.4 102.8 119.8 142.5 131.4 122.0
Million litres 1 949.0 1 680.0 1 830.0 5 321.0 8 199.0 7 913.0 9 413.0 10 036.0 9 558.0 9 340.0
Coke:
Million dollars 11.1 10.1 10.5 13.2 18.1 21.0 19.0 12.2 20.9 26.6
Thousand tonnes 594.0 531.0 548.0 686.0 892.0 983.0 864.0 741.0 893.0 1.1
Liquefied petroleum gases:
Million dollars 2.8 4.2 5.0 2.1 5.6 2.3 4.6 3.4 4.3 3.0
Petroleum products:
Million dollars - - - 2.3 1.8 4.4 4.3 2.9 4.5 2.5
Electricity:
Million dollars 1.4 3.4 11.4 12.3 13.7 10.2 10.0 11.7 8.7 12.4
Million kilowatt hours 312.0 813.0 2 879.0 2 995.0 3 405.0 2 352.0 2 524.0 2 636.0 2 248.0 2 882.0
Total value:
Million dollars 458.3 473.8 525.4 526.5 602.6 609.2 695.9 758.1 749.8 757.8
(1) All values are fob place of origin
May 2017 Table 8.3

CANADIAN IMPORTS OF ENERGY MATERIALS (1)
1961 - 2016
Radioactive ores
and concentrates:
Million dollars
Coal:
Million dollars
Million tonnes
Crude Petroleum:*
Million dollars
Million cubic metres
Natural Gas:
Million dollars
Million cubic metres
Crude bituminous
substances, nes:
Million dollars
Aviation gasoline and
motor gasoline, nes:
Million dollars
Million litres
Aviation turbine fuel,
kerosene, fuel oil,
diesel fuel:
Million dollars
Million litres
Coke:
Million dollars
Thousand tonnes
Liquefied petroleum gases:
Million dollars
Petroleum products:
Million dollars
Electricity:
Million dollars
Million kilowatt hours
Total value:
Million dollars
(1) All values are fob place of origin
1971 1972 1973 1974 1975 1976 1977 1978 1979 1980 1981
151.4 178.8 161.5 297.8 560.9 533.5 605.9 616.6 854.1 787.8 812.9
16.1 17.1 14.5 12.2 15.0 14.4 15.0 13.0 17.4 15.7 14.7
541.1 680.7 942.5 2 646.2 3 301.9 3 280.1 3 215.2 3 457.0 4 497.2 6 919.1 8 004.2
38.9 44.7 52.1 46.3 47.4 44.0 38.0 36.8 35.3 32.7 30.7
7.0 7.6 7.8 5.8 7.8 8.8 - 0.1 0.2 0.3 0.6
454.0 446.0 416.0 261.0 296.0 254.0 0.1 1.7 3.2 2.9 4.1
0.1 0.2 0.2 0.3 0.2 0.4 42.8 2.2 0.7 0.7 0.5
18.3 13.0 2.2 0.9 3.2 1.5 0.4 0.4 11.3 79.9 32.1
763.0 509.0 53.0 10.0 34.0 13.0 2.0 3.0 37.0 281.0 111.0
123.0 119.9 131.7 236.2 107.1 78.8 115.9 114.3 140.1 314.8 337.1
7 363.0 7 023.0 6 162.0 3 893.0 1 523.0 1 232.0 1 345.0 1 357.0 968.0 1 714.0 1 431.0
33.3 29.6 27.6 54.7 80.7 54.1 87.4 110.0 106.6 116.8 162.7
1.3 1.0 995.0 1.3 1 119.0 877.0 1 267.0 1 527.0 1 362 1 312.0 1 436.0
1.9 2.2 3.5 4.2 3.9 10.0 4.1 5.6 6.4 27.7 160.4
3.0 7.0 6.6 9.3 8.7 8.7 8.8 10.8 13.2 19.5 37.4
10.6 8.5 6.4 5.2 12.6 9.2 14.7 1.8 0.7 2.6 5.9
2 409.0 1 823.0 1 970.0 1 642.0 2 940.0 1 910.0 1 170.0 193.0 25.0 154.0 473.0
889.7 1 047.5 1 290.0 3 260.6 4 087.0 3 985.1 4 095.2 4 318.8 5 630.5 8 269.2 9 553.8
May 2017 Table 8.3

CANADIAN IMPORTS OF ENERGY MATERIALS (1)
1961 - 2016
Radioactive ores
and concentrates:
Million dollars
Coal:
Million dollars
Million tonnes
Crude Petroleum:*
Million dollars
Million cubic metres
Natural Gas:
Million dollars
Million cubic metres
Crude bituminous
substances, nes:
Million dollars
Aviation gasoline and
motor gasoline, nes:
Million dollars
Million litres
Aviation turbine fuel,
kerosene, fuel oil,
diesel fuel:
Million dollars
Million litres
Coke:
Million dollars
Thousand tonnes
Liquefied petroleum gases:
Million dollars
Petroleum products:
Million dollars
Electricity:
Million dollars
Million kilowatt hours
Total value:
Million dollars
(1) All values are fob place of origin
1982 1983 1984 1985 1986 1987 1988 1989 1990 1991
73.8 107.3 108.6 62.3
911.8 821.7 1 070.2 864.6 710.7 688.9 729.7 686.7 611.4 472.4
15.5 14.5 18.8 14.8 13.0 13.8 15.3 15.0 14.8 11.7
4 979.3 3 319.2 3 375.6 3 700.4 2 884.6 3 179.4 2 823.7 3 607.5 5 300.2 4 488.7
19.7 14.6 14.8 15.9 20.2 21.8 23.5 28.3 31.8 30.8
0.5 0.2 0.2 0.2 0.3 - 0.3 0.2 0.5 32.2
2.5 1.1 0.9 1.0 1.8 - - - - -
0.5 0.5 0.6 0.8 0.8 0.6 2.1 2.4 49.8 55.8
6.6 124.9 177.9 274.0 239.5 317.9
23.0 437.0 625.0 966.0 1 350.0 1 575.0
314.7 409.8 962.4 851.1 733.9 721.9
1 579.0 1 800.0 3 850.0 3 353.0 4 212.0 4 602.0
120.7 135.3 163.9 177.6 181.1 163.5 187.0 207.0 191.1 49.7
1 051 1 355.0 1 547.0 1 676.0 1 822 1 664 2 458.0 2 085.0 1 922.0 483.0
236.8 197.5 157.3 128.7 202.0 167.5 85.0 73.5 121.7 107.8
65.7 57.9 46.6 88.6 120.0 178.4 1 150.1 1 349.9 1 583.2 1 285.5
5.3 2.5 12.9 8.1 9.2 9.0 57.4 222.4 557.5 50.2
268.0 117.0 373.0 206.0 231.0 375.0 2 684.0 7 299.0 15 133.0 1 724.0
6 641.9 5 069.5 5 967.6 6 094.1 5 082.1 5 427.1 5 109.1 6 256.9 8 524.0 6 604.6
May 2017 Table 8.3

CANADIAN IMPORTS OF ENERGY MATERIALS (1)
1961 - 2016
Radioactive ores
and concentrates:
Million dollars
Coal:
Million dollars
Million tonnes
Crude Petroleum:*
Million dollars
Million cubic metres
Natural Gas:
Million dollars
Million cubic metres
Crude bituminous
substances, nes:
Million dollars
Aviation gasoline and
motor gasoline, nes:
Million dollars
Million litres
Aviation turbine fuel,
kerosene, fuel oil,
diesel fuel:
Million dollars
Million litres
Coke:
Million dollars
Thousand tonnes
Liquefied petroleum gases:
Million dollars
Petroleum products:
Million dollars
Electricity:
Million dollars
Million kilowatt hours
Total value:
Million dollars
(1) All values are fob place of origin
1992 1993 1994 1995 1996 1997 1998 1999 2000 2001
111.5 98.8 171.1 160.1 244.0 207.2 209.0 280.0 236.6 217.7
591.7 411.1 433.7 475.2 571.5 687.6 929.1 922.0 946.5 1 028.1
13.8 8.7 9.1 9.7 11.7 14.7 19.8 19.9 35.0 19.4
4 142.3 4 482.5 4 759.6 5 707.9 7 268.7 8 623.7 6 413.4 6 912.2 13 668.6 12 620.0
29.4 33.0 36.2 39.9 45.2 51.8 52.9 45.8 53.0 52.8
50.0 47.2 82.7 45.4 108.9 135.9 103.2 86.4 227.2 370.1
100.0 467.0 1 038.0 674.0 1 218.0 1 270.0 792.0 804.0 1 627.0 1 272.0
53.6 57.4 52.4 112.1 104.1 90.9 32.3 55.7 86.1 83.8
52.4 72.4 198.3 148.5 132.6 112.7 310.9 282.0 130.9 137.1
467.0 766.0 2 068.0 1 355.0 1 154.0 1 027.6 2 110.0 1 919.0 1 067.2 1 291.6
89.8 64.7 53.1 133.2 129.3 55.9 106.1 115.1 213.9 213.0
1 269.5 1 331.9 1 286.8 1 167.3 1 415.6 1 810.9 1 703.4 1 765.9 2 351.9 2 654.0
75.5 85.1 42.7 75.0 97.4 202.8 312.7 346.6 621.2 1 820.1
1 842.0 2 786.0 724.0 2 380.0 1 207.8 5 125.6 12 056.0 12 699.0 11 692.0 16 463.0
6 436.3 6 651.1 7 080.4 8 024.7 10 072.1 11 927.6 10 120.1 10 765.9 18 482.9 19 143.9
May 2017 Table 8.3

CANADIAN IMPORTS OF ENERGY MATERIALS (1)
1961 - 2016
Radioactive ores
and concentrates:
Million dollars
Coal:
Million dollars
Million tonnes
Crude Petroleum:*
Million dollars
Million cubic metres
Natural Gas:
Million dollars
Million cubic metres
Crude bituminous
substances, nes:
Million dollars
Aviation gasoline and
motor gasoline, nes:
Million dollars
Million litres
Aviation turbine fuel,
kerosene, fuel oil,
diesel fuel:
Million dollars
Million litres
Coke:
Million dollars
Thousand tonnes
Liquefied petroleum gases:
Million dollars
Petroleum products:
Million dollars
Electricity:
Million dollars
Million kilowatt hours
Total value:
Million dollars
(1) All values are fob place of origin
2002 2003 2004 2005 2006 2007 2008 2009 2010
208.8 192.6 277.5 340.3 391.3 521.1 586.9 577.2 683.1
1 092.6 869.4 982.2 1 233.0 1 256.3 1 035.7 1 249.7 1 031.8 1 031.9
22.7 22.1 19.1 20.7 20.4 18.0 20.1 12.6 12.3
12 006.6 13 811.4 16 046.8 23 361.0 24 115.3 33 954.0 21 044.6 23 764.3 28 909.5
52.7 54.3 54.4 56.8 52.5 52.7 52.2 51.4 47.6
581.2 1 499.5 2 557.8 3 576.6 2 383.5 3 162.2 4 491.8 3 167.5 3 524.8
3 324.0 5 491.0 10 235.0 12 274.7 8 264.2 11 181.1 13 863.4 16 375.7 20 117.5
53.4 54.3 102.6 73.9 152.5 144.9 255.7 194.1 229.4
102.8 105.5 196.4 150.1 111.7 139.8 476.7 72.7 204.8
1 092.0 655.3 987.5 948.0 839.4 757.0 1 335.6 346.0 760.7
90.4 128.3 148.3 166.7 165.4 267.8 263.9 120.0 129.8
2 065.6 2 783.6 3 664.6 5 326.1 5 994.7 5 985.2 9 537.9 5 891.2 7 327.5
450.0 1 052.2 1 074.2 1 274.6 1 159.1 1 031.2 1 319.5 654.1 649.1
13 007.0 22 544.0 22 168.0 19 676.7 23 623.8 19 380.1 23 864.1 18 163.4 18 686.2
16 651.4 20 496.8 25 050.4 35 502.2 35 729.8 46 241.9 39 226.7 35 472.8 42 689.9
May 2017 Table 8.3

CANADIAN IMPORTS OF ENERGY MATERIALS (1)
1961 - 2016
Radioactive ores
and concentrates:
Million dollars
Coal:
Million dollars
Million tonnes
Crude Petroleum:*
Million dollars
Million cubic metres
Natural Gas:
Million dollars
Million cubic metres
Crude bituminous
substances, nes:
Million dollars
Aviation gasoline and
motor gasoline, nes:
Million dollars
Million litres
Aviation turbine fuel,
kerosene, fuel oil,
diesel fuel:
Million dollars
Million litres
Coke:
Million dollars
Thousand tonnes
Liquefied petroleum gases:
Million dollars
Petroleum products:
Million dollars
Electricity:
Million dollars
Million kilowatt hours
Total value:
Million dollars
(1) All values are fob place of origin
2011 2012 2013 2014 2015 2016
971.8 872.3 920.9 433.0 500.1 489.6
901.3 926.0 681.7 707.1 821.1 605.5
9.0 9.3 8.2 7.5 7.3 6.0
28 909.5 29 763.2 27 019.6 23 792.2 16 821.8 14 419.5
44.2 44.3 40.2 36.9 44.1 44.2
3 956.7 2 848.2 3 804.6 4 905.5 2 827.9 2 114.4
25 555.6 25 962.4 25 922.9 21 593.0 19 235.9 18 163.5
283.8 290.3 160.3 197.4 120.4 78.4
121.8 94.2 59.8 247.0 220.7 196.2
403.3 340.0 338.8 896.7 922.7 978.4
107.5 79.1 192.5 62.6 34.3 22.9
11 844.5 9 706.2 11 035.4 12 494.1 9 427.3 8 368.9
370.3 232.5 367.2 622.0 306.3 256.7
14 384.6 11 392.3 10 675.3 12 817.5 8 717.2 9 443.2
47 467.1 44 812.0 44 242.0 43 460.9 31 080.0 26 552.1
May 2017 Table 8.3


