Statistical Issues in Interactive Web-based Public Health Data Dissemination Systems MICHAEL A. STOTO WR-106 October 2003 Prepared for the National Association of Public Health Statistics and Information Systems
Transcript
Statistical Issues inInteractive Web-basedPublic Health DataDissemination Systems
MICHAEL A. STOTO
WR-106
October 2003
Prepared for the National Association of Public Health Statistics andInformation Systems
Statistical Issues in Interactive Web-basedPublic Health Data Dissemination Systems
EXECUTIVE SUMMARY
State- and community-level public health data are increasingly being
made available on the World Wide Web for the use of professionals and the
public. The goal of this paper is to identify and address the statistical issues
associated with these interactive data dissemination systems. The analysis is
based on telephone interviews with 14 individuals in five states involved with the
development and use of seven distinct interactive web-based public health data
dissemination systems, as well as experimentation with the systems themselves.
Interactive web-based systems offer state health data centers an
important opportunity to disseminate data to public health professionals, local
government officials, and community leaders, and in the process raise the profile
of health issues and involve more people in community-level decision making.
The primary statistical concerns with web-based dissemination systems relate to
the small number of individuals in the cells of tables when the analysis is focused
on small geographic areas or in other ways. In particular, data for small
population groups can be lacking in statistical reliability, and also can have the
potential for releasing confidential information about individuals. These concerns
are present in all statistical publications, but are more acute in web-based
systems because of their focus on presenting data for small geographical areas.
Statistical Issues in Web-Based Public Health Data Systems 2
Small numbers contributing to a lack of statistical reliability
One statistical concern with web-based dissemination systems is the
potential loss of statistical reliability due to small numbers. This is a concern in
all statistical publications, but it is more acute in web-based systems because of
their focus on presenting data for small geographical areas and other small
groups of individuals.
There are a number of statistical techniques that interactive data
dissemination systems can use to deal with the lack of reliability resulting from
small cell sizes. Aggregation approaches can help, but information is lost. Small
cells can be suppressed, but even more information is lost. (The best rationale
for numerator-based data suppression is confidentiality protection, not statistical
reliability.) In general, approaches that use statistical approaches to quantify the
uncertainty (such as confidence intervals and the use of c2 tests), or to
smoothing, or small area model-based estimation, should be preferred to options
that suppress data or give counts but not rates.
Small numbers and confidentiality concerns
The primary means for protecting confidentiality in web-based data
dissemination systems, as in more traditional dissemination systems, is the
suppression of “small” cells, plus complementary cells, in tables. The definition
of “small” varies by state, and often by dataset. This approach often results in a
substantial loss of information and utility.
Statisticians in a number of state health data centers have recently
reconsidered data suppression guidelines currently in use and have developed
Statistical Issues in Web-Based Public Health Data Systems 3
creative and thoughtful new approaches, as indicated above. Their analyses,
however, have not been guided by theory or statistical and ethical principles, and
have not taken account of extensive research on these issues and development
of new methods that has taken place in the last two decades. Government and
academic statisticians, largely outside of public health, have developed a variety
of “perturbation” methods such as “data swapping” and “controlled rounding” that
can limit disclosure risk while maximizing information available to the user. The
Census Bureau has developed a “confidentiality edit” to prevent the disclosure of
personal data in tabular presentations. The disclosure problem can be
formulated as a statistical decision problem that explicitly balances the loss that
is associated with the possibility of disclosure and the loss associated with non-
publication of data. Such theory-based and principled approaches should be
encouraged.
Concept validity and data standards
Statisticians have been concerned ever since computers were introduced
that the availability of data and statistical software would lead untrained users to
make mistakes. While this is probably true to some extent, restricting access to
data and software is not likely to succeed in public health. The introduction of
interactive web-based dissemination systems, on the other hand, should be seen
as an important opportunity to develop and extend data standards in public
health data systems.
Web-based dissemination systems, because they require that multiple
data systems be put into a common format, present opportunities to disseminate
Statistical Issues in Web-Based Public Health Data Systems 4
appropriate data standards and to unify state data systems. Educational efforts
building on the dissemination software itself, as well as in more traditional
settings, are likely to be more effective in reducing improper use of data than
restricting access. For many users, such training will need to include content on
using public health data, not just on using web-based systems. The
development of standard reports for web-based systems can be an effective
means for disseminating data standards.
Data validation
No statistical techniques can guarantee that there will be no errors in web-
based data systems. Careful and constant checking of both the data and the
dissemination system, as well as a policy of releasing the same data files to all
users, however, can substantially reduce the likelihood of errors. Methods for
validation should be documented and shared among states.
The development of web-based dissemination systems is an opportunity
to implement data standards rather than a problem to be solved. Efforts to check
the validity of the data for web dissemination purposes may actually improve
overall data quality in state public health data systems.
General comments
The further development and use of web-based data dissemination
systems will depend on a good understanding of the systems’ users and their
needs. System designers will have to balance between enabling users and
protecting users from themselves. Systems will also have to develop ways to
Statistical Issues in Web-Based Public Health Data Systems 5
train users not only in how to use the systems themselves, but also on statistical
issues in general and the use of public health data.
Research to develop and implement new statistical methods, and to better
understand and address users’ needs, is a major investment. Most states do not
have the resources to do this on their own. Federal agencies, in particular
through CDC’s Assessment Initiative, could help by enabling states to share
information with one another, and by supporting research on the use of new
statistical methods and on data system users.
Statistical Issues in Web-Based Public Health Data Systems 6
INTRODUCTION
State- and community-level public health data are increasingly being
made available on the World Wide Web for the use of professionals and the
public. Although most data of this sort currently available are simply static
presentations of reports that have previously been available in printed form,
interactive web-based systems are increasingly common (Friedman et al, 2001).
The goal of this paper is to identify and address the statistical issues
associated with interactive web-based state health data dissemination systems.
This will include assessing the current data standards, guidelines, and/or best
practices used by states in their dissemination of data via the Web for both static
presentation of data and interactive querying of data sets and analyzing the
statistical standards and data dissemination policies, including practices to
ensure compliance with privacy and confidentiality laws. Many of the same
statistical issues apply to public health data however published, but interactive
web-based systems make certain issues more acute. In addition, identifying and
addressing these issues for interactive systems may also lead to overall state
health data system improvement.
This analysis is based on telephone interviews with 14 individuals in five
states involved with the development and use of seven distinct interactive web-
based public health data dissemination systems, as well as experimentation with
the systems themselves. All but one of the systems are currently in operation,
but most are constantly being updated. The interviewees and information on the
sites appears in Appendix A. The choice of these individuals and states was not
intended to be exhaustive or representative, but to bring out as many statistical
Statistical Issues in Web-Based Public Health Data Systems 7
issues as possible. In addition, a preliminary draft of this paper was circulated for
comment and was discussed at a two-day workshop at Harvard School of Public
Health in August, 2002; attendees are listed in Appendix B. The current draft
reflects comments by e-mail and at the workshop, but the analysis and
conclusions are the author’s, as well as any errors that may remain.
This paper begins with a background section that addresses the purposes,
users and benefits of interactive data dissemination systems, systems currently
in place or being developed, and database design as it affects statistical issues.
The body of the paper is organized around four substantive areas: (1) small
numbers contributing to a lack of statistical reliability; (2) small numbers leading
to confidentiality concerns; (3) concept validity and data standards, and (4) data
validation. The paper concludes with a summary and conclusions. A glossary of
key terms appears in Appendix C.
BACKGROUND
Purposes, users, and benefits of interactive data systems
Interactive web-based data dissemination systems in public health have
been developed for a number of public health assessment uses. One common
use is to facilitate the preparation of community-level health profiles. Such
reports are consistent with Healthy People 2010 (DHHS, 2000), and are
increasingly common at the local/county level. In some states, they are required.
This movement reflects the changing mission of public health from direct delivery
of personal health care services to assessment and policy development (IOM,
Statistical Issues in Web-Based Public Health Data Systems 8
1996, 1997). The reports are used for planning and priority setting as well as for
evaluation of community-based initiatives.
Minnesota, for instance, will use its interactive dissemination system to
reshape the way that state and county health departments do basic reports by
facilitating, and hence encouraging, the use of certain types of data. The system
is intended to provide better and more current information to the public than is
available in the current static system, in which data are updated only every two
years.
From another perspective, the purpose of web-based dissemination
systems is to enable local health officials, policy makers, concerned citizens, and
community leaders who are not trained in statistics or epidemiology to participate
in public health decision-making. Because many of these users are not
experienced data users, some systems are designed to help users find
appropriate data. MassCHIP, for instance, was designed with multiple ways into
datasets so users are more likely to “stumble upon” what they need. Users can
search, for instance, using English-language health problems lists and Healthy
People objectives, as well as lists of datasets.
Web-based dissemination systems are also a natural outgrowth of the
activities of state health data centers. The systems allow users to prepare
customized reports (their choice of comparison areas, groups of ICD codes, age
groups, and so on). So in addition to making data available to decision makers
and the public, they also facilitate work already done by state and local public
health officials and analysts. This includes fulfilling data requests to the state
data center as well as supporting statistical analyses done by subject area
Statistical Issues in Web-Based Public Health Data Systems 9
experts. States have seen substantial reduction in the demand on health
statistics staff for data requests. In at least one case, the system itself has
helped to raise the profile of the health department with legislators.
Interactive web data systems are also being used to detect and
investigate disease clusters and outbreaks. This includes cancer, infectious
diseases, and, increasingly, bioterrorism. Interactive web systems are also being
used, on a limited basis, for academic research, or at least for hypothesis
generation. The software that runs some of these systems (as opposed to the
state health data that are made available through it) has also proven useful for
research purposes. Nancy Krieger at the Harvard School of Public Health, for
instance, is using VistaPH to analyze socio-economic status data in
Massachusetts and Rhode Island, and others are using it in Duval County,
Florida and Multnomah County, Oregon.
Some states are also building web-based systems to bring together data
from a number of health and social service programs and make them available to
providers in order to simplify and coordinate care and eligibility determination.
Such systems can provide extremely useful statistical data, and in this sense are
included in this analysis. The use of these systems for managing individual
patients, however, is not within the scope of this paper.
Reflecting the wider range of purposes, the users of web-based data
systems are very diverse. They include local health officials, members of boards
of health, community coalitions, as well as concerned members of the public.
Employees of state health data centers, other health department staff, and
employees of other state agencies; hospital planners and other health service
Statistical Issues in Web-Based Public Health Data Systems 10
administrators, public health researchers and students of public health and other
health fields also use the data systems.
These users range from frequent to occasional. Frequent users can
benefit from training programs and can use more sophisticated special purpose
software. Because most users only use the system occasionally, there is a need
for built-in help functions and the like. Tennessee’s system, for instance, is
colorful and easy to use. Elementary school students up to graduate students in
community health courses have used it for class exercises.
Because of the breadth of uses and users, the development of a web-
based dissemination system can lead to consideration and improvement of data
standards and to more unification across department data systems. This
happens by encouraging different state data systems to use common population
denominators, consistent methods, such as for handling missing data, consistent
data definitions, for example for race/ethnicity and common methods for age
adjustment (to the same standard population) and other methods, such as
confidence intervals.
Current web-based public health data dissemination systems
In support of the wide variety of uses and users identified above, current
public health web-based data dissemination systems include many different
kinds of data. Each of the following kinds of data is included in at least one of the
seven data systems examined for this study. Reflecting the history of state
health data centers, vital statistics are commonly included. Most systems also
include census or other denominator data needed to calculate population-based
Statistical Issues in Web-Based Public Health Data Systems 11
rates. In support of community health assessment initiatives, web-based
dissemination systems also typically include information related to Healthy
People 2010 (DHHS, 2000) measures or their state equivalents, and links to
HRSA’s Community Health Status Indicators (HRSA, undated).
Systems also commonly include data “owned” by components of the
public health agency outside the state data center, and sometimes by other state
agencies. Web-based dissemination systems, for instance, typically include
epidemiologic surveillance data on infectious diseases, including HIV/AIDS, and,
increasingly, bioterrorism. Cancer registry data are included in some systems.
Some systems include health services data based on hospitalization, such as
average length of stay and costs, as well as Medicaid utilization data. One
system includes data from outside the health department on TANF and WIC
services.
Although much of the data covered by web-based dissemination systems
is based on individual records gathered for public health purposes, such as death
certificates and notifiable disease reports, population-based survey data are also
included. Data from a state’s Behavioral Risk Factor Surveillance System
(BRFSS) (CDC, undated), youth behavioral risk factor and tobacco surveys
where available, and others, are commonly included.
Demographic detail in web dissemination systems generally reflects what
is typically available in public health data sets and what is used in tabulated
analyses: age, race, sex, and sometimes indicators of socioeconomic status.
Definitions of these variables and how they are categorized frequently vary
across the data sets available in a single state system.
Statistical Issues in Web-Based Public Health Data Systems 12
The geographic detail in web-based dissemination systems, however, is
substantially greater than is typically available in printed reports. State systems
typically have data available for each county or, in New England states, town.
Some of the state systems also have data available for smaller areas in large
cities. Missouri’s MICA makes some health services data available by Zip code.
Some of the systems allow users to be flexible in terms of disaggregation. The
basic unit in MassCHIP is the city/town, but the system allows users to group
these units into community health areas, HHS service areas, or user-defined
groups. The VistaPHs and EpiQMS systems in Washington allow user-defined
groups based on census block.
This geographical focus, first of all, is designed to make data available at
the level of decision-making, and to facilitate the participation of local policy
makers and others in health policy decisions. This focus also allows public
health officials to develop geographically and culturally targeted interventions. In
Washington, for instance, a recent concern about teen pregnancy led public
health officials to identify the counties, and then the neighborhoods, with the
highest teen fertility rates. This analysis led them to four neighborhoods, two of
which were Asian where teen pregnancy is not considered a problem. They were
then able to focus their efforts in the two remaining neighborhoods. In the future
they anticipate using the system to support other surveillance activities as well as
outbreak investigations.
Although the combination of demographic and geographic variables in
theory allows for a great degree of specificity, in actual practice the combination
Statistical Issues in Web-Based Public Health Data Systems 13
of these variables is limited by database design, statistical reliability, and
confidentiality concerns, as discussed below.
Data availability and state priorities drive what is included in web-based
dissemination systems. According to John Oswald, for instance, Minnesota’s
health department has three priorities – bioterrorism, tobacco, and disparities –
so the system is being set up to focus on these. Data availability is a practical
issue; it includes whether data exist at all, are in a suitable electronic form, come
with arrangements that allow or prohibit dissemination, and whether the data are
owned by the state health data center.
State public health data systems are also an arena in which current
statistical policy issues are played out, and this has implications for database
content and design. Common concerns are the impact of the new Health
Insurance Portability & Accountability Act of 1996 (HIPAA) regulations regarding
the confidentiality of individual health information (Gostin, 2001), the recent
change in federal race/ethnicity definitions, the adoption of the Year 2000
standard population by the National Center for Health Statistics (Anderson and
Rosenberg, 1998), and surveillance for bioterrorism and emerging infectious
diseases.
In the future, web-based dissemination systems will likely be expanded to
include more data sets. Some states are considering using these systems to
make individual-level data available on a restricted basis for research purposes.
States are also considering using these systems to make non-statistical
information (e.g. breast cancer fact sheets, practice guidelines, information on
Statistical Issues in Web-Based Public Health Data Systems 14
local screening centers) available to community members, perhaps linked to data
requests on these subjects.
Database design
Current web-based dissemination systems range from purpose-built
database software to web-based interfaces to standard, high-powered statistical
software such as SAS or GIS systems such as ESRI Map Objects that resides on
state computers. System development has been dependent on the statistical,
information technology, and Internet skills available in (and to) state health data
centers. Missouri and Massachusetts built their own systems. Washington
adopted a system built by a major local health department, Seattle-King County.
Tennessee contracted with a university research group with expertise in survey
research and data management. Not surprisingly, the systems have evolved
substantially since they were first introduced in 1997 due to changes in
information technology, and Internet technology, and the availability of data in
electronic form.
The designers of web-based dissemination systems in public health face
two key choices in database development. As discussed in detail below, these
choices have statistical implications in terms of validity checking, choice of
denominator, data presentation (e.g. counts vs. rates vs. proportions, etc.), ability
to use sophisticated statistical methods, and user flexibility.
First, systems may be designed to prepare analyses from individual-level
data “on the fly” – as requested – as in MassCHIP, or to work with preaggregated
data (Missouri’s MICA) or pre-calculated analytical results (Washington’s
Statistical Issues in Web-Based Public Health Data Systems 15
EpiQMS). “On the fly” systems obviously have more flexibility, but the time it
takes to do the analyses may discourage users. This time can be reduced by
pre-aggregation. Rather than maintaining a database of individual-level records,
counts of individuals who share all characteristics are kept in the system.
Different degrees of preaggregation are possible. At one extreme, there are
static systems in which all possible tables and analyses are prepared in advance.
At the other, all calculations are done using individual-level data. In between, a
system can maintain a database with counts of individuals who share
characteristics. The more characteristics that are included, the more this
approaches an individual-level system.
At issue here is the degree of user control and interaction. Static systems
can deliver data faster, but are less flexible in what can be requested and may
limit the user in following up leads that appear in preliminary analyses. The
preprocessing step, however, can provide an opportunity for human analysts to
inspect tables and ensure that statistical analyses supporting more complex
analyses are reasonable. EpiQMS, for instance, uses an “accumulated record”
database – all of the calculations have been done in advance – which allows for
greater speed and a user-friendly design. It also allows the system
administrators to look at the data and see if it makes sense, and also to identify
and fix problems based on human intelligence.
The second major design choice is between a server-resident data and
analytic engine vs. a client-server approach. In a server-resident system, the
web serves as an interface that allows users to access data and analytic tools
that reside on a state health data center server. The only software that the user
Statistical Issues in Web-Based Public Health Data Systems 16
needs is a web browser. In a client-server approach, special purpose software
on the user’s computer accesses data on the state’s computer to perform
analyses. Client-server software allows for greater flexibility (for example, users
can define and save their own definitions of geographical areas), but the
necessity of obtaining the client software in advance can dissuade infrequent
users.
Systems can, and do, combine these approaches. MassCHIP, for
instance, uses client-server software to do analyses on the fly, but makes a
series of predefined “Instant Topics” reports available through the web.
Tennessee’s HIT system uses a combination of case-level and prepared
analyses. Its developers would like more case-level data because it is more
flexible, but these analyses are hard to program, and resources are limited. In
the end, users care more about data than datasets, so an integrated front end
that helps people find what they need is important.
Although all of the systems include some degree of geographical data,
they vary in the way that these data are presented. Washington’s EpiQMS and
Tennessee’s HIT systems feature the use of data maps, which are produced by
commercial GIS software. According to Richard Hoskins, spatial statistics
technology has finally arrived, and the EpiQMS system makes full use of it. The
systems also differ in the availability of graphical modes of presentation such as
bar and pie charts.
The design of web-based dissemination systems should, and does,
represent the diversity of the users as discussed above. A number of systems,
for instance, have different levels for types of users. Users differ with respect to
Statistical Issues in Web-Based Public Health Data Systems 17
their statistical skills, their familiarity with computer technology, and their
substantive expertise, and there is a clear need (as discussed in more detail
below) for education, training, and on-line help screens that reflect the different
skills and expertise that the users bring to the systems.
ANALYSIS AND RECOMMENDATIONS
Small numbers contributing to a lack of statistical reliability
Because of their focus on community-level data, web dissemination
systems for public health data eventually, and often quickly, get to the point
where the numbers of cases available for analysis become too small for
meaningful statistical analysis or presentation. It is important to distinguish two
ways in which this can happen.
First, in statistical summaries of data based on case reports oftentimes the
expected number of cases is small, meaning the variability is relatively high. In
statistical summaries the number of reported cases (x) typically forms the
numerator of a rate (p), which could be the prevalence of condition A per 1,000
or 100,000 population, the incidence of condition B per 100,000 residents per
year, or other similar results. Let the base population for such calculations be n.
There is variability in such rates from year to year and place to place because of
the stochastic variability of the disease process itself. That is, even though two
communities may have the same, unchanging conditions that affect mortality,
and 5 cases would be expected in each community every year, the actual
number in any given year could be 3 and 8, 6 and 7, and so on, simply due to
chance.
Statistical Issues in Web-Based Public Health Data Systems 18
The proper formula for the variance of such rates depends on the
statistical assumptions that are appropriate, typically binomial or Poisson. When
p is small, however, the following formulas hold approximately:
(1) Var (x) = np
(2) Var (p) = Var (x/n) = p/n
Analogous formulae are available for more complex analyses, such as
standardized rates, but the fundamental relationship to p and n is similar.
Since the expected value of the number of cases, x, is also equal to np,
the first formula implies that the standard deviation of x equals the square root of
its expected value. If the expected number of cases is, say, 4, the standard
deviation is ÷4 or 2. If the rate were to go up by 50% so that the expected
number of cases became 6, that would be only about 1 standard deviation above
the previous mean, and such a change would be difficult to detect. In this sense,
when the number (or more precisely the expected number) of cases is small, the
variability is relatively high.
The second formula, on the other hand, reminds us that the population
denominator is also important. In terms of rates, a rate calculation based on 4
events is far more precise if the population from which it is drawn is 10,000 than
if it is 100. In the first case p = 4/10,000 = 0.0004 and the standard deviation is
÷0.0004/10,000 = 0.02/100 = 0.0002. In the second case p = 4/100 = 0.04 and
the standard deviation is it is ÷0.04/100 = 0.2/10 = 0.02. In addition, in two
situations leading to the same calculated rate of p, the one with the larger n is
also more precise. For instance, 400/10,000 and 4/100 both yield p = 0.04, but
Statistical Issues in Web-Based Public Health Data Systems 19
the standard deviation of the first is ÷0.04/10,000 = 0.2/100 = 0.002 and the
second is ÷0.04/100 = 0.2/10 = 0.02. Table 1 illustrates these points.
Table 1. Small numbers and statistical reliability examples
x = 4, n = 100 or 10,000
x = 4 n = 100 SD(p) = ÷0.04/100 = 0.02 SD/p = 0.02/0.04 = 0.5
An alternative rule is based on population denominators; data are not
reported on a population less than a certain size, such as 100,000. The
assumption is that there are a limited number of persons with any given set of
characteristics in a small population. With this rule, however, Table 3 could not
be published.
Table 3. Small numbers and confidential concerns: denominator rule examples
Total deaths in a county of 90,000 populationWhite Black
Male 350 150Female 300 100
To avoid such problems, Missouri uses a numerator and event
denominator rule; a table is not reported if a table cell subtracted from the
number of total events in the same data file for the same characteristics yields a
small number (e.g. less than 10). For example, a cell with one Black female
aged 25-34 AIDS death would be published if there were 15 Black female aged
25-34 total deaths. The assumption is that it may be possible to identify the
diagnosis of a person if there are fewer than 10 people with the same
demographics characteristics and who had the same event (death, in this case,
or perhaps birth or hospitalization).
In order to compare these rules, consider the examples in Table 4. A
numerator rule would allow release depending on whether the number of AIDS
Statistical Issues in Web-Based Public Health Data Systems 35
deaths in Black females aged 25-44 were fewer than 6 or not, regardless of the
total number of deaths. The Missouri rule is based on the difference between
total and AIDS deaths in this demographic group being fewer than 10. Land
argues that when there is one AIDS death among 100, it is not likely that
someone could identify which person had AIDS, so the numerator rule is unduly
restrictive and the Missouri rule more appropriate. In the other direction, in the
case where 6 of 7 deaths in this demographic group were due to AIDS, the
numerator rule would inappropriately allow this information to be published.
Table 4. Comparison of numerator and event denominator rules
A: AIDS deaths,Black females
aged 25-44
B: Total deaths,Black females
aged 25-44
Release undernumerator rule:
A<6
Release underMissouri rule:
B-A<101 100 No Yes6 100 Yes Yes1 7 No No6 7 Yes No
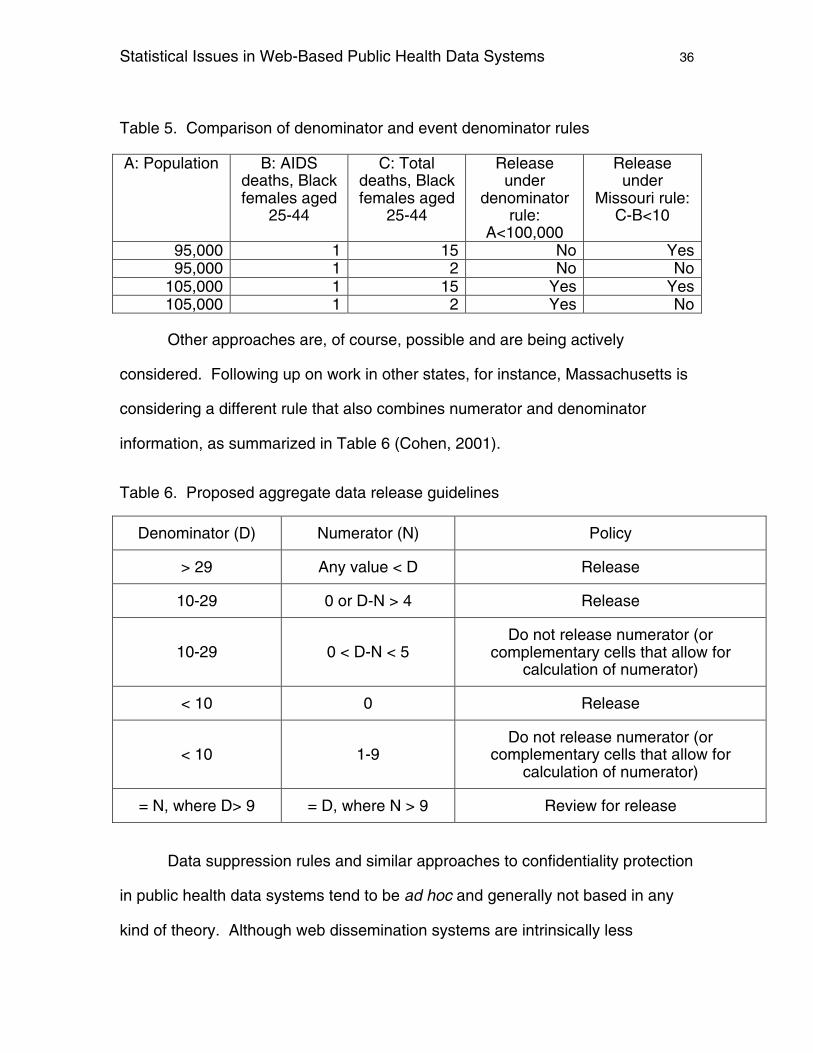
A similar case can be made against denominator rules. Consider the
examples in Table 5. A denominator rule would make no distinction between one
AIDS death out of 15 in the demographic group and one AIDS death out of two.
Rather, the decision to release would be different if the base population were 95
or 105,000. The Missouri rule, on the other hand, focuses on whether the
difference between total deaths and AIDS deaths in this demographic group is
less than 10 would distinguish between one of 15 and one of two deaths, rather
than on the denominator. In this example, the Missouri rule does seem to be
more reasonable.
Statistical Issues in Web-Based Public Health Data Systems 36
Table 5. Comparison of denominator and event denominator rules
A: Population B: AIDSdeaths, Blackfemales aged
25-44
C: Totaldeaths, Blackfemales aged
25-44
Releaseunder
denominatorrule:
A<100,000
Releaseunder
Missouri rule:C-B<10
95,000 1 15 No Yes95,000 1 2 No No
105,000 1 15 Yes Yes105,000 1 2 Yes No
Other approaches are, of course, possible and are being actively
considered. Following up on work in other states, for instance, Massachusetts is
considering a different rule that also combines numerator and denominator
information, as summarized in Table 6 (Cohen, 2001).
Table 6. Proposed aggregate data release guidelines
Denominator (D) Numerator (N) Policy
> 29 Any value < D Release
10-29 0 or D-N > 4 Release
10-29 0 < D-N < 5Do not release numerator (or
complementary cells that allow forcalculation of numerator)
< 10 0 Release
< 10 1-9Do not release numerator (or
complementary cells that allow forcalculation of numerator)
= N, where D> 9 = D, where N > 9 Review for release
Data suppression rules and similar approaches to confidentiality protection
in public health data systems tend to be ad hoc and generally not based in any
kind of theory. Although web dissemination systems are intrinsically less
Statistical Issues in Web-Based Public Health Data Systems 37
[secure] than published tables (see the Town A & City B and related examples
above), public health web systems have usually adopted the rules applied to
existing paper publications.
Although suppression rules of various sorts are probably the most
common current approach to confidentiality protection in web-based
dissemination systems, there are alternatives in place. Methods have been
developed to recode, round, or perturb the data to reduce the risk of disclosure
and preserve the utility of the results (Federal Committee on Statistical
Methodology, 1994; Fienberg et al., 1998; Duncan, 2001).
Another alternative is to allow greater access to the database to “trusted”
or “registered” users and use passwords in their web dissemination system to
manage this. Health department employees and data owners, for instance,
would have more access than local health officials or members of the public.
Washington’s EpiQMS system, for example, currently makes data available on a
“need to know” basis, which varies by dataset and geographical detail. States
can also require data use agreements before trusted users are given access to
data, and in this way have more control than in the past, when users were simply
given a data tape. Such an approach does, however, raise questions of who is
trusted, who has a need to know and ultimately issues of openness in
government. Is it better to have two systems, one for health department
personnel and researchers and another for less sophisticated users, than one
with restricted access?
A less common but possibly important alternative is the use of smoothing
algorithms and other statistical modeling techniques. Although developed to deal
Statistical Issues in Web-Based Public Health Data Systems 38
with statistical reliability (see the previous section), these algorithms in effect
replace the original data with a less variable estimate that does not represent any
individual’s personal data. As a result, publishing smoothed values has the
unintentional but desirable side effect of protecting confidentiality. Washington’s
EpiQMS, for instance, also uses Bayesian smoothing to give estimates of rates
for small areas without revealing specific numbers that could identify individuals.
Conclusions and recommendations
The primary means for protecting confidentiality in web-based data
dissemination systems, as in more traditional dissemination systems, is the
suppression of “small” cells, plus complementary cells, in tables. The definition
of “small” varies by state and often by dataset. This approach often results is a
substantial loss of information and utility.
Statisticians in a number of state health data centers have recently
reconsidered data suppression guidelines currently in use and have developed
creative and thoughtful new approaches, as indicated above. Their analyses,
however, have not been guided by theory or statistical and ethical principles, and
have not taken account of extensive research on these issues and development
of new methods that has taken place in the last two decades. Government and
academic statisticians, largely outside of public health, have developed a variety
of “perturbation” methods such as “data swapping” and “controlled rounding” that
can limit disclosure risk while maximizing information available to the user
(Federal Committee on Statistical Methodology, 1994; Fienberg et al., 1998;
Doyle et al., 2001; Duncan et al., 2001). The Census Bureau has developed a
Statistical Issues in Web-Based Public Health Data Systems 39
“confidentiality edit” to prevent the disclosure of personal data in tabular
presentations (Federal Committee on Statistical Methodology, 1994). Zaslavsky
and Horton (1998) formulate the disclosure problem as a statistical decision
problem that explicitly balances the loss associated with the possibility of
disclosure and loss associated with non-publication of data. Such theory-based
and principled approaches should be encouraged.
The confidentiality of data in geographical information systems (GIS)
represented in maps has not been well explored. Displays that represent cases
of a particular disease as dots on a map according to their place of residence, for
instance, can disclose the identity if the scale is sufficiently fine and the
population density is low. Random spatial perturbation has been proposed to
solve this problem, but has the potential drawback of seeming to identify
individuals as cases when they actually are not. As the use of maps for data
display and analysis increases, research and development of confidentiality
protection processes are needed.
Concept validity and data standards
By bringing together data from a variety of sources and making it available
to a range of sophisticated and inexperienced users, the development of web-
based dissemination systems for public health data brings to the surface
important statistical issues in data validity and standards. Some system
designers would like to provide users with a variety of different approaches to
calculations, but to ensure through training and built-in help screens and
documentation that they understand the concepts. Other designers focus on
Statistical Issues in Web-Based Public Health Data Systems 40
users with no training in statistics or epidemiology, and build appropriate choices
into the system software.
Data can be analyzed in different ways, and in some cases must be for
purposes of consistency. The SIDS rate, for instance, can be calculated using
births in the year as the denominator (the demographic approach), or by linking
individual birth and death records (the epidemiologic approach). Both are valid,
but one may be preferable to the other depending on the comparisons that will be
made. Incidence and prevalence rates, as well as cause specific-mortality rates,
can be presented in crude form or standardized to a common population base to
clarify comparisons across time and geographical units. Whether standardization
is done at all, and if so what standard population is used, whether a direct or an
indirect approach is used, and the choice of age groups are all matters of
judgment. Health services researchers frequently “risk adjust” hospital outcomes
data to reflect different patient populations. How to do so, however, is a matter of
judgment and of data availability.
Some of these issues can be addressed through data standards. Such
standards might address the handling of missing data, methods for age
adjustment (e.g. minimum numbers for direct adjustment), CDC surveillance
case definitions, and race and ethnicity definitions. Data standards might also
specify common population denominators for all rates in the system. National
documents and agencies can help guide the choice of data standards. These
include Healthy People 2010, and especially the Leading Health Indicators,
HRSA’s Community Health Status Indicators, CDC’s Behavioral Risk Factor
Statistical Issues in Web-Based Public Health Data Systems 41
Surveillance System (BRFSS), and the health care surveys and data systems
maintained by the Agency for Healthcare Research and Quality (AHRQ).
MassCHIP, for instance, builds data standards and guidelines into the
system through meta-data. Minnesota is planning to incorporate the emerging
National Electronic Disease Surveillance System (NEDSS) standards –
developed by CDC for surveillance data systems (CDC, undated) – into its state
system. The NEDSS standards currently focus on details of data transmission
and other technical issues rather than statistical standards, as described in the
previous paragraph, but in the future NEDSS standards might expand to include
more statistical issues.
Ultimately, the development of a web-based dissemination system
drawing on data from various parts of a state health department and other
agencies can provide an opportunity to develop or revise necessary standards.
While helpful, however, data standards alone are unlikely to ensure that data are
used properly. Indeed, some system designers seem concerned that providing
too much data to non-sophisticated users might lead to misuse or
misinterpretation.
As Sandra Putnam noted, members of the local health councils are
generally not trained in health assessment; they consist of mayors, police chiefs,
physicians and nurses. The University of Tennessee, Knoxville therefore has
offered training in the use of the HIT system. They try to teach people about age
adjustment, combining data over three to five years, but had to spend a
considerable amount of time simply helping people use the web itself. In
Statistical Issues in Web-Based Public Health Data Systems 42
Washington, an independent epidemiologist-demographer consultant uses
VistaPH to help counties with less sophistication prepare health profiles.
David Solet in Washington notes that users need sophistication in
designing assessment studies and interpreting the results, not in operating the
system. Much of the training for VistaPH has focused on basic epidemiology and
using Excel to make graphs. Washington has also posted “Assessment
guidelines” on the web (Washington State Department of Health, 2001). Richard
Hoskins notes, similarly, the issue is not the technology but being sure that
people know how to use it properly. Hoskins therefore does training on proper
ways to do disease mapping, not just on how to use the EpiQMS to do it.
One approach to dealing with users who are not trained in public health
assessment is to develop standard reports for the web-based data dissemination
system. MassCHIP, for instance, has “Instant Topics” reports for Healthy
People 2010, Healthy Start, minority health, and others topics. Standard reports
of this type not only make the system easier to use, but also ensure that users
employ appropriate and comparable variables for their community health profiles.
Users might also take these reports as models for other topics. Massachusetts is
also developing “wizards” to help occasional users.
Some states use a peer education approach. Minnesota, for instance, has
an epidemiology users group that meets regularly. This group, which includes
epidemiologists from a variety of program areas, has helped the state adopt the
2000 standard population and deal with other data policy issues. The group has
also given guidance regarding the development of the state’s web-based
dissemination system and its members train one another in the system’s use.
Statistical Issues in Web-Based Public Health Data Systems 43
A number of the state web-based dissemination systems are currently
being used as part of the curriculum in schools of public health and other
academic institutions. In addition to training future users in the use of the system
and in public health assessment techniques more generally, presentations to
colleges and universities help to raise awareness about the system itself.
Most users, however, will not have the opportunity for such training. Web-
based dissemination systems, therefore, incorporate various approaches to
training and documentation. These include on-line tutorials, context-sensitive
help screens, and help desks. Web-based dissemination systems also point
users to external training material at the National Center for Health Statistics
(NCHS, 1999), the Centers for Disease Control and Prevention, professional
organizations and universities.
Tennessee’s HIT system does age adjustment, and its associated
educational efforts focus on when and why rather than how. The system also
provides a variety of charts, as well as user-defined comparisons and ranking
tools, which are seen as a way to lead users to proper analyses. The HIT
system does not use more sophisticated models because its developers feel that
the system’s users are more comfortable with “real” counts and rates and are not
sure how the users would interpret the results. As is common in other states,
Tennessee users often want only the data for their own area, so the system does
not merge data from adjacent areas.
Statistical Issues in Web-Based Public Health Data Systems 44
Conclusions and recommendations
Ever since computers were introduced, statisticians have been concerned
that the availability of data and statistical software would lead untrained users to
make mistakes. While this is probably true to some extent, restricting access to
data and software is not likely to succeed in public health. Introduction of
interactive web-based dissemination systems, on the other hand, should be seen
as an important opportunity to develop and extend data standards in public
health data systems.
Educational efforts building on the dissemination software itself, as well as
in more traditional settings, are likely to be more effective in reducing improper
use of data than restricting access. For many users, such training will need to
include content on using public health data, not just on using web-based
systems. The development of standard reports for web-based systems can be
an effective means for disseminating data standards.
Data validation
Before public health data are published in printed form, subject matter and
statistical experts review the tables and charts to ensure that errors or
inconsistencies in the data are found and corrected. When web-based
dissemination systems create analyses that have not gone through this process,
embarrassing errors can occur. This is especially true when web-based systems
allow for more geographical detail than is otherwise published. Suppose, for
instance, that data are available by Zip code. Transposition or geocoding errors
might assign a small number of cases from a large city to a rural area with a
Statistical Issues in Web-Based Public Health Data Systems 45
similar Zip code. Errors of this sort would not be noticed in state-level analyses,
or in the large city. In areas with small population and few deaths, however, the
addition of one or two miscoded cases would, in relative terms, be a major error.
Errors in web-based data dissemination systems are of two types. First,
there are errors in the raw data and in any measures that are based on them.
Second, data systems themselves can introduce errors in processing or
statistical analysis. Validation approaches can address one or both of these
sources. Errors occur because data systems make at least three
transformations: (1) from individual records to statistical variables for different
geographical areas, demographic groups, and so on (2) from variables as
originally recorded to recoded measures that are more comparable across
datasets and more suitable for data analysis and (3) from one data definition to
another to account for differences in data standards from year to year in the
same datasets. Processing of missing and unknown values can also lead to
problems.
State health data centers have taken a variety of approaches to data
validation. MassCHIP, for instance, strives for “100% validation.” Every time a
small change is made in the system, its developers test for unintended changes
elsewhere. This requires many hours of trying the system on real data,
comparing to previous reports (published and unpublished), and looking for
suspicious results. Substance experts are also involved in validation efforts. In
Washington, there are three to four people in the department with their own
programs, and they compare their results “all the time” to make sure that they get
the same results as VistaPH. They use a “re-extraction” process that looks back
Statistical Issues in Web-Based Public Health Data Systems 46
over 20 years of data. Similarly, before the Tennessee system is opened to the
public, it is checked against every available printed report (published or in-
house). Better documentation of what is already done would be useful to other
states, whether they currently have web-based dissemination systems or are
developing them.
Another approach is to use the same dataset for every purpose. In
Washington, for instance, the state health data center releases the same data to
VistaPH and EpiQMS as to NCHS and others, so it benefits from multiple internal
edits. Because there are so many users, many people look at these data and
urge them to make corrections when needed. Validation efforts of this sort,
however, can only detect errors due to processing or statistical calculations,
since every system has the same raw data.
Conclusions and recommendations
No statistical techniques can guarantee that there will be no errors in web-
based data systems. Careful and constant checking of both the data and the
dissemination system, as well as a policy of releasing the same data files to all
users, however, can substantially reduce the likelihood of errors. Methods for
validation should be documented and shared among states.
The development of web-based dissemination systems is an opportunity
to implement data standards rather than a problem to be solved. Efforts to check
the validity of the data for web dissemination purposes may actually improve
overall data quality in state public health data systems.
Statistical Issues in Web-Based Public Health Data Systems 47
CONCLUSIONS
Web-based systems offer state health data centers an important
opportunity to disseminate data to public health professionals, local government
officials, and community leaders, and in the process raise the profile of health
issues and involve more people in community-level decision making. Web-based
dissemination systems, because they require that multiple data systems be put
into a common format, present opportunities to disseminate appropriate data
standards and thereby unify state data systems. The work required to validate
the data in the systems can also result in better overall quality data in the state
system.
The primary statistical concerns with web-based dissemination systems
relate to small numbers. In particular, data for small population groups can be
lacking in statistical reliability, and also can have the potential for releasing
confidential information about individuals. These concerns are present in all
statistical publications but are more acute in web-based systems because of their
focus on presenting data for small geographical areas. Data suppression can
resolve some of these problems but results in a significant loss of information.
Aggregation, whether advised or automatic, is preferable but also results in a
loss of information. Formal statistical methods (confidence intervals, significance
tests, geographical and model-based smoothing, and other methods for small
area statistics) allow the maximum amount of information to be disseminated
while at the same time honestly communicating to users about statistical
reliability and protecting the confidentiality of individual health data. While
Statistical Issues in Web-Based Public Health Data Systems 48
models of this sort exist in other areas, their application in public health has been
limited and should be further explored.
The further development and use of web-based data dissemination
systems will depend on a good understanding of the systems’ users and their
needs. System designers will have to balance between enabling users and
protecting them from themselves. Systems will also have to develop ways to
train users; not only in how to use the systems themselves, but also on statistical
issues in general and the use of public health data.
Research to develop and implement new statistical methods, and to better
understand and address users’ needs, is a major investment. Most states do not
have the resources to do this on their own. Federal agencies, in particular
through CDC’s Assessment Initiative, could help by enabling states to share
information with one another, and by supporting research on the use of new
statistical methods and on data system users.
Statistical Issues in Web-Based Public Health Data Systems 49
REFERENCES
Anderson RN, Rosenberg HM, 1998. Age Standardization of Death Rates:Implementation of the Year 2000 Standard. National Vital Statistics Reports, 47;20 pp. (PHS) 98-1120.
Centers for Disease Control and Prevention, undated. Behavioral Risk FactorSurveillance System. [www.cdc.gov/brfss/index.htm]
CDC, undated. Supporting public health surveillance through the NationalElectronic Disease Surveillance System (NEDSS).[www.cdc.gov/od/hissb/docs/NEDSS%20Intro.pdf]
Cohen BB, 2001. Guidelines for the release of aggregate statistical data:Massachusetts perspective on issues and options. Presentation at theAssessment Initiative/NAPHSIS Conference, September 12, 2001.
Department of Health and Human Services, 2000. Healthy People 2010:Understanding and Improving Health. Washington: Government Printing Office.
Devine OJ, and Louis TA, 1994. A constrained empirical Bayes estimator forincidence rates in areas with small populations. Statistics in Medicine 13: 1119-33.
Doyle P, Lane JI, Theeuwes JJM, and Zayatz LM, eds., 2001. Confidentiality,Disclosure, and Data Access: Theory and Practical Application for StatisticalAgencies. Amsterdam: Elsevier Science BV.
Duncan GT, Fienberg SE, Krishnan R, Padman R, Roehrig SF, 2001.Disclosure limitation methods and information loss for tabular data. Chapter 7 inConfidentiality, Disclosure, and Data Access: Theory and Practical Application forStatistical Agencies, Doyle P, Lane JI, Theeuwes JJM, and Zayatz LM, eds.Amsterdam: Elsevier Science BV.
Duncan GT, 2001. Confidentiality and statistical disclosure limitation. InInternational Encylopedia of the Social and Behavioral Sciences (cited in Duncanet al., 2001).
Federal Committee on Statistical Methodology, 1994. Statistical Policy WorkingPaper 22 – Report on Statistical Disclosure Limitation Methodology.Washington: Statistical Policy Office, Office of Management and Budget.
Fienberg SE, Makov UE, Steele RJ, 1998. Disclosure limitation usingperturbation and related methods for categorical data. Journal of OfficialStatistics 14: 485-502.
Statistical Issues in Web-Based Public Health Data Systems 50
Friedman DJ, Anderka M, Krieger JW, Land G, Solet D, 2001. Accessingpopulation health information through interactive systems: Lessons learned andfuture directions. Public Health Reports 116: 116-147.
Gostin LO, 2001. National Health Information Privacy: Regulations Under theHealth Insurance Portability and Accountability Act. JAMA 285: 3015-3019.
Health Resources and Services Administration (HRSA), 2000. CommunityHealth Status Indicators Project. [www.communityhealth.hrsa.gov]
Institute of Medicine (IOM), 1996. Healthy Communities: New Partnerships forthe Future of Public Health, Stoto MA, Abel C, and Dievler A, eds. Washington:National Academy Press.
IOM, 1997. Improving Health in the Community: A Role for PerformanceMonitoring, Durch JS, Bailey LA, and Stoto MA, eds. Washington: NationalAcademy Press.
Land G, undated. Confidentiality data release rules.
Metropolitan Washington Public Health Assessment Center, 2001. CommunityHealth Indicators for the Washington Metropolitan Region.
National Center for Health Statistics, undated. Web-Based Resource CenterWork Group Suggested Web Sites for Health Data Standards.[www.cdc.gov/nchs/otheract/phdsc/wbasedwg_sites.htm]
NCHS, 1999. Public Health: Our Silent Partner.[www.cdc.gov/nchs/products/training/phd-osp.htm]
National Research Council (NRC), 2000a. Small-Area Estimates of School-AgeChildren in Poverty: Evaluation of Current Methodology. Citro CF and Kalton G,eds. Washington: National Academy Press.
NRC, 2000b. Small-Area Income and Poverty Estimates: Priorities for 2000 andBeyond. Citro CF and Kalton G, eds. Washington: National Academy Press.
Pickle LW, Mungiole M, Jones GK, White AA, 1996. Atlas of United StatesMortality. DHHS Publication No. (PHS) 97-1015. Hyattsville, MD: U.S.Department of Health and Human Services.
Shen W, Louis TA, 1999. Empirical Bayes estimation via the smoothing byroughening approach. J. Computational and Graphical Statistics, 8: 800-823.
Shen W, Louis TA, 2000. Triple-goal estimates for disease mapping. Statisticsin Medicine, 19: 2295-2308.
Statistical Issues in Web-Based Public Health Data Systems 51
Sweeney L, 1997. Weaving technology and policy together to maintainconfidentiality. J Law Med Ethics, 25(2-3): 98-110.
Sweeney L, 1998. Privacy and medical-records research. NEJM, 338(15):1077.
UCLA Center for Health Policy Research, 2002. California Health InterviewSurvey Fact Sheet.[www.healthpolicy.ucla.edu/publications/CHIS_Fact_Sheet_A.pdf]
U.S. Department of Health and Human Services (DHHS), 2000. Healthy People2010: Understanding and Improving Health. Washington: Government PrintingOffice.
Washington State Department of Health, 2001. Data guidelines.[www.doh.wa.gov/Data/Guidelines/guidelines.htm]
Zaslavsky AM, Horton NJ, 1998. Balancing disclosure risk against the loss ofnonpublication. Journal of Official Statistics 14: 411-419.
Statistical Issues in Web-Based Public Health Data Systems 52
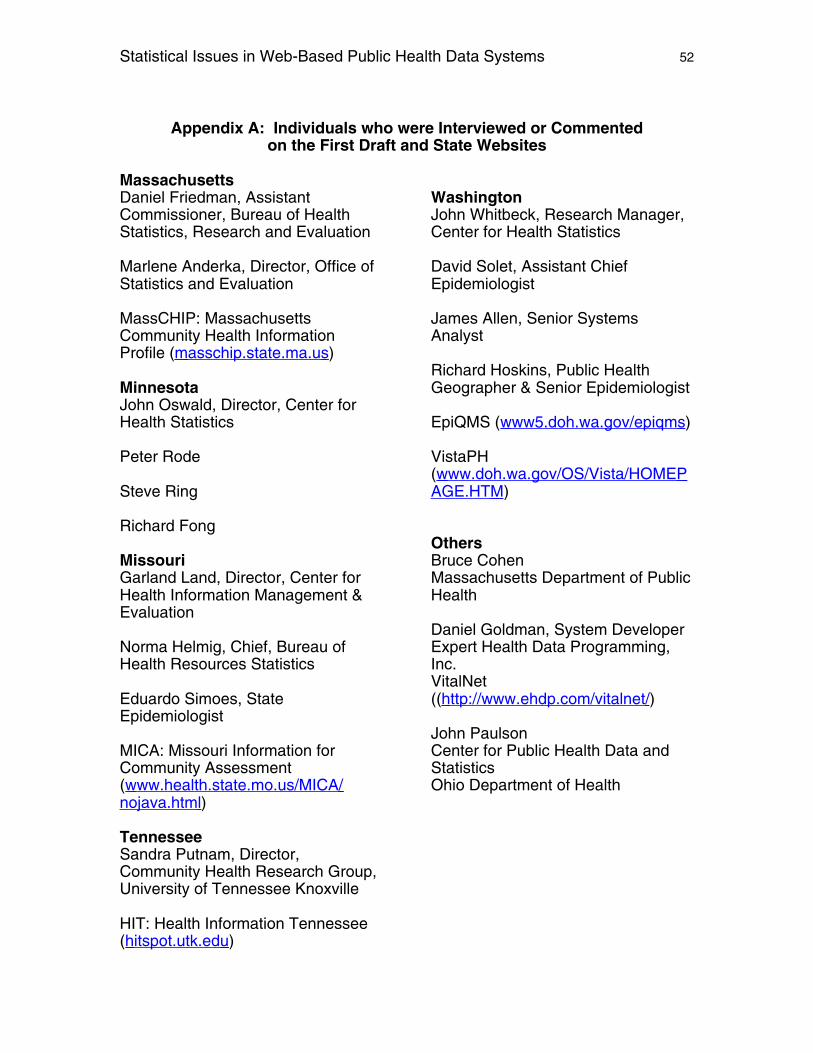
Appendix A: Individuals who were Interviewed or Commentedon the First Draft and State Websites
MassachusettsDaniel Friedman, AssistantCommissioner, Bureau of HealthStatistics, Research and Evaluation
Marlene Anderka, Director, Office ofStatistics and Evaluation
MassCHIP: MassachusettsCommunity Health InformationProfile ( masschip.state.ma.us )
MinnesotaJohn Oswald, Director, Center forHealth Statistics
Peter Rode
Steve Ring
Richard Fong
MissouriGarland Land, Director, Center forHealth Information Management &Evaluation
Norma Helmig, Chief, Bureau ofHealth Resources Statistics
Eduardo Simoes, StateEpidemiologist
MICA: Missouri Information forCommunity Assessment( www.health.state.mo.us/MICA/ nojava.html )
TennesseeSandra Putnam, Director,Community Health Research Group,University of Tennessee Knoxville
HIT: Health Information Tennessee( hitspot.utk.edu )
WashingtonJohn Whitbeck, Research Manager,Center for Health Statistics
David Solet, Assistant ChiefEpidemiologist
James Allen, Senior SystemsAnalyst
Richard Hoskins, Public HealthGeographer & Senior Epidemiologist
EpiQMS ( www5.doh.wa.gov/epiqms )
VistaPH( www.doh.wa.gov/OS/Vista/HOMEP AGE.HTM )
OthersBruce CohenMassachusetts Department of PublicHealth
Daniel Goldman, System DeveloperExpert Health Data Programming,Inc.VitalNet(( http://www.ehdp.com/vitalnet/ )
John PaulsonCenter for Public Health Data andStatisticsOhio Department of Health
Statistical Issues in Web-Based Public Health Data Systems 53
Appendix B: Review Meeting ParticipantsHarvard School of Public Health
Boston, MassachusettsAugust 6 and 7, 2002
Marlene AnderkaOffice of Statistics and EvaluationMassachusetts Department of PublicHealth
Susan ElderCenter for Health InformationManagement and EvaluationMissouri Department of Health andSenior Services
Dan FreidmanAssistant CommissionerMassachusetts Department of PublicHealth
Tim GreenDivision of Public HealthSurveillance & InformaticsEpidemiology Program OfficeCenters for Disease Control andPrevention
Patricia GuhlemanBureau of Health InformationDivision of Health Care FinancingWisconsin Department of Health andFamily Services
Stepahnie HaasSchool of Information and LibraryScienceUniversity of North Carolina
Ken HarrisNational Center for Health Statistics,Centers for Disease Control andPrevention
Steve LagakosDepartment of BiostatisticsHarvard School of Public Health
Luis PaitaNational Association of Health DataOrganizations
Sandra PutnamCommunity Health Research GroupUniversity of Tennessee-Knoxville
Jamie RitcheyNational Association of Public HealthStatistics and Information Systems
Tim StephensNational Association of Public HealthStatistics and Information Systems
Michael StotoRAND and Department ofBiostatisticsHarvard School of Public Health
Neil ThomasEast Tennessee State University
Al ZarateNational Center for Health Statistics
Alan ZaslavskyDepartment of Health Care PolicyHarvard Medical School
Statistical Issues in Web-Based Public Health Data Systems 54
Appendix C: Glossary
Complementary suppression: Suppression of cells in the same row or column ofa small cell to avoid discovery of the number of cases by subtraction.
Confidence interval: A statistical interval based on a statistical sample calculatedin such a way that it will include the value of the populations statistic beingestimated with a certain likelihood, usually 95 percent. The confidence intervalcan be interpreted as a range of values that we are reasonably confidentcontains the true (population) [proportion]. “or parameter” - TG
Confidentiality: The ability (or inability) to identify the individuals, small groups ofindividuals, or other entities represented in a database and use information in thedatabase to discover their characteristics that would otherwise not be known.
Geographic smoothing: Statistical technique to provide more reliable estimatesfor small areas, based on the assumption that geographically proximate areashave similar health outcomes.
Hierarchical Bayesian modeling: Statistical technique to provide more reliableestimates for small areas, based on the assumption that non-geographic factorssuch as socioeconomic status are related to health outcomes.
Hypothesis tests: Statistical technique to determine whether differences(between groups or over time) are due to chance.
Microdata: Individual-level data.
Sampling variability: Uncertainty in statistical estimates based on a randomsample due to the sampling itself, i.e. that repetitions of the same samplingprocess would yield slightly different results due to random selection.
Standardization: Statistical adjustment to reflect differences (usually in the ageand sex distribution) between two populations being compared.
Stochastic variability: Uncertainty in statistical estimates due to natural variabilityin the process being measured. For instance, even though two communities mayhave the same, unchanging conditions that affect mortality, and 5 cases wouldbe expected in each community every year, the actual number in any given yearcould be 3 and 8, 6 and 7, and so on, simply due to chance.