Statistical Projection of Global Climate Change Scenarios onto Hawaiian Rainfall Oliver Timm, International Pacific Research Center, SOEST, University of Hawai'i at Manoa Henry Diaz, NOAA/ESRL/CIRES, Boulder, Colorado
Transcript
Statistical Projection of Global
Climate Change Scenarios onto
Hawaiian RainfallOliver Timm,
International Pacific Research Center, SOEST, University of
Hawai'i at Manoa
Henry Diaz, NOAA/ESRL/CIRES, Boulder, Colorado
Climate Change in the News
Hawaii researchers to look at effect of
global warming on the islands,
USA TODAY, Aug, 14, 2006
UH to study how global warming affects isles,
Star*Bulletin, Aug, 13, 2006
Floods, hotter climate in Isles likely by 2090,
Honolulu Advertiser, Feb., 25, 2007
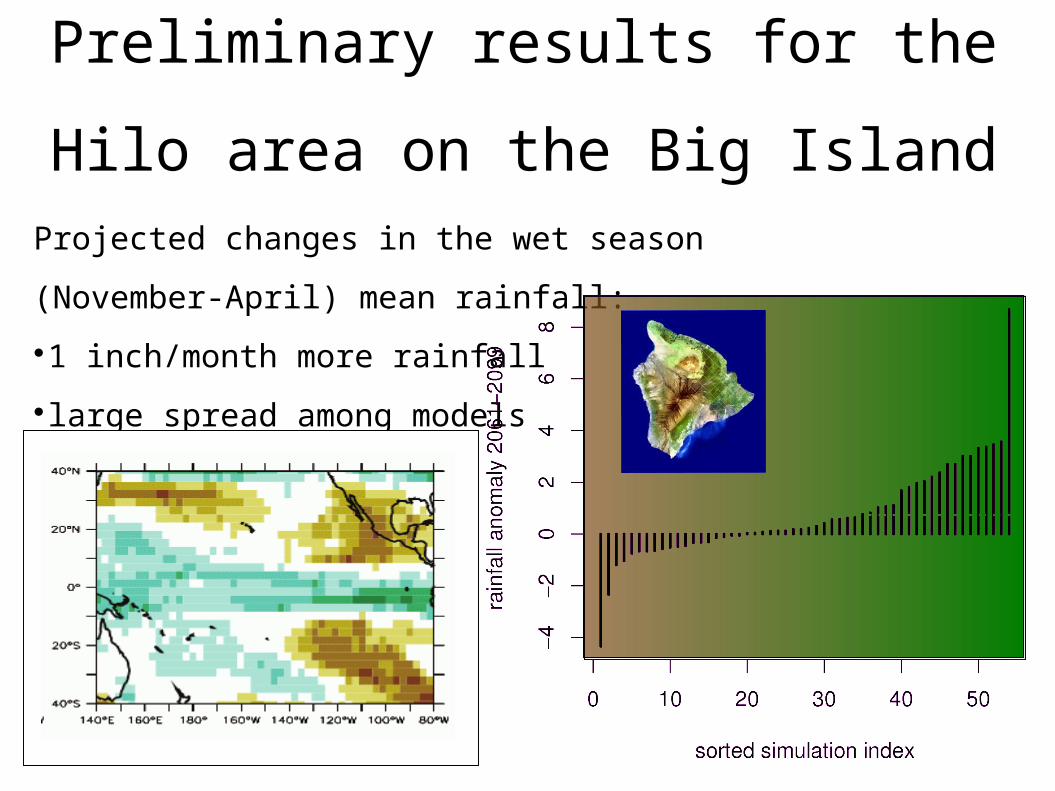
Presentation overview Introduction
What is the present knowledge of Hawaii's rainfall
changes during the 21st century?
Uncertainty in future climate change projections
The idea behind statistical downscaling
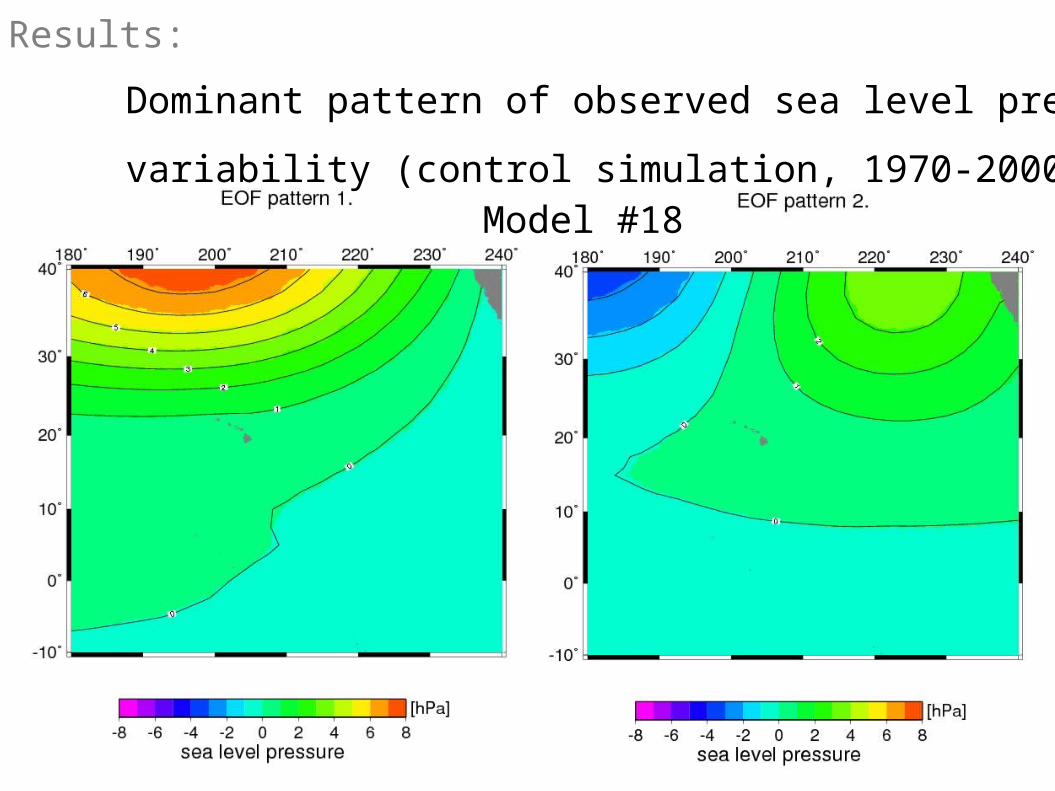
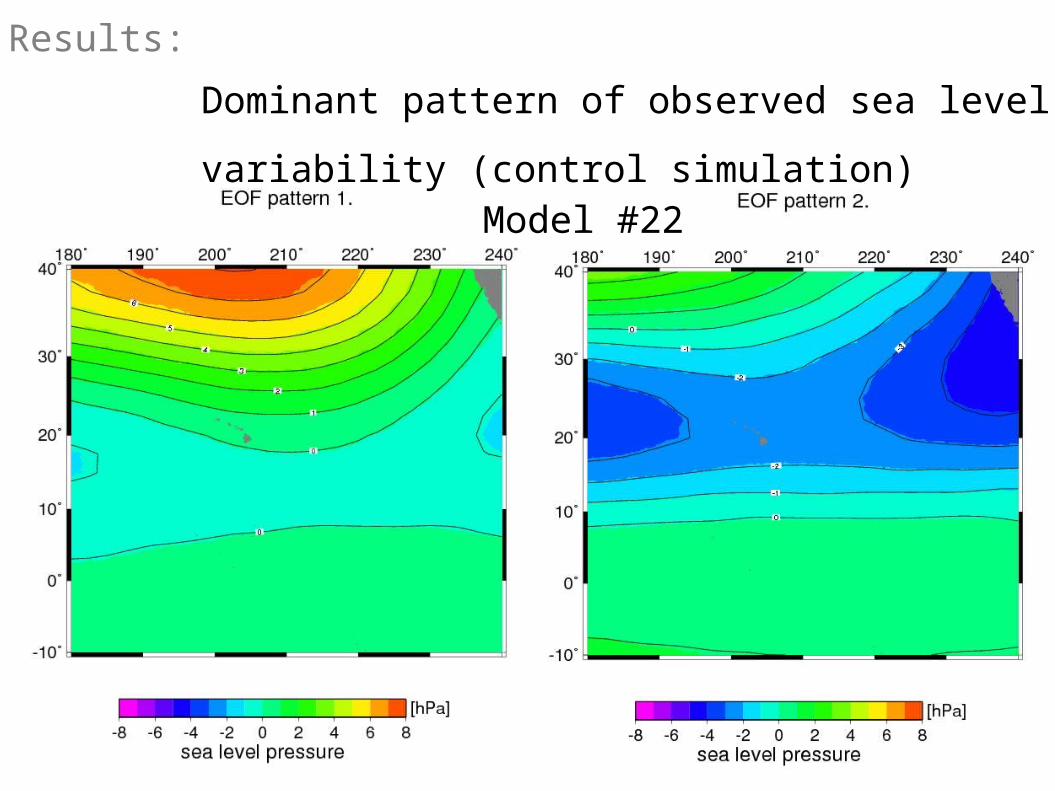
Results from the statistical downscaling Connection between large-scale circulation changes
and regional precipitation
Discussion & Outlook
Introduction:
What is the scientific information
behind our present understanding of rainfall changes
over Hawaii?
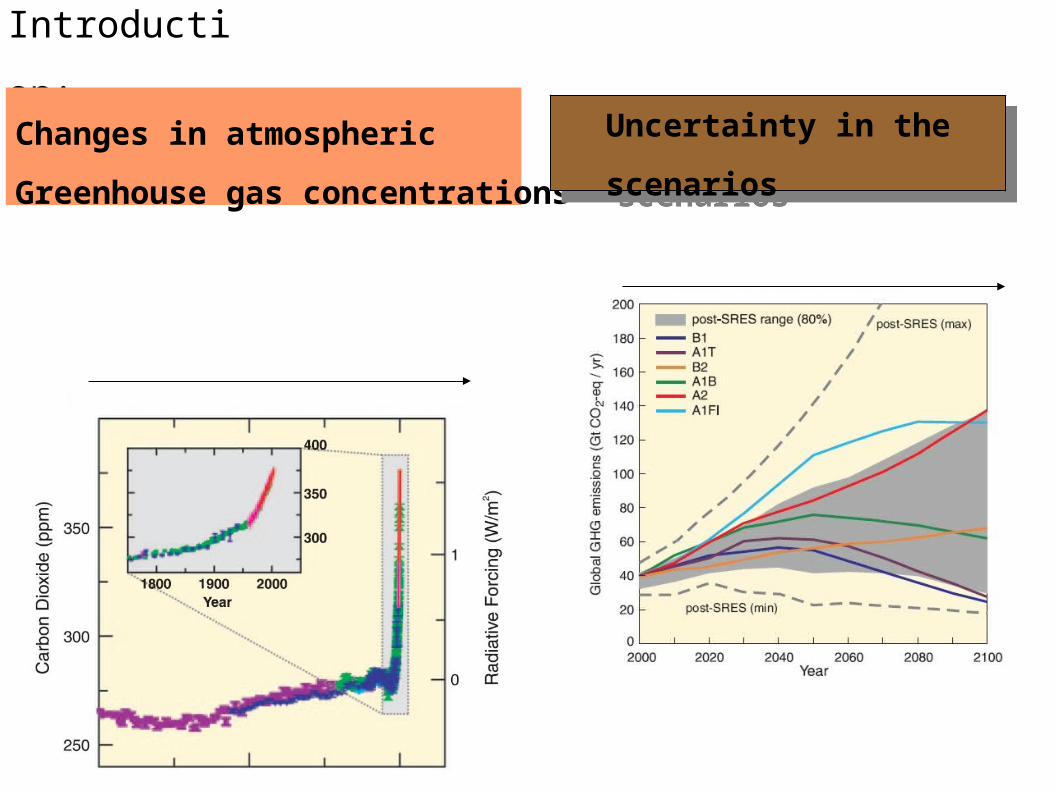
Introduction:
Changes in atmospheric
Greenhouse gas concentrations
CO2 during the last 1000 years
CO2 emission 2000-2100
Uncertainty in the scenariosUncertainty in the scenarios
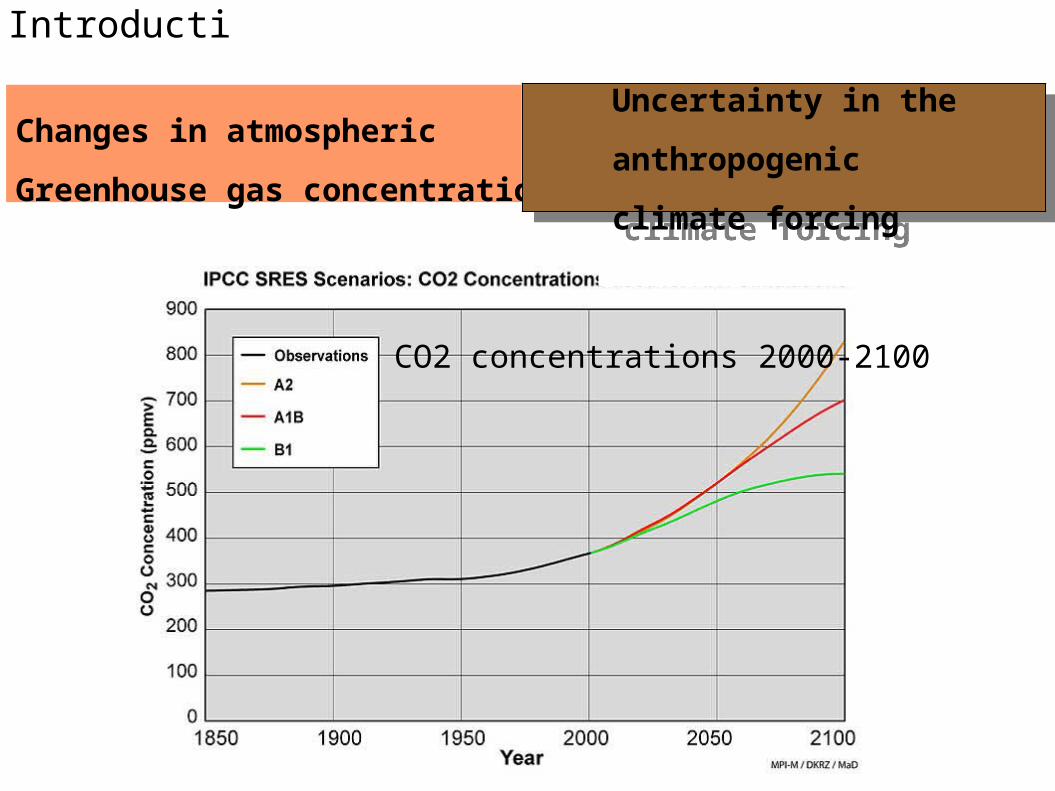
Introduction:
Changes in atmospheric
Greenhouse gas concentrations
Uncertainty in the anthropogenic
climate forcing
Uncertainty in the anthropogenic
climate forcing
CO2 concentrations 2000-2100
CO2 concentrations 2000-2100
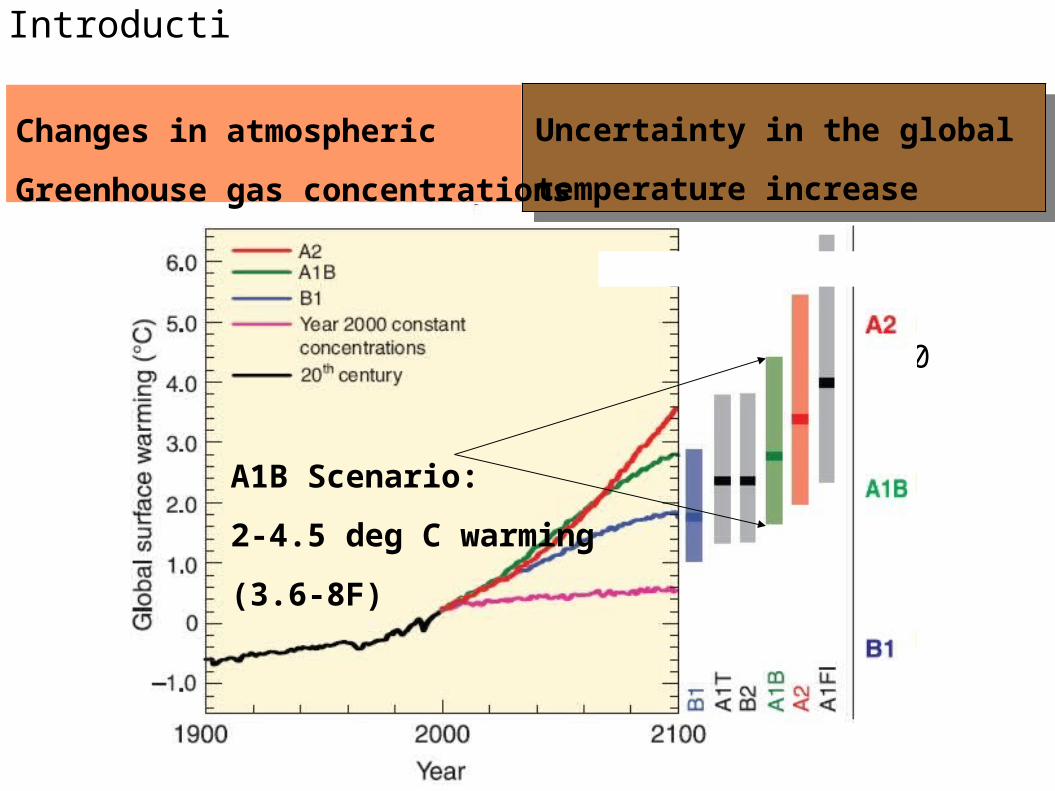
A1B Scenario:
2-4.5 deg C warming
(3.6-8F)
Introduction:
Uncertainty in the global
temperature increase
Uncertainty in the global
temperature increase
Changes in atmospheric
Greenhouse gas concentrations
Introduction:
Dynamical or statistical
downscaling methodsGreenhouse
gas emission
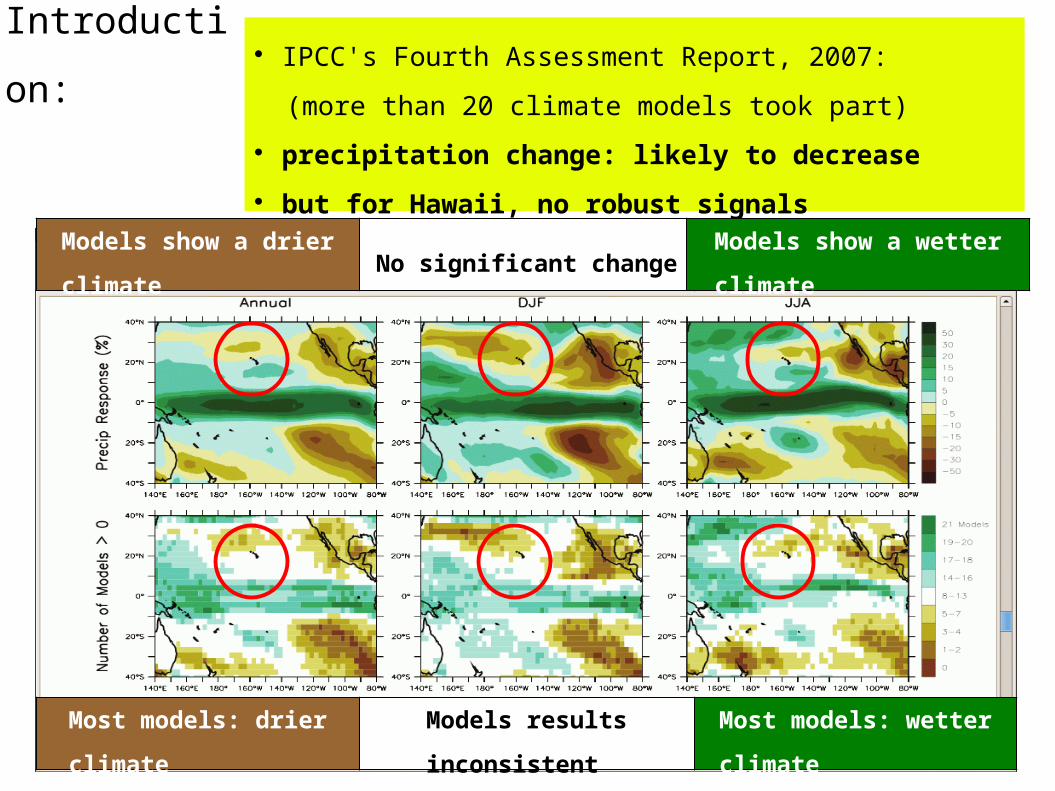
Uncertainties in regional projections of climate change
IPCC's Fourth Assessment Report, 2007:
(more than 20 climate models took part)
precipitation change: likely to decrease
but for Hawaii, no robust signalsModels show a drier
climate
Models results inconsistentMost models: drier climateMost models: wetter
climate
No significant changeModels show a wetter
climate
Introduction:
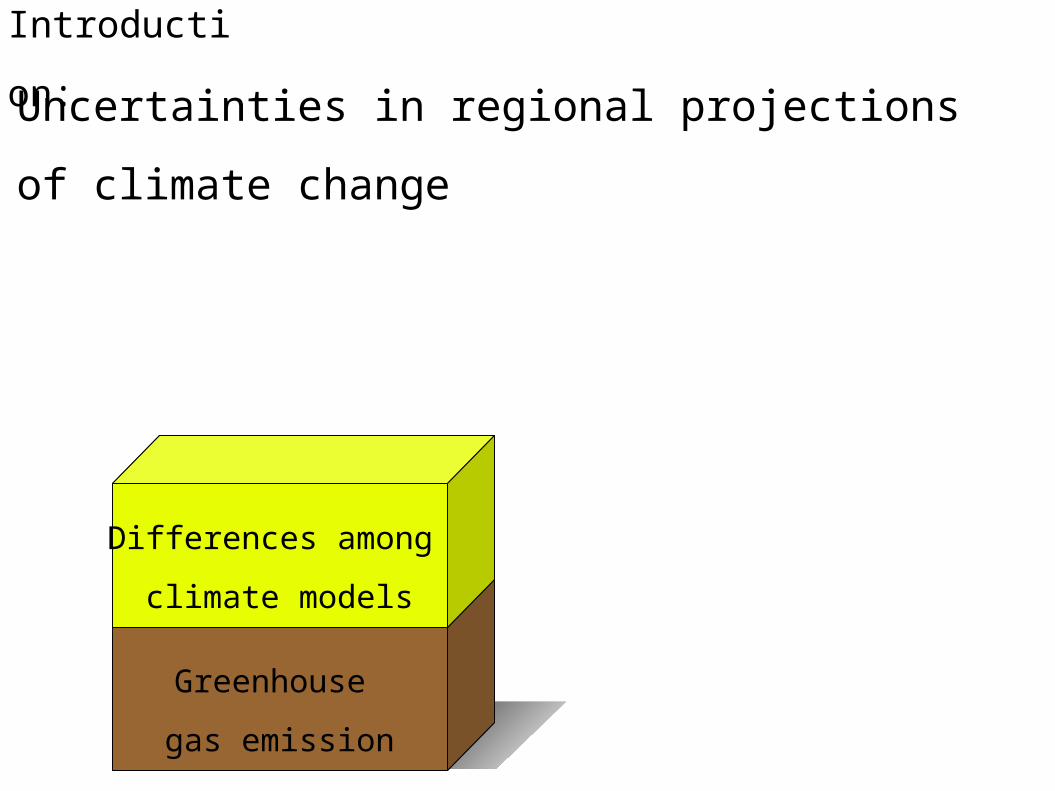
Uncertainties in regional projections of climate change
Introduction:
Dynamical or statistical
downscaling methodsGreenhouse
gas emission
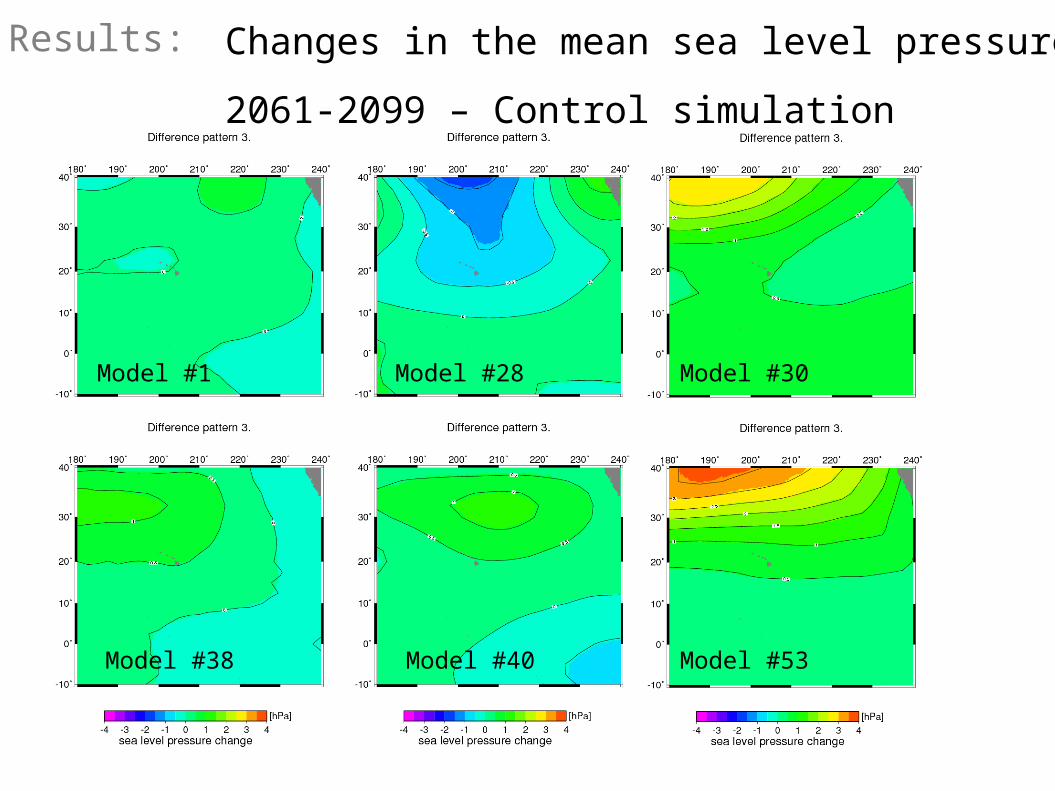
Differences among
climate models
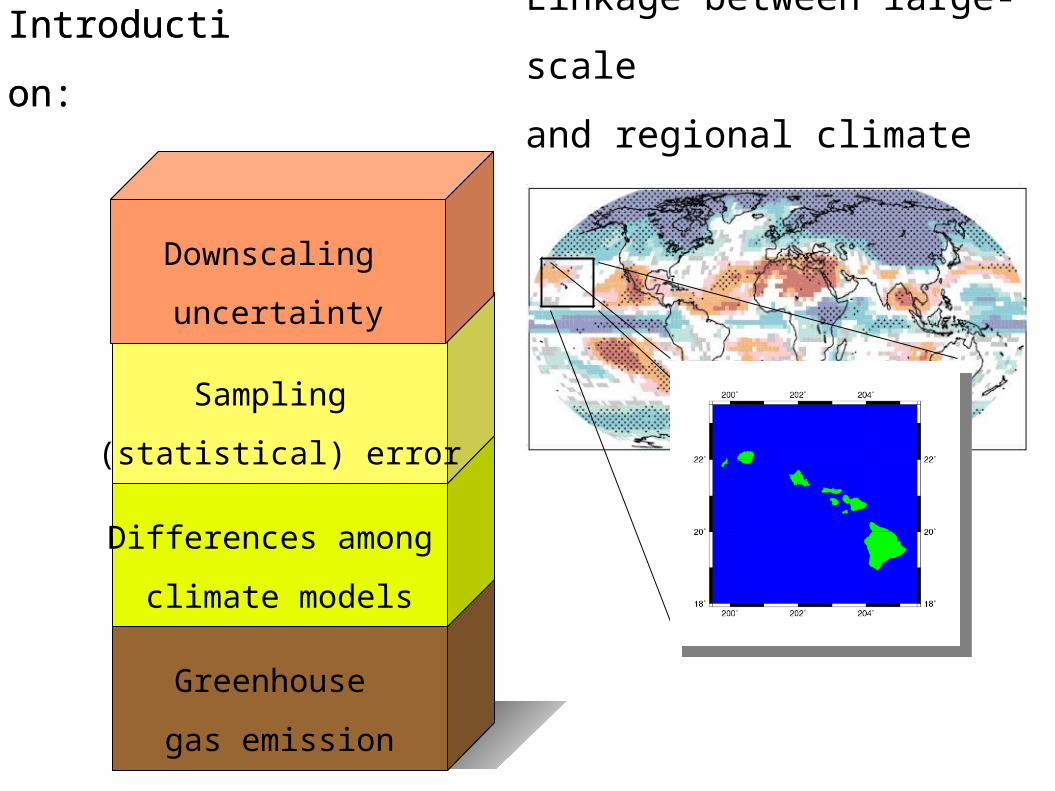
Uncertainties in regional projections of climate change
Introduction:
Dynamical or statistical
downscaling methodsGreenhouse
gas emission
Differences among
climate models
Sampling
(statistical) error
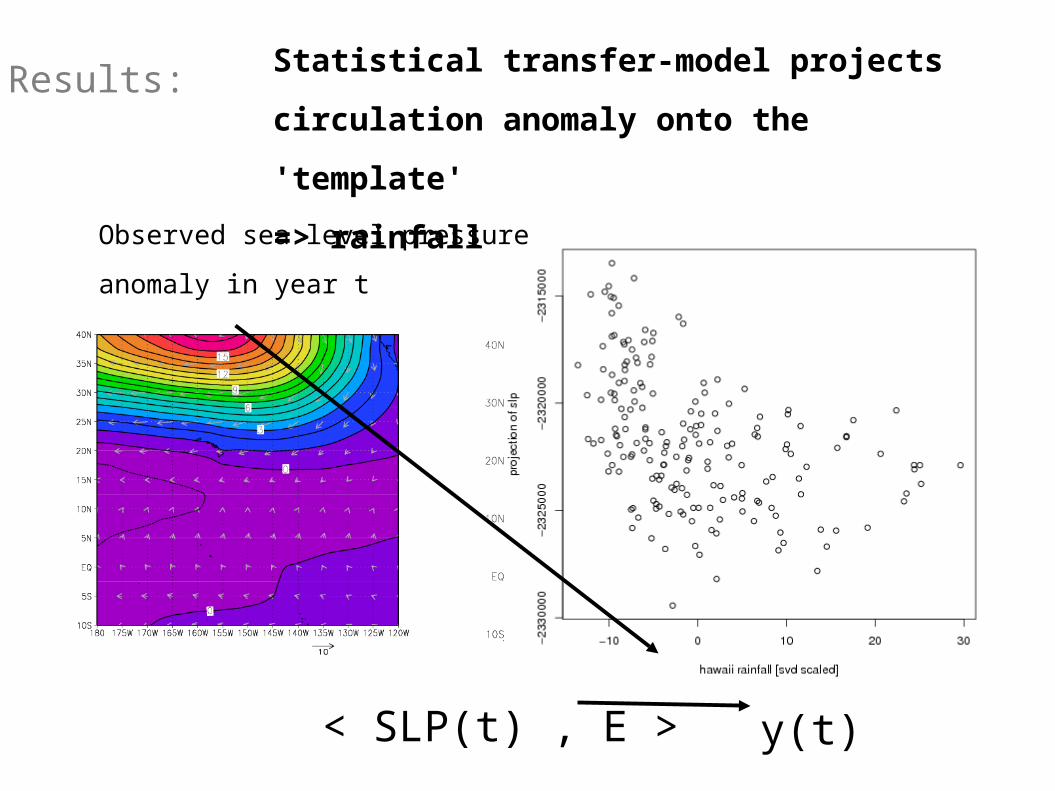
Linkage between large-scale
and regional climate changes
Introduction:
Dynamical or statistical
downscaling methodsGreenhouse
gas emission
Differences among
climate models
Sampling
(statistical) error
Downscaling
uncertainty
Introduction:
Goal of downscaling procedure: Reducing the
uncertainties of projected regional climate change
Statistical/dynamical/expert
information
Introduction:
Ad hoc (unguided)
downscaling
uncertainty
downscaling
uncertainty
Introduction:
What is the scientific information
behind our present understanding of rainfall changes
over Hawaii?
+
Statistical,
dynamical,
and elaborated
experts' estimates
Regional downscaling projects:
The Prediction of Regional scenarios and Uncertainties
for Defining Euorpean Climate change
risks and Effects (PRUDENCE)
Their goal: Provide a dynamically downscaled scenario for Europe
Huge project > 20 research groups!
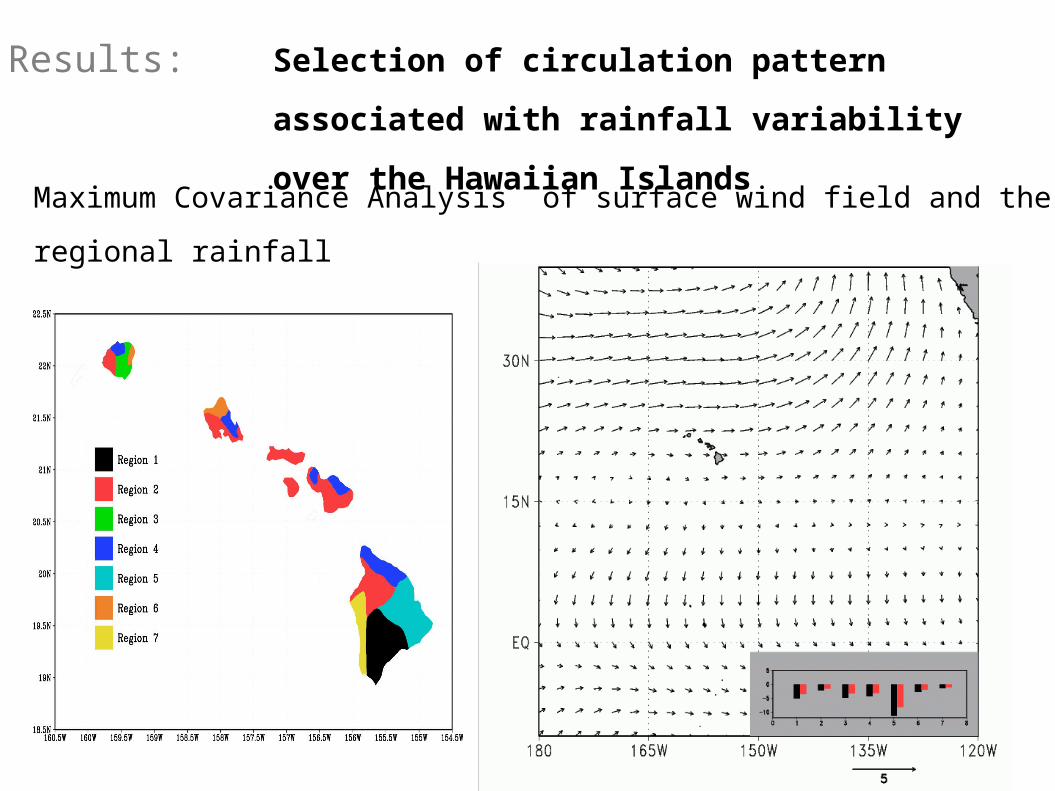
Key steps in downscaling procedure:
1) Investigating the physical links between Hawaiian rainfall and