MOJ Civil Engineering Statistical Quantification of Zanjan City Structures Based on FEMA 154 Submit Manuscript | http://medcraveonline.com Introduction The approach for rapid vulnerability assessment is based on visual inspection [1-4]. In this approach, which has been extensively used in large scale, by visual inspection of the buildings a set of parameters would be investigated, from which the buildings vulnerability level could be evaluated. Figure 1 indicates the collected data for any typical building according to FEMA P-154 (FEMA, 2015). The collected information would be enriched by supplemental data which helps to have an accurate estimation of building vulnerability level. Next, based on the statistical analysis, the sources of the residential buildings vulnerability are determined. As it is represented in Figure 1, the assigned “Basic Score” based on the type of the lateral seismic system is in-between 1 and 3.6. According to the characteristics of each building, there are either positive or negative scores added to this “Basic Score”, which indicates the actual vulnerability level for any specified structure. Subsequently, the building vulnerability score is compared with the upper and lower band limits to conclude if the building is safe, or it needs any retrofit, or it is out of the normal operating conditions and should be demolished. Based on the appendices of FEMA 154, there is a designed evaluation form to supplement the original vulnerability assessment forms of FEMA 154 which has 27 questions regarding the general assembly of the building. The questions on this form are divided into 7 general categories which would be elaborated as follows: 1. General information of the building to distinguish any building. 2. Structural information such as the type of the seismic bearing system, whether the building has been designed based on seismic codes, having the same lateral seismic resisting (SR) system in height and plan, etc. 3. Questions regarding the irregularity in buildings, specifically in height which can significantly affect the seismic behavior of the building. 4. Consistency in transferring the lateral seismic and gravity loads which could affect the seismic behavior of the structures during the earthquakes. 5. Questions regarding the architectural considerations since they might affect the seismic behavior and structural design of the buildings. 6. The quality of the materials used in the building is one of the important factors contributing to the seismic response of the buildings; therefore, some of the questions are associated with the quality of building materials. 7. Finally, the building vulnerability level would be determined. In addition, any other considerations are noted in this last section of questions. 8. In this study, the mentioned vulnerability level estimation procedures could be utilized for any city in general. In order to better evaluate the seismic vulnerability of Zanjan’s buildings, some of the buildings throughout the city were randomly chosen. To be consistent through the sampling, the city of Zanjan was divided into 13 regions in which each Volume 3 Issue 2 - 2017 1 Department of Civil Engineering, Sharif University of Technology, Iran 2 Department of Civil Engineering, University of Zanjan, Iran *Corresponding author: Arash Kamali-Asl, Department of Civil Engineering, 43 Lotfi Kordestani, Sepehr St, Shahrak- e-Qarb, Tehran, Tehran, Iran, Tel: +1-802-8254949; Email: Received: July 03, 2017 | Published: July 27, 2017 Case Report MOJ Civil Eng 2017, 3(2): 00065 Abstract After introducing the code provisions for vulnerability assessment of the buildings, only more important structure such as state buildings and schools have been retrofitted. Since the most of the cultural and economic costs after any earthquake are associated with the residential buildings, it is important to have a rapid procedure for investigating the vulnerability level of the structures. There are several reasons to rationalize the lack of the vulnerability assessment for residential buildings such as limited financial resources for local governments, and the lack of a generalized mechanism. In this study, the visual vulnerability assessment of the residential buildings in the city of Zanjan, one the major cities located in Iran, has been investigated. In order to perform the rapid vulnerability assessment of the buildings, different approaches have been proposed. The method introduced by ATC-21, later proposed in FEMA-154, is one of the mostly- accepted assessment methods. The goal of the rapid vulnerability assessment of the buildings is to evaluate the most possible number of the buildings over a relatively short period of time, which buildings vulnerability level would be estimated based upon and the general defects’ type could be determined. Keywords: Urban vulnerability assessment; Building defects; Visual rapid inspection; Zanjan City
Transcript
MOJ Civil Engineering
Statistical Quantification of Zanjan City Structures Based on FEMA 154
Submit Manuscript | http://medcraveonline.com
IntroductionThe approach for rapid vulnerability assessment is based
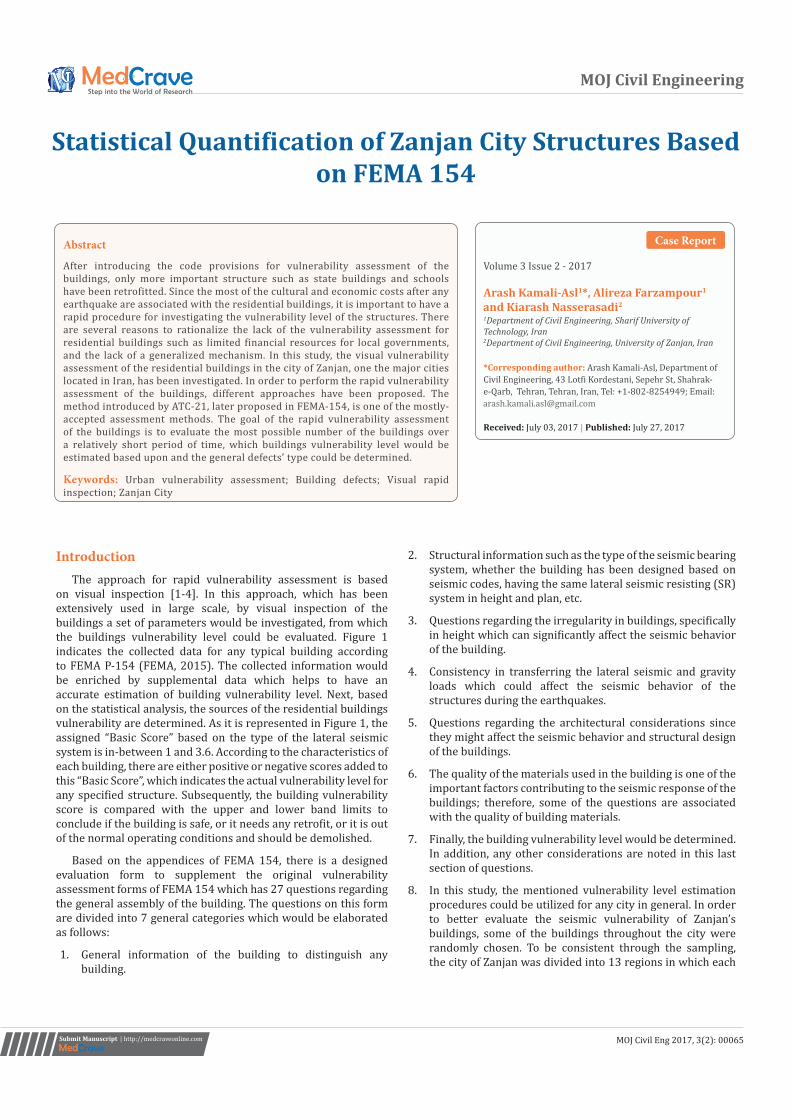
on visual inspection [1-4]. In this approach, which has been extensively used in large scale, by visual inspection of the buildings a set of parameters would be investigated, from which the buildings vulnerability level could be evaluated. Figure 1 indicates the collected data for any typical building according to FEMA P-154 (FEMA, 2015). The collected information would be enriched by supplemental data which helps to have an accurate estimation of building vulnerability level. Next, based on the statistical analysis, the sources of the residential buildings vulnerability are determined. As it is represented in Figure 1, the assigned “Basic Score” based on the type of the lateral seismic system is in-between 1 and 3.6. According to the characteristics of each building, there are either positive or negative scores added to this “Basic Score”, which indicates the actual vulnerability level for any specified structure. Subsequently, the building vulnerability score is compared with the upper and lower band limits to conclude if the building is safe, or it needs any retrofit, or it is out of the normal operating conditions and should be demolished.
Based on the appendices of FEMA 154, there is a designed evaluation form to supplement the original vulnerability assessment forms of FEMA 154 which has 27 questions regarding the general assembly of the building. The questions on this form are divided into 7 general categories which would be elaborated as follows:
1. General information of the building to distinguish any building.
2. Structural information such as the type of the seismic bearing system, whether the building has been designed based on seismic codes, having the same lateral seismic resisting (SR) system in height and plan, etc.
3. Questions regarding the irregularity in buildings, specifically in height which can significantly affect the seismic behavior of the building.
4. Consistency in transferring the lateral seismic and gravity loads which could affect the seismic behavior of the structures during the earthquakes.
5. Questions regarding the architectural considerations since they might affect the seismic behavior and structural design of the buildings.
6. The quality of the materials used in the building is one of the important factors contributing to the seismic response of the buildings; therefore, some of the questions are associated with the quality of building materials.
7. Finally, the building vulnerability level would be determined. In addition, any other considerations are noted in this last section of questions.
8. In this study, the mentioned vulnerability level estimation procedures could be utilized for any city in general. In order to better evaluate the seismic vulnerability of Zanjan’s buildings, some of the buildings throughout the city were randomly chosen. To be consistent through the sampling, the city of Zanjan was divided into 13 regions in which each
Volume 3 Issue 2 - 2017
1Department of Civil Engineering, Sharif University of Technology, Iran2Department of Civil Engineering, University of Zanjan, Iran
*Corresponding author: Arash Kamali-Asl, Department of Civil Engineering, 43 Lotfi Kordestani, Sepehr St, Shahrak-e-Qarb, Tehran, Tehran, Iran, Tel: +1-802-8254949; Email:
Received: July 03, 2017 | Published: July 27, 2017
Case Report
MOJ Civil Eng 2017, 3(2): 00065
Abstract
After introducing the code provisions for vulnerability assessment of the buildings, only more important structure such as state buildings and schools have been retrofitted. Since the most of the cultural and economic costs after any earthquake are associated with the residential buildings, it is important to have a rapid procedure for investigating the vulnerability level of the structures. There are several reasons to rationalize the lack of the vulnerability assessment for residential buildings such as limited financial resources for local governments, and the lack of a generalized mechanism. In this study, the visual vulnerability assessment of the residential buildings in the city of Zanjan, one the major cities located in Iran, has been investigated. In order to perform the rapid vulnerability assessment of the buildings, different approaches have been proposed. The method introduced by ATC-21, later proposed in FEMA-154, is one of the mostly-accepted assessment methods. The goal of the rapid vulnerability assessment of the buildings is to evaluate the most possible number of the buildings over a relatively short period of time, which buildings vulnerability level would be estimated based upon and the general defects’ type could be determined.
Keywords: Urban vulnerability assessment; Building defects; Visual rapid inspection; Zanjan City
Citation: Kamali-Asl A, Farzampour A, Nasserasadi K (2017) Statistical Quantification of Zanjan City Structures Based on FEMA 154. MOJ Civil Eng 3(2): 00065. DOI: 10.15406/mojce.2017.03.00065
Statistical Quantification of Zanjan City Structures Based on FEMA 154 2/6Copyright:
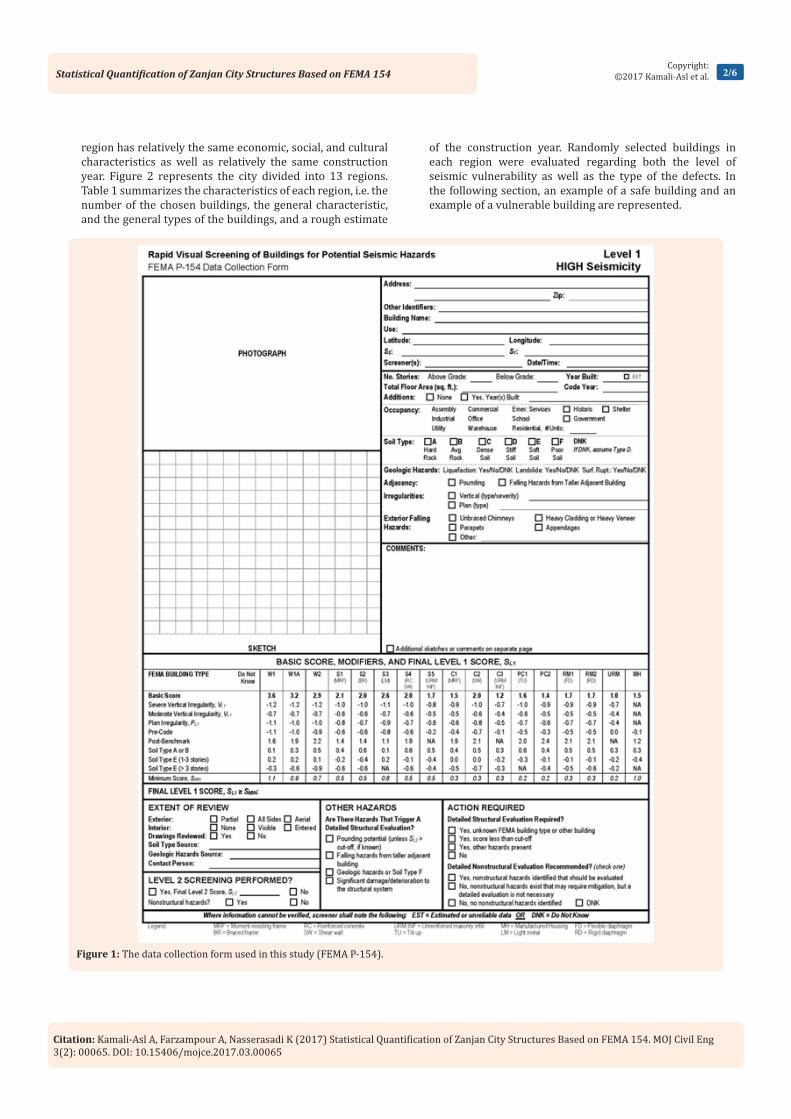
region has relatively the same economic, social, and cultural characteristics as well as relatively the same construction year. Figure 2 represents the city divided into 13 regions. Table 1 summarizes the characteristics of each region, i.e. the number of the chosen buildings, the general characteristic, and the general types of the buildings, and a rough estimate
of the construction year. Randomly selected buildings in each region were evaluated regarding both the level of seismic vulnerability as well as the type of the defects. In the following section, an example of a safe building and an example of a vulnerable building are represented.
Figure 1: The data collection form used in this study (FEMA P-154).
Citation: Kamali-Asl A, Farzampour A, Nasserasadi K (2017) Statistical Quantification of Zanjan City Structures Based on FEMA 154. MOJ Civil Eng 3(2): 00065. DOI: 10.15406/mojce.2017.03.00065
Statistical Quantification of Zanjan City Structures Based on FEMA 154 3/6Copyright:
6 1993-1998 Masonry Some regions with Type D soil 10
7 Prior to 1993 Masonry Irregular buildings 10
8 1998-2007 RC/Steel frame slightly more than masonry Enhanced urban development 10
9 1999-2005 Same Masonry and RC/Steel frame
Low population density, relatively enhanced urban development 8
10 Prior to 1993 Same Masonry and RC/Steel frame Downtown, the most populated region 10
11 1993-1999 Masonry slightly more than RC/Steel frame The old region of the city 10
12 Prior to 1993 Masonry Horrible urban development, very old and vulnerable buildings 10
13 1993-2001 Masonry relatively enhanced urban development, old and vulnerable buildings 10
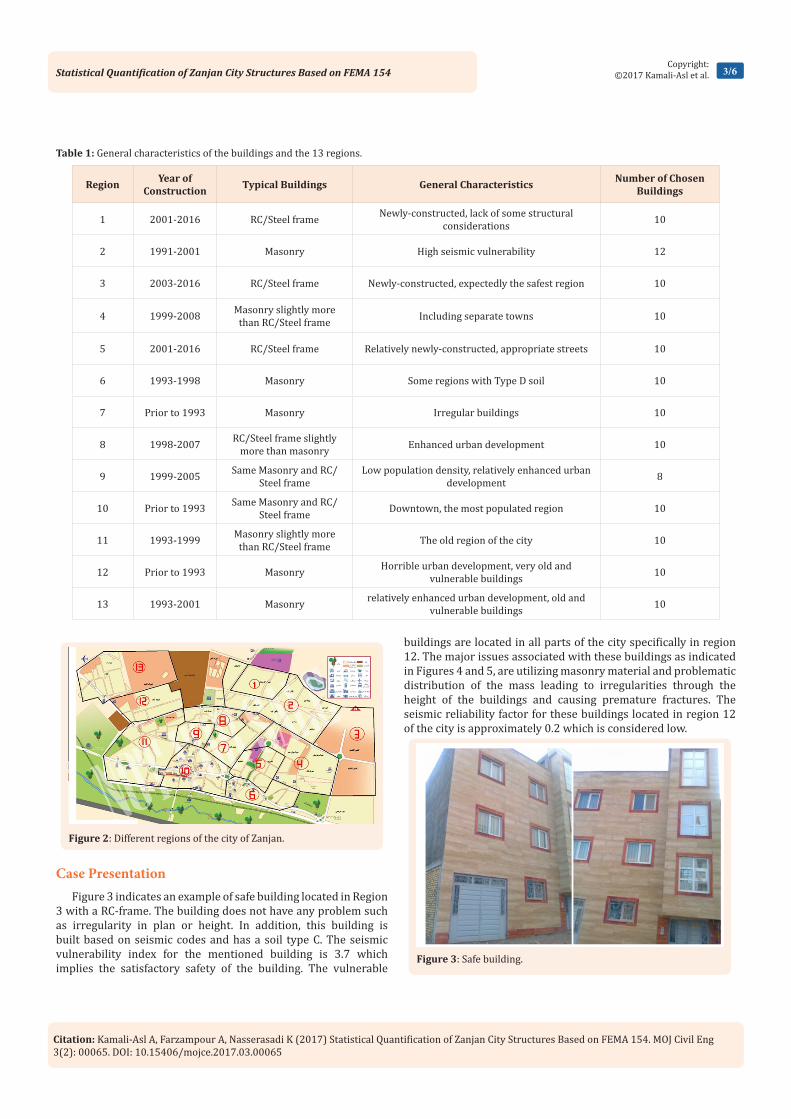
Case PresentationFigure 3 indicates an example of safe building located in Region
3 with a RC-frame. The building does not have any problem such as irregularity in plan or height. In addition, this building is built based on seismic codes and has a soil type C. The seismic vulnerability index for the mentioned building is 3.7 which implies the satisfactory safety of the building. The vulnerable
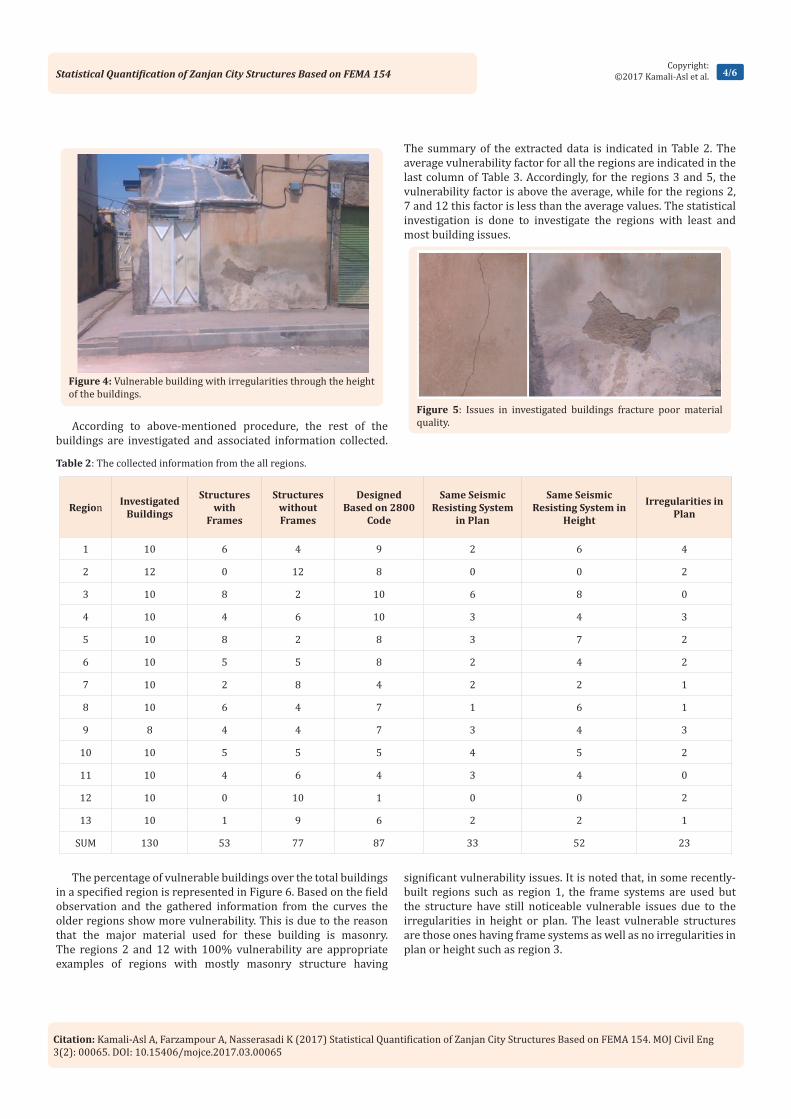
buildings are located in all parts of the city specifically in region 12. The major issues associated with these buildings as indicated in Figures 4 and 5, are utilizing masonry material and problematic distribution of the mass leading to irregularities through the height of the buildings and causing premature fractures. The seismic reliability factor for these buildings located in region 12 of the city is approximately 0.2 which is considered low.
Figure 2: Different regions of the city of Zanjan.
Citation: Kamali-Asl A, Farzampour A, Nasserasadi K (2017) Statistical Quantification of Zanjan City Structures Based on FEMA 154. MOJ Civil Eng 3(2): 00065. DOI: 10.15406/mojce.2017.03.00065
Statistical Quantification of Zanjan City Structures Based on FEMA 154 4/6Copyright:
According to above-mentioned procedure, the rest of the buildings are investigated and associated information collected.
The summary of the extracted data is indicated in Table 2. The average vulnerability factor for all the regions are indicated in the last column of Table 3. Accordingly, for the regions 3 and 5, the vulnerability factor is above the average, while for the regions 2, 7 and 12 this factor is less than the average values. The statistical investigation is done to investigate the regions with least and most building issues.
Figure 4: Vulnerable building with irregularities through the height of the buildings.
Figure 5: Issues in investigated buildings fracture poor material quality.
Table 2: The collected information from the all regions.
Region Investigated Buildings
Structures with
Frames
Structures without Frames
Designed Based on 2800
Code
Same Seismic Resisting System
in Plan
Same Seismic Resisting System in
Height
Irregularities in Plan
1 10 6 4 9 2 6 4
2 12 0 12 8 0 0 2
3 10 8 2 10 6 8 0
4 10 4 6 10 3 4 3
5 10 8 2 8 3 7 2
6 10 5 5 8 2 4 2
7 10 2 8 4 2 2 1
8 10 6 4 7 1 6 1
9 8 4 4 7 3 4 3
10 10 5 5 5 4 5 2
11 10 4 6 4 3 4 0
12 10 0 10 1 0 0 2
13 10 1 9 6 2 2 1
SUM 130 53 77 87 33 52 23
The percentage of vulnerable buildings over the total buildings in a specified region is represented in Figure 6. Based on the field observation and the gathered information from the curves the older regions show more vulnerability. This is due to the reason that the major material used for these building is masonry. The regions 2 and 12 with 100% vulnerability are appropriate examples of regions with mostly masonry structure having
significant vulnerability issues. It is noted that, in some recently-built regions such as region 1, the frame systems are used but the structure have still noticeable vulnerable issues due to the irregularities in height or plan. The least vulnerable structures are those ones having frame systems as well as no irregularities in plan or height such as region 3.
Citation: Kamali-Asl A, Farzampour A, Nasserasadi K (2017) Statistical Quantification of Zanjan City Structures Based on FEMA 154. MOJ Civil Eng 3(2): 00065. DOI: 10.15406/mojce.2017.03.00065
Statistical Quantification of Zanjan City Structures Based on FEMA 154 5/6Copyright:
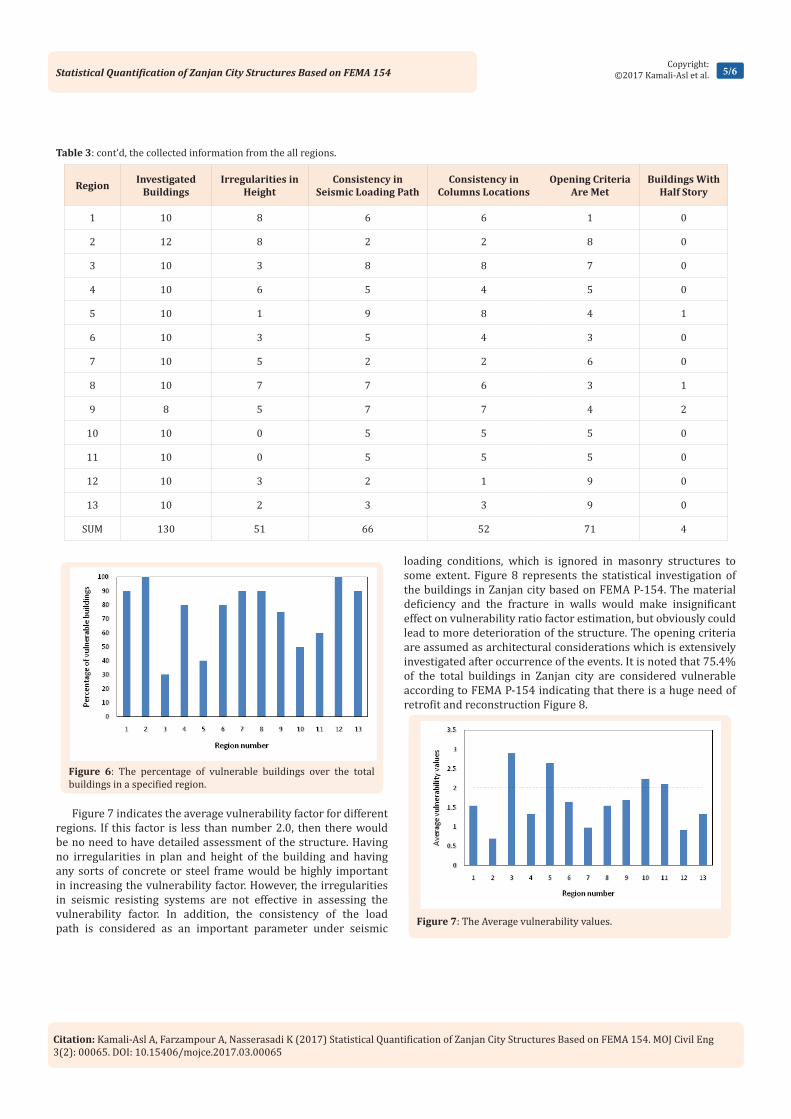
Table 3: cont’d, the collected information from the all regions.
Region Investigated Buildings
Irregularities in Height
Consistency in Seismic Loading Path
Consistency in Columns Locations
Opening Criteria Are Met
Buildings With Half Story
1 10 8 6 6 1 0
2 12 8 2 2 8 0
3 10 3 8 8 7 0
4 10 6 5 4 5 0
5 10 1 9 8 4 1
6 10 3 5 4 3 0
7 10 5 2 2 6 0
8 10 7 7 6 3 1
9 8 5 7 7 4 2
10 10 0 5 5 5 0
11 10 0 5 5 5 0
12 10 3 2 1 9 0
13 10 2 3 3 9 0
SUM 130 51 66 52 71 4
Figure 7 indicates the average vulnerability factor for different regions. If this factor is less than number 2.0, then there would be no need to have detailed assessment of the structure. Having no irregularities in plan and height of the building and having any sorts of concrete or steel frame would be highly important in increasing the vulnerability factor. However, the irregularities in seismic resisting systems are not effective in assessing the vulnerability factor. In addition, the consistency of the load path is considered as an important parameter under seismic
loading conditions, which is ignored in masonry structures to some extent. Figure 8 represents the statistical investigation of the buildings in Zanjan city based on FEMA P-154. The material deficiency and the fracture in walls would make insignificant effect on vulnerability ratio factor estimation, but obviously could lead to more deterioration of the structure. The opening criteria are assumed as architectural considerations which is extensively investigated after occurrence of the events. It is noted that 75.4% of the total buildings in Zanjan city are considered vulnerable according to FEMA P-154 indicating that there is a huge need of retrofit and reconstruction Figure 8.
Figure 6: The percentage of vulnerable buildings over the total buildings in a specified region.
Citation: Kamali-Asl A, Farzampour A, Nasserasadi K (2017) Statistical Quantification of Zanjan City Structures Based on FEMA 154. MOJ Civil Eng 3(2): 00065. DOI: 10.15406/mojce.2017.03.00065
Statistical Quantification of Zanjan City Structures Based on FEMA 154 6/6Copyright:
Figure 8: The collected information from the all structures.
DiscussionNew procedure to evaluate the seismic reliability of the
buildings are implemented to evaluate all the regions of the city. The procedure elaborated in this study could be utilized for different cities to have a quick but reliable assessment of how much building are seismic resistant. Based on the assessments of collected data, more than 80% of the regions and 75% of the constructed building are considered as vulnerable. It is worthy of notice that recently-built regions (e.g. region 1) are also evaluated as vulnerable indicating that the new methods of constructing building needs significant improvements. The major reason for such issues is due to sacrificing several criteria for having better architectural aspects; hence, the buildings are vulnerable under seismic conditions. It is worthy of mentioning that, in some newer parts of the city not only the seismic code is met but also the architectural aspects are considered; therefore, the structures are safe in overall. In general, the most significant common problem associated with the buildings are the irregularities in height of the buildings and not considering the seismic code instructions. The first problem is mostly observed in several buildings with
concrete or steel frames, while the second issue is observed in masonry buildings. It is recommended not to sacrifice seismic codes and provisions for any architectural aspects, and construct the newer buildings without any irregularities in plan and height.
References1. Davey RA, Blaikie EL (2010) Predicted and observed performance
of masonry parapets in the 2007 Gisborne earthquake. Annual Conference of the New Zealand Society for Earthquake Engineering, Wellington.
2. Federal Emergency Management Agency (2015) FEMA 154: Rapid Visual Screening of Buildings for Potential Seismic Hazards: A Handbook. Washington, DC.
3. Jain SK, Mitra K, Kumar M, Shah M (2010) A proposed Rapid Visual Screening procedure for seismic evaluation of RC-frame buildings in India. Earthquake Spectra 26(3): 709-729.
4. Sadashiva VK, MacRae GA, Deam BL (2010) Simple Methods to Evaluate Structural Irregularity Effects. 2010 Annual Conference of the New Zealand Society for Earthquake Engineering Wellington.