Page 1
Statistical release Published 23 May 2013
This statistical release presents figures on the National and International locations of all UK Regular Armed Forces Personnel and MOD civilian personnel. The tables present information on the stationed location of all UK Regular service and civilian personnel by UK Unitary Authority and Local Authority Area, as well as all international global locations. Data is presented for each Service by Officer / Rank breakdown and for civilian personnel, non industrial / industrial breakdowns (including Trading Funds and Locally Engaged Civilians). For historical military location information please refer to TSP10, and for historical civilian location information please refer to CPS6 available at www.dasa.mod.uk.
Key Points and Trends At 1 April 2013, 88% of UK Regular Armed Forces and
93% of MOD civilians excluding LEC personnel were stationed in the UK.
The strength of UK Regular Forces stationed in the UK
fell by 6,660 (4.2%) between 1 April 2012 and 1 April 2013 from 156,970 to 150,310. Over the same period, the number of UK civilian personnel decreased by 4,170 (7.3%) from 57,220 to 53,050.
The strength of UK Regular Forces stationed overseas
decreased from 22,440 to 20,060 (10.6%) between 1 April 2012 and 1 April 2013. Over the same period, the number of MOD civilian personnel based overseas decreased from 11,200 to 10,000 (10.8%).
The number of UK Regular Armed Forces personnel
stationed in Germany continued to decrease from 16,990 to 14,840 (12.7%) between 1 April 2012 and 1 April 2013 in line with the announcement made during the Strategic Defence & Security Review (SDSR). Despite this decrease, Germany still has the second largest population of MOD personnel after the UK.
Contents Page Key Points and Trends 1 Data sources and notes 2
Section 1 : World Wide Strengths
Table 1.1a MOD Personnel 4 Table 1.1b UK Regular Forces 5
Section 2 : UK by Region
Table 2.1a MOD Personnel 6 Table 2.1b UK Regular Forces 6 Maps 7
Section 3 : England by Unitary
Authority & Local Authority Area Table 3.1 North East Region 9 Table 3.2 North West Region 10 Table 3.3 Yorkshire & the Humber Region
12
Table 3.4 East Midlands Region 14 Table 3.5 West Midlands Region 16 Table 3.6 East of England Region 18 Table 3.7 London Region 20 Table 3.8 South East Region 22 Table 3.9 South West Region 24
Section 4 : Wales by Unitary
Authority & Local Authority Area 26
Section 5 : Scotland by Unitary
Authority & Local Authority Area 27
Section 6 : Northern Ireland by
Unitary Authority & Local Authority Area
28
Further Information: Defence Statistics (Tri Service) Tel: 020-780-78896 Email: [email protected] General Public Enquiries: www.dasa.mod.uk
Quarterly Location Statistics (QLS) 1 April 2013
Page 2
Definitions and Notes to tables UK Regular Forces Figures are for UK Regular Forces (including both Trained and Untrained personnel), and therefore exclude Gurkhas, Full Time Reserve Service personnel and mobilised reservists. Naval Service personnel on sea service are included against the local authority containing the home port of their ship. Royal Air Force Other Ranks serving in the South Atlantic are shown against the location containing their home base. MOD Civilian Personnel Civilian figures are reported as Full Time Equivalent (FTE). FTE is a measure of the size of the workforce that takes account of the fact that some people work part-time. Part-time staff are counted according to the number of hours they work per week as a proportion of normal hours for their grade and location. Section -1 civilian personnel total includes Royal Fleet Auxiliary (RFA). RFA civilian personnel cannot be identified by location as the data are not held centrally. Data Sources: UK Regular Forces data are sourced from the Joint Personnel Administration (JPA) system. Location data are based on the stationed location of the individual as recorded in the 'Assignment Location' field of the JPA system. The figures are based on Service personnel's stationed location and not their location of residence - where personnel work isn't necessarily where they live. Personnel deployed on operations to an area away from their stationed location are shown against their most recent stationed location. MOD civilian data are compiled from several sources: 1) Core MOD Personnel - Data for core MOD personnel are taken from the personnel system - Human Resources Management System (HRMS). DASA use budgetary UINs and attribute people according to the budgetary area that pays them, using the Standing Data System hierarchy from Financial Management Information Systems. 2) Trading Funds - Trading Funds were introduced by the Government under the Trading Funds Act 1973 as a ‘means of financing trading operations of a government department which, hitherto, have been carried out on Vote’. They are self-accounting units that have greater freedom than other government departments in managing their own financial and management activities. They are also free to negotiate their own terms and conditions with their personnel and for this reason their grading structures do not always match that of the rest of the Ministry, and this is reflected in some of the tables. Currently the MOD has three Trading Funds - the Defence Support Group, DSTL and the UK Hydrographic Office. Until 1 October 2011, the Met Office also was reported on by the MOD, but as of 1 October 2011 their responsibility transferred to the Department for Business, Information and Skills (BIS). 3) Locally engaged civilians (LEC) - LEC employees are recruited overseas exclusively for employment in support of the UK Armed Forces deployed in a particular overseas theatre and on terms and conditions of service applicable only to that overseas theatre or Administration. This includes the dependents of UK military personnel or UK-based civilian staff employed in overseas theatre (who are sometimes separately identified as UK Dependents). LECs are not civil servants. LEC data are provided by Top Level Budgetary areas quarterly to DASA requirements. LEC FTE strengths are based on the actual FTE of part-time LECs where available, and the FTE for those part-time personnel where actual values remain unavailable are estimated with the mean FTE of part-time LECs, increasing the accuracy of LEC FTE.
2
Page 3
3
4) The Royal Fleet Auxiliary (RFA) - RFA data are taken from the MOD civilian pay system.
Data Issues – Strengths/Weaknesses (Data Quality):
1. All tables presented in this publication meet the high standards of quality and integrity demanded by the Code of Practice for Official Statistics. 2. As a result of improvements in the quality of data sourced from JPA and the monthly data validation processes, Defence Statistics consider all data from 1 November 2011 to be fit for purpose. Consequently strength data published from 1 November 2011 onwards are considered finalised and will no longer be marked as provisional. Defence Statistics welcome feedback on our statistical products. If you have any comments or questions about this publication or about DASA statistics in general, you can contact us as follows: Contact: Defence Statistics (Tri Service) Tel. 0207 807 8896 Email [email protected] Visit our website at www.dasa.mod.uk and complete the feedback form. Symbols and Conventions Symbols p provisional
r revised
rp revised but still provisional
e estimate
- zero or rounded to zero
Rounding Where rounding has been used, totals and sub-totals have been rounded separately and so may not equal the sums of their rounded parts. When rounding to the nearest 10, numbers ending in “5” have been rounded to the nearest multiple of 20 to prevent systematic bias.
Page 4
Grand Total 236,110 170,710 65,400 170,710 29,060 141,650 65,400 40,410 7,660 7,170 8,250
UK Total 203,360 150,310 53,050 150,310 25,850 124,450 53,050 38,670 7,600 6,770 -of which:
England 180,250 133,990 46,270 133,990 23,790 110,190 46,270 33,920 6,010 6,340 -
Wales 3,910 2,650 1,260 2,650 420 2,230 1,260 650 260 350 -
Scotland 15,160 11,140 4,020 11,140 1,390 9,750 4,020 3,180 760 80 -
Northern Ireland 4,030 2,530 1,500 2,530 250 2,280 1,500 910 580 10 -
Overseas Total 30,050 20,060 10,000 20,060 3,130 16,930 10,000 1,590 30 130 8,250
of which:EUROPE (exc. UK) 25,610 18,240 7,370 18,240 2,180 16,060 7,370 1,300 30 - 6,040
of which:Germany 20,140 14,840 5,300 14,840 1,470 13,370 5,300 990 10 - 4,300
Cyprus 3,780 2,400 1,380 2,400 250 2,150 1,380 220 10 - 1,140
Belgium 370 330 40 330 170 160 40 20 - - 20
Gibraltar 730 200 530 200 30 170 530 20 - - 500
Italy 160 140 20 140 70 60 20 10 - - 10
Netherlands 160 140 20 140 50 90 20 10 - - 10
Portugal 30 30 - 30 20 20 - - - - -
Norway 40 40 - 40 20 10 - - - - -
France 60 50 20 50 40 - 20 10 - - 10
Czech Republic 20 20 - 20 10 10 - - - - -
ASIA (EXC. MIDDLE EAST) 2,020 260 1,760 260 100 160 1,760 100 - 130 1,540of which:Brunei 500 150 350 150 60 100 350 30 - - 320
British Indian Ocean Territory (inc. Diego Garcia)
40 40 - 40 - 40 - - - - -
Nepal 360 20 340 20 10 10 340 - - - 340
NORTH AFRICA / MIDDLE EAST 420 330 90 330 210 130 90 60 - - 30of which:Saudi Arabia 170 110 60 110 70 40 60 50 - - -
Oman 90 90 - 90 50 40 - - - - -
Bahrain 10 10 - 10 10 10 - - - - -
Kuwait 40 40 - 40 30 10 - - - - -
SUB SAHARAN AFRICA 730 230 500 230 70 160 500 10 - - 500of which:Kenya 670 180 480 180 40 140 480 - - - 480
Sierra Leone 20 20 - 20 10 10 - - - - -
NORTH AMERICA 1,000 840 160 840 460 380 160 100 - - 60of which:United States 710 560 150 560 370 190 150 90 - - 60
Canada 290 280 10 280 90 190 10 10 - - -
CENTRAL AMERICA / CARIBBEAN 70 10 60 10 - 10 60 - - - 60of which:Belize 60 10 60 10 - 10 60 - - - 60
SOUTH AMERICA 20 10 10 10 10 - 10 - - - 10
SOUTH ATLANTIC 110 70 40 70 50 20 40 20 - - 10of which:Falkland Islands 100 70 30 70 50 20 30 20 - - 10
OCEANIA 70 60 10 60 50 10 10 10 - - 10of which:Australia 60 50 10 50 40 10 10 - - - -
UNALLOCATED 800 350 450 350 80 270 450 150 30 270 -
Source : Defence Statistics
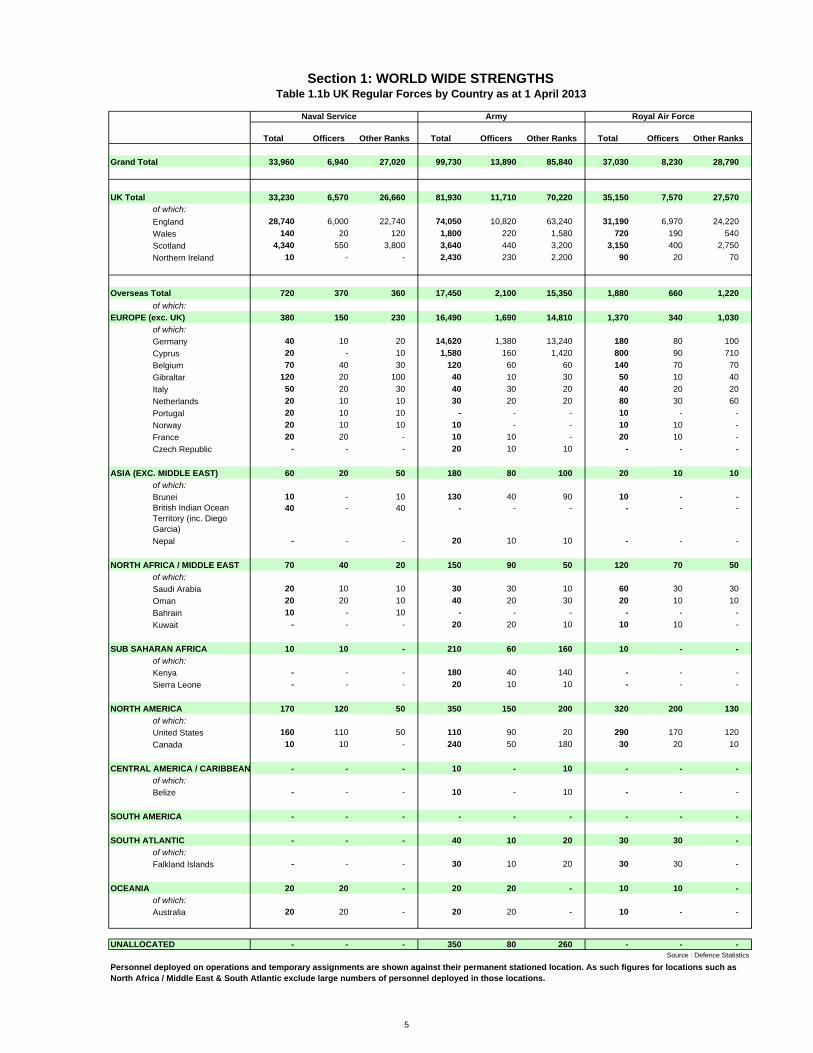
Section 1: WORLD WIDE STRENGTHSTable 1.1a MOD Personnel by Country as at 1 April 2013
Non Industrial
Industrial Trading Funds
MilitaryTotal
MOD Total Civilians
Personnel deployed on operations and temporary assignments are shown against their permanent stationed location. As such figures for locations such as North Africa / Middle East & South Atlantic exclude large numbers of personnel deployed in those locations.
Officers Other Ranks
TotalTotal Military Civilians Locally Engaged Civilians
4
Page 5
Total Officers Other Ranks Total Officers Other Ranks Total Officers Other Ranks
Grand Total 33,960 6,940 27,020 99,730 13,890 85,840 37,030 8,230 28,790
UK Total 33,230 6,570 26,660 81,930 11,710 70,220 35,150 7,570 27,570
of which:
England 28,740 6,000 22,740 74,050 10,820 63,240 31,190 6,970 24,220
Wales 140 20 120 1,800 220 1,580 720 190 540
Scotland 4,340 550 3,800 3,640 440 3,200 3,150 400 2,750
Northern Ireland 10 - - 2,430 230 2,200 90 20 70
Overseas Total 720 370 360 17,450 2,100 15,350 1,880 660 1,220
of which:
EUROPE (exc. UK) 380 150 230 16,490 1,690 14,810 1,370 340 1,030
of which:
Germany 40 10 20 14,620 1,380 13,240 180 80 100
Cyprus 20 - 10 1,580 160 1,420 800 90 710
Belgium 70 40 30 120 60 60 140 70 70
Gibraltar 120 20 100 40 10 30 50 10 40
Italy 50 20 30 40 30 20 40 20 20
Netherlands 20 10 10 30 20 20 80 30 60
Portugal 20 10 10 - - - 10 - -
Norway 20 10 10 10 - - 10 10 -
France 20 20 - 10 10 - 20 10 -
Czech Republic - - - 20 10 10 - - -
ASIA (EXC. MIDDLE EAST) 60 20 50 180 80 100 20 10 10
of which:
Brunei 10 - 10 130 40 90 10 - -British Indian Ocean Territory (inc. Diego Garcia)
40 - 40 - - - - - -
Nepal - - - 20 10 10 - - -
NORTH AFRICA / MIDDLE EAST 70 40 20 150 90 50 120 70 50
of which:
Saudi Arabia 20 10 10 30 30 10 60 30 30
Oman 20 20 10 40 20 30 20 10 10
Bahrain 10 - 10 - - - - - -
Kuwait - - - 20 20 10 10 10 -
SUB SAHARAN AFRICA 10 10 - 210 60 160 10 - -
of which:
Kenya - - - 180 40 140 - - -
Sierra Leone - - - 20 10 10 - - -
NORTH AMERICA 170 120 50 350 150 200 320 200 130
of which:
United States 160 110 50 110 90 20 290 170 120
Canada 10 10 - 240 50 180 30 20 10
CENTRAL AMERICA / CARIBBEAN - - - 10 - 10 - - -
of which:
Belize - - - 10 - 10 - - -
SOUTH AMERICA - - - - - - - - -
SOUTH ATLANTIC - - - 40 10 20 30 30 -
of which:
Falkland Islands - - - 30 10 20 30 30 -
OCEANIA 20 20 - 20 20 - 10 10 -
of which:
Australia 20 20 - 20 20 - 10 - -
UNALLOCATED - - - 350 80 260 - - -Source : Defence Statistics
Personnel deployed on operations and temporary assignments are shown against their permanent stationed location. As such figures for locations such as North Africa / Middle East & South Atlantic exclude large numbers of personnel deployed in those locations.
Naval Service
Section 1: WORLD WIDE STRENGTHSTable 1.1b UK Regular Forces by Country as at 1 April 2013
Army Royal Air Force
5
Page 6
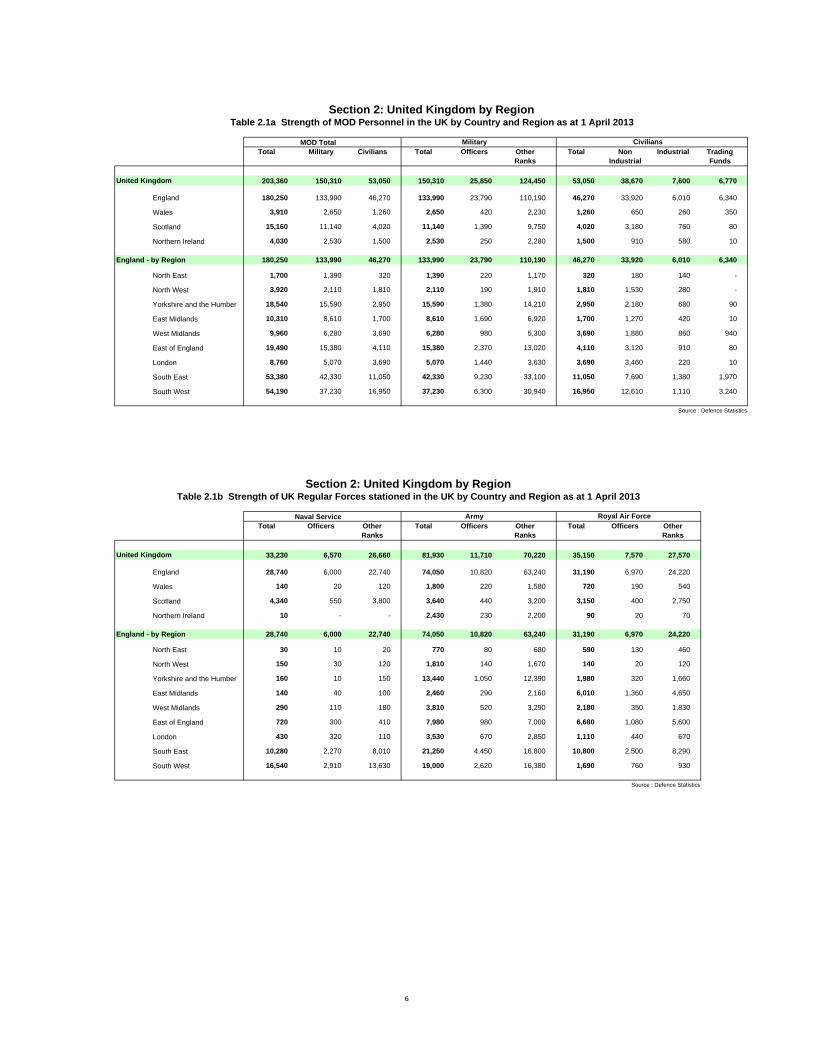
United Kingdom 203,360 150,310 53,050 150,310 25,850 124,450 53,050 38,670 7,600 6,770
England 180,250 133,990 46,270 133,990 23,790 110,190 46,270 33,920 6,010 6,340
Wales 3,910 2,650 1,260 2,650 420 2,230 1,260 650 260 350
Scotland 15,160 11,140 4,020 11,140 1,390 9,750 4,020 3,180 760 80
Northern Ireland 4,030 2,530 1,500 2,530 250 2,280 1,500 910 580 10
England - by Region 180,250 133,990 46,270 133,990 23,790 110,190 46,270 33,920 6,010 6,340
North East 1,700 1,390 320 1,390 220 1,170 320 180 140 -
North West 3,920 2,110 1,810 2,110 190 1,910 1,810 1,530 280 -
Yorkshire and the Humber 18,540 15,590 2,950 15,590 1,380 14,210 2,950 2,180 680 90
East Midlands 10,310 8,610 1,700 8,610 1,690 6,920 1,700 1,270 420 10
West Midlands 9,960 6,280 3,690 6,280 980 5,300 3,690 1,880 860 940
East of England 19,490 15,380 4,110 15,380 2,370 13,020 4,110 3,120 910 80
London 8,760 5,070 3,690 5,070 1,440 3,630 3,690 3,460 220 10
South East 53,380 42,330 11,050 42,330 9,230 33,100 11,050 7,690 1,380 1,970
South West 54,190 37,230 16,950 37,230 6,300 30,940 16,950 12,610 1,110 3,240
Source : Defence Statistics
United Kingdom 33,230 6,570 26,660 81,930 11,710 70,220 35,150 7,570 27,570
England 28,740 6,000 22,740 74,050 10,820 63,240 31,190 6,970 24,220
Wales 140 20 120 1,800 220 1,580 720 190 540
Scotland 4,340 550 3,800 3,640 440 3,200 3,150 400 2,750
Northern Ireland 10 - - 2,430 230 2,200 90 20 70
England - by Region 28,740 6,000 22,740 74,050 10,820 63,240 31,190 6,970 24,220
North East 30 10 20 770 80 680 590 130 460
North West 150 30 120 1,810 140 1,670 140 20 120
Yorkshire and the Humber 160 10 150 13,440 1,050 12,390 1,980 320 1,660
East Midlands 140 40 100 2,460 290 2,160 6,010 1,360 4,650
West Midlands 290 110 180 3,810 520 3,290 2,180 350 1,830
East of England 720 300 410 7,980 980 7,000 6,680 1,080 5,600
London 430 320 110 3,530 670 2,850 1,110 440 670
South East 10,280 2,270 8,010 21,250 4,450 16,800 10,800 2,500 8,290
South West 16,540 2,910 13,630 19,000 2,620 16,380 1,690 760 930
Source : Defence Statistics
Industrial Trading Funds
Section 2: United Kingdom by RegionTable 2.1a Strength of MOD Personnel in the UK by Country and Region as at 1 April 2013
MOD Total Military Civilians
Section 2: United Kingdom by RegionTable 2.1b Strength of UK Regular Forces stationed in the UK by Country and Region as at 1 April 2013
Officers Other Ranks
Total Non Industrial
Total Military Civilians Total
Naval Service Army Royal Air ForceOther Ranks
Officers Other Ranks
Total OfficersTotal Officers Other Ranks
Total
6
Page 7
Created by DASA. Crown Copyright. All rights reserved. License number : ICG 100015347 [2013]
Map 1: Distribution of UK Regular Forces by Region as at 1 April 2013
7
Page 8
Created by DASA. Crown Copyright. All rights reserved. License number : ICG 100015347 [2013]
Map 2: Distribution of MOD Civilian personnel by Region as at 1 April 2013
8
Page 9
County or Unitary Authority
Local authority area
1,700 1,390 320 1,390 220 1,170 320 180 140 -
County Durham 50 20 30 20 - 10 30 10 20 -
Darlington 10 - - - - - - - - -
Hartlepool - - - - - - - - - -
Middlesbrough 50 30 20 30 - 20 20 10 10 -
Northumberland 1,350 1,210 140 1,210 180 1,030 140 90 50 -
Redcar and Cleveland - - - - - - - - - -
Stockton-on-Tees 10 - 10 - - - 10 - - -
240 130 120 130 30 100 120 60 60 -
Gateshead 70 50 30 50 20 30 30 20 10 -
Newcastle Upon Tyne 150 70 80 70 10 60 80 40 40 -
North Tyneside 10 - - - - - - - - -
South Tyneside 10 - 10 - - - 10 - - -
Sunderland 10 - - - - - - - - -
Unallocated - - - - - - - - - -
Source : Defence Statistics
County or Unitary Authority
Local authority area
30 10 20 770 80 680 590 130 460
County Durham - - - 20 - 10 - - -
Darlington - - - - - - - - -
Hartlepool - - - - - - - - -
Middlesbrough - - - 30 - 20 - - -
Northumberland - - - 630 50 580 580 130 450
Redcar and Cleveland - - - - - - - - -
Stockton-on-Tees - - - - - - - - -
20 - 20 90 20 70 10 - 10
Gateshead 10 - 10 20 10 10 10 - 10
Newcastle Upon Tyne 10 - 10 60 10 50 - - -
North Tyneside - - - - - - - - -
South Tyneside - - - - - - - - -
Sunderland - - - - - - - - -
Source : Defence Statistics
Region Total
Total
Naval Service Army
Total Officers Other Ranks
Section 3: ENGLANDTable 3.1b The North East: UK Regular Forces by local authority area as at 1 April 2013
Other Ranks
Section 3: ENGLAND
Region Total
Tyne and Wear
Royal Air Force
Military CiviliansMilitary Civilians Non
Industrial
Officers
Table 3.1a The North East: MOD Personnel by local authority area as at 1 April 2013
TotalMOD Total
Industrial Trading Funds
Tyne and Wear
Officers Other Ranks
TotalTotal Officers Other Ranks
Total
9
Page 10
County or Unitary Authority
Local authority area
3,920 2,110 1,810 2,110 190 1,910 1,810 1,530 280 -
Blackburn with Darwen - - - - - - - - - -
Blackpool - - - - - - - - - -
Cheshire East 10 - - - - - - - - -
Cheshire West and Chester 650 630 20 630 40 590 20 20 - -
Halton - - - - - - - - - -
Warrington 60 10 50 10 - 10 50 20 30 -
550 200 350 200 20 180 350 180 160 -
Allerdale 10 - - - - - - - - -
Barrow-in-Furness 160 100 60 100 20 80 60 60 - -
Carlisle 370 100 270 100 10 90 270 110 160 -
Copeland - - - - - - - - - -
Eden 10 - 10 - - - 10 10 - -
South Lakeland - - - - - - - - - -
420 80 340 80 10 70 340 310 30 -
Bolton 10 - 10 - - - 10 - - -
Bury 20 10 10 10 - 10 10 10 - -
Manchester 160 40 120 40 10 40 120 100 20 -
Oldham - - - - - - - - - -
Rochdale - - - - - - - - - -
Salford - - - - - - - - - -
Stockport 210 - 210 - - - 210 210 - -
Tameside - - - - - - - - - -
Trafford 10 10 - 10 - 10 - - - -
Wigan 10 - - - - - - - - -
1,680 1,060 610 1,060 90 970 610 590 20 -
Burnley - - - - - - - - - -
Chorley - - - - - - - - - -
Fylde 760 720 40 720 50 660 40 40 - -
Hyndburn - - - - - - - - - -
Lancaster 10 - 10 - - - 10 10 - -
Pendle - - - - - - - - - -
Preston 460 340 120 340 40 300 120 100 20 -
Ribble Valley 10 - - - - - - - - -
Rossendale - - - - - - - - - -
South Ribble - - - - - - - - - -
West Lancashire - - - - - - - - - -
Wyre 430 - 430 - - - 430 430 - -
550 120 430 120 30 90 430 390 40 -
Knowsley - - - - - - - - - -
Liverpool 490 90 390 90 20 70 390 370 20 -
St. Helens 20 10 10 10 - 10 10 10 - -
Sefton 20 10 10 10 - 10 10 10 - -
Wirral 20 - 10 - - - 10 10 10 -
CiviliansMOD Total
Merseyside
IndustrialNon Industrial
Cumbria
Region Total
Total
Greater Manchester
Lancashire
MilitaryOfficers
Section 3: ENGLANDTable 3.2a The North West: MOD Personnel by local authority area as at 1 April 2013
Civilians TotalTotal Military Other Ranks
Trading Funds
10
Page 11
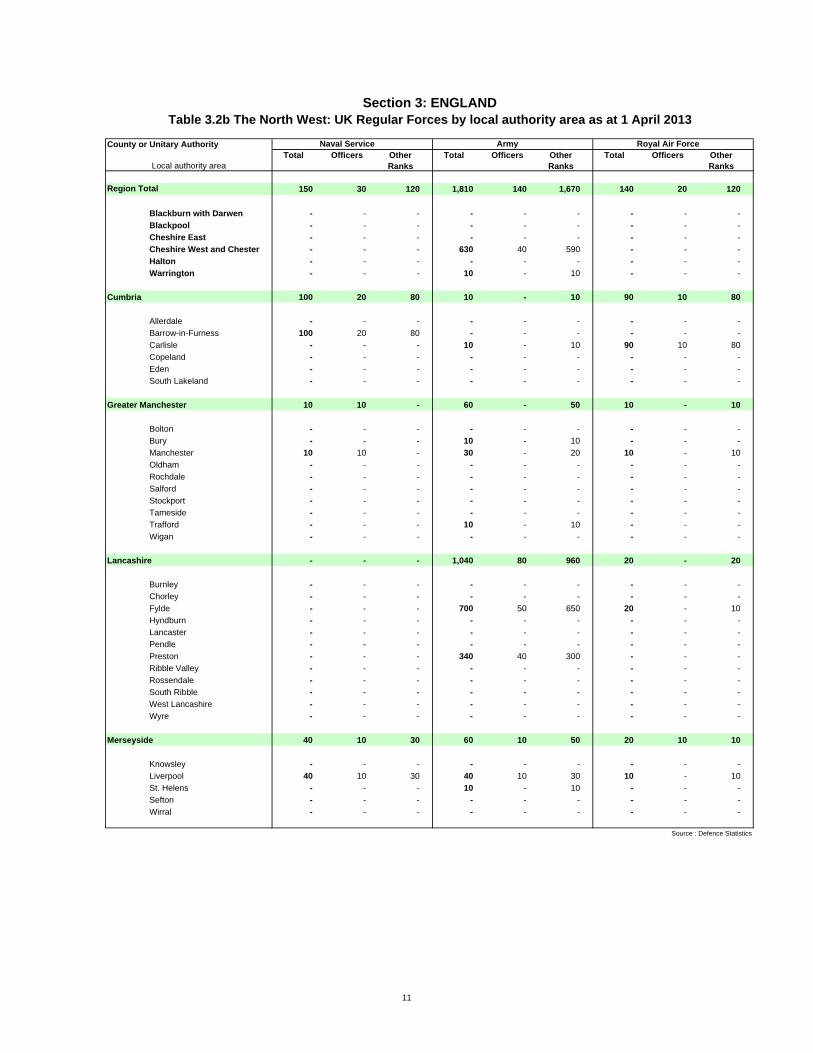
County or Unitary Authority
Local authority area
150 30 120 1,810 140 1,670 140 20 120
Blackburn with Darwen - - - - - - - - -
Blackpool - - - - - - - - -
Cheshire East - - - - - - - - -
Cheshire West and Chester - - - 630 40 590 - - -
Halton - - - - - - - - -
Warrington - - - 10 - 10 - - -
100 20 80 10 - 10 90 10 80
Allerdale - - - - - - - - -
Barrow-in-Furness 100 20 80 - - - - - -
Carlisle - - - 10 - 10 90 10 80
Copeland - - - - - - - - -
Eden - - - - - - - - -
South Lakeland - - - - - - - - -
10 10 - 60 - 50 10 - 10
Bolton - - - - - - - - -
Bury - - - 10 - 10 - - -
Manchester 10 10 - 30 - 20 10 - 10
Oldham - - - - - - - - -
Rochdale - - - - - - - - -
Salford - - - - - - - - -
Stockport - - - - - - - - -
Tameside - - - - - - - - -
Trafford - - - 10 - 10 - - -
Wigan - - - - - - - - -
- - - 1,040 80 960 20 - 20
Burnley - - - - - - - - -
Chorley - - - - - - - - -
Fylde - - - 700 50 650 20 - 10
Hyndburn - - - - - - - - -
Lancaster - - - - - - - - -
Pendle - - - - - - - - -
Preston - - - 340 40 300 - - -
Ribble Valley - - - - - - - - -
Rossendale - - - - - - - - -
South Ribble - - - - - - - - -
West Lancashire - - - - - - - - -
Wyre - - - - - - - - -
40 10 30 60 10 50 20 10 10
Knowsley - - - - - - - - -
Liverpool 40 10 30 40 10 30 10 - 10
St. Helens - - - 10 - 10 - - -
Sefton - - - - - - - - -
Wirral - - - - - - - - -
Source : Defence Statistics
Section 3: ENGLANDTable 3.2b The North West: UK Regular Forces by local authority area as at 1 April 2013
Other Ranks
Royal Air ForceNaval Service ArmyOfficers Other
RanksTotal Officers Other
RanksTotalTotal Officers
Region Total
Merseyside
Cumbria
Greater Manchester
Lancashire
11
Page 12
County or Unitary Authority
Local authority area
18,540 15,590 2,950 15,590 1,380 14,210 2,950 2,180 680 90
East Riding of Yorkshire 1,360 650 710 650 40 620 710 580 120 -
Kingston upon Hull - City of 100 30 70 30 - 30 70 60 10 -
North East Lincolnshire - - - - - - - - - -
North Lincolnshire 100 90 10 90 10 80 10 - - -
York 1,220 740 480 740 110 630 480 430 50 -
15,550 13,950 1,600 13,950 1,200 12,750 1,600 1,060 450 90
Craven - - - - - - - - - -
Hambleton 2,930 2,610 320 2,610 390 2,220 320 210 110 -
Harrogate 3,170 2,640 530 2,640 160 2,480 530 340 190 -
Richmondshire 9,240 8,600 640 8,600 640 7,960 640 430 120 90
Ryedale 200 100 100 100 10 90 100 70 20 -
Scarborough - - - - - - - - - -
Selby 10 - - - - - - - - -
90 50 40 50 10 40 40 20 20 -
Barnsley 10 - - - - - - - - -
Doncaster 10 - - - - - - - - -
Rotherham 10 - 10 - - - 10 - - -
Sheffield 70 40 30 40 10 40 30 10 10 -
120 70 50 70 10 60 50 30 20 -
Bradford - - - - - - - - - -
Calderdale - - - - - - - - - -
Kirklees 20 10 - 10 - 10 - - - -
Leeds 70 40 30 40 10 40 30 10 10 -
Wakefield 20 10 10 10 - 10 10 10 - -
Source : Defence Statistics
Section 3: ENGLAND
Region Total
North Yorkshire
South Yorkshire
Table 3.3a Yorkshire and The Humber: MOD Personnel by local authority area as at 1 April 2013
MOD Total MilitaryOfficers
CiviliansOther Ranks
Trading Funds
Industrial
West Yorkshire
Total Non Industrial
Total Military Civilians Total
12
Page 13
County or Unitary Authority
Local authority area
160 10 150 13,440 1,050 12,390 1,980 320 1,660
East Riding of Yorkshire 140 - 140 450 20 430 60 10 50
Kingston upon Hull - City of 10 - - 20 - 20 - - -
North East Lincolnshire - - - - - - - - -
North Lincolnshire - - - - - - 90 10 80
York - - - 740 110 630 - - -
10 10 - 12,130 900 11,220 1,810 290 1,520
Craven - - - - - - - - -
Hambleton 10 10 - 920 110 800 1,680 270 1,420
Harrogate - - - 2,620 160 2,460 10 - 10
Richmondshire - - - 8,590 640 7,960 10 - -
Ryedale - - - - - - 100 10 90
Scarborough - - - - - - - - -
Selby - - - - - - - - -
- - - 50 10 40 - - -
Barnsley - - - - - - - - -
Doncaster - - - - - - - - -
Rotherham - - - - - - - - -
Sheffield - - - 40 10 30 - - -
- - - 50 10 50 10 - 10
Bradford - - - - - - - - -
Calderdale - - - - - - - - -
Kirklees - - - 10 - 10 - - -
Leeds - - - 30 10 20 10 - 10
Wakefield - - - 10 - 10 - - -
Source : Defence Statistics
West Yorkshire
Officers Other Ranks
Total
South Yorkshire
North Yorkshire
Region Total
Total Officers Other Ranks
Table 3.3b Yorkshire and The Humber: UK Regular Forces by local authority area as at 1 April 2013
Total
Section 3: ENGLAND
Other Ranks
Royal Air ForceNaval Service ArmyOfficers
13
Page 14
County or Unitary Authority
Local authority area
10,310 8,610 1,700 8,610 1,690 6,920 1,700 1,270 420 10
Derby 10 - - - - - - - - -
Leicester 30 10 10 10 - 10 10 - 10 -
Nottingham 60 30 20 30 - 30 20 10 10 -
Rutland 1,340 1,280 60 1,280 90 1,190 60 50 10 -
10 - 10 - - - 10 - - -
Amber Valley - - - - - - - - - -
Bolsover - - - - - - - - - -
Chesterfield 10 - 10 - - - 10 - - -
Derbyshire Dales - - - - - - - - - -
Erewash - - - - - - - - - -
High Peak - - - - - - - - - -
North East Derbyshire - - - - - - - - - -
South Derbyshire - - - - - - - - - -
260 140 120 140 20 120 120 60 60 -
Blaby - - - - - - - - - -
Charnwood 20 20 - 20 10 - - - - -
Harborough - - - - - - - - - -
Hinckley and Bosworth - - - - - - - - - -
Melton 230 120 110 120 10 110 110 50 60 -
North West Leicestershire - - - - - - - - - -
Oadby and Wigston 10 - - - - - - - - -
7,540 6,450 1,090 6,450 1,450 5,000 1,090 870 220 10
Boston - - - - - - - - - -
East Lindsey 2,290 2,110 180 2,110 240 1,870 180 110 70 -
Lincoln 20 20 - 20 - 10 - - - -
North Kesteven 4,700 3,910 790 3,910 1,120 2,790 790 670 120 10
South Holland - - - - - - - - - -
South Kesteven 200 100 100 100 40 60 100 70 30 -
West Lindsey 330 310 20 310 50 260 20 20 - -
150 - 150 - - - 150 90 60 -
Corby - - - - - - - - - -
Daventry - - - - - - - - - -
East Northamptonshire - - - - - - - - - -
Kettering - - - - - - - - - -
Northampton 10 - 10 - - - 10 - 10 -
South Northamptonshire 140 - 140 - - - 140 90 50 -
Wellingborough - - - - - - - - - -
920 690 230 690 120 570 230 180 50 -
Ashfield - - - - - - - - - -
Bassetlaw 10 - 10 - - - 10 10 - -
Broxtowe 870 680 200 680 120 560 200 150 50 -
Gedling - - - - - - - - - -
Mansfield - - - - - - - - - -
Newark and Sherwood 20 - 20 - - - 20 10 10 -
Rushcliffe - - - - - - - - - -
Source : Defence Statistics
Section 3: ENGLANDTable 3.4a East Midlands: MOD Personnel by local authority area as at 1 April 2013
CiviliansIndustrial
MilitaryMOD TotalOther Ranks
Nottinghamshire
Region Total
Officers Trading Funds
Total Non Industrial
Total Military Civilians Total
Derbyshire
Leicestershire
Lincolnshire
Northamptonshire
14
Page 15
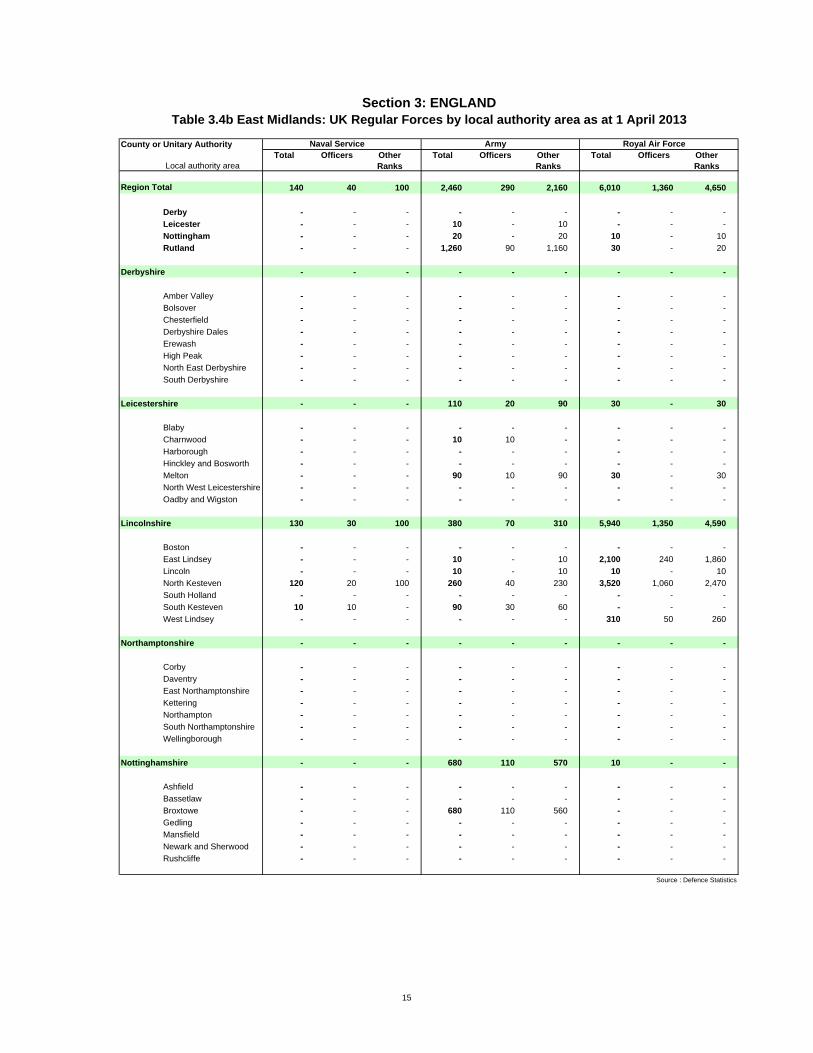
County or Unitary Authority
Local authority area
140 40 100 2,460 290 2,160 6,010 1,360 4,650
Derby - - - - - - - - -
Leicester - - - 10 - 10 - - -
Nottingham - - - 20 - 20 10 - 10
Rutland - - - 1,260 90 1,160 30 - 20
- - - - - - - - -
Amber Valley - - - - - - - - -
Bolsover - - - - - - - - -
Chesterfield - - - - - - - - -
Derbyshire Dales - - - - - - - - -
Erewash - - - - - - - - -
High Peak - - - - - - - - -
North East Derbyshire - - - - - - - - -
South Derbyshire - - - - - - - - -
- - - 110 20 90 30 - 30
Blaby - - - - - - - - -
Charnwood - - - 10 10 - - - -
Harborough - - - - - - - - -
Hinckley and Bosworth - - - - - - - - -
Melton - - - 90 10 90 30 - 30
North West Leicestershire - - - - - - - - -
Oadby and Wigston - - - - - - - - -
130 30 100 380 70 310 5,940 1,350 4,590
Boston - - - - - - - - -
East Lindsey - - - 10 - 10 2,100 240 1,860
Lincoln - - - 10 - 10 10 - 10
North Kesteven 120 20 100 260 40 230 3,520 1,060 2,470
South Holland - - - - - - - - -
South Kesteven 10 10 - 90 30 60 - - -
West Lindsey - - - - - - 310 50 260
- - - - - - - - -
Corby - - - - - - - - -
Daventry - - - - - - - - -
East Northamptonshire - - - - - - - - -
Kettering - - - - - - - - -
Northampton - - - - - - - - -
South Northamptonshire - - - - - - - - -
Wellingborough - - - - - - - - -
- - - 680 110 570 10 - -
Ashfield - - - - - - - - -
Bassetlaw - - - - - - - - -
Broxtowe - - - 680 110 560 - - -
Gedling - - - - - - - - -
Mansfield - - - - - - - - -
Newark and Sherwood - - - - - - - - -
Rushcliffe - - - - - - - - -
Source : Defence Statistics
Officers Other Ranks
Section 3: ENGLAND
Other Ranks
TotalNaval Service Army
Table 3.4b East Midlands: UK Regular Forces by local authority area as at 1 April 2013
OfficersTotal
Northamptonshire
Derbyshire
Nottinghamshire
Region Total
Lincolnshire
Leicestershire
Other Ranks
Total OfficersRoyal Air Force
15
Page 16
County or Unitary Authority
Local authority area
9,960 6,280 3,690 6,280 980 5,300 3,690 1,880 860 940
Herefordshire - County of 1,860 1,550 310 1,550 180 1,380 310 190 120 -
Shropshire 3,180 2,480 690 2,480 360 2,120 690 590 100 -
Stoke-on-Trent 30 10 10 10 - 10 10 - 10 -
Telford and Wrekin 1,740 180 1,560 180 40 140 1,560 290 400 860
1,060 740 320 740 130 610 320 220 30 80
Cannock Chase - - - - - - - - - -
East Staffordshire - - - - - - - - - -
Lichfield 280 130 150 130 90 40 150 150 - -
Newcastle-under-Lyme - - - - - - - - - -
South Staffordshire - - - - - - - - - -
Stafford 780 610 170 610 40 570 170 70 20 80
Staffordshire Moorlands - - - - - - - - - -
Tamworth - - - - - - - - - -
850 530 330 530 70 450 330 170 150 -
North Warwickshire - - - - - - - - - -
Nuneaton and Bedworth - - - - - - - - - -
Rugby 380 330 50 330 40 300 50 40 20 -
Stratford-on-Avon 470 200 270 200 40 160 270 130 140 -
Warwick - - - - - - - - - -
1,190 760 430 760 200 560 430 390 40 -
Birmingham 1,100 720 380 720 180 540 380 370 20 -
Coventry 30 10 20 10 - 10 20 10 10 -
Dudley - - - - - - - - - -
Sandwell 20 10 10 10 - 10 10 10 10 -
Solihull - - - - - - - - - -
Walsall - - - - - - - - - -
Wolverhampton 20 10 10 10 - 10 10 10 - -
40 20 30 20 - 20 30 20 10 -
Bromsgrove - - - - - - - - - -
Malvern Hills - - - - - - - - - -
Redditch 20 10 10 10 - 10 10 - - -
Worcester - - - - - - - - - -
Wychavon - - - - - - - - - -
Wyre Forest 20 - 10 - - - 10 10 - -
Unallocated 10 - 10 - - - 10 - - -Source : Defence Statistics
Staffordshire
Warwickshire
West Midlands
Worcestershire
Section 3: ENGLANDTable 3.5a West Midlands: MOD Personnel by local authority area as at 1 April 2013
Civilians TotalTotal Military IndustrialCivilians
Region Total
MOD Total MilitaryTrading Funds
Officers Other Ranks
Total Non Industrial
16
Page 17
County or Unitary Authority
Local authority area
290 110 180 3,810 520 3,290 2,180 350 1,830
Herefordshire - County of 70 10 60 1,440 150 1,290 40 10 30
Shropshire 70 50 20 770 70 700 1,640 240 1,410
Stoke-on-Trent - - - 10 - 10 - - -
Telford and Wrekin - - - 180 40 140 - - -
30 20 10 460 70 390 260 40 220
Cannock Chase - - - - - - - - -
East Staffordshire - - - - - - - - -
Lichfield 30 20 10 60 40 20 40 30 10
Newcastle-under-Lyme - - - - - - - - -
South Staffordshire - - - - - - - - -
Stafford - - - 400 30 360 210 10 210
Staffordshire Moorlands - - - - - - - - -
Tamworth - - - - - - - - -
- - - 510 70 440 20 - 10
North Warwickshire - - - - - - - - -
Nuneaton and Bedworth - - - - - - - - -
Rugby - - - 330 30 300 - - -
Stratford-on-Avon - - - 180 40 140 10 - 10
Warwick - - - - - - - - -
120 20 100 420 110 310 220 60 160
Birmingham 120 20 100 380 100 280 220 60 160
Coventry - - - 10 - 10 - - -
Dudley - - - - - - - - -
Sandwell - - - 10 - 10 - - -
Solihull - - - - - - - - -
Walsall - - - - - - - - -
Wolverhampton - - - 10 - 10 - - -
- - - 20 - 20 - - -
Bromsgrove - - - - - - - - -
Malvern Hills - - - - - - - - -
Redditch - - - 10 - 10 - - -
Worcester - - - - - - - - -
Wychavon - - - - - - - - -
Wyre Forest - - - - - - - - -
Source : Defence Statistics
Total Officers Total Officers Other Ranks
Total Officers Other Ranks
Naval Service Army Royal Air Force
Section 3: ENGLANDTable 3.5b West Midlands: UK Regular Forces by local authority area as at 1 April 2013
Worcestershire
Other Ranks
Warwickshire
West Midlands
Staffordshire
Region Total
17
Page 18
County or Unitary Authority
Local authority area
19,490 15,380 4,110 15,380 2,370 13,020 4,110 3,120 910 80
Bedford 10 - - - - - - - - -
Central Bedfordshire 1,940 1,520 430 1,520 340 1,180 430 400 20 -
Luton 20 10 10 10 - 10 10 - 10 -
Peterborough 1,460 1,320 150 1,320 180 1,130 150 90 50 -
Southend-on-Sea 20 - 10 - - - 10 10 - -
Thurrock - - - - - - - - - -
1,680 720 960 720 160 560 960 820 140 -
Cambridge 110 30 80 30 10 20 80 70 10 -
East Cambridgeshire - - - - - - - - - -
Fenland - - - - - - - - - -
Huntingdonshire 1,210 370 840 370 100 270 840 710 130 -
South Cambridgeshire 360 310 50 310 40 270 50 40 10 -
4,630 3,880 740 3,880 370 3,520 740 570 90 80
Basildon - - - - - - - - - -
Braintree 370 10 370 10 - 10 370 360 - -
Brentwood 10 - - - - - - - - -
Castle Point - - - - - - - - - -
Chelmsford 10 - - - - - - - - -
Colchester 3,320 3,050 270 3,050 290 2,750 270 180 10 80
Epping Forest - - - - - - - - - -
Harlow - - - - - - - - - -
Maldon - - - - - - - - - -
Rochford - - - - - - - - - -
Tendring - - - - - - - - - -
Uttlesford 920 820 100 820 70 750 100 20 80 -
1,290 1,090 210 1,090 570 520 210 210 - -
Broxbourne - - - - - - - - - -
Dacorum - - - - - - - - - -
East Hertfordshire - - - - - - - - - -
Hertsmere - - - - - - - - - -
North Hertfordshire - - - - - - - - - -
St Albans - - - - - - - - - -
Stevenage - - - - - - - - - -
Three Rivers 1,290 1,090 200 1,090 570 520 200 200 - -
Watford - - - - - - - - - -
Welwyn Hatfield - - - - - - - - - -
3,450 3,020 430 3,020 290 2,740 430 310 120 -
Breckland 530 470 50 470 40 430 50 50 10 -
Broadland - - - - - - - - - -
Great Yarmouth - - - - - - - - - -
Kings Lynn and West Norfolk 2,820 2,510 310 2,510 250 2,260 310 200 110 -
North Norfolk 30 30 - 30 - 30 - - - -
Norwich 70 10 60 10 - 10 60 60 - -
South Norfolk - - - - - - - - - -
4,980 3,810 1,170 3,810 450 3,360 1,170 710 460 -
Babergh - - - - - - - - - -
Forest Heath 890 - 890 - - - 890 540 350 -
Ipswich 10 10 - 10 - 10 - - - -
Mid Suffolk 1,630 1,520 100 1,520 160 1,360 100 60 40 -
St Edmundsbury 1,830 1,670 170 1,670 240 1,430 170 100 70 -
Suffolk Coastal 620 610 10 610 50 560 10 10 - -
Waveney - - - - - - - - - -
Unallocated - - - - - - - - - -
Source : Defence Statistics
Suffolk
MOD Total Military Civilians
Region Total
Cambridgeshire
Total Officers
Essex
Civilians Non Industrial
Industrial Trading Funds
Section 3: ENGLANDTable 3.6a East of England: MOD Personnel by local authority area as at 1 April 2013
TotalMilitary
Hertfordshire
Norfolk
Other Ranks
Total
18
Page 19
County or Unitary Authority
Local authority area
720 300 410 7,980 980 7,000 6,680 1,080 5,600
Bedford - - - - - - - - -
Central Bedfordshire 120 20 100 600 130 480 790 200 590
Luton - - - 10 - 10 - - -
Peterborough 20 20 - 40 20 20 1,260 150 1,100
Southend-on-Sea - - - - - - - - -
Thurrock - - - - - - - - -
20 10 10 360 50 300 340 100 250
Cambridge - - - 20 10 20 10 - -
East Cambridgeshire - - - - - - - - -
Fenland - - - - - - - - -
Huntingdonshire 20 10 10 40 10 30 310 80 230
South Cambridgeshire - - - 290 30 260 20 10 10
10 - 10 3,830 350 3,480 50 20 30
Basildon - - - - - - - - -
Braintree - - - 10 - 10 - - -
Brentwood - - - - - - - - -
Castle Point - - - - - - - - -
Chelmsford - - - - - - - - -
Colchester 10 - 10 2,990 280 2,720 50 20 30
Epping Forest - - - - - - - - -
Harlow - - - - - - - - -
Maldon - - - - - - - - -
Rochford - - - - - - - - -
Tendring - - - - - - - - -
Uttlesford - - - 820 70 750 - - -
520 250 270 240 150 80 330 170 160
Broxbourne - - - - - - - - -
Dacorum - - - - - - - - -
East Hertfordshire - - - - - - - - -
Hertsmere - - - - - - - - -
North Hertfordshire - - - - - - - - -
St Albans - - - - - - - - -
Stevenage - - - - - - - - -
Three Rivers 520 250 270 230 150 80 330 170 160
Watford - - - - - - - - -
Welwyn Hatfield - - - - - - - - -
- - - 500 50 450 2,530 240 2,290
Breckland - - - 470 40 430 - - -
Broadland - - - - - - - - -
Great Yarmouth - - - - - - - - -
Kings Lynn and West Norfolk - - - 20 10 10 2,490 240 2,250
North Norfolk - - - - - - 30 - 30
Norwich - - - 10 - 10 - - -
South Norfolk - - - - - - - - -
20 10 10 2,400 230 2,180 1,390 210 1,180
Babergh - - - - - - - - -
Forest Heath - - - - - - - - -
Ipswich - - - - - - - - -
Mid Suffolk 10 10 - 1,470 140 1,330 40 10 30
St Edmundsbury - - - 320 40 280 1,350 200 1,150
Suffolk Coastal - - - 610 50 560 - - -
Waveney - - - - - - - - -
Source : Defence Statistics
Norfolk
Suffolk
Other Ranks
Essex
Hertfordshire
Officers
Cambridgeshire
Region Total
TotalTotal Officers Other Ranks
TotalOther Ranks
Officers
Section 3: ENGLANDTable 3.6b East of England: UK Regular Forces by local authority area as at 1 April 2013
Naval Service Royal Air ForceArmy
19
Page 20
County or Unitary Authority
Local authority area
8,760 5,070 3,690 5,070 1,440 3,630 3,690 3,460 220 10
City of London - - - - - - - - - -
Barking and Dagenham - - - - - - - - - -
Barnet 10 - 10 - - - 10 - - -
Bexley 20 10 10 10 - 10 10 - 10 -
Brent 10 10 - 10 - 10 - - - -
Bromley - - - - - - - - - -
Camden 430 270 150 270 130 150 150 110 40 -
Croydon 30 20 10 20 10 10 10 - - -
Ealing - - - - - - - - - -
Enfield - - - - - - - - - -
Greenwich 960 820 140 820 60 760 140 110 30 10
Hackney 20 10 10 10 - - 10 10 - -
Hammersmith and Fulham 10 10 - 10 - - - - - -
Haringey 10 - - - - - - - - -
Harrow - - - - - - - - - -
Havering - - - - - - - - - -
Hillingdon 1,190 820 370 820 160 660 370 340 40 -
Hounslow 1,090 680 410 680 70 610 410 400 10 -
Islington 20 10 10 10 - 10 10 - 10 -
Kensington and Chelsea 20 10 - 10 10 - - - - -
Kingston upon Thames 10 - - - - - - - - -
Lambeth 20 10 10 10 - 10 10 10 - -
Lewisham 30 20 10 20 - 10 10 10 10 -
Merton 10 - 10 - - - 10 - 10 -
Newham - - - - - - - - - -
Redbridge 10 - - - - - - - - -
Richmond Upon Thames 120 90 30 90 10 80 30 30 - -
Southwark 20 20 10 20 - 10 10 - - -
Sutton - - - - - - - - - -
Tower Hamlets 30 20 20 20 10 10 20 20 - -
Waltham Forest - - - - - - - - - -
Wandsworth 40 20 20 20 10 10 20 10 10 -
Westminster 4,610 2,200 2,410 2,200 950 1,250 2,410 2,380 30 -
Unallocated 20 - 20 - - - 20 10 10 -
Source : Defence Statistics
Trading Funds
MOD Total MilitaryNon
IndustrialIndustrialTotal
Section 3: ENGLAND
Region Total
CiviliansTotal Military Civilians Total Officers Other
Ranks
Table 3.7a Greater London: MOD Personnel by local authority area as at 1 April 2013
20
Page 21
County or Unitary Authority
Local authority area
430 320 110 3,530 670 2,850 1,110 440 670
City of London - - - - - - - - -
Barking and Dagenham - - - - - - - - -
Barnet - - - - - - - - -
Bexley - - - 10 - 10 - - -
Brent - - - 10 - 10 - - -
Bromley - - - - - - - - -
Camden 30 20 10 190 70 110 50 30 20
Croydon - - - 20 10 10 - - -
Ealing - - - - - - - - -
Enfield - - - - - - - - -
Greenwich - - - 820 60 760 - - -
Hackney - - - 10 - - - - -
Hammersmith and Fulham - - - 10 - - - - -
Haringey - - - - - - - - -
Harrow - - - - - - - - -
Havering - - - - - - - - -
Hillingdon 20 10 10 130 40 100 670 120 560
Hounslow 10 10 - 660 60 600 10 10 10
Islington - - - 10 - 10 - - -
Kensington and Chelsea - - - - - - 10 10 -
Kingston upon Thames - - - - - - - - -
Lambeth - - - - - - - - -
Lewisham - - - 20 - 10 - - -
Merton - - - - - - - - -
Newham - - - - - - - - -
Redbridge - - - - - - - - -
Richmond Upon Thames - - - 90 10 80 - - -
Southwark - - - 10 - 10 - - -
Sutton - - - - - - - - -
Tower Hamlets 20 10 10 - - - - - -
Waltham Forest - - - - - - - - -
Wandsworth 10 - - 10 - 10 - - -
Westminster 340 280 70 1,500 390 1,100 360 280 80
Source : Defence Statistics
Section 3: ENGLANDTable 3.7b Greater London: UK Regular Forces by local authority area as at 1 April 2013
Officers
Region Total
Total OfficersNaval Service
Other Ranks
Royal Air ForceTotal Other
RanksTotal Officers Other
Ranks
Army
21
Page 22
County or Unitary Authority
Local authority area
53,380 42,330 11,050 42,330 9,230 33,100 11,050 7,690 1,380 1,970
Bracknell Forest 1,220 990 230 990 720 270 230 180 40 -Brighton and Hove 20 10 10 10 - 10 10 - - -Isle of Wight - - - - - - - - - -Medway 810 670 150 670 110 560 150 140 10 -Milton Keynes 90 80 10 80 10 70 10 - - -Portsmouth 8,490 7,090 1,400 7,090 1,440 5,640 1,400 1,300 100 -Reading 20 10 10 10 - 10 10 - - -Slough - - - - - - - - - -Southampton 50 40 10 40 10 30 10 10 - -West Berkshire 1,010 300 710 300 40 260 710 680 30 -Windsor and Maidenhead 1,110 1,090 20 1,090 100 990 20 20 - -Wokingham 780 660 120 660 90 570 120 120 - -
3,090 2,420 670 2,420 1,080 1,340 670 660 10 -
Aylesbury Vale 1,080 920 160 920 120 790 160 160 - -Chiltern 70 - 70 - - - 70 70 - -South Bucks 140 140 - 140 80 60 - - - -Wycombe 1,800 1,360 440 1,360 880 490 440 440 - -
10 - 10 - - - 10 - - -
Eastbourne 10 - - - - - - - - -Hastings - - - - - - - - - -Lewes - - - - - - - - - -Rother - - - - - - - - - -Wealden - - - - - - - - - -
17,580 13,330 4,250 13,330 2,590 10,740 4,250 2,650 450 1,160
Basingstoke and Deane - - - - - - - - - -East Hampshire 1,580 1,420 170 1,420 60 1,360 170 140 30 -Eastleigh - - - - - - - - - -Fareham 1,620 1,460 170 1,460 410 1,050 170 160 - -Gosport 2,140 1,480 660 1,480 260 1,220 660 470 190 -Hart 2,810 2,700 110 2,700 350 2,360 110 80 30 -Havant - - - - - - - - - -New Forest 760 630 130 630 40 590 130 80 50 -Rushmoor 3,380 2,880 510 2,880 400 2,480 510 480 10 10Test Valley 2,560 1,400 1,170 1,400 880 510 1,170 1,010 110 50Winchester 2,710 1,360 1,340 1,360 190 1,170 1,340 220 30 1,100
2,550 1,390 1,160 1,390 190 1,200 1,160 260 80 810
Ashford 10 - 10 - - - 10 - 10 -Canterbury 580 550 20 550 40 510 20 20 - -Dartford - - - - - - - - - -Dover - - - - - - - - - -Gravesham - - - - - - - - - -Maidstone 470 450 20 450 40 410 20 20 - -Sevenoaks 890 20 860 20 20 - 860 50 - 810Shepway 520 330 190 330 80 240 190 160 40 -Swale - - - - - - - - - -Thanet 70 30 40 30 - 30 40 20 20 -Tonbridge and Malling 10 - - - - - - - - -Tunbridge Wells 10 - - - - - - - - -
11,260 9,780 1,480 9,780 1,970 7,810 1,480 960 510 -
Cherwell 1,340 630 710 630 60 560 710 420 290 -Oxford 50 40 10 40 10 30 10 - - -South Oxfordshire 2,090 1,960 130 1,960 300 1,660 130 70 60 -Vale of White Horse 2,800 2,540 270 2,540 950 1,590 270 250 20 -West Oxfordshire 4,980 4,610 360 4,610 650 3,960 360 220 140 -
4,250 3,550 700 3,550 800 2,760 700 600 100 -
Elmbridge - - - - - - - - - -Epsom and Ewell 10 - - - - - - - - -Guildford 2,350 2,130 220 2,130 140 1,980 220 170 50 -Mole Valley 340 150 180 150 50 100 180 170 20 -Reigate and Banstead 10 - - - - - - - - -Runnymede - - - - - - - - - -Spelthorne - - - - - - - - - -Surrey Heath 1,550 1,270 280 1,270 610 660 280 250 30 -Tandridge - - - - - - - - - -Waverley - - - - - - - - - -Woking - - - - - - - - - -
950 920 30 920 80 840 30 20 10 -
Adur - - - - - - - - - -Arun - - - - - - - - - -Chichester 930 910 20 910 70 840 20 20 10 -Crawley 10 10 10 10 - - 10 - - -Horsham - - - - - - - - - -Mid Sussex - - - - - - - - - -Worthing - - - - - - - - - -
Unallocated 100 - 100 - - - 100 80 10 -Source : Defence Statistics
Industrial Trading Funds
Total
Section 3: ENGLANDTable 3.8a South East: MOD Personnel by local authority area as at 1 April 2013
MOD Total Military CiviliansNon
IndustrialTotal Military
Surrey
Region Total
Buckinghamshire
Officers Other Ranks
Civilians Total
West Sussex
East Sussex
Hampshire
Kent
Oxfordshire
22
Page 23
County or Unitary Authority
Local authority area
10,280 2,270 8,010 21,250 4,450 16,800 10,800 2,500 8,290
Bracknell Forest - - - 990 720 270 - - -Brighton and Hove - - - 10 - 10 - - -Isle of Wight - - - - - - - - -Medway 10 - 10 650 110 550 10 - -Milton Keynes - - - 80 10 70 - - -Portsmouth 6,840 1,370 5,470 180 50 130 70 30 50Reading - - - 10 - 10 - - -Slough - - - - - - - - -Southampton 20 - 20 10 - 10 - - -West Berkshire - - - 300 40 260 - - -Windsor and Maidenhead - - - 1,090 100 990 - - -Wokingham 10 - 10 650 90 560 - - -
70 40 20 140 70 60 2,210 960 1,250
Aylesbury Vale 30 20 10 20 10 10 870 90 770Chiltern - - - - - - - - -South Bucks 30 20 10 80 40 40 30 20 10Wycombe 10 10 - 30 20 10 1,320 840 470
- - - - - - - - -
Eastbourne - - - - - - - - -Hastings - - - - - - - - -Lewes - - - - - - - - -Rother - - - - - - - - -Wealden - - - - - - - - -
2,880 640 2,230 8,390 1,530 6,860 2,060 420 1,650
Basingstoke and Deane - - - - - - - - -East Hampshire 70 - 70 1,330 60 1,270 20 - 20Eastleigh - - - - - - - - -Fareham 1,340 360 980 - - - 120 50 70Gosport 1,330 220 1,110 130 30 100 20 10 10Hart - - - 1,030 100 940 1,670 250 1,420Havant - - - - - - - - -New Forest - - - 630 40 590 - - -Rushmoor 20 10 10 2,830 380 2,450 30 10 20Test Valley 30 30 - 1,300 800 500 60 60 10Winchester 90 30 60 1,130 130 1,000 150 40 110
20 - 10 1,330 180 1,150 40 10 30
Ashford - - - - - - - - -Canterbury - - - 550 40 510 - - -Dartford - - - - - - - - -Dover - - - - - - - - -Gravesham - - - - - - - - -Maidstone - - - 450 40 410 - - -Sevenoaks - - - 20 20 - - - -Shepway 20 - 10 300 80 220 10 - 10Swale - - - - - - - - -Thanet - - - - - - 30 - 20Tonbridge and Malling - - - - - - - - -Tunbridge Wells - - - - - - - - -
310 190 120 3,240 730 2,510 6,230 1,050 5,180
Cherwell - - - 600 50 550 20 10 20Oxford 10 - - 10 - 10 20 10 10South Oxfordshire 130 20 110 240 30 210 1,600 250 1,340Vale of White Horse 170 170 - 2,210 630 1,580 160 150 10West Oxfordshire - - - 180 20 160 4,430 630 3,800
120 20 110 3,270 740 2,530 160 40 120
Elmbridge - - - - - - - - -Epsom and Ewell - - - - - - - - -Guildford 100 10 90 1,950 130 1,820 80 - 70Mole Valley 10 - 10 80 30 50 60 20 40Reigate and Banstead - - - - - - - - -Runnymede - - - - - - - - -Spelthorne - - - - - - - - -Surrey Heath 10 10 - 1,230 580 650 20 10 10Tandridge - - - - - - - - -Waverley - - - - - - - - -Woking - - - - - - - - -
- - - 910 70 840 - - -
Adur - - - - - - - - -Arun - - - - - - - - -Chichester - - - 910 70 840 - - -Crawley - - - 10 - - - - -Horsham - - - - - - - - -Mid Sussex - - - - - - - - -Worthing - - - - - - - - -
Source : Defence Statistics
Section 3: ENGLANDTable 3.8b South East: UK Regular Forces by local authority area as at 1 April 2013
Kent
Oxfordshire
OfficersNaval Service Army Royal Air Force
Total
Surrey
West Sussex
East Sussex
Hampshire
Other Ranks
Total Officers Other Ranks
Region Total
Total Officers Other Ranks
Buckinghamshire
23
Page 24
County or Unitary Authority
Local authority area
54,190 37,230 16,950 37,230 6,300 30,940 16,950 12,610 1,110 3,240
Bath and North East Somerset 150 40 110 40 10 40 110 100 10 -
Bournemouth 10 10 - 10 - 10 - - - -
Bristol - City of 100 60 40 60 10 50 40 20 20 -
Cornwall 3,690 3,230 460 3,230 510 2,720 460 310 150 -
Isle of Scilly - - - - - - - - - -
North Somerset - - - - - - - - - -
Plymouth 6,700 5,830 870 5,830 810 5,020 870 750 120 -
Poole 1,040 950 90 950 100 850 90 50 40 -
South Gloucestershire 8,800 1,440 7,360 1,440 1,000 440 7,360 7,250 100 10
Swindon 20 10 20 10 - 10 20 10 - -
Torbay - - - - - - - - - -
Wiltshire 18,800 14,330 4,470 14,330 1,980 12,340 4,470 2,400 230 1,850
4,140 3,790 340 3,790 650 3,140 340 210 130 -
East Devon 1,910 1,820 90 1,820 160 1,660 90 70 20 -
Exeter 110 60 50 60 10 40 50 50 10 -
Mid Devon - - - - - - - - - -
North Devon 980 870 110 870 90 780 110 50 50 -
South Hams 1,080 1,050 30 1,050 390 650 30 30 - -
Teignbridge 60 - 60 - - - 60 20 40 -
Torridge - - - - - - - - - -
West Devon - - - - - - - - - -
3,210 2,170 1,040 2,170 260 1,920 1,040 580 110 350
Christchurch - - - - - - - - - -
East Dorset 80 20 50 20 10 20 50 20 30 -
North Dorset 1,860 1,430 430 1,430 150 1,270 430 390 50 -
Purbeck 1,250 720 540 720 100 620 540 160 20 350
West Dorset 20 - 20 - - - 20 - 10 -
Weymouth and Portland - - - - - - - - - -
2,500 2,070 430 2,070 360 1,720 430 340 90 -
Cheltenham 260 260 10 260 40 220 10 10 - -
Cotswold 570 400 170 400 70 330 170 90 80 -
Forest of Dean 660 640 20 640 50 590 20 20 - -
Gloucester 40 20 20 20 - 10 20 20 - -
Stroud - - - - - - - - - -
Tewkesbury 980 760 210 760 200 560 210 210 10 -
5,000 3,290 1,710 3,290 600 2,690 1,710 580 100 1,030
Mendip - - - - - - - - - -
Sedgemoor - - - - - - - - - -
South Somerset 3,140 2,520 620 2,520 550 1,970 620 540 80 -
Taunton Deane 1,860 780 1,080 780 60 720 1,080 30 10 1,030
West Somerset - - - - - - - - - -
Unallocated 10 - 10 - - - 10 10 - -
Source : Defence Statistics
Section 3: ENGLAND
Total Officers Other Ranks
MOD Total Military
Table 3.9a South West: MOD Personnel by local authority area as at 1 April 2013
TotalCivilians
Region Total
Civilians Trading Funds
Military Total Non Industrial
Industrial
Somerset
Gloucestershire
Dorset
Devon
24
Page 25
County or Unitary Authority
Local authority area
16,540 2,910 13,630 19,000 2,620 16,380 1,690 760 930
Bath and North East Somerset 20 - 20 20 - 10 - - -
Bournemouth - - - - - - - - -
Bristol - City of 30 10 20 20 - 20 - - -
Cornwall 3,010 480 2,520 30 - 30 190 20 170
Isle of Scilly - - - - - - - - -
North Somerset - - - - - - - - -
Plymouth 5,420 740 4,680 380 50 330 30 20 20
Poole 820 80 740 120 20 100 10 - 10
South Gloucestershire 490 360 130 430 280 150 520 360 160
Swindon - - - - - - - - -
Torbay - - - - - - - - -
Wiltshire 170 90 80 13,470 1,620 11,850 690 270 420
3,280 580 2,710 480 60 420 30 10 20
East Devon 1,810 150 1,660 10 - - - - -
Exeter - - - 50 10 40 10 - -
Mid Devon - - - - - - - - -
North Devon 430 30 400 420 40 370 20 10 10
South Hams 1,040 390 650 - - - - - -
Teignbridge - - - - - - - - -
Torridge - - - - - - - - -
West Devon - - - - - - - - -
60 10 50 2,090 250 1,840 20 10 20
Christchurch - - - - - - - - -
East Dorset - - - 20 10 20 - - -
North Dorset 20 - 20 1,380 140 1,240 20 10 20
Purbeck 30 - 30 680 90 590 - - -
West Dorset - - - - - - - - -
Weymouth and Portland - - - - - - - - -
80 20 60 1,850 290 1,560 140 50 100
Cheltenham 60 10 60 100 10 90 90 20 80
Cotswold 10 10 - 380 50 330 10 10 -
Forest of Dean - - - 640 50 590 - - -
Gloucester - - - 10 - 10 10 - 10
Stroud - - - - - - - - -
Tewkesbury - - - 730 180 550 30 20 10
3,160 550 2,610 90 30 60 40 30 20
Mendip - - - - - - - - -
Sedgemoor - - - - - - - - -
South Somerset 2,390 490 1,900 80 30 50 40 30 20
Taunton Deane 770 60 710 10 - 10 - - -
West Somerset - - - - - - - - -
Source : Defence Statistics
Dorset
Army Royal Air Force
Region Total
Total Other Ranks
TotalNaval Service
Other Ranks
Section 3: ENGLANDTable 3.9b South West: UK Regular Forces by local authority area as at 1 April 2013
Total
Somerset
Gloucestershire
Officers Officers Other Ranks
Devon
Officers
25
Page 26
Unitary Authority
3,910 2,650 1,260 2,650 420 2,230 1,260 650 260 350
Blaenau Gwent - - - - - - - - - -
Bridgend - - - - - - - - - -
Caerphilly - - - - - - - - - -
Cardiff 120 60 60 60 10 50 60 40 20 -
Carmarthenshire 30 10 20 10 - 10 20 10 10 -
Ceredigion - - - - - - - - - -
Conwy 40 20 20 20 - 20 20 10 10 -
Denbighshire 10 - 10 - - - 10 - 10 -
Flintshire 380 10 370 10 - 10 370 40 - 330
Gwynedd 30 20 10 20 - 20 10 - - -
Isle of Anglesey 450 380 80 380 160 210 80 70 - -
Merthyr Tydfil - - - - - - - - - -
Monmouthshire 20 10 10 10 - 10 10 - - -
Neath Port Talbot - - - - - - - - - -
Newport 40 10 30 10 - 10 30 20 10 -
Pembrokeshire 730 690 30 690 50 640 30 30 10 -
Powys 600 330 270 330 90 240 270 160 100 10
Rhondda, Cynon, Taff 10 - 10 - - - 10 10 - -
Swansea 40 20 10 20 - 20 10 10 10 -
The Vale of Glamorgan 1,360 1,060 300 1,060 80 980 300 230 70 -
Torfaen - - - - - - - - - -
Wrexham 50 30 20 30 10 20 20 10 10 -
Unallocated 10 - 10 - - - 10 - 10 -
Source : Defence Statistics
Unitary Authority
140 20 120 1,800 220 1,580 720 190 540
Blaenau Gwent - - - - - - - - -
Bridgend - - - - - - - - -
Caerphilly - - - - - - - - -
Cardiff - - - 50 10 40 10 - -
Carmarthenshire - - - - - - - - -
Ceredigion - - - - - - - - -
Conwy - - - - - - 10 - 10
Denbighshire - - - - - - - - -
Flintshire - - - 10 - 10 - - -
Gwynedd - - - - - - 20 - 20
Isle of Anglesey 10 - - 10 - 10 360 160 200
Merthyr Tydfil - - - - - - - - -
Monmouthshire - - - 10 - 10 - - -
Neath Port Talbot - - - - - - - - -
Newport - - - 10 - 10 - - -
Pembrokeshire - - - 670 50 620 20 - 20
Powys - - - 310 90 230 10 - 10
Rhondda, Cynon, Taff - - - - - - - - -
Swansea - - - 20 - 20 - - -
The Vale of Glamorgan 120 10 100 650 50 600 290 20 270
Torfaen - - - - - - - - -
Wrexham - - - 20 10 20 10 - -
Source : Defence Statistics
TotalOfficers Other Ranks
Non Industrial
Wales
Naval Service
Military Civilians
Total Officers
Total
Other Ranks
Table 4.1b UK Regular Forces by local authority area as at 1 April 2013
Army
Section 4: WALES'Table 4.1a MOD Personnel by local authority area as at 1 April 2013
Section 4: WALES
MOD Total Military Civilians
Wales
Trading Funds
IndustrialTotal
Total OfficersRoyal Air Force
Total Officers Other Ranks
Other Ranks
26
Page 27
Unitary Authority
15,160 11,140 4,020 11,140 1,390 9,750 4,020 3,180 760 80
Aberdeen City 70 20 50 20 - 10 50 50 - -Aberdeenshire 60 20 40 20 - 20 40 40 - -Angus 710 670 40 670 50 620 40 20 20 -Argyll & Bute 4,770 3,490 1,280 3,490 440 3,050 1,280 1,180 90 -Clackmannanshire - - - - - - - - - -Dumfries & Galloway 10 - 10 - - - 10 10 - -Dundee City 60 40 20 40 10 40 20 10 10 -East Ayrshire - - - - - - - - - -East Dunbartonshire - - - - - - - - - -East Lothian - - - - - - - - - -East Renfrewshire - - - - - - - - - -Edinburgh - City of 1,600 1,370 230 1,370 110 1,260 230 190 40 -Eilean Siar 10 10 - 10 - 10 - - - -Falkirk 10 - 10 - - - 10 - 10 -Fife 1,840 1,360 470 1,360 160 1,210 470 320 150 -Glasgow City 1,270 440 840 440 190 250 840 800 40 -Highland 640 590 50 590 40 550 50 40 10 -Inverclyde 10 - 10 - - - 10 10 - -Midlothian 630 620 10 620 40 580 10 10 - -Moray 2,580 2,310 280 2,310 280 2,020 280 150 130 -North Ayrshire 270 - 260 - - - 260 120 140 -North Lanarkshire - - - - - - - - - -Orkney Islands - - - - - - - - - -Perth & Kinross 30 10 10 10 - 10 10 10 10 -Renfrewshire 20 - 10 - - - 10 10 - -Scottish Borders - - - - - - - - - -Shetland Islands - - - - - - - - - -South Ayrshire 120 80 30 80 40 50 30 20 10 -South Lanarkshire 10 - 10 - - - 10 - - -Stirling 320 80 250 80 20 60 250 140 30 80West Dunbartonshire 100 - 100 - - - 100 60 40 -West Lothian - - - - - - - - - -
Unallocated 10 - 10 - - - 10 - 10 -Source : Defence Statistics
Unitary Authority
4,340 550 3,800 3,640 440 3,200 3,150 400 2,750
Aberdeen City 10 - - 10 - 10 - - -Aberdeenshire - - - - - - 20 - 20Angus 570 40 530 100 10 90 - - -Argyll & Bute 3,490 440 3,050 - - - - - -Clackmannanshire - - - - - - - - -Dumfries & Galloway - - - - - - - - -Dundee City - - - 40 10 30 - - -East Ayrshire - - - - - - - - -East Dunbartonshire - - - - - - - - -East Lothian - - - - - - - - -East Renfrewshire - - - - - - - - -Edinburgh - City of - - - 1,350 110 1,240 10 - 10Eilean Siar - - - - - - 10 - 10Falkirk - - - - - - - - -Fife 110 20 90 40 20 20 1,220 130 1,090Glasgow City 120 20 100 300 160 140 20 10 10Highland 10 - - 560 30 530 20 - 20Inverclyde - - - - - - - - -Midlothian - - - 620 40 580 - - -Moray - - - 500 40 460 1,800 240 1,560North Ayrshire - - - - - - - - -North Lanarkshire - - - - - - - - -Orkney Islands - - - - - - - - -Perth & Kinross - - - 10 - 10 - - -Renfrewshire - - - - - - - - -Scottish Borders - - - - - - - - -Shetland Islands - - - - - - - - -South Ayrshire 30 20 10 10 - 10 50 20 30South Lanarkshire - - - - - - - - -Stirling - - - 80 20 60 - - -West Dunbartonshire - - - - - - - - -West Lothian - - - - - - - - -
Source : Defence Statistics
Section 5: SCOTLAND'Table 5.1a MOD Personnel by local authority area as at 1 April 2013
Section 5: SCOTLAND
Industrial Trading Funds
CiviliansNon
IndustrialTotal
Scotland
Scotland
Total Officers Other Ranks
'Table 5.1b UK Regular Forces by local authority area as at 1 April 2013
Army Royal Air ForceTotal Officers
Naval ServiceTotal Officers Other
RanksOther Ranks
MOD Total MilitaryTotal Military Civilians Total Officers Other
Ranks
27
Page 28
District
4,030 2,530 1,500 2,530 250 2,280 1,500 910 580 10
Antrim 1,090 750 340 750 70 680 340 180 160 -
Ards 10 - 10 - - - 10 - - -
Armagh 10 - 10 - - - 10 - - -
Ballymena - - - - - - - - - -
Ballymoney - - - - - - - - - -
Banbridge - - - - - - - - - -
Belfast 90 20 70 20 - 10 70 40 30 10
Carrickfergus - - - - - - - - - -
Castlereagh 10 10 - 10 - 10 - - - -
Coleraine 20 - 20 - - - 20 20 - -
Cookstown - - - - - - - - - -
Craigavon 20 10 10 10 - 10 10 10 10 -
Derry City - - - - - - - - - -
Down 760 580 180 580 40 540 180 120 60 -
Dungannon - - - - - - - - - -
Fermanagh 20 - 20 - - - 20 20 - -
Larne - - - - - - - - - -
Limavady 60 - 60 - - - 60 40 10 -
Lisburn 990 550 450 550 70 470 450 290 160 -
Magherafelt - - - - - - - - - -
Moyle - - - - - - - - - -
Newry and Mourne - - - - - - - - - -
Newtownabbey 10 - 10 - - - 10 - - -
North Down 930 600 320 600 50 550 320 200 130 -
Omagh - - - - - - - - - -
Strabane - - - - - - - - - -
Unallocated 10 - 10 - - - 10 - 10 -
Source : Defence Statistics
District
10 - - 2,430 230 2,200 90 20 70
Antrim - - - 670 60 610 80 10 60
Ards - - - - - - - - -
Armagh - - - - - - - - -
Ballymena - - - - - - - - -
Ballymoney - - - - - - - - -
Banbridge - - - - - - - - -
Belfast - - - 20 - 10 - - -
Carrickfergus - - - - - - - - -
Castlereagh - - - 10 - 10 - - -
Coleraine - - - - - - - - -
Cookstown - - - - - - - - -
Craigavon - - - 10 - 10 - - -
Derry City - - - - - - - - -
Down - - - 580 40 540 - - -
Dungannon - - - - - - - - -
Fermanagh - - - - - - - - -
Larne - - - - - - - - -
Limavady - - - - - - - - -
Lisburn 10 - - 540 70 470 - - -
Magherafelt - - - - - - - - -
Moyle - - - - - - - - -
Newry and Mourne - - - - - - - - -
Newtownabbey - - - - - - - - -
North Down - - - 600 50 550 - - -
Omagh - - - - - - - - -
Strabane - - - - - - - - -
Source : Defence Statistics
Section 6: NORTHERN IRELAND
Other Ranks
TotalTotal Military Civilians Trading Funds
'Table 6.1a MOD Personnel by local authority area as at 1 April 2013
TotalCivilians
Non Industrial
Officers
Other Ranks
Industrial
Total Officers
Military
Other Ranks
Northern Ireland
Officers Total
Northern Ireland
MOD Total
TotalArmy
Section 6: NORTHERN IRELAND'Table 6.1b UK Regular Forces by local authority area as at 1 April 2013
OfficersRoyal Air Force
Other Ranks
Naval Service
28


![CENSUS 2011 - Statistical Release [P030142011]](https://static.documents.pub/doc/80x56/577cdaf31a28ab9e78a6f8f6/census-2011-statistical-release-p030142011.jpg)


