Eur. Phys. J. Appl. Phys. manuscript No. (will be inserted by the editor) Statistical Uncertainty in Quantitative Neutron Radiography F. M. Piegsa a,1 , A. P. Kaestner b,2 , A. Antognini 1,2 , A. Eggenberger 1 , K. Kirch 1,2 , G. Wichmann 1 1 ETH Z¨ urich, Institute for Particle Physics, CH-8093 Z¨ urich, Switzerland 2 Paul Scherrer Institute, CH-5232 Villigen, Switzerland Received: date / Accepted: date Abstract We demonstrate a novel procedure to cali- brate neutron detection systems commonly used in stan- dard neutron radiography. This calibration allows de- termining the uncertainties due to Poisson-like neutron counting statistics for each individual pixel of a radio- graphic image. The obtained statistical errors are neces- sary in order to perform a correct quantitative analysis. This fast and convenient method is applied to data mea- sured at the cold neutron radiography facility ICON at the Paul Scherrer Institute. Moreover, from the re- sults the effective neutron flux at the beam line is de- termined. Keywords Neutron physics · Neutron Radiography · Statistical Uncertainty 1 Introduction Neutron radiography and tomography represent pow- erful non-destructive imaging techniques [1]. They are applied in a variety of different fields of science rang- ing from physics investigations to engineering, cultural heritage, biology etc. A recent comprehensive overview covering the entire spectrum of research applications is given in the proceedings of the 10 th World Conference on Neutron Radiography [2]. A list of neutron radio- graphy facilities around the world in operation using spallation and reactor sources can be found in [3,4]. Until now, most neutron radiography experiments aim at quantifying information based on the transmission through the samples or shapes present in the images. For this kind of quantification the absolute number of neutrons and the corresponding statistical uncertainty a e-mail: fl[email protected]b e-mail: [email protected]are less relevant. However, real quantitative data assess- ment involving dedicated and extensive analysis proce- dures, e.g. curve-fitting or interpretation of scattering data, is becoming more and more important. Examples of such applications encompass for instance polarized neutron radiography [5,6,7,8,9,10,11,12] and various novel techniques with an explicit overlap of neutron scattering and radiography, e.g. grating interferometry or multiple small angle neutron scattering etc. [13,14, 15, 16, 17, 18, 19, 20, 21]. For the quantitative analysis us- ing these methods it is inevitable to assign proper sta- tistical errors to the measured data values for each in- dividual pixel. 1 This is not only essential in order to perform a valid regression analysis with weighted data points, but also to optimize the achievable signal-to- noise ratio and thus ultimately the image quality. The latter is especially important in the realm of low-dose neutron radiography, i.e. dynamic, fast, and/or high- resolution imaging [23,24,25]. Furthermore, this knowl- edge allows then for a detailed off-line evaluation of the feasibility of planned experiments and investigations. The challenge lies in transferring the measured inten- sity in arbitrary units of the two-dimensional detector, usually given in grayscale values of a CCD-camera, into actual neutron counts with a corresponding statistical error. In the present article, we describe a procedure which allows for a calibration of a standard neutron imaging system without any additional detection equip- ment, i.e. a 3 He gas detector or gold foil activation anal- ysis. The method is demonstrated at a cold neutron source, however, the results can be easily adopted to 1 The problem appeared already in one of our earlier pub- lications investigating a 3 He gas density gradient at low tem- peratures [22]. Here, we present a dedicated and systematic study of the developed calibration procedure. arXiv:1603.06849v2 [physics.data-an] 28 Apr 2017
Transcript
Eur. Phys. J. Appl. Phys. manuscript No.(will be inserted by the editor)
Statistical Uncertainty in Quantitative Neutron Radiography
F. M. Piegsaa,1, A. P. Kaestnerb,2, A. Antognini1,2, A. Eggenberger1,
K. Kirch1,2, G. Wichmann1
1ETH Zurich, Institute for Particle Physics, CH-8093 Zurich, Switzerland2Paul Scherrer Institute, CH-5232 Villigen, Switzerland
Received: date / Accepted: date
Abstract We demonstrate a novel procedure to cali-
brate neutron detection systems commonly used in stan-
dard neutron radiography. This calibration allows de-
termining the uncertainties due to Poisson-like neutron
counting statistics for each individual pixel of a radio-
graphic image. The obtained statistical errors are neces-
sary in order to perform a correct quantitative analysis.
This fast and convenient method is applied to data mea-
sured at the cold neutron radiography facility ICON
at the Paul Scherrer Institute. Moreover, from the re-
sults the effective neutron flux at the beam line is de-
are less relevant. However, real quantitative data assess-
ment involving dedicated and extensive analysis proce-
dures, e.g. curve-fitting or interpretation of scattering
data, is becoming more and more important. Examples
of such applications encompass for instance polarized
neutron radiography [5,6,7,8,9,10,11,12] and various
novel techniques with an explicit overlap of neutron
scattering and radiography, e.g. grating interferometry
or multiple small angle neutron scattering etc. [13,14,
15,16,17,18,19,20,21]. For the quantitative analysis us-
ing these methods it is inevitable to assign proper sta-
tistical errors to the measured data values for each in-
dividual pixel.1 This is not only essential in order to
perform a valid regression analysis with weighted data
points, but also to optimize the achievable signal-to-
noise ratio and thus ultimately the image quality. The
latter is especially important in the realm of low-dose
neutron radiography, i.e. dynamic, fast, and/or high-
resolution imaging [23,24,25]. Furthermore, this knowl-
edge allows then for a detailed off-line evaluation of the
feasibility of planned experiments and investigations.
The challenge lies in transferring the measured inten-
sity in arbitrary units of the two-dimensional detector,
usually given in grayscale values of a CCD-camera, into
actual neutron counts with a corresponding statistical
error. In the present article, we describe a procedure
which allows for a calibration of a standard neutron
imaging system without any additional detection equip-
ment, i.e. a 3He gas detector or gold foil activation anal-
ysis. The method is demonstrated at a cold neutron
source, however, the results can be easily adopted to
1The problem appeared already in one of our earlier pub-lications investigating a 3He gas density gradient at low tem-peratures [22]. Here, we present a dedicated and systematicstudy of the developed calibration procedure.
arX
iv:1
603.
0684
9v2
[ph
ysic
s.da
ta-a
n] 2
8 A
pr 2
017
2
Fig. 1 Scheme of a standard neutron radiography detectionsystem. Neutrons hitting the scintillation screen are produc-ing scintillation light with an efficiency ε. The light is reflectedfrom a mirror to a CCD-camera. The process of light detec-tion and conversion to grayscale intensities with its accordingefficiencies is described by the scaling factor α.
a radiography facility with a different neutron energy
spectrum.
2 Description of the Method
For our method, we consider a neutron radiography de-
tection system consisting of a neutron-absorbing scin-
tillator screen which is recorded by means of a low-noise
CCD-camera (compare Fig. 1). However, any other de-
tection system with similar properties can be employed
equivalently, e.g. a neutron imaging plate [26,27]. The
analysis is resting upon four plausible assumptions: (a) The
neutron counting statistics is Poisson distributed and
for a large number of events the shape of this distribu-
tion can be approximated by a Gaussian. (b) The mea-
sured intensity is caused only by the neutrons, hence,
we do not take into account any potential background
due to γ-radiation. (c) As will be presented below, us-
ing modern CCD-cameras with a photo-sensitive chip
cooled to low temperatures the so-called dark current
and its corresponding noise are completely negligible.
The same is true for the read-out noise of the CCD.
(d) The grayscale intensity I is linearly proportional to
the number of absorbed neutrons. The last assumption
translates into the following equation:
I = αεN (1)
where α is a scaling factor of the detection/camera sys-
tem describing the conversion of light emitted by the
scintillation screen to photo-electrons in the CCD-chip.
Moreover, ε is the detection efficiency of the neutrons in
the scintillator and N is the number of neutrons hitting
the screen, respectively. Thus, the number of detected
neutrons is εN and the corresponding statistical uncer-
tainty due to Poisson statistics is given by√εN [28].
As a consequence, we find for the uncertainty of the
intensity:
δI = α√εN (2)
Alternatively, by combining Eq. (1) and (2) we obtain:
δI =√αI (3)
While these three equations are valid for each individ-
ual pixel of an image, we further assume that α and
ε do not depend on the position, i.e. ε has the same
value everywhere on the scintillator and α is constant
over the entire CCD-chip. This is another reasonable
presumption which can be experimentally confirmed by
exposing different areas of the scintillator with the same
neutron beam. From Eq. (3) it becomes obvious that in
order to calculate the statistical error δI for each pixel
it is necessary to determine the scaling factor α. Fur-
thermore, if α is known one can also directly infer on
the number of detected neutrons via the measured in-
tensity using Eq. (1).
To cancel out intensity variations or inhomogeneities of
the neutron beam over the field-of-view of the detec-
tion system, one usually performs a radiometric nor-
malization of the images with respect to a so-called
open beam image with much higher statistics, i.e. an
average of many images taken at long exposure times.
Here, this will be described by a normalization intensityI0 = αεN0. Hence, the relative intensity and relative
uncertainty of the intensity are given by:
I
I0=
N
N0and
δI
I0=
√α√I0·√
I
I0(4)
The gist of the new procedure is to determine α by
performing a set of measurements from which one ex-
tracts δI/I0 as a function of I/I0. This is done by tak-
ing images of the neutron beam for various exposure
times causing different accumulated intensities. Since
the exposure with neutrons is a statistical process the
intensity values of a large number of pixels will scatter
around their mean value with a Gaussian distribution.2
The width of this distribution arises from a contribu-
tion caused by the neutron Poisson statistics and the
2For very low intensities or count rates this might be alsodescribed by the related Rician distribution. This has been re-ported in an investigation concerning the signal-to-noise ratioin x-ray dark-field imaging [29].
3
Fig. 2 Mean intensity per pixel averaged over an area of200×200 pixels in arbitrary units (grayscale values) taken ata SINQ proton beam current of 1.5 mA. From the slope ofthe linear fits (lines) one can extract the mean accumulatedintensity per exposure time.
beam inhomogeneity over the considered area of pixels.
However, the latter is canceled out by normalizing with
the open beam image. Thus, the residual width then
directly corresponds to the relative uncertainty δI/I0.
3 Experiment and Data Analysis
In the following, example measurements and the cor-
responding data analysis are presented employing the
aforementioned method. The data has been collected at
the ICON imaging beam line at the continuous spalla-
tion neutron source SINQ at the Paul Scherrer Insti-
tute in Switzerland [30]. The radiographic images were
taken in the classic pinhole geometry with an aperture-
to-detector distance of approximately 6.5 m. A scintil-
lator screen made from 6Li/ZnS:Cu with a thickness
of 100 µm was used [31]. The scintillation light was
recorded with an ANDOR iKon-L CCD-camera with a
16 bit dynamic range and a 2048 × 2048 pixels photo-
sensitive chip cooled to −75°C [32]. With the camera, a
Nikkor 50 mm f/1.4 lens was employed. The measured
effective pixel size of the obtained neutron images was
approximately Aeff = 0.1× 0.1 mm2.
Firstly, a collection of so-called dark current images,
i.e. with the neutron beam off, were taken for differ-
ent exposure times of up to 60 s. This data is used
to investigate the intrinsic offset/bias and noise of the
CCD-chip. To ensure that the measured offset is not in-
creased by a potential afterglow of the scintillator the
detector has not been exposed to neutrons for at least
several hours prior to these measurements.
Secondly, images were taken at a SINQ proton beam
current of ISINQ = 1.5 mA. In order to perform a sys-
tematic investigation, data was acquired for two differ-
ent neutron beam aperture (pinhole) settings, namely
a diameter d of 10 mm and 20 mm, respectively. In the
analysis, only an area of 200×200 pixels, i.e. 2×2 cm2,
in the center of the images is considered which experi-
enced a very homogeneous neutron beam exposure. In
Fig. 2 the mean recorded intensity (in grayscale val-
ues) per pixel averaged over this area is plotted as
a function of the exposure time. The offset obtained
from the dark current measurements exhibits a con-
stant value of 1058 ± 1, even for very long exposure
times.3 The linear fits to the data points with the neu-
tron beam shutter open yield a mean accumulated in-
tensity per exposure time, i.e. the slope of the linear
fit, of I10 = (1381± 1) s−1 for an aperture diameter of
10 mm and I20 = (5321 ± 11) s−1 for an aperture di-
ameter of 20 mm, respectively.4 As expected, the inten-
sity scales roughly with the cross section of the neutron
beam aperture, i.e. with its diameter d squared.
In addition, two sets of 10 images each were recorded
with long exposure times tN of 10 s for the 10 mm
and 6 s for the 20 mm beam aperture, respectively.5
The pixel-wise averages of these sets serve as references
for the normalization of the aforementioned images ex-
posed for shorter times. Moreover, the constant offset
of 1058 is subtracted from each evaluated image to
compensate for the CCD-bias. These offset corrected
and normalized versions of the initial images are fur-
ther investigated by creating histograms of their rela-
tive intensity I/I0, again only considering the central
200 × 200 pixel area. Thus, each histogram represents
the spread of the pixel intensities of the 40000 pixels for
a certain exposure time. As an example, the results for
some of the images taken with the 20 mm beam aper-
ture are presented in Fig. 3. The individual histograms
exhibit a peak centered around the exposure time ra-
tio, e.g. the image exposed for 3 s has a mean relative
intensity of approximately 0.5 with respect to the nor-
malization with tN = 6 s. The width of the peaks can
be determined by applying a Gaussian fit to the data.
As expected, due to the Poisson nature of the neutron
statistic with increasing relative intensity the width of
these peaks become larger. Note, that the aforemen-
tioned intrinsic dark current noise and read-out noise
of the CCD-chip do not cause an additional broadening
of the peaks, since their contribution is in the range of
3A linear fit to the dark current data yields actually avery small intensity increase of IDC = (0.02 ± 0.01) s−1.
4All given uncertainties correspond to the standard errorsof a linear regression without weighting of the data points.
5Note, the maximum exposure time is limited by the sat-uration of the CCD-chip.
4
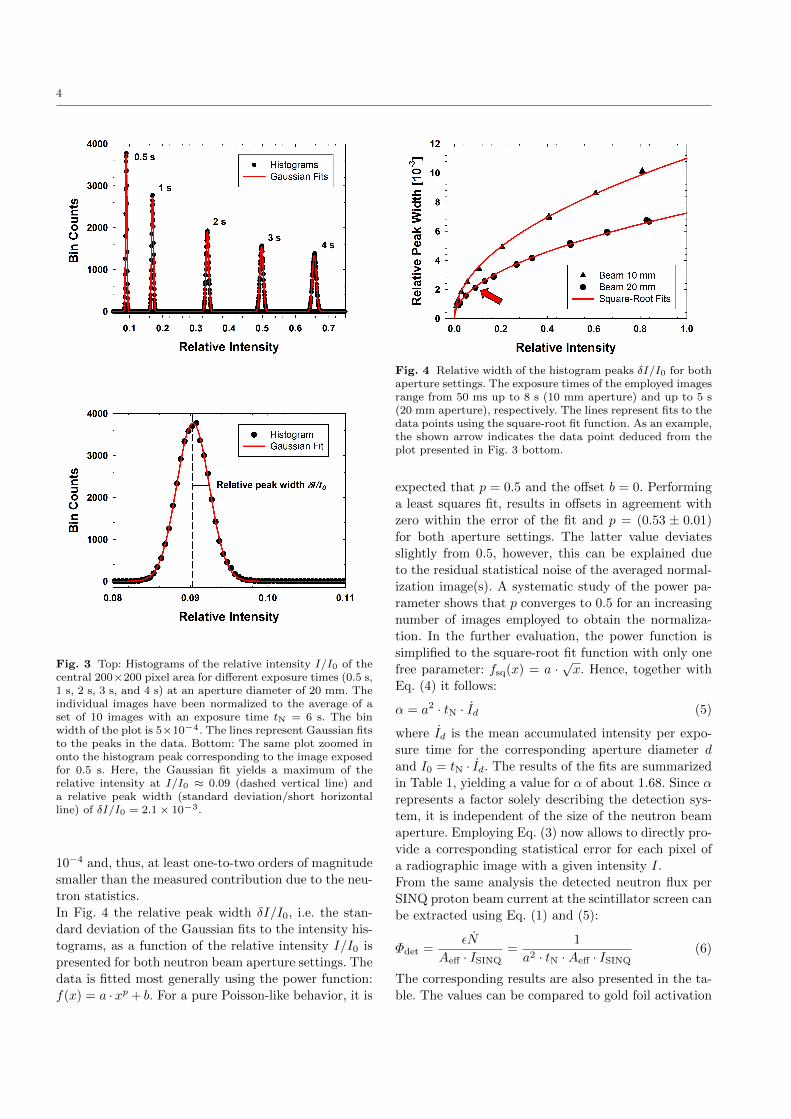
Fig. 3 Top: Histograms of the relative intensity I/I0 of thecentral 200×200 pixel area for different exposure times (0.5 s,1 s, 2 s, 3 s, and 4 s) at an aperture diameter of 20 mm. Theindividual images have been normalized to the average of aset of 10 images with an exposure time tN = 6 s. The binwidth of the plot is 5×10⁻⁴. The lines represent Gaussian fitsto the peaks in the data. Bottom: The same plot zoomed inonto the histogram peak corresponding to the image exposedfor 0.5 s. Here, the Gaussian fit yields a maximum of therelative intensity at I/I0 ≈ 0.09 (dashed vertical line) anda relative peak width (standard deviation/short horizontalline) of δI/I0 = 2.1 × 10⁻³.
10−4 and, thus, at least one-to-two orders of magnitude
smaller than the measured contribution due to the neu-
tron statistics.
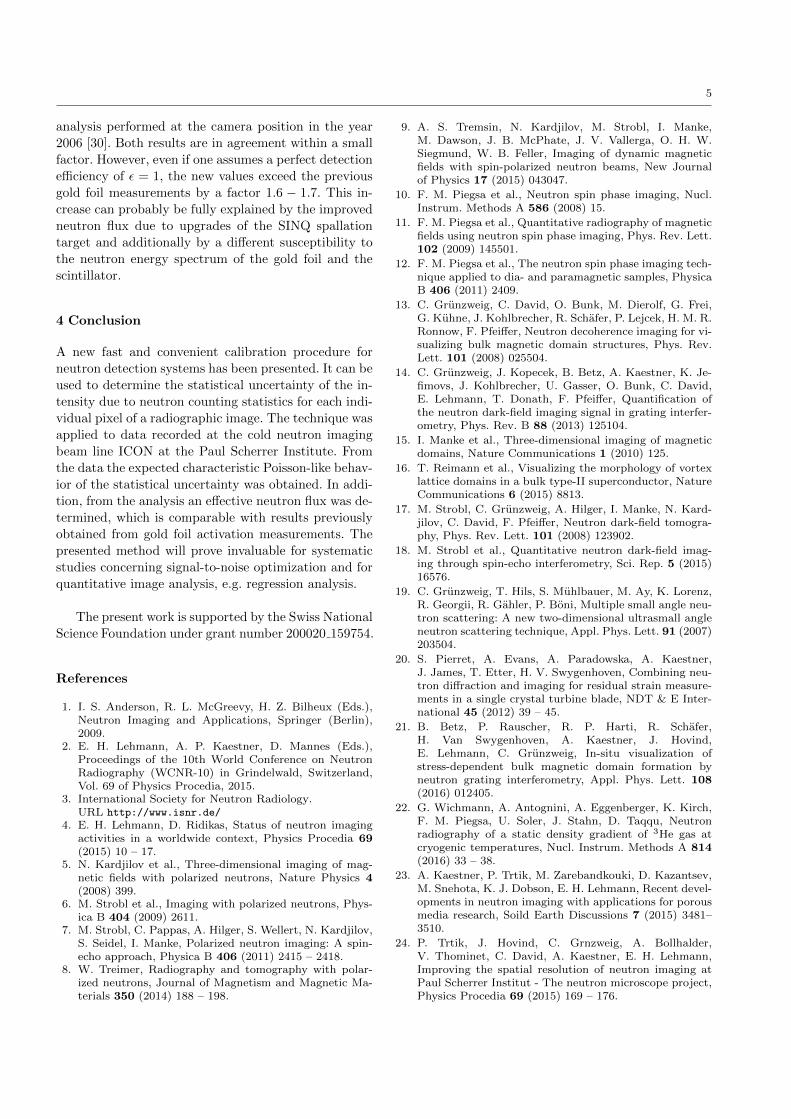
In Fig. 4 the relative peak width δI/I0, i.e. the stan-
dard deviation of the Gaussian fits to the intensity his-
tograms, as a function of the relative intensity I/I0 is
presented for both neutron beam aperture settings. The
data is fitted most generally using the power function:
f(x) = a · xp + b. For a pure Poisson-like behavior, it is
Fig. 4 Relative width of the histogram peaks δI/I0 for bothaperture settings. The exposure times of the employed imagesrange from 50 ms up to 8 s (10 mm aperture) and up to 5 s(20 mm aperture), respectively. The lines represent fits to thedata points using the square-root fit function. As an example,the shown arrow indicates the data point deduced from theplot presented in Fig. 3 bottom.
expected that p = 0.5 and the offset b = 0. Performing
a least squares fit, results in offsets in agreement with
zero within the error of the fit and p = (0.53 ± 0.01)
for both aperture settings. The latter value deviates
slightly from 0.5, however, this can be explained due
to the residual statistical noise of the averaged normal-
ization image(s). A systematic study of the power pa-
rameter shows that p converges to 0.5 for an increasing
number of images employed to obtain the normaliza-
tion. In the further evaluation, the power function is
simplified to the square-root fit function with only one
free parameter: fsq(x) = a ·√x. Hence, together with
Eq. (4) it follows:
α = a2 · tN · Id (5)
where Id is the mean accumulated intensity per expo-
sure time for the corresponding aperture diameter d
and I0 = tN · Id. The results of the fits are summarized
in Table 1, yielding a value for α of about 1.68. Since α
represents a factor solely describing the detection sys-
tem, it is independent of the size of the neutron beam
aperture. Employing Eq. (3) now allows to directly pro-
vide a corresponding statistical error for each pixel of
a radiographic image with a given intensity I.
From the same analysis the detected neutron flux per
SINQ proton beam current at the scintillator screen can
be extracted using Eq. (1) and (5):
Φdet =εN
Aeff · ISINQ=
1
a2 · tN ·Aeff · ISINQ(6)
The corresponding results are also presented in the ta-
ble. The values can be compared to gold foil activation
5
analysis performed at the camera position in the year
2006 [30]. Both results are in agreement within a small
factor. However, even if one assumes a perfect detection
efficiency of ε = 1, the new values exceed the previous
gold foil measurements by a factor 1.6 − 1.7. This in-
crease can probably be fully explained by the improved
neutron flux due to upgrades of the SINQ spallation
target and additionally by a different susceptibility to
the neutron energy spectrum of the gold foil and the
scintillator.
4 Conclusion
A new fast and convenient calibration procedure for
neutron detection systems has been presented. It can be
used to determine the statistical uncertainty of the in-
tensity due to neutron counting statistics for each indi-
vidual pixel of a radiographic image. The technique was
applied to data recorded at the cold neutron imaging
beam line ICON at the Paul Scherrer Institute. From
the data the expected characteristic Poisson-like behav-
ior of the statistical uncertainty was obtained. In addi-
tion, from the analysis an effective neutron flux was de-
termined, which is comparable with results previously
obtained from gold foil activation measurements. The
presented method will prove invaluable for systematic
studies concerning signal-to-noise optimization and for
quantitative image analysis, e.g. regression analysis.
The present work is supported by the Swiss National
Science Foundation under grant number 200020 159754.
References
1. I. S. Anderson, R. L. McGreevy, H. Z. Bilheux (Eds.),Neutron Imaging and Applications, Springer (Berlin),2009.
2. E. H. Lehmann, A. P. Kaestner, D. Mannes (Eds.),Proceedings of the 10th World Conference on NeutronRadiography (WCNR-10) in Grindelwald, Switzerland,Vol. 69 of Physics Procedia, 2015.
3. International Society for Neutron Radiology.URL http://www.isnr.de/
4. E. H. Lehmann, D. Ridikas, Status of neutron imagingactivities in a worldwide context, Physics Procedia 69(2015) 10 – 17.
5. N. Kardjilov et al., Three-dimensional imaging of mag-netic fields with polarized neutrons, Nature Physics 4(2008) 399.
6. M. Strobl et al., Imaging with polarized neutrons, Phys-ica B 404 (2009) 2611.
7. M. Strobl, C. Pappas, A. Hilger, S. Wellert, N. Kardjilov,S. Seidel, I. Manke, Polarized neutron imaging: A spin-echo approach, Physica B 406 (2011) 2415 – 2418.
8. W. Treimer, Radiography and tomography with polar-ized neutrons, Journal of Magnetism and Magnetic Ma-terials 350 (2014) 188 – 198.
9. A. S. Tremsin, N. Kardjilov, M. Strobl, I. Manke,M. Dawson, J. B. McPhate, J. V. Vallerga, O. H. W.Siegmund, W. B. Feller, Imaging of dynamic magneticfields with spin-polarized neutron beams, New Journalof Physics 17 (2015) 043047.
10. F. M. Piegsa et al., Neutron spin phase imaging, Nucl.Instrum. Methods A 586 (2008) 15.
11. F. M. Piegsa et al., Quantitative radiography of magneticfields using neutron spin phase imaging, Phys. Rev. Lett.102 (2009) 145501.
12. F. M. Piegsa et al., The neutron spin phase imaging tech-nique applied to dia- and paramagnetic samples, PhysicaB 406 (2011) 2409.
13. C. Grunzweig, C. David, O. Bunk, M. Dierolf, G. Frei,G. Kuhne, J. Kohlbrecher, R. Schafer, P. Lejcek, H. M. R.Ronnow, F. Pfeiffer, Neutron decoherence imaging for vi-sualizing bulk magnetic domain structures, Phys. Rev.Lett. 101 (2008) 025504.
14. C. Grunzweig, J. Kopecek, B. Betz, A. Kaestner, K. Je-fimovs, J. Kohlbrecher, U. Gasser, O. Bunk, C. David,E. Lehmann, T. Donath, F. Pfeiffer, Quantification ofthe neutron dark-field imaging signal in grating interfer-ometry, Phys. Rev. B 88 (2013) 125104.
15. I. Manke et al., Three-dimensional imaging of magneticdomains, Nature Communications 1 (2010) 125.
16. T. Reimann et al., Visualizing the morphology of vortexlattice domains in a bulk type-II superconductor, NatureCommunications 6 (2015) 8813.
17. M. Strobl, C. Grunzweig, A. Hilger, I. Manke, N. Kard-jilov, C. David, F. Pfeiffer, Neutron dark-field tomogra-phy, Phys. Rev. Lett. 101 (2008) 123902.
18. M. Strobl et al., Quantitative neutron dark-field imag-ing through spin-echo interferometry, Sci. Rep. 5 (2015)16576.
19. C. Grunzweig, T. Hils, S. Muhlbauer, M. Ay, K. Lorenz,R. Georgii, R. Gahler, P. Boni, Multiple small angle neu-tron scattering: A new two-dimensional ultrasmall angleneutron scattering technique, Appl. Phys. Lett. 91 (2007)203504.
20. S. Pierret, A. Evans, A. Paradowska, A. Kaestner,J. James, T. Etter, H. V. Swygenhoven, Combining neu-tron diffraction and imaging for residual strain measure-ments in a single crystal turbine blade, NDT & E Inter-national 45 (2012) 39 – 45.
21. B. Betz, P. Rauscher, R. P. Harti, R. Schafer,H. Van Swygenhoven, A. Kaestner, J. Hovind,E. Lehmann, C. Grunzweig, In-situ visualization ofstress-dependent bulk magnetic domain formation byneutron grating interferometry, Appl. Phys. Lett. 108(2016) 012405.
22. G. Wichmann, A. Antognini, A. Eggenberger, K. Kirch,F. M. Piegsa, U. Soler, J. Stahn, D. Taqqu, Neutronradiography of a static density gradient of 3He gas atcryogenic temperatures, Nucl. Instrum. Methods A 814(2016) 33 – 38.
23. A. Kaestner, P. Trtik, M. Zarebandkouki, D. Kazantsev,M. Snehota, K. J. Dobson, E. H. Lehmann, Recent devel-opments in neutron imaging with applications for porousmedia research, Soild Earth Discussions 7 (2015) 3481–3510.
24. P. Trtik, J. Hovind, C. Grnzweig, A. Bollhalder,V. Thominet, C. David, A. Kaestner, E. H. Lehmann,Improving the spatial resolution of neutron imaging atPaul Scherrer Institut - The neutron microscope project,Physics Procedia 69 (2015) 169 – 176.
Table 1 Overview of the fit results and deduced values for α and Φdet for both aperture settings. As a comparison also theflux determined by gold foil activation measurements ΦAu is presented [30].
25. P. Vontobel, G. Frei, J. Brunner, A. Gildemeister, M. En-gelhardt, Dynamic imaging with a triggered and inten-sified CCD camera system in a high-intensity neutronbeam, Nucl. Instrum. Methods A 542 (2005) 148–153.
26. H. Kobayashi, M. Satoh, Basic performance of a neutronsensitive photostimulated luminescence device for neu-tron radiography, Nucl. Instrum. Methods A 424 (1999)1 – 8.
27. S. Tazaki, K. Neriishi, K. Takahashi, M. Etoh, Y. Kara-sawa, S. Kumazawa, N. Niimura, Development of a newtype of imaging plate for neutron detection, Nucl. In-strum. Methods A 424 (1999) 20 – 25.
28. T. M. Buzug, Computed Tomography, Springer (Berlin),2008.
29. M. Chabior, T. Donath, C. David, M. Schuster,C. Schroer, F. Pfeiffer, Signal-to-noise ratio in x ray dark-field imaging using a grating interferometer, J. Appl.Phys. 110 (2011) 053105.
30. A. P. Kaestner, S. Hartmann, G. Kuhne, G. Frei,C. Grunzweig, L. Josic, F. Schmid, E. H. Lehmann, TheICON beamline - A facility for cold neutron imaging atSINQ, Nucl. Instrum. Methods A 659 (2011) 387 – 393.
31. A. Spowart, Measurement of the absolute scintillation ef-ficiency of granular and glass neutron scintillators, Nucl.Instrum. Methods 75 (1969) 35 – 42.