45
7/15/2019 Statistics http://slidepdf.com/reader/full/statistics-5632806504049 1/45 StatIStICS Course Description May 2009, May 2010
| Date post: | 30-Oct-2015 |
| Category: |
Documents |
| Upload: | rex-lagunzad-flores |
| View: | 72 times |
| Download: | 0 times |
7/15/2019 Statistics
http://slidepdf.com/reader/full/statistics-5632806504049 1/45
StatIStICSCourse Description
M a y 2 0 0 9 , M a y 2 0 1 0

7/15/2019 Statistics
http://slidepdf.com/reader/full/statistics-5632806504049 2/45
The College Board: Connecting Students to College SuccessThe College Board is a not-or-prot membership association whose mission is to connect students
to college success and opportunity. Founded in 1900, the association is composed o more than
5,400 schools, colleges, universities, and other educational organizations. Each year, the College
Board serves seven million students and their parents, 23,000 high schools, and 3,500 colleges
through major programs and services in college admissions, guidance, assessment, nancial
aid, enrollment, and teaching and learning. Among its best-known programs are the SAT®, the
PSAT/NMSQT®, and the Advanced Placement Program® (AP®). The College Board is committed
to the principles o excellence and equity, and that commitment is embodied in all o its programs,
services, activities, and concerns.
For urther inormation visit www.collegeboard.com.
The College Board and the Advanced Placement Program encourage teachers, AP Coordinators,and school administrators to make equitable access a guiding principle or their AP programs.
The College Board is committed to the principle that all students deserve an opportunity to
participate in rigorous and academically challenging courses and programs. All students who
are willing to accept the challenge o a rigorous academic curriculum should be considered or
admission to AP courses. The Board encourages the elimination o barriers that restrict access to
AP courses or students rom ethnic, racial, and socioeconomic groups that have been traditionally
underrepresented in the AP Program. Schools should make every eort to ensure that their AP
classes refect the diversity o their student population.
© 2008 The College Board. All rights reserved. College Board, Advanced Placement Program, AP, AP Central, SAT, and the
acorn logo are registered trademarks o the College Board. connect to college success is a trademark owned by the College
Board. PSAT/NMSQT is a registered trademark o the College Board and National Merit Scholarship Corporation. All other
products and serv ices may be trademarks o t heir respective owners. Permission to use copyrighted College Board materials
may be requested online at: www.collegeboard.com/inquiry/cbpermit.html.
Visit the College Board on the Web: www.collegeboard.com.

7/15/2019 Statistics
http://slidepdf.com/reader/full/statistics-5632806504049 3/45
Dear Colleague:
We know that A P® is a unique collaboration among motivated students, dedicatedteachers, and committed high schools, colleges, and universities. Without your
contributions, the rigorous instruction that takes place in classrooms around the world would not be possible.
In 2007, approximately 1.4 million students took more than 2.5 mill ion AP Exams.Guiding these students were talented, hardworking teachers, who are the heart andsoul o the AP Program. The College Board is grateul or the dedication o APteachers and the administrators who support them.
One example o the collaboration that makes AP possible is the AP Course Audit,the process through which college aculty review AP teachers’ syllabi to ensure that both teachers and administrators are aware o the expectations colleges anduniversities have or AP courses. This yearlong intensive assessment involved thereview and analysis o more than 134,000 syllabi to determine which courses ulllor exceed standards or college-level curricula. In total, 14,383 secondary schools worldwide succeeded in developing one or more courses that have receivedauthorization rom the College Board.
Through the AP Audit , teachers received a number o benets. For example, you or your colleagues told us that the AP Audit helped you to obtain more current college textbooks or your students. A signicant number o teachers said they were able to prevent the reduction o lab or instructional time that was scheduledto a ect their courses. Because o the audit, 22,000 teachers said they were ableto incorporate advances in their discipline that had not yet been added to their curricula. The searchable AP Course Ledger is online at collegeboard.com.
The College Board remains committed to supporting the work o AP teachers. AP workshops and Summer Institutes held around the world provide stimulatingproessional development or more than 60,000 teachers each year. Workshopsprovide teachers not only with valuable course-specic inormation but the
opportunity to interact and network with their colleagues in the AP community.
This community is extended online at AP Central® where teachers can access a wide range o resources, inormation, and tools to support their work in the APclassroom. In response to requests rom educators to make our Web site easier touse, the College Board implemented extensive improvements to collegeboard.com. A new “K–12 Teacher” homepage makes it easier to nd an array o content andservices. AP Central serves as an integral part o this enhanced collegeboard.com Web site.
We appreciate al l o your e orts in the AP classroom and in the courses that prepare students or the rigor and challenge o AP. It is through the dedication andhard work o educators like you that a wider range o students than ever beore isbeing given the opportunity to succeed in AP.
Sincerely,
Gaston CapertonPresident The College Board

7/15/2019 Statistics
http://slidepdf.com/reader/full/statistics-5632806504049 4/45

7/15/2019 Statistics
http://slidepdf.com/reader/full/statistics-5632806504049 5/45
© 2008 Te Cege Bar. A rgts reserve. Vst te Cege Bar te Web: www.cegebar.c.
Contents
Welcome to the AP Program . . . . . . . . . . . . . . . . . . . . . . . . . . . . . . . . . . . . . . . . . . . . . . . . . 1 AP Courses . . . . . . . . . . . . . . . . . . . . . . . . . . . . . . . . . . . . . . . . . . . . . . . . . . . . . . . . . . . . 1
AP Exams . . . . . . . . . . . . . . . . . . . . . . . . . . . . . . . . . . . . . . . . . . . . . . . . . . . . . . . . . . . . . 1 AP Course Audit . . . . . . . . . . . . . . . . . . . . . . . . . . . . . . . . . . . . . . . . . . . . . . . . . . . . . . . . 1 AP Courses and Exams . . . . . . . . . . . . . . . . . . . . . . . . . . . . . . . . . . . . . . . . . . . . . . . . . . 2 AP Reading . . . . . . . . . . . . . . . . . . . . . . . . . . . . . . . . . . . . . . . . . . . . . . . . . . . . . . . . . . . . 3 AP Exam Grades . . . . . . . . . . . . . . . . . . . . . . . . . . . . . . . . . . . . . . . . . . . . . . . . . . . . . . . 3
Credit and Placement or AP Grades . . . . . . . . . . . . . . . . . . . . . . . . . . . . . . . . . . . . 3Setting Credit and Placement Policies or AP Grades . . . . . . . . . . . . . . . . . . . . . . 4
AP Statistics . . . . . . . . . . . . . . . . . . . . . . . . . . . . . . . . . . . . . . . . . . . . . . . . . . . . . . . . . . . . . . 5Introduction . . . . . . . . . . . . . . . . . . . . . . . . . . . . . . . . . . . . . . . . . . . . . . . . . . . . . . . . . . . 5 The Course . . . . . . . . . . . . . . . . . . . . . . . . . . . . . . . . . . . . . . . . . . . . . . . . . . . . . . . . . . . 5
Student Selection . . . . . . . . . . . . . . . . . . . . . . . . . . . . . . . . . . . . . . . . . . . . . . . . . . . . 6
Teaching the Course . . . . . . . . . . . . . . . . . . . . . . . . . . . . . . . . . . . . . . . . . . . . . . . . . 6Course Content Overview . . . . . . . . . . . . . . . . . . . . . . . . . . . . . . . . . . . . . . . . . . . . . 7 Topic Outline . . . . . . . . . . . . . . . . . . . . . . . . . . . . . . . . . . . . . . . . . . . . . . . . . . . . . . . . . . 8
The Use o Technology . . . . . . . . . . . . . . . . . . . . . . . . . . . . . . . . . . . . . . . . . . . . . . 11Formulas and Tables . . . . . . . . . . . . . . . . . . . . . . . . . . . . . . . . . . . . . . . . . . . . . . . . 12
Descriptive Statistics . . . . . . . . . . . . . . . . . . . . . . . . . . . . . . . . . . . . . . . . . . . . . . 13Probability . . . . . . . . . . . . . . . . . . . . . . . . . . . . . . . . . . . . . . . . . . . . . . . . . . . . . . . 14Inerential Statistics . . . . . . . . . . . . . . . . . . . . . . . . . . . . . . . . . . . . . . . . . . . . . . . 14
The Exam . . . . . . . . . . . . . . . . . . . . . . . . . . . . . . . . . . . . . . . . . . . . . . . . . . . . . . . . . . . . 20Multiple-Choice Questions . . . . . . . . . . . . . . . . . . . . . . . . . . . . . . . . . . . . . . . . . . . 20
Answers to Multiple-Choice Questions . . . . . . . . . . . . . . . . . . . . . . . . . . . . . . . 27Free-Response Questions . . . . . . . . . . . . . . . . . . . . . . . . . . . . . . . . . . . . . . . . . . . . 28
Scoring o Free-Response Questions . . . . . . . . . . . . . . . . . . . . . . . . . . . . . . . . . . . 28
Teacher Support . . . . . . . . . . . . . . . . . . . . . . . . . . . . . . . . . . . . . . . . . . . . . . . . . . . . . . . . . . 37 AP Central (apcentral.collegeboard.com) . . . . . . . . . . . . . . . . . . . . . . . . . . . . . . . . . . 37 AP Publications and Other Resources . . . . . . . . . . . . . . . . . . . . . . . . . . . . . . . . . . . . . 37
Teacher’s Guides . . . . . . . . . . . . . . . . . . . . . . . . . . . . . . . . . . . . . . . . . . . . . . . . . . . . 37Course Descriptions . . . . . . . . . . . . . . . . . . . . . . . . . . . . . . . . . . . . . . . . . . . . . . . . . 37Released Exams . . . . . . . . . . . . . . . . . . . . . . . . . . . . . . . . . . . . . . . . . . . . . . . . . . . . 37

7/15/2019 Statistics
http://slidepdf.com/reader/full/statistics-5632806504049 6/45

7/15/2019 Statistics
http://slidepdf.com/reader/full/statistics-5632806504049 7/45
© 2008 Te Cege Bar. A rgts reserve. Vst te Cege Bar te Web: www.cegebar.c.
Welcome to the AP® Program
The Advanced Placement Program® (AP) is a collaborative eort among motivatedstudents; dedicated teachers; and committed high schools, colleges, and universities.
Since its inception in 1955, the Program has enabled millions o students to takecollege-level courses and exams, and to earn college credit or placement, while stillin high school.
Most colleges and universities in the United States, as well as colleges anduniversities in more than 40 other countries, have an AP policy granting incomingstudents credit, placement, or both on the basis o their AP Exam grades. Many o these institutions grant up to a ull year o college credit (sophomore standing) tostudents who earn a sucient number o qualiying AP grades.
Each year, an increasing number o parents, students, teachers, high schools, andcolleges and universities turn to the AP Program as a model o educational excellence.
More inormation about the AP Program is available at the back o this Course
Description and at AP Central, the College Board’s online home or AP proessionals(apcentral.collegeboard.com). Students can nd more inormation at the AP student site (www.collegeboard.com/apstudents).
AP Crses
Thirty-seven A P courses in a wide variety o subject areas are available now. A committee o college aculty and master AP teachers designs each AP course tocover the inormation, skills, and assignments ound in the corresponding collegecourse. See page 2 or a complete list o AP courses and exams.
AP Eas
Each AP course has a corresponding exam that participating schools worldwideadminister in May (except or AP Studio Art, which is a portolio assessment). AP Exams contain multiple-choice questions and a ree-response section (essay,problem solving, or oral response).
AP Exams are a culminating assessment in all A P courses and are thus an integralpart o the Program. As a result, many schools oster the expectation that students who enroll in an AP course will take the corresponding AP Exam. Because theCollege Board is committed to providing access to AP Exams or homeschooledstudents and students whose schools do not oer AP courses, it does not requirestudents to take an AP course prior to taking an AP Exam.
AP Crse At
The A P Course Audit was created at the request o secondary school and college anduniversity members o the College Board who sought a means to provide teachersand administrators with clear guidelines on the curricular and resource requirementsthat must be in place or AP courses. The AP Course Audit also helps colleges anduniversities better interpret secondary school courses marked “AP” on students’transcripts. To receive authorization rom the College Board to label a course “AP,”
7/15/2019 Statistics
http://slidepdf.com/reader/full/statistics-5632806504049 8/45
2 © 2008 Te Cege Bar. A rgts reserve. Vst te Cege Bar te Web: www.cegebar.c.
schools must demonstrate how their courses meet or exceed these requirements, which colleges and universit ies expect to see within a college-level curriculum.
The AP Program unequivocally supports the principle that each individual school
must develop its own curriculum or courses labeled “AP.” Rather than mandatingany one curriculum or AP courses, the AP Course Audit instead provides each AP teacher with a set o expectat ions that college and secondary school aculty nationwide have established or college-level courses. AP teachers are encouragedto develop or maintain their own curriculum that either includes or exceeds each o these expectations; such courses will be authorized to use the “AP” designation.Credit or the success o AP courses belongs to the individual schools and teachersthat create powerul, locally designed AP curricula.
Complete inormation about the AP Course Audit is available at AP Central.
AP Crses a Eas
Art Art History Studio Art: 2-D DesignStudio Art: 3-D DesignStudio Art: Drawing
Biology
Calculus
Calculus ABCalculus BC
Chemistry
Chinese Language and Culture
Computer ScienceComputer Science A Computer Science AB*
Economics
MacroeconomicsMicroeconomics
English
English Language and CompositionEnglish Literature and Composition
Environmental Science
French
French LanguageFrench Literature*
German LanguageGovernment and Politics
Comparative Government and PoliticsUnited States Government and Politics
History
European History United States History World History
Human Geography
Italian Language and Culture*
Japanese Language and Culture
Latin
Latin Literature*
Latin: Vergil
Music Theory
Physics
Physics BPhysics C: Electricity and MagnetismPhysics C: Mechanics
Psychology
Spanish
Spanish Language
Spanish LiteratureStatistics
* AP Computer Science AB, AP French Literature, and AP Latin Literature will be discontinued ater the May 2009exam administration. AP Italian may also be discontinued i external unding is not secured by May 2009. Visit
AP Central or details.
7/15/2019 Statistics
http://slidepdf.com/reader/full/statistics-5632806504049 9/45
© 2008 Te Cege Bar. A rgts reserve. Vst te Cege Bar te Web: www.cegebar.c.
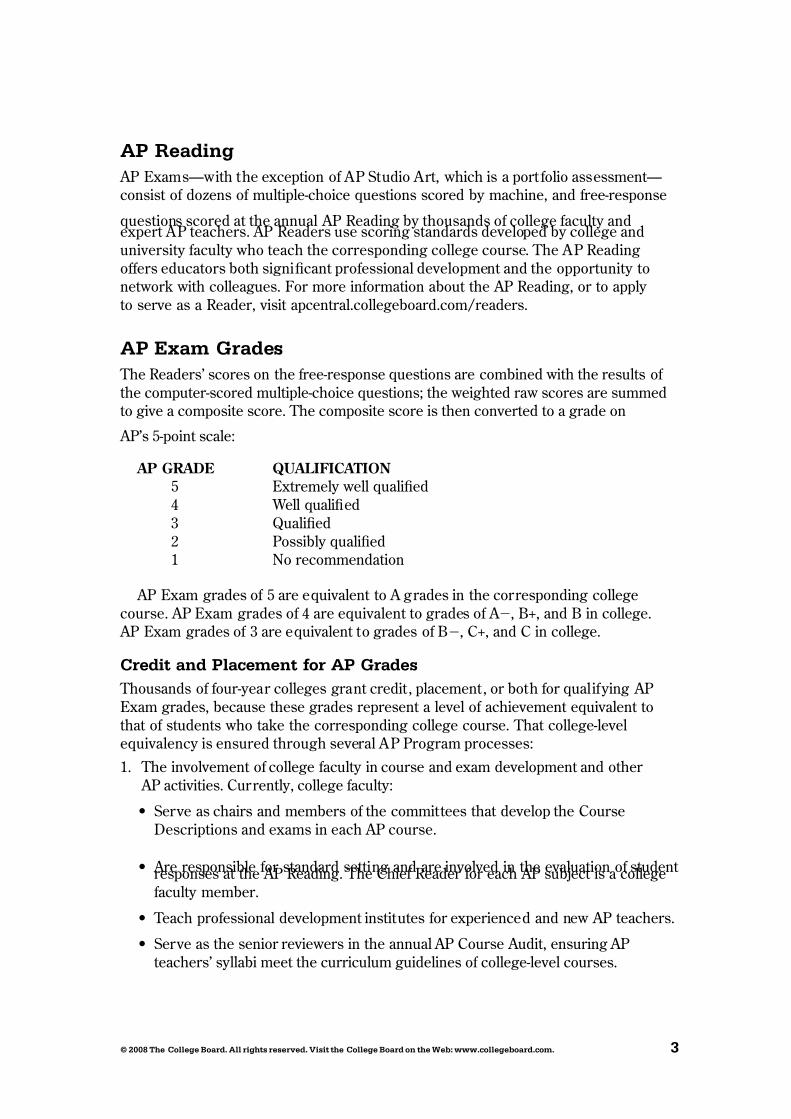
AP Reag
AP Exams—with the exception o AP Studio Art, which is a port olio assessment—consist o dozens o multiple-choice questions scored by machine, and ree-response
questions scored at the annual AP Reading by thousands o college aculty andexpert AP teachers. AP Readers use scoring standards developed by college anduniversity aculty who teach the corresponding college course. The AP Readingoers educators both signicant proessional development and the opportunity tonetwork with colleagues. For more inormation about the AP Reading, or to apply to serve as a Reader, visit apcentral.collegeboard.com/readers.
AP Ea Graes
The Readers’ scores on the ree-response questions are combined with the results o the computer-scored multiple-choice questions; the weighted raw scores are summedto give a composite score. The composite score is then converted to a grade on
AP’s 5-point scale:
AP GRADE QUALIFICATION
5 Extremely well qualied4 Well qualied3 Qualied2 Possibly qualied1 No recommendation
AP Exam grades o 5 are equivalent to A grades in the corresponding collegecourse. AP Exam grades o 4 are equivalent to grades o A , B+, and B in college. AP Exam grades o 3 are equivalent to grades o B, C+, and C in college.
Cret a Paceet fr AP Graes
Thousands o our-year colleges grant credit , placement, or both or qualiying APExam grades, because these grades represent a level o achievement equivalent tothat o students who take the corresponding college course. That college-levelequivalency is ensured through several AP Program processes:
1. The involvement o college aculty in course and exam development and other AP activities. Currently, college aculty:
• Serve as chairs and members o the committees that develop the CourseDescriptions and exams in each AP course.
• Are responsible or standard setting and are involved in the evaluation o student responses at the AP Reading. The Chie Reader or each AP subject is a collegeaculty member.
• Teach proessional development institutes or experienced and new AP teachers.
• Serve as the senior reviewers in the annual AP Course Audit, ensuring APteachers’ syllabi meet the curriculum guidelines o college-level courses.

7/15/2019 Statistics
http://slidepdf.com/reader/full/statistics-5632806504049 10/45
© 2008 Te Cege Bar. A rgts reserve. Vst te Cege Bar te Web: www.cegebar.c.
2. AP courses and exams are reviewed and updated regularly based on the resultso curriculum surveys at up to 200 colleges and universities, collaborationsamong the College Board and key educational and disciplinary organizations,and the interactions o committee members with proessional organizations intheir discipline.
3. Periodic college comparability studies are undertaken in which the perormance o college students on AP Exams is compared with that o AP students to conirm that the AP grade scale o 1 to 5 is properly aligned with current college standards.
For more inormation about the role o colleges and universities in the APProgram, visit the Higher Ed Services section o collegeboard.com at proessionals.collegeboard.com/higher-ed.
Settg Cret a Paceet Pces fr AP Graes
The College Board Web site or educat ion proessionals has a section geared toward
colleges and universities that provides guidance in setting AP credit and placement policies and additional resources, including links to AP research studies, releasedexam questions, and sample student responses at varying levels o achievement or each AP Exam. Visit proessionals.collegeboard.com/higher-ed/placement/ap.
The AP Credit Policy Ino online search tool provides links to credit and place-ment policies at more than 1,000 colleges and universities. The tool helps studentsnd the credit hours and advanced placement they can receive or qualiyingexam scores within each AP subject. AP Credit Policy Ino is available at www.collegeboard.com/ap/creditpolicy.

7/15/2019 Statistics
http://slidepdf.com/reader/full/statistics-5632806504049 11/45
© 2008 Te Cege Bar. A rgts reserve. Vst te Cege Bar te Web: www.cegebar.c.
AP Statistics
I n T R o d u C T I o n
The Advanced Placement Program oers a course description and exam in stat isticsto secondary school students who wish to complete studies equivalent to a one-semester, introductory, non-calculus-based, college course in statistics.
Statistics and mathematics educators who serve as members o the AP StatisticsDevelopment Committee have prepared the Course Description and exam to refect the content o a typical introductory college course in statistics. The exam isrepresentative o such a course and thereore is considered appropriate or themeasurement o skills and knowledge in the eld o introductory statistics.
In colleges and universities, the number o students who take a statistics course isalmost as large as the number o students who take a calculus course. A July 2002article in the Chronicle of Higher Education reports that the enrollment in statistics
courses rom 1990 to 2000 increased by 45 percent—one testament to the growtho statistics in those institutions. An introductory statistics course, similar to the AP Statistics course, is typically required or majors such as social sciences, healthsciences, and business. Every semester about 236,000 college and university studentsenroll in an introductory statistics course oered by a mathematics or statisticsdepartment. In addition, a large number o students enroll in an introductory statisticscourse oered by other departments. Science, engineering, and mathematics majorsusually take an upper-level calculus-based course in statistics, or which the AP Statistics course is eective preparation.
T h E C o u R S E
The purpose o the AP course in stat istics is to introduce students to the major concepts and tools or collecting, analyzing, and drawing conclusions rom data.Students are exposed to our broad conceptual themes:
1. Exploring Data: Describing patterns and departures rom patterns
2. Sampling and Experimentation: Planning and conducting a study
3. Anticipating Patterns: Exploring random phenomena using probability and simulation
4. Statistical Inerence: Estimating population parameters and testing hypotheses
Students who successully complete the course and exam may receive credit,advanced placement, or both or a one-semester introductory college statistics
course. This does not necessarily imply that the high school course should be onesemester long. Each high school needs to determine the length o its AP Statist icscourse to best serve the needs o its students. Statistics, like some other AP courses,could be eectively studied in a one-semester, a two-trimester, or a one-year course.Most schools, however, oer it as a one-year course.
7/15/2019 Statistics
http://slidepdf.com/reader/full/statistics-5632806504049 12/45
© 2008 Te Cege Bar. A rgts reserve. Vst te Cege Bar te Web: www.cegebar.c.
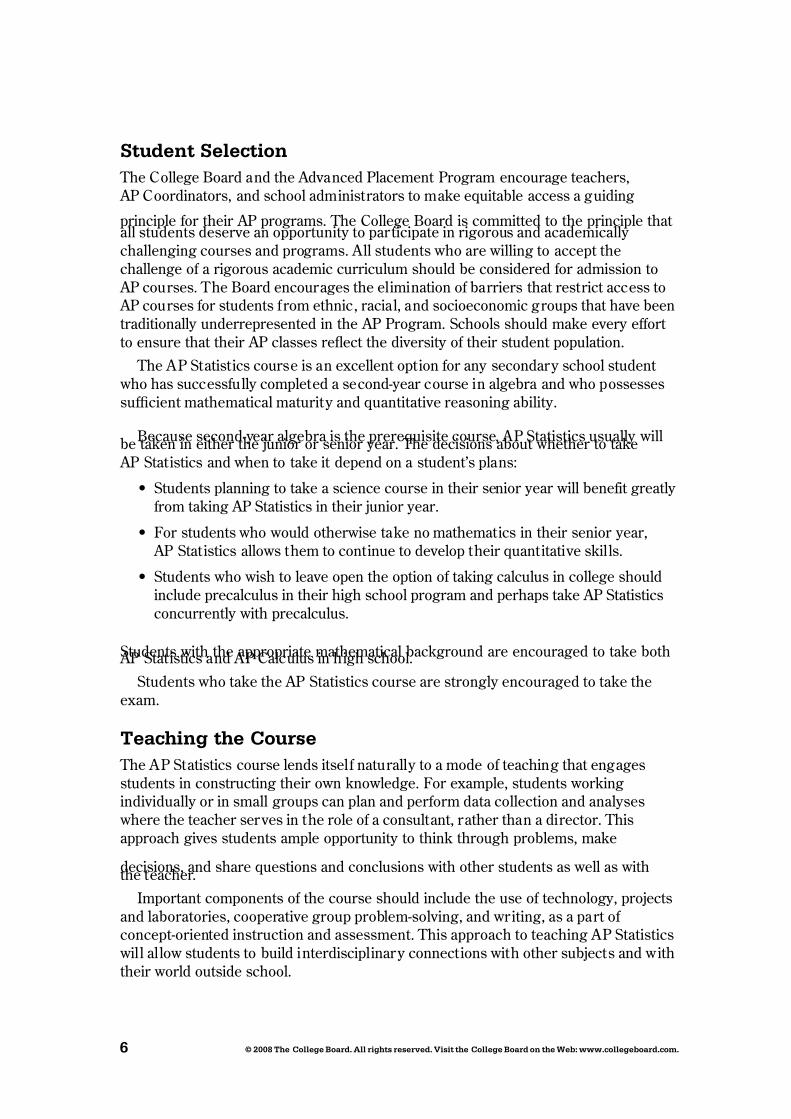
Stet Seect
The College Board and the Advanced Placement Program encourage teachers, AP Coordinators, and school administrators to make equitable access a guiding
principle or their AP programs. The College Board is committed to the principle that all students deserve an opportunity to participate in rigorous and academically challenging courses and programs. All students who are willing to accept thechallenge o a rigorous academic curriculum should be considered or admission to AP courses. The Board encourages the elimination o barriers that restrict access to AP courses or students rom ethnic, racial, and socioeconomic groups that have beentraditionally underrepresented in the AP Program. Schools should make every eort to ensure that their AP classes refect the diversity o their student population.
The AP Statistics course is an excellent option or any secondary school student who has successully completed a second-year course in algebra and who possessessucient mathematical maturity and quantitative reasoning ability.
Because second-year algebra is the prerequisite course, AP Statistics usually willbe taken in either the junior or senior year. The decisions about whether to take AP Statistics and when to take it depend on a student’s plans:
• Students planning to take a science course in their senior year will beneit greatly rom taking AP Statistics in their junior year.
• For students who would otherwise take no mathematics in their senior year, AP Statistics allows them to continue to develop their quantitative skills.
• Students who wish to leave open the option o taking calculus in college shouldinclude precalculus in their high school program and perhaps take AP Statisticsconcurrently with precalculus.
Students with the appropriate mathematical background are encouraged to take both AP Statistics and AP Calculus in high school.
Students who take the AP Statistics course are strongly encouraged to take theexam.
Teacg te Crse
The AP Statistics course lends itsel naturally to a mode o teaching that engagesstudents in constructing their own knowledge. For example, students workingindividually or in small groups can plan and perorm data collection and analyses where the teacher serves in the role o a consultant, rather than a director. Thisapproach gives students ample opportunity to think through problems, make
decisions, and share questions and conclusions with other students as well as withthe teacher.
Important components o the course should include the use o technology, projectsand laboratories, cooperative group problem-solving, and writing, as a part o concept-oriented instruction and assessment. This approach to teaching AP Statistics will allow students to build interdisciplinary connections with other subjects and withtheir world outside school.
7/15/2019 Statistics
http://slidepdf.com/reader/full/statistics-5632806504049 13/45
© 2008 Te Cege Bar. A rgts reserve. Vst te Cege Bar te Web: www.cegebar.c.
The AP Statistics course depends heavily on the availability o technology suitableor the interactive, investigative aspects o data analysis. Thereore, schools shouldmake every eort to provide students and teachers easy access to computers toacilitate the teaching and learning o statistics.
Providing instructional inormation and educational opportunities or teachers isan important component o the AP Program. The College Board oers workshops,summer courses, and institutes or teachers in all AP courses. Further inormationabout these and other training opportunities may be obtained at AP Central
(apcentral.collegeboard.com) and rom your College Board regional oce (contact inormation is on the inside back cover). The Teachers’ Resources section o AP Centraloers reviews o textbooks, articles, Web sites, and other teaching resources. Theelectronic discussion groups (EDGs) accessible through AP Central also provide a moderated orum or exchanging ideas, insights, and practices among members o the AP proessional community.
Additionally, the ollowing publications provide some insight into the philosophy o
the AP Statistics course.
Cobb, George, “Teaching Statistics: More Data, Less Lecturing.” In Steen, Lynn Arthur, ed. 1992. Heeding the Call for Change: Suggestions for Curricular Action.
Washington, D.C.: Mathematical Association o America. To order MAA publications call 800 331-1622 or go to www.maa.org.
Gordon, Florence and Sheldon, eds. 1992. Statistics for the Twenty-First Century, MA A Notes No. 26. Washington, D.C.: Mathematical Association o America.
Moore, Thomas, ed. 2000. Teaching Statistics: Resources for Undergraduate
Instructors, MA A Notes Vol. 52. Washington, D.C.: Mathematical Associationo America.
National Council o Teachers o Mathematics. 2003. Principles and Standards for School Mathematics, 3rd ed. Reston, Va.: National Council o Teachers o Mathematics. www.nctm.org.
Crse Ctet overvew
The topics or AP Statistics are divided into our major themes: exploratory analysis(20–30 percent o the exam), planning and conducting a study (10–15 percent o the exam), probability (20–30 percent o the exam), and statistical inerence(30–40 percent o the exam).
I. Exploratory analysis of data makes use of graphical and numerical techniques
to study patterns and departures from patterns. In examining distributions o
data, students should be able to detect important characteristics, such asshape, location, variability, and unusual values. From careul observations o patterns in data, students can generate conjectures about relationships among variables. The notion o how one variable may be associated with another permeates almost all o statistics, rom simple comparisons o proportionsthrough linear regression. The dierence between association and causationmust accompany this conceptual development throughout.

7/15/2019 Statistics
http://slidepdf.com/reader/full/statistics-5632806504049 14/45
8 © 2008 Te Cege Bar. A rgts reserve. Vst te Cege Bar te Web: www.cegebar.c.
II. Data must be collected according to a well-developed plan if valid information
is to be obtained. I data are to be collected to provide an answer to a questiono interest, a careul plan must be developed. Both the type o analysis that isappropriate and the nature o conclusions that can be drawn rom that analysisdepend in a critical way on how the data was collected. Collecting data in a reasonable way, through either sampling or experimentation, is an essentialstep in the data analysis process.
III. Probability is the tool used for anticipating what the distribution of data should look
like under a given model. Random phenomena are not haphazard: they display an order that emerges only in the long run and is described by a distribution. The mathematical description o variation is central to statistics. The probability required or statistical inerence is not primarily axiomatic or combinatorial but is oriented toward using probability distributions to describe data.
IV. Statistical inference guides the selection of appropriate models. Models and data interact in statistical work: models are used to draw conclusions rom data,
while the data are allowed to criticize and even alsiy the model throughinerential and diagnostic methods. Inerence rom data can be thought o asthe process o selecting a reasonable model, including a statement in probability language, o how condent one can be about the selection.
T o P I C o u T l I n E
Following is an outline o the major topics covered by the AP Statistics Exam. Theordering here is intended to dene the scope o the course but not necessarily thesequence. The percentages in parentheses or each content area indicate the coverageor that content area in the exam.
I. Exploring Data: Describing patterns and departures rom patterns (20%–30%) Exploratory analysis of data makes use of graphical and numerical techniques to
study patterns and departures from patterns. Emphasis should be placed on
interpreting information from graphical and numerical displays and summaries .
A. Constructing and interpreting graphical displays o distributions o univariate data (dotplot, stemplot, histogram, cumulative requency plot)1. Center and spread2. Clusters and gaps3. Outliers and other unusual eatures4. Shape
B. Summarizing distributions o univariate data
1. Measuring center: median, mean2. Measuring spread: range, interquartile range, standard deviation3. Measuring position: quartiles, percentiles, standardized scores (z-scores)4. Using boxplots5. The eect o changing units on summary measures
7/15/2019 Statistics
http://slidepdf.com/reader/full/statistics-5632806504049 15/45
© 2008 Te Cege Bar. A rgts reserve. Vst te Cege Bar te Web: www.cegebar.c.
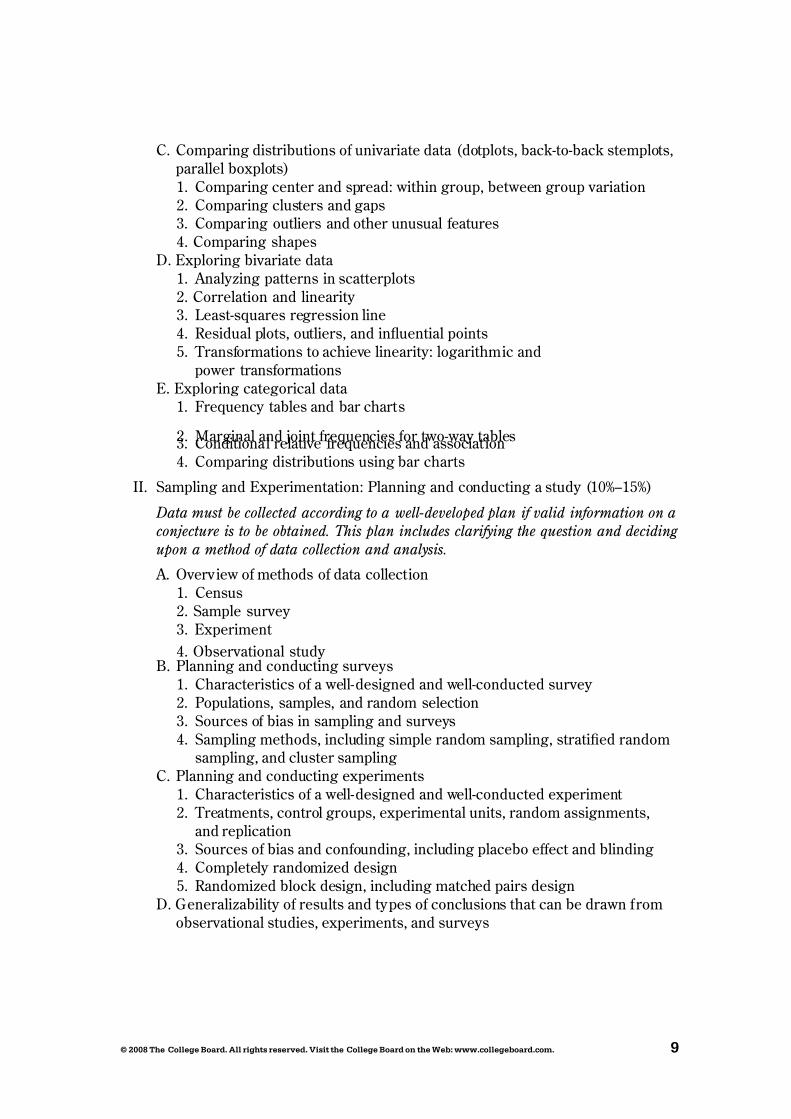
C. Comparing distributions o univariate data (dotplots, back-to-back stemplots,parallel boxplots)1. Comparing center and spread: within group, between group variation2. Comparing clusters and gaps3. Comparing outliers and other unusual eatures4. Comparing shapes
D. Exploring bivariate data 1. Analyzing patterns in scatterplots2. Correlation and linearity 3. Least-squares regression line4. Residual plots, outliers, and infuential points5. Transormations to achieve linearity: logarithmic and
power transormationsE. Exploring categorical data
1. Frequency tables and bar charts
2. Marginal and joint requencies or two-way tables3. Conditional relative requencies and association4. Comparing distributions using bar charts
II. Sampling and Experimentation: Planning and conducting a study (10%–15%)
Data must be collected according to a well-developed plan if valid information on a
conjecture is to be obtained. This plan includes clarifying the question and deciding
upon a method of data collection and analysis.
A. Overview o methods o data collection1. Census2. Sample survey 3. Experiment
4. Observational study B. Planning and conducting surveys
1. Characteristics o a well-designed and well-conducted survey 2. Populations, samples, and random selection3. Sources o bias in sampling and surveys4. Sampling methods, including simple random sampling, stratied random
sampling, and cluster samplingC. Planning and conducting experiments
1. Characteristics o a well-designed and well-conducted experiment 2. Treatments, control groups, experimental units, random assignments,
and replication3. Sources o bias and conounding, including placebo eect and blinding4. Completely randomized design5. Randomized block design, including matched pairs design
D. Generalizability o results and types o conclusions that can be drawn romobservational studies, experiments, and surveys
7/15/2019 Statistics
http://slidepdf.com/reader/full/statistics-5632806504049 16/45
0 © 2008 Te Cege Bar. A rgts reserve. Vst te Cege Bar te Web: www.cegebar.c.
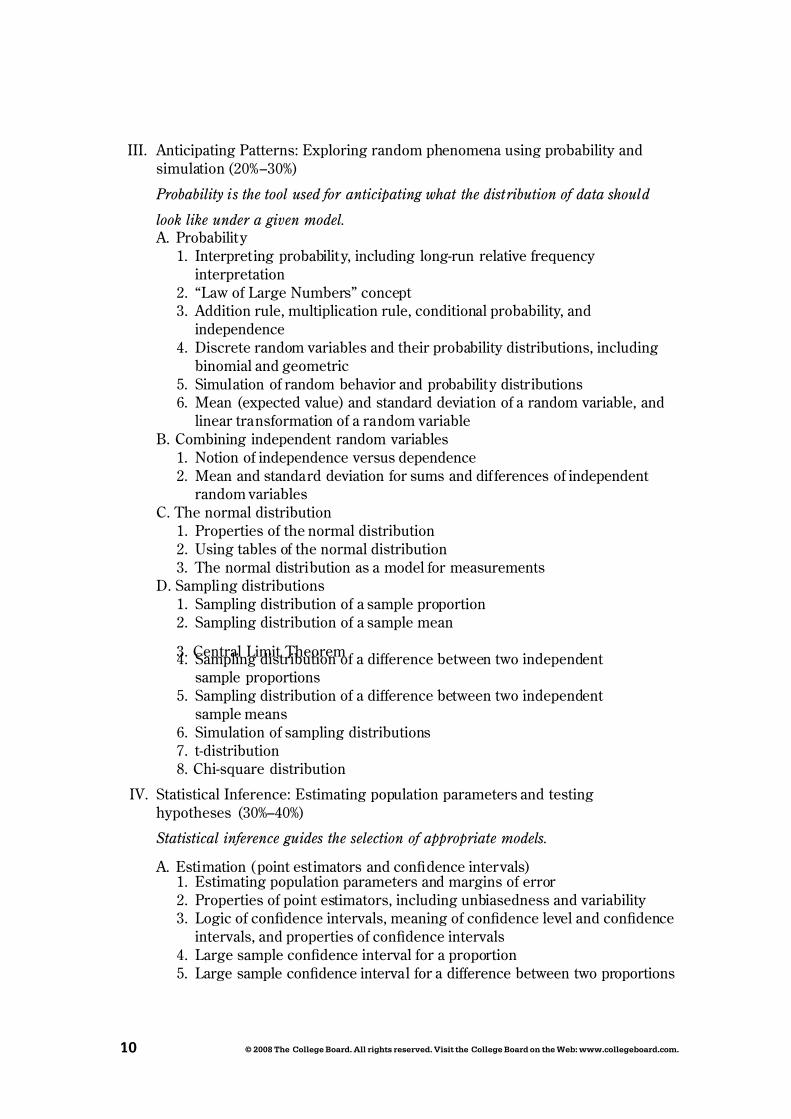
III. Anticipating Patterns: Exploring random phenomena using probability andsimulation (20%–30%)
Probability is the tool used for anticipating what the distribution of data should
look like under a given model.
A. Probability 1. Interpreting probability, including long-run relative requency
interpretation2. “Law o Large Numbers” concept 3. Addition rule, multiplication rule, conditional probability, and
independence4. Discrete random variables and their probability distributions, including
binomial and geometric5. Simulation o random behavior and probability distributions6. Mean (expected value) and standard deviation o a random variable, and
linear transormation o a random variableB. Combining independent random variables
1. Notion o independence versus dependence2. Mean and standard deviation or sums and di erences o independent
random variablesC. The normal distribution
1. Properties o the normal distribution2. Using tables o the normal distribution3. The normal distribution as a model or measurements
D. Sampling distributions1. Sampling distribution o a sample proportion2. Sampling distribution o a sample mean
3. Central Limit Theorem4. Sampling distribution o a dierence between two independent
sample proportions5. Sampling distribution o a dierence between two independent
sample means6. Simulation o sampling distributions7. t-distribution8. Chi-square distribution
IV. Statistical Inerence: Estimating population parameters and testinghypotheses (30%–40%)
Statistical inference guides the selection of appropriate models.
A. Estimation (point estimators and condence intervals)1. Estimating population parameters and margins o error 2. Properties o point estimators, including unbiasedness and variability 3. Logic o condence intervals, meaning o condence level and condence
intervals, and properties o condence intervals4. Large sample condence interval or a proportion5. Large sample condence interval or a dierence between two proportions
7/15/2019 Statistics
http://slidepdf.com/reader/full/statistics-5632806504049 17/45
© 2008 Te Cege Bar. A rgts reserve. Vst te Cege Bar te Web: www.cegebar.c.
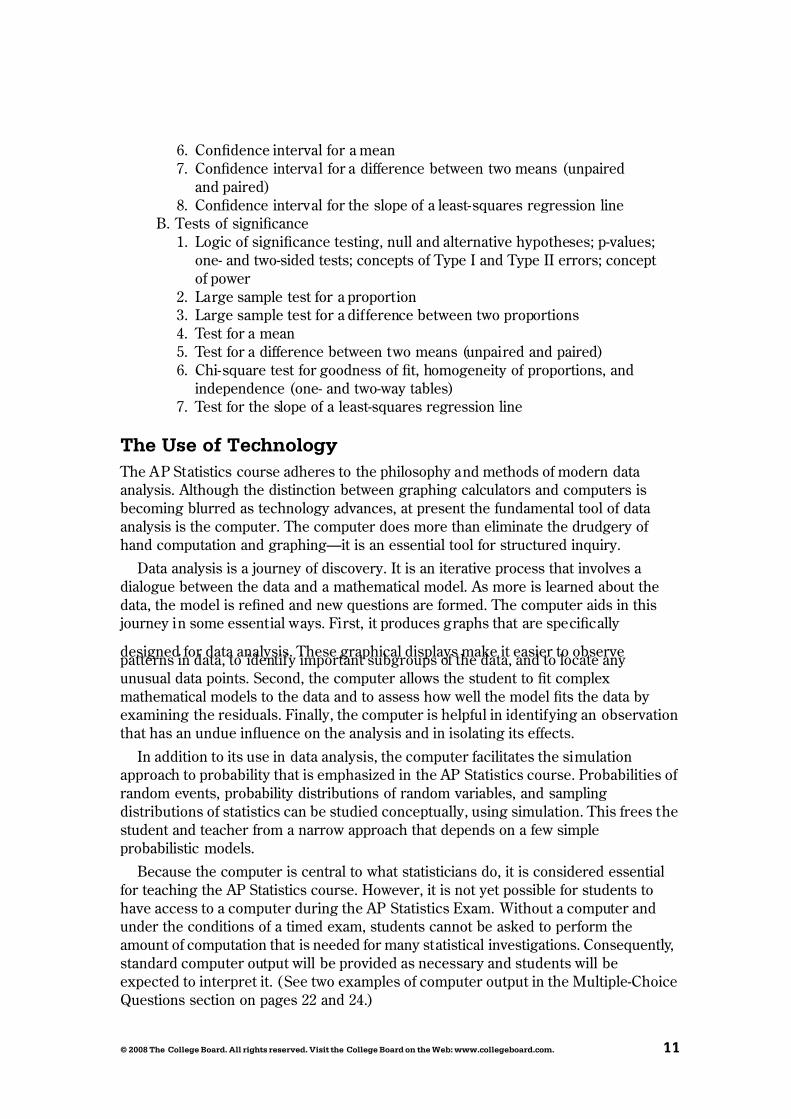
6. Condence interval or a mean7. Condence interval or a dierence between two means (unpaired
and paired)8. Condence interval or the slope o a least-squares regression line
B. Tests o signicance1. Logic o signicance testing, null and alternative hypotheses; p-values;
one- and two-sided tests; concepts o Type I and Type II errors; concept o power
2. Large sample test or a proportion3. Large sample test or a dierence between two proportions4. Test or a mean5. Test or a dierence between two means (unpaired and paired)6. Chi-square test or goodness o t, homogeneity o proportions, and
independence (one- and two-way tables)7. Test or the slope o a least-squares regression line
Te use f Tecgy
The AP Statistics course adheres to the philosophy and methods o modern data analysis. Although the distinction between graphing calculators and computers isbecoming blurred as technology advances, at present the undamental tool o data analysis is the computer. The computer does more than eliminate the drudgery o hand computation and graphing—it is an essential tool or structured inquiry.
Data analysis is a journey o discovery. It is an iterative process that involves a dialogue between the data and a mathematical model. As more is learned about thedata, the model is rened and new questions are ormed. The computer aids in this journey in some essential ways. First, it produces graphs that are specically
designed or data analysis. These graphical displays make it easier to observepatterns in data, to identiy important subgroups o the data, and to locate any unusual data points. Second, the computer allows the student to t complexmathematical models to the data and to assess how well the model ts the data by examining the residuals. Finally, the computer is helpul in identiying an observationthat has an undue infuence on the analysis and in isolating its eects.
In addition to its use in data analysis, the computer acilitates the simulationapproach to probability that is emphasized in the AP Statistics course. Probabilities o random events, probability distributions o random variables, and samplingdistributions o statistics can be studied conceptually, using simulation. This rees thestudent and teacher rom a narrow approach that depends on a ew simpleprobabilistic models.
Because the computer is central to what statisticians do, it is considered essentialor teaching the AP Statistics course. However, it is not yet possible or students tohave access to a computer during the AP Statistics Exam. Without a computer andunder the conditions o a timed exam, students cannot be asked to perorm theamount o computation that is needed or many statistical investigations. Consequently,standard computer output will be provided as necessary and students will beexpected to interpret it. (See two examples o computer output in the Multiple-ChoiceQuestions section on pages 22 and 24.)

7/15/2019 Statistics
http://slidepdf.com/reader/full/statistics-5632806504049 18/45
2 © 2008 Te Cege Bar. A rgts reserve. Vst te Cege Bar te Web: www.cegebar.c.
A graphing calculator is a useul computational aid, particularly in analyzing smalldata sets, but should not be considered equivalent to a computer in the teaching o statistics. I a graphing calculator is used in the course, its computational capabilitiesshould include standard statistical univariate and bivariate summaries through linear regression. Its graphical capabilities should include common univariate and bivariatedisplays such as histograms, boxplots, and scatterplots. Students nd calculators where data are entered into a spreadsheet ormat particularly easy to use. Ideally,students should have access to both computers and calculators or work in andoutside the classroom.
Currently, the graphing calculator is the only computational aid that is availableto students or use as a tool or data analysis on the AP Exam. Students who utilizegraphing calculators on the exam should be aware o the ollowing policy.
It is not only inappropriate, but unethical, or students who are taking the AP Statistics Exam to have access to any inormation in their graphing calculatorsor elsewhere that is not directly related to upgrading the statistical unctionality
o older graphing calculators to make them comparable to statistical eaturesound on newer models.
During the exam, students are not permitted to have access to any inormation intheir graphing calculators or elsewhere that is not directly related to upgradingthe statistical unctionality o older graphing calculators to make them comparableto statistical eatures ound on newer models.
Acceptable upgrades include improving the calculator’s computational unctional-ities and/or graphical unctionalities or data that students key into the calculator while taking the exam.
Unacceptable enhancements include, but are not limited to, keying or scanningtext or response templates into the calculator. Students attempting to augment the capabilities o their graphing calculators in any way other than or the purposeo upgrading eatures, as described above, will be considered to be cheating onthe exam.
Fras a Tabes
Students enrolled in the AP Statistics course should concentrate their time and eort on developing a thorough understanding o the undamental concepts o statistics. They do not need to memorize ormulas.
The ollowing list o ormulas and tables will be urnished to students taking the AP Statistics Exam. Teachers are encouraged to amiliarize their students with theorm and notation o these ormulas by making them accessible at the appropriatetimes during the course.

7/15/2019 Statistics
http://slidepdf.com/reader/full/statistics-5632806504049 19/45
© 2008 Te Cege Bar. A rgts reserve. Vst te Cege Bar te Web: www.cegebar.c.
I. descrptve Statstcs
x x i
n
s n
x x
s n s n s
x
p
i
=
=−
−
=− + −
∑
∑1
1
1 1
2
1 212
22
( )
( ) ( )
(( ) ( )
ˆ
( )( )(
n n
y b b x
b x x y y x
i i
i
1 2
0 1
1
1 1− + −
= +
=− −
−∑ x x
b y b x
r n
x x
s
y y
s
b
i
x
i
y
)2
0 1
1
11
∑
∑
= −
=−
−( ) −
= r r s
s
s
y y
n
x x
y
x
b
i i
i
1
2
2
2=
−
−
−
∑
∑
( ˆ )
( )
( )
7/15/2019 Statistics
http://slidepdf.com/reader/full/statistics-5632806504049 20/45
© 2008 Te Cege Bar. A rgts reserve. Vst te Cege Bar te Web: www.cegebar.c.
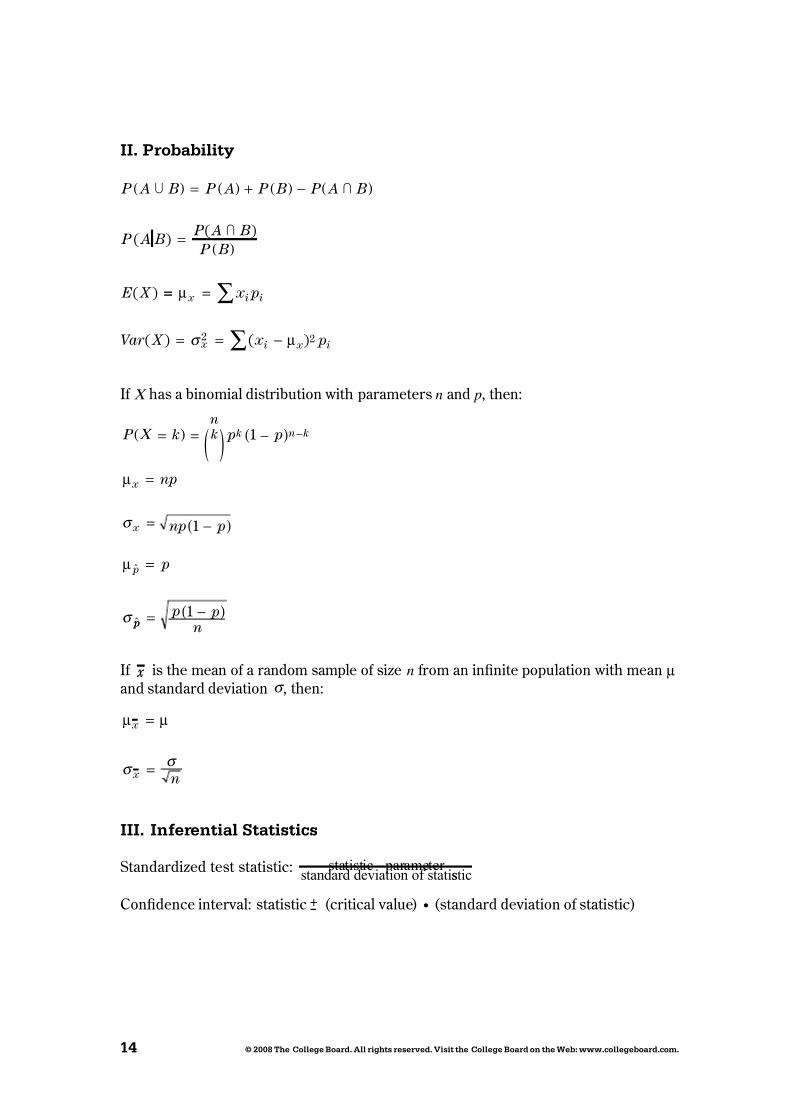
II. Prbabty
P A B P A P B P A B
P A BP A B
P B
E X
U I
I
( ) = ( ) + ( ) − ( )
=( )
( )( )
( ) == =
= = −
∑
∑
µ
µ
x i i
x i x i
x p
Var X x p( ) ( )σ 2 2
I C has a binomial distribution with parameters n and p, then:
P k p p
np
np p
p
k n
k n k
x
p
C =( ) = ( ) -( )
=
= -( )
=
-1
1
μ
μ
x
σ
σ
ˆ
ˆ p p p p
n= -( )1
I x is the mean o a random sample o size n rom an innite population with mean μ and standard deviation σ , then:
μ μ x
x n
=
=σ σ
III. Ifereta Statstcs
Standardized test statistic: statistic – parameter standard deviation of statisstic
Condence interval: statistic (critical value) • (standard deviation o statistic)

7/15/2019 Statistics
http://slidepdf.com/reader/full/statistics-5632806504049 21/45
© 2008 Te Cege Bar. A rgts reserve. Vst te Cege Bar te Web: www.cegebar.c.
Sge-Sape
Tw-Sape
StatisticStandard Deviation
o Statistic
Dierence o
sample means
Special case when
Dierence o
sample proportions
Special case when
StatisticStandard Deviation
o Statistic
Sample Mean
Sample Proportion
σ
n
p p n
1 -( )
σ σ 12
22
1 2 n n+
σ σ
σ
1 2
1 2
1 1
=
+n n
p p
n
p p
n1 1
1
2 2
2
1 1-( )+
-( )
p p
p p n n
1 2
1 2
11 1
=
-( ) +
Chi-square test statistic =obd – xd
xd
2( )
∑
7/15/2019 Statistics
http://slidepdf.com/reader/full/statistics-5632806504049 22/45
© 2008 Te Cege Bar. A rgts reserve. Vst te Cege Bar te Web: www.cegebar.c.
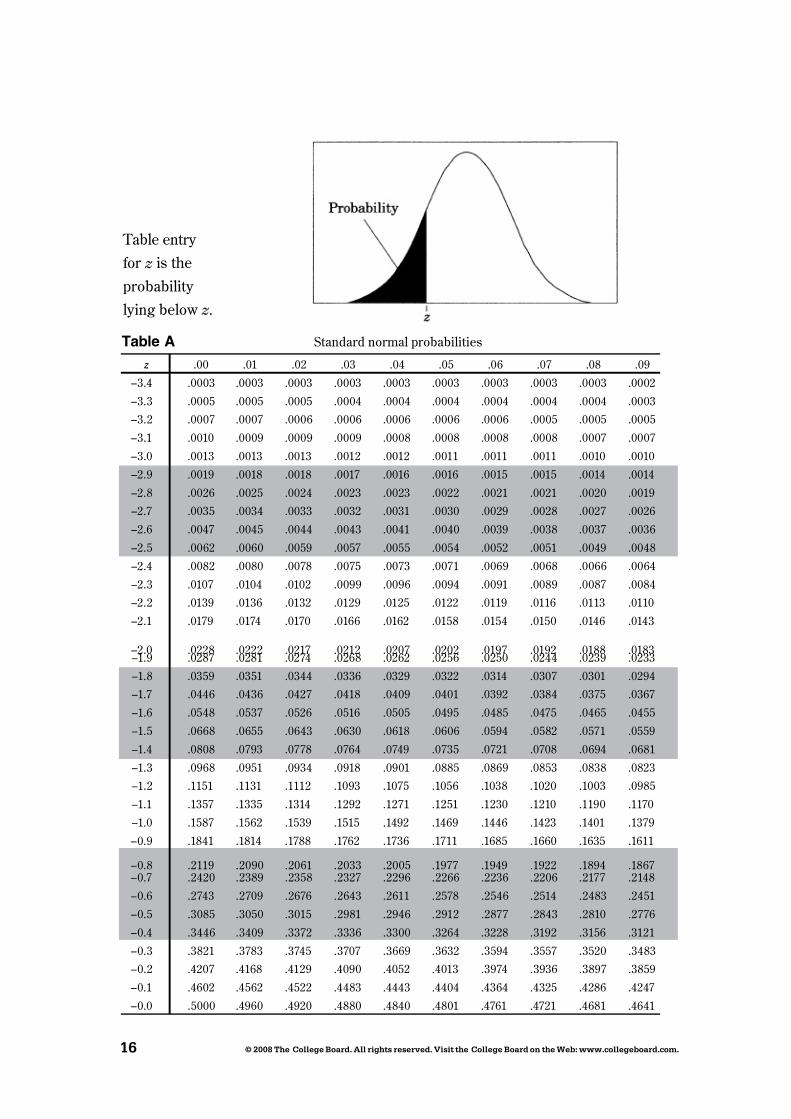
Table entry
or z is the
probability
lying below z.
Table A Standard normal probabilities
z .00 .01 .02 .03 .04 .05 .06 .07 .08 .09
–3.4 .0003 .0003 .0003 .0003 .0003 .0003 .0003 .0003 .0003 .0002
–3.3 .0005 .0005 .0005 .0004 .0004 .0004 .0004 .0004 .0004 .0003
–3.2 .0007 .0007 .0006 .0006 .0006 .0006 .0006 .0005 .0005 .0005
–3.1 .0010 .0009 .0009 .0009 .0008 .0008 .0008 .0008 .0007 .0007
–3.0 .0013 .0013 .0013 .0012 .0012 .0011 .0011 .0011 .0010 .0010
–2.9 .0019 .0018 .0018 .0017 .0016 .0016 .0015 .0015 .0014 .0014
–2.8 .0026 .0025 .0024 .0023 .0023 .0022 .0021 .0021 .0020 .0019
–2.7 .0035 .0034 .0033 .0032 .0031 .0030 .0029 .0028 .0027 .0026
–2.6 .0047 .0045 .0044 .0043 .0041 .0040 .0039 .0038 .0037 .0036
–2.5 .0062 .0060 .0059 .0057 .0055 .0054 .0052 .0051 .0049 .0048
–2.4 .0082 .0080 .0078 .0075 .0073 .0071 .0069 .0068 .0066 .0064
–2.3 .0107 .0104 .0102 .0099 .0096 .0094 .0091 .0089 .0087 .0084
–2.2 .0139 .0136 .0132 .0129 .0125 .0122 .0119 .0116 .0113 .0110
–2.1 .0179 .0174 .0170 .0166 .0162 .0158 .0154 .0150 .0146 .0143
–2.0 .0228 .0222 .0217 .0212 .0207 .0202 .0197 .0192 .0188 .0183–1.9 .0287 .0281 .0274 .0268 .0262 .0256 .0250 .0244 .0239 .0233
–1.8 .0359 .0351 .0344 .0336 .0329 .0322 .0314 .0307 .0301 .0294
–1.7 .0446 .0436 .0427 .0418 .0409 .0401 .0392 .0384 .0375 .0367
–1.6 .0548 .0537 .0526 .0516 .0505 .0495 .0485 .0475 .0465 .0455
–1.5 .0668 .0655 .0643 .0630 .0618 .0606 .0594 .0582 .0571 .0559
–1.4 .0808 .0793 .0778 .0764 .0749 .0735 .0721 .0708 .0694 .0681
–1.3 .0968 .0951 .0934 .0918 .0901 .0885 .0869 .0853 .0838 .0823
–1.2 .1151 .1131 .1112 .1093 .1075 .1056 .1038 .1020 .1003 .0985
–1.1 .1357 .1335 .1314 .1292 .1271 .1251 .1230 .1210 .1190 .1170
–1.0 .1587 .1562 .1539 .1515 .1492 .1469 .1446 .1423 .1401 .1379
–0.9 .1841 .1814 .1788 .1762 .1736 .1711 .1685 .1660 .1635 .1611
–0.8 .2119 .2090 .2061 .2033 .2005 .1977 .1949 .1922 .1894 .1867–0.7 .2420 .2389 .2358 .2327 .2296 .2266 .2236 .2206 .2177 .2148
–0.6 .2743 .2709 .2676 .2643 .2611 .2578 .2546 .2514 .2483 .2451
–0.5 .3085 .3050 .3015 .2981 .2946 .2912 .2877 .2843 .2810 .2776
–0.4 .3446 .3409 .3372 .3336 .3300 .3264 .3228 .3192 .3156 .3121
–0.3 .3821 .3783 .3745 .3707 .3669 .3632 .3594 .3557 .3520 .3483
–0.2 .4207 .4168 .4129 .4090 .4052 .4013 .3974 .3936 .3897 .3859
–0.1 .4602 .4562 .4522 .4483 .4443 .4404 .4364 .4325 .4286 .4247
–0.0 .5000 .4960 .4920 .4880 .4840 .4801 .4761 .4721 .4681 .4641

7/15/2019 Statistics
http://slidepdf.com/reader/full/statistics-5632806504049 23/45
© 2008 Te Cege Bar. A rgts reserve. Vst te Cege Bar te Web: www.cegebar.c.
Table A (Continued) Standard normal probabilities
z .00 .01 .02 .03 .04 .05 .06 .07 .08 .09
0.0 .5000 .5040 .5080 .5120 .5160 .5199 .5239 .5279 .5319 .5359
0.1 .5398 .5438 .5478 .5517 .5557 .5596 .5636 .5675 .5714 .5753
0.2 .5793 .5832 .5871 .5910 .5948 .5987 .6026 .6064 .6103 .61410.3 .6179 .6217 .6255 .6293 .6331 .6368 .6406 .6443 .6480 .6517
0.4 .6554 .6591 .6628 .6664 .6700 .6736 .6772 .6808 .6844 .6879
0.5 .6915 .6950 .6985 .7019 .7054 .7088 .7123 .7157 .7190 .7224
0.6 .7257 .7291 .7324 .7357 .7389 .7422 .7454 .7486 .7517 .7549
0.7 .7580 .7611 .7642 .7673 .7704 .7734 .7764 .7794 .7823 .7852
0.8 .7881 .7910 .7939 .7967 .7995 .8023 .8051 .8078 .8106 .8133
0.9 .8159 .8186 .8212 .8238 .8264 .8289 .8315 .8340 .8365 .8389
1.0 .8413 .8438 .8461 .8485 .8508 .8531 .8554 .8577 .8599 .8621
1.1 .8643 .8665 .8686 .8708 .8729 .8749 .8770 .8790 .8810 .8830
1.2 .8849 .8869 .8888 .8907 .8925 .8944 .8962 .8980 .8997 .9015
1.3 .9032 .9049 .9066 .9082 .9099 .9115 .9131 .9147 .9162 .9177
1.4 .9192 .9207 .9222 .9236 .9251 .9265 .9279 .9292 .9306 .9319
1.5 .9332 .9345 .9357 .9370 .9382 .9394 .9406 .9418 .9429 .9441
1.6 .9452 .9463 .9474 .9484 .9495 .9505 .9515 .9525 .9535 .9545
1.7 .9554 .9564 .9573 .9582 .9591 .9599 .9608 .9616 .9625 .9633
1.8 .9641 .9649 .9656 .9664 .9671 .9678 .9686 .9693 .9699 .9706
1.9 .9713 .9719 .9726 .9732 .9738 .9744 .9750 .9756 .9761 .9767
2.0 .9772 .9778 .9783 .9788 .9793 .9798 .9803 .9808 .9812 .9817
2.1 .9821 .9826 .9830 .9834 .9838 .9842 .9846 .9850 .9854 .9857
2.2 .9861 .9864 .9868 .9871 .9875 .9878 .9881 .9884 .9887 .9890
2.3 .9893 .9896 .9898 .9901 .9904 .9906 .9909 .9911 .9913 .9916
2.4 .9918 .9920 .9922 .9925 .9927 .9929 .9931 .9932 .9934 .9936
2.5 .9938 .9940 .9941 .9943 .9945 .9946 .9948 .9949 .9951 .9952
2.6 .9953 .9955 .9956 .9957 .9959 .9960 .9961 .9962 .9963 .9964
2.7 .9965 .9966 .9967 .9968 .9969 .9970 .9971 .9972 .9973 .9974
2.8 .9974 .9975 .9976 .9977 .9977 .9978 .9979 .9979 .9980 .9981
2.9 .9981 .9982 .9982 .9983 .9984 .9984 .9985 .9985 .9986 .9986
3.0 .9987 .9987 .9987 .9988 .9988 .9989 .9989 .9989 .9990 .9990
3.1 .9990 .9991 .9991 .9991 .9992 .9992 .9992 .9992 .9993 .9993
3.2 .9993 .9993 .9994 .9994 .9994 .9994 .9994 .9995 .9995 .9995
3.3 .9995 .9995 .9995 .9996 .9996 .9996 .9996 .9996 .9996 .9997
3.4 .9997 .9997 .9997 .9997 .9997 .9997 .9997 .9997 .9997 .9998
Table entry or z is theprobability lying below z.
7/15/2019 Statistics
http://slidepdf.com/reader/full/statistics-5632806504049 24/45
8 © 2008 Te Cege Bar. A rgts reserve. Vst te Cege Bar te Web: www.cegebar.c.
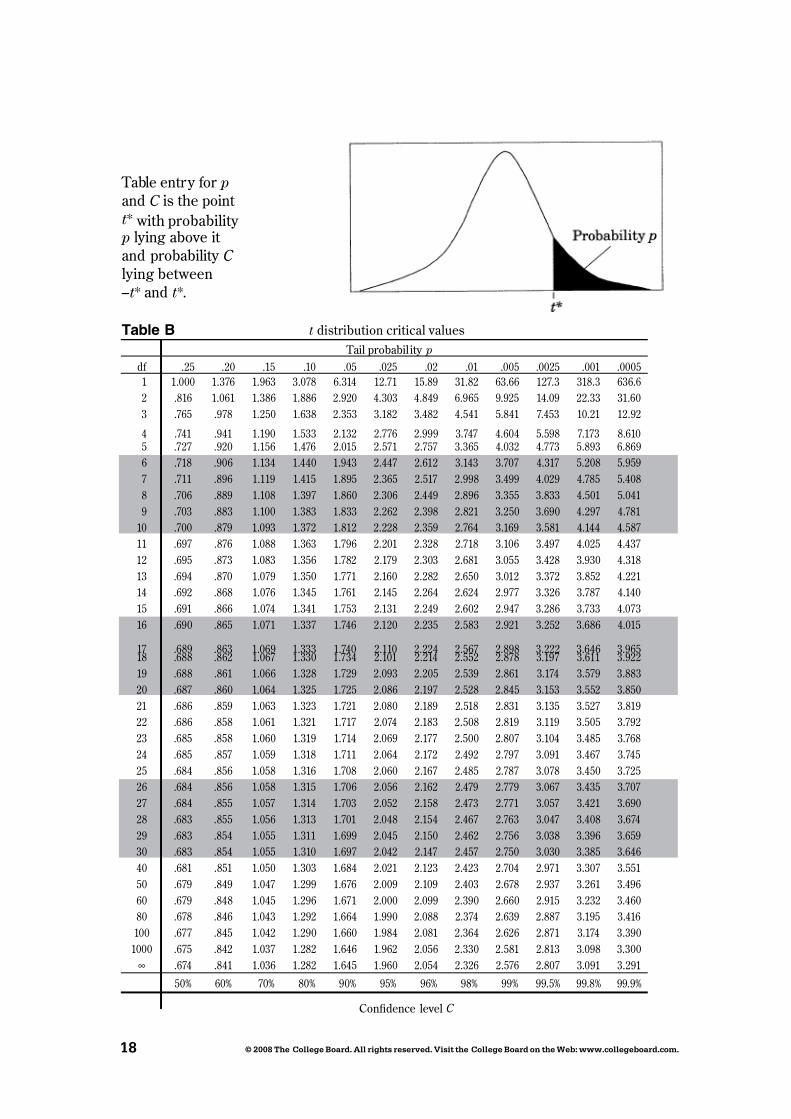
Table entry or p
and C is the point t* with probability
p lying above it and probability C lying between–t* and t*.
Table B t distribution critical values
Tail probabil ity p
df .25 .20 .15 .10 .05 .025 .02 .01 .005 .0025 .001 .0005
1 1.000 1.376 1.963 3.078 6.314 12.71 15.89 31.82 63.66 127.3 318.3 636.6
2 .816 1.061 1.386 1.886 2.920 4.303 4.849 6.965 9.925 14.09 22.33 31.60
3 .765 .978 1.250 1.638 2.353 3.182 3.482 4.541 5.841 7.453 10.21 12.92
4 .741 .941 1.190 1.533 2.132 2.776 2.999 3.747 4.604 5.598 7.173 8.610
5 .727 .920 1.156 1.476 2.015 2.571 2.757 3.365 4.032 4.773 5.893 6.869
6 .718 .906 1.134 1.440 1.943 2.447 2.612 3.143 3.707 4.317 5.208 5.959
7 .711 .896 1.119 1.415 1.895 2.365 2.517 2.998 3.499 4.029 4.785 5.408
8 .706 .889 1.108 1.397 1.860 2.306 2.449 2.896 3.355 3.833 4.501 5.041
9 .703 .883 1.100 1.383 1.833 2.262 2.398 2.821 3.250 3.690 4.297 4.781
10 .700 .879 1.093 1.372 1.812 2.228 2.359 2.764 3.169 3.581 4.144 4.587
11 .697 .876 1.088 1.363 1.796 2.201 2.328 2.718 3.106 3.497 4.025 4.437
12 .695 .873 1.083 1.356 1.782 2.179 2.303 2.681 3.055 3.428 3.930 4.318
13 .694 .870 1.079 1.350 1.771 2.160 2.282 2.650 3.012 3.372 3.852 4.221
14 .692 .868 1.076 1.345 1.761 2.145 2.264 2.624 2.977 3.326 3.787 4.140
15 .691 .866 1.074 1.341 1.753 2.131 2.249 2.602 2.947 3.286 3.733 4.073
16 .690 .865 1.071 1.337 1.746 2.120 2.235 2.583 2.921 3.252 3.686 4.015
17 .689 .863 1.069 1.333 1.740 2.110 2.224 2.567 2.898 3.222 3.646 3.96518 .688 .862 1.067 1.330 1.734 2.101 2.214 2.552 2.878 3.197 3.611 3.922
19 .688 .861 1.066 1.328 1.729 2.093 2.205 2.539 2.861 3.174 3.579 3.883
20 .687 .860 1.064 1.325 1.725 2.086 2.197 2.528 2.845 3.153 3.552 3.850
21 .686 .859 1.063 1.323 1.721 2.080 2.189 2.518 2.831 3.135 3.527 3.819
22 .686 .858 1.061 1.321 1.717 2.074 2.183 2.508 2.819 3.119 3.505 3.792
23 .685 .858 1.060 1.319 1.714 2.069 2.177 2.500 2.807 3.104 3.485 3.768
24 .685 .857 1.059 1.318 1.711 2.064 2.172 2.492 2.797 3.091 3.467 3.745
25 .684 .856 1.058 1.316 1.708 2.060 2.167 2.485 2.787 3.078 3.450 3.725
26 .684 .856 1.058 1.315 1.706 2.056 2.162 2.479 2.779 3.067 3.435 3.707
27 .684 .855 1.057 1.314 1.703 2.052 2.158 2.473 2.771 3.057 3.421 3.690
28 .683 .855 1.056 1.313 1.701 2.048 2.154 2.467 2.763 3.047 3.408 3.674
29 .683 .854 1.055 1.311 1.699 2.045 2.150 2.462 2.756 3.038 3.396 3.659
30 .683 .854 1.055 1.310 1.697 2.042 2.147 2.457 2.750 3.030 3.385 3.646
40 .681 .851 1.050 1.303 1.684 2.021 2.123 2.423 2.704 2.971 3.307 3.551
50 .679 .849 1.047 1.299 1.676 2.009 2.109 2.403 2.678 2.937 3.261 3.496
60 .679 .848 1.045 1.296 1.671 2.000 2.099 2.390 2.660 2.915 3.232 3.460
80 .678 .846 1.043 1.292 1.664 1.990 2.088 2.374 2.639 2.887 3.195 3.416
100 .677 .845 1.042 1.290 1.660 1.984 2.081 2.364 2.626 2.871 3.174 3.390
1000 .675 .842 1.037 1.282 1.646 1.962 2.056 2.330 2.581 2.813 3.098 3.300
∞ .674 .841 1.036 1.282 1.645 1.960 2.054 2.326 2.576 2.807 3.091 3.291
50% 60% 70% 80% 90% 95% 96% 98% 99% 99.5% 99.8% 99.9%
Condence level C

7/15/2019 Statistics
http://slidepdf.com/reader/full/statistics-5632806504049 25/45
© 2008 Te Cege Bar. A rgts reserve. Vst te Cege Bar te Web: www.cegebar.c.
Table C χ 2critical values
Tail probabil ity p
df .25 .20 .15 .10 .05 .025 .02 .01 .005 .0025 .001
1 1.32 1.64 2.07 2.71 3.84 5.02 5.41 6.63 7.88 9.14 10.83
2 2.77 3.22 3.79 4.61 5.99 7.38 7.82 9.21 10.60 11.98 13.82
3 4.11 4.64 5.32 6.25 7.81 9.35 9.84 11.34 12.84 14.32 16.27
4 5.39 5.99 6.74 7.78 9.49 11.14 11.67 13.28 14.86 16.42 18.47
5 6.63 7.29 8.12 9.24 11.07 12.83 13.39 15.09 16.75 18.39 20.51
6 7.84 8.56 9.45 10.64 12.59 14.45 15.03 16.81 18.55 20.25 22.46
7 9.04 9.80 10.75 12.02 14.07 16.01 16.62 18.48 20.28 22.04 24.32
8 10.22 11.03 12.03 13.36 15.51 17.53 18.17 20.09 21.95 23.77 26.12
9 11.39 12.24 13.29 14.68 16.92 19.02 19.68 21.67 23.59 25.46 27.88
10 12.55 13.44 14.53 15.99 18.31 20.48 21.16 23.21 25.19 27.11 29.59
11 13.70 14.63 15.77 17.28 19.68 21.92 22.62 24.72 26.76 28.73 31.26
12 14.85 15.81 16.99 18.55 21.03 23.34 24.05 26.22 28.30 30.32 32.91
13 15.98 16.98 18.20 19.81 22.36 24.74 25.47 27.69 29.82 31.88 34.53
14 17.12 18.15 19.41 21.06 23.68 26.12 26.87 29.14 31.32 33.43 36.12
15 18.25 19.31 20.60 22.31 25.00 27.49 28.26 30.58 32.80 34.95 37.70
16 19.37 20.47 21.79 23.54 26.30 28.85 29.63 32.00 34.27 36.46 39.25
17 20.49 21.61 22.98 24.77 27.59 30.19 31.00 33.41 35.72 37.95 40.79
18 21.60 22.76 24.16 25.99 28.87 31.53 32.35 34.81 37.16 39.42 42.31
19 22.72 23.90 25.33 27.20 30.14 32.85 33.69 36.19 38.58 40.88 43.82
20 23.83 25.04 26.50 28.41 31.41 34.17 35.02 37.57 40.00 42.34 45.31
21 24.93 26.17 27.66 29.62 32.67 35.48 36.34 38.93 41.40 43.78 46.80
22 26.04 27.30 28.82 30.81 33.92 36.78 37.66 40.29 42.80 45.20 48.27
23 27.14 28.43 29.98 32.01 35.17 38.08 38.97 41.64 44.18 46.62 49.73
24 28.24 29.55 31.13 33.20 36.42 39.36 40.27 42.98 45.56 48.03 51.18
25 29.34 30.68 32.28 34.38 37.65 40.65 41.57 44.31 46.93 49.44 52.62
26 30.43 31.79 33.43 35.56 38.89 41.92 42.86 45.64 48.29 50.83 54.0527 31.53 32.91 34.57 36.74 40.11 43.19 44.14 46.96 49.64 52.22 55.48
28 32.62 34.03 35.71 37.92 41.34 44.46 45.42 48.28 50.99 53.59 56.89
29 33.71 35.14 36.85 39.09 42.56 45.72 46.69 49.59 52.34 54.97 58.30
30 34.80 36.25 37.99 40.26 43.77 46.98 47.96 50.89 53.67 56.33 59.70
40 45.62 47.27 49.24 51.81 55.76 59.34 60.44 63.69 66.77 69.70 73.40
50 56.33 58.16 60.35 63.17 67.50 71.42 72.61 76.15 79.49 82.66 86.66
60 66.98 68.97 71.34 74.40 79.08 83.30 84.58 88.38 91.95 95.34 99.61
80 88.13 90.41 93.11 96.58 101.9 106.6 108.1 112.3 116.3 120.1 124.8
100 109.1 111.7 114.7 118.5 124.3 129.6 131.1 135.8 140.2 144.3 149.4
Table entry or p is thepoint ( χ 2 ) withprobability p lying above it.

7/15/2019 Statistics
http://slidepdf.com/reader/full/statistics-5632806504049 26/45
20
Sample Questions for Statstcs
© 2008 Te Cege Bar. A rgts reserve. Vst te Cege Bar te Web: www.cegebar.c.
T h E E x A m
The AP Statistics Exam is three hours long and seeks to determine how well a student has mastered the concepts and techniques o the subject matter o the course.
This paper-and-pencil exam consists o (1) a 90 -minute multiple-choice section testingprociency in a wide variety o topics, and (2) a 90 -minute ree-response sectionrequiring the student to answer open-ended questions and to complete aninvestigative task involving more extended reasoning. In the determination o thegrade or the exam, the two sections will be given equal weight.
Each student will be expected to bring a graphing calculator with statisticalcapabilities to the exam. The expected computational and graphic eatures or thesecalculators are described in an earlier section. Minicomputers, pocket organizers,electronic writing pads (e.g., Newton), and calculators with qwerty (i.e., typewriter)keyboards will not be allowed. Calculator memories will not be cleared. However,calculator memories may be used only or storing programs, not or storing notes.
During the exam, students are not permitted to have access to any inormation intheir graphing calculators or elsewhere that is not directly related to upgrading thestatistical unctionality o older graphing calculators to make them comparable tostatistical eatures ound on newer models. Acceptable upgrades include improvingthe calculator’s computational unctionalities and/or graphical unctionalities or data that students key into the calculator while taking the exam. Unacceptableenhancements include, but are not limited to, keying or scanning text or responsetemplates into the calculator. Students attempting to augment the capabilities o their graphing calculators in any way other than or the purpose o upgrading eatures asdescribed above will be considered to be cheating on the exam. A student may bringup to two calculators to the exam.
mtpe-Cce Qests The ollowing are examples o the kinds o multiple-choice questions ound on the AP Statistics Exam; the answers to these questions ollow question 18. Thedistribution o topics and the levels o diculty are illustrative o the composition o the exam; however, this group o questions does not constitute a complete exam, nor does it show the complete range o questions that appear in an exam.
Students oten ask whether they should guess on the multiple-choice section.Haphazard or random guessing is unlikely to improve scores, because one-ourth o the number o questions answered incorrectly will be subtracted rom the number o questions answered correctly. However, students who have some knowledge o a question and can eliminate one or more answer choices will usually nd it
advantageous to guess rom among the remaining choices.

7/15/2019 Statistics
http://slidepdf.com/reader/full/statistics-5632806504049 27/45
2
Sample Questions for Statstcs
© 2008 Te Cege Bar. A rgts reserve. Vst te Cege Bar te Web: www.cegebar.c.
1. In the scatterplot o y versus x shown above, the least squares regressionline is superimposed on the plot. Which o the ollowing points has thelargest residual?
( a ) A
( b ) B
( c ) C
( d ) D
( e ) E
2. Under which o the ollowing conditions is it preerable to use stratiied randomsampling rather than simple random sampling?
( a ) The population can be divided into a large number o strata so that eachstratum contains only a ew individuals.
( b ) The population can be divided into a small number o strata so that eachstratum contains a large number o individuals.
( c ) The population can be divided into strata so that the individuals in eachstratum are as much alike as possible.
( d ) The population can be divided into strata so that the individuals in eachstratum are as dierent as possible.
( e ) The population can be divided into strata o equal sizes so that eachindividual in the population still has the same chance o being selected.

7/15/2019 Statistics
http://slidepdf.com/reader/full/statistics-5632806504049 28/45
22
Sample Questions for Statstcs
© 2008 Te Cege Bar. A rgts reserve. Vst te Cege Bar te Web: www.cegebar.c.
3. All bags entering a research acility are screened. Ninety-seven percent o the bagsthat contain orbidden material trigger an alarm. Fiteen percent o the bags that do not contain orbidden material also trigger the alarm. I 1 out o every 1,000bags entering the building contains orbidden material, what is the probability that a bag that triggers the alarm will actually contain orbidden material?
( a ) 0.00097( b ) 0.00640( c ) 0.03000( d ) 0.14550( e ) 0.97000
4. A candy company claims that 10 percent o its candies are blue. A randomsample o 200 o these candies is taken, and 16 are ound to be blue. Which o the ollowing tests would be most appropriate or establishing whether the candy company needs to change its claim?
( a ) Matched pairs t -test ( b ) One-sample proportion z -test ( c ) Two-sample t -test ( d ) Two-sample propor tion z -test ( e ) Chi-square test o association
Descriptive statistics
Variable N Mean Median TrMean StDev SE Meanscore 50 1045.7 1024.7 1041.9 221.9 31.4
Variable Minimum Maximum Q1 Q3score 628.9 1577.1 877.7 1219.5
5. Some descriptive statistics or a set o test scores are shown above. For thistest, a certain student has a standardized score o z = –1.2. What score did thisstudent receive on the test?
( a ) 266.28( b ) 779.42( c ) 1008.02( d ) 1083.38( e ) 1311.98
6. In a test o H0: μ = 8 versus Ha : μ ≠ 8, a sample o size 220 leads to a p-value o 0.034. Which o the ollowing must be true?
( a ) A 95% conidence inter val or μ calculated rom these data will not include μ = 8.
( b ) At the 5% level i H0
is rejected, the probability o a Type II error is 0.034.( c ) The 95% conidence inter val or μ calculated rom these data will be
centered at μ = 8.( d ) The null hypothesis should not be rejected at the 5% level.( e ) The sample size is insuicient to draw a conclusion with 95% conidence.

7/15/2019 Statistics
http://slidepdf.com/reader/full/statistics-5632806504049 29/45
2
Sample Questions for Statstcs
© 2008 Te Cege Bar. A rgts reserve. Vst te Cege Bar te Web: www.cegebar.c.
7. A summer resort rents rowboats to customers but does not allow more thanour people to a boat. Each boat is designed to hold no more than 800 pounds.Suppose the distribution o adult males who rent boats, including their clothesand gear, is normal with a mean o 190 pounds and standard deviation o 10pounds. I the weights o individual passengers are independent, what is theprobability that a group o our adult male passengers will exceed the acceptable weight limit o 800 pounds?
( a ) 0.023( b ) 0.046( c ) 0.159( d ) 0.317( e ) 0.977
8. Consider a data set o positive values, at least two o which are not equal. Whicho the ollowing sample statistics will be changed when each value in this data set
is multiplied by a constant whose absolute value is greater than 1?
I. The meanII. The median
III. The standard deviation
( a ) I only ( b ) II only ( c ) III only ( d ) I and II only ( e ) I, II, and III
9. Each person in a simple random sample o 2,000 received a survey, and 317
people returned their survey. How could nonresponse cause the results o thesurvey to be biased?
( a ) Those who did not respond reduced the sample size, and small samples havemore bias than large samples.
( b ) Those who did not respond caused a violation o the assumption o independence.
( c ) Those who did not respond were indistinguishable rom those who did not receive the survey.
( d ) Those who did not respond represent a stratum, changing the simple randomsample into a stratiied random sample.
( e ) Those who did respond may di er in some important way rom those who
did not respond.

7/15/2019 Statistics
http://slidepdf.com/reader/full/statistics-5632806504049 30/45
2
Sample Questions for Statstcs
© 2008 Te Cege Bar. A rgts reserve. Vst te Cege Bar te Web: www.cegebar.c.
10. In a certain game, a air die is rolled and a player gains 20 points i the die showsa “6.” I the die does not show a “6,” the player loses 3 points. I the die were to berolled 100 times, what would be the expected total gain or loss or the player?
( a ) A gain o about 1,700 points( b ) A gain o about 583 points( c ) A gain o about 83 points( d ) A loss o about 250 points( e ) A loss o about 300 points
11. The Attila Barbell Company makes bars or weight liting. The weights o thebars are independent and are normally distributed with a mean o 720 ounces(45 pounds) and a standard deviation o 4 ounces. The bars are shipped 10 in a box to the retailers. The weights o the empty boxes are normally distributed witha mean o 320 ounces and a standard deviation o 8 ounces. The weights o theboxes illed with 10 bars are expected to be normally distributed with a mean o
7,520 ounces and a standard deviation o
( a ) 12 ounces
( b ) 80 ounces
( c ) 224 ounces
( d ) 48 ounces
( e ) 1 664, ounces
12. Exercise physiologists are investigating the relationship between lean body mass (in kilograms) and the resting metabolic rate (in calories per day) insedentary males.
pdo cof sD t p
conn 264.0 276.9 0.95 0.363
M 22.563 6.360 3.55 0.005
s = 144.9 r-sq = 55.7% r-sq(dj) = 51.3%
Based on the computer output above, which o the ollowing is the best interpretation o the value o the slope o the regression line?
( a ) For each additional kilogram o lean body mass, the resting metabolic rateincreases on average by 22.563 calories per day.
( b ) For each additional kilogram o lean body mass, the resting metabolic rateincreases on average by 264.0 calories per day.( c ) For each additional kilogram o lean body mass, the resting metabolic rate
increases on average by 144.9 calories per day.( d ) For each additional calorie per day or the resting metabolic rate, the lean
body mass increases on average by 22.563 kilograms.( e ) For each additional calorie per day or the resting metabolic rate, the lean
body mass increases on average by 264.0 kilograms.
7/15/2019 Statistics
http://slidepdf.com/reader/full/statistics-5632806504049 31/45
2
Sample Questions for Statstcs
© 2008 Te Cege Bar. A rgts reserve. Vst te Cege Bar te Web: www.cegebar.c.
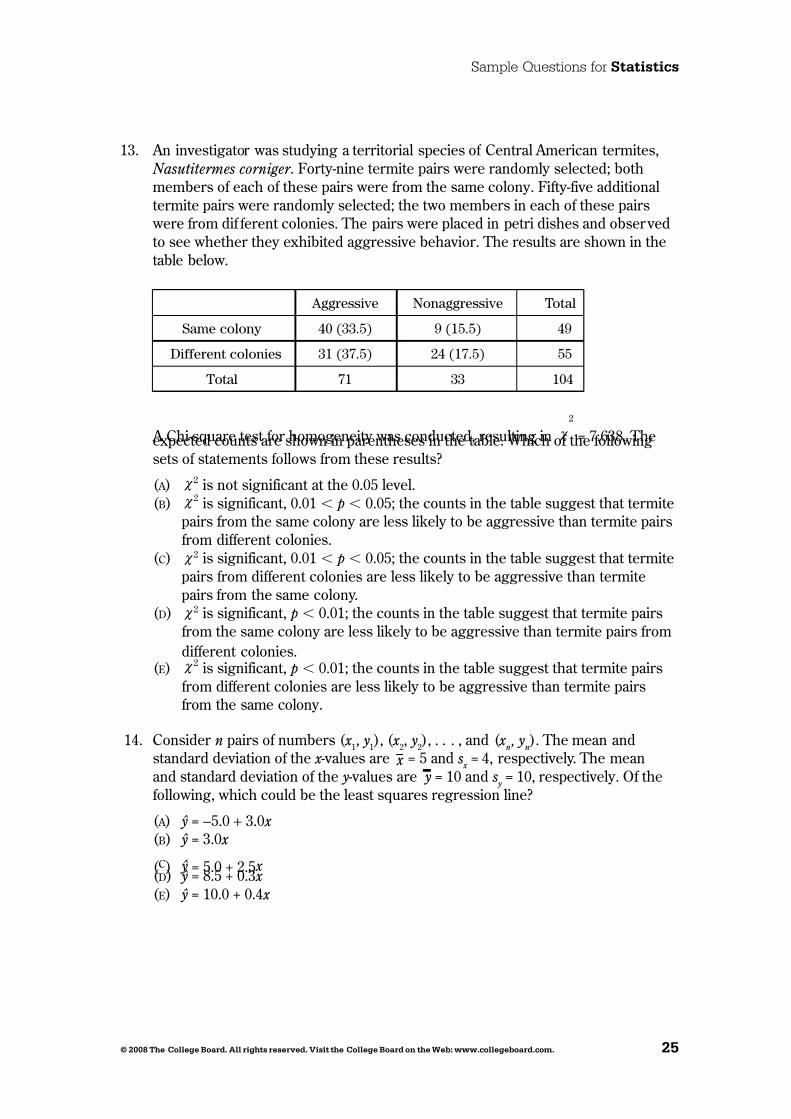
13. An investigator was studying a territorial species o Central American termites, Nasutitermes corniger . Forty-nine termite pairs were randomly selected; bothmembers o each o these pairs were rom the same colony. Fity-ive additionaltermite pairs were randomly selected; the two members in each o these pairs were rom di erent colonies. The pairs were placed in petri dishes and observedto see whether they exhibited aggressive behavior. The results are shown in thetable below.
agg Nongg tol
sm olony 40 (33.5) 9 (15.5) 49
Dffn olon 31 (37.5) 24 (17.5) 55
tol 71 33 104
A Chi-square test or homogeneity was conducted, resulting in χ
2
= 7.638. Theexpected counts are shown in parentheses in the table. Which o the ollowingsets o statements ollows rom these results?
( a ) χ 2 is not signiicant at the 0.05 level.( b ) χ 2 is signiicant, 0.01 < p < 0.05; the counts in the table suggest that termite
pairs rom the same colony are less likely to be aggressive than termite pairsrom dierent colonies.
( c ) χ 2 is signiicant, 0.01 < p < 0.05; the counts in the table suggest that termitepairs rom dierent colonies are less likely to be aggressive than termitepairs rom the same colony.
( d ) χ 2 is signiicant, p < 0.01; the counts in the table suggest that termite pairsrom the same colony are less likely to be aggressive than termite pairs rom
dierent colonies.( e ) χ 2 is signiicant, p < 0.01; the counts in the table suggest that termite pairs
rom dierent colonies are less likely to be aggressive than termite pairsrom the same colony.
14. Consider n pairs o numbers ( x 1, y
1 ), ( x
2, y
2 ), . . . , and ( x
n, y
n ). The mean and
standard deviation o the x -values are x = 5 and s x
= 4, respectively. The meanand standard deviation o the y -values are y = 10 and s
y = 10, respectively. O the
ollowing, which could be the least squares regression line?
( a ) ˆ y = -5.0 + 3.0 x
( b ) ˆ y = 3.0 x
( c ) ˆ y = 5.0 + 2.5 x ( d ) ˆ y = 8.5 + 0.3 x
( e ) ˆ y = 10.0 + 0.4 x

7/15/2019 Statistics
http://slidepdf.com/reader/full/statistics-5632806504049 32/45
2
Sample Questions for Statstcs
© 2008 Te Cege Bar. A rgts reserve. Vst te Cege Bar te Web: www.cegebar.c.
15. The mayor o a large city will run or governor i he believes that more than 30percent o the voters in the state already support him. He will have a survey irmask a random sample o n voters whether or not they support him. He will use a large sample test or proportions to test the null hypothesis that the proportiono all voters who support him is 30 percent or less against the alternative that thepercentage is higher than 30 percent. Suppose that 35 percent o all voters in thestate actually support him. In which o the ollowing situations would the power or this test be highest?
( a ) The mayor uses a signiicance level o 0.01 and n = 250 voters.( b ) The mayor uses a signiicance level o 0.01 and n = 500 voters.( c ) The mayor uses a signiicance level o 0.01 and n = 1,000 voters.( d ) The mayor uses a signiicance level o 0.05 and n = 500 voters.( e ) The mayor uses a signiicance level o 0.05 and n = 1,000 voters.
16. George and Michelle each claimed to have the better recipe or chocolate chip
cookies. They decided to conduct a study to determine whose cookies werereally better. They each baked a batch o cookies using their own recipe. Georgeasked a random sample o his riends to taste his cookies and to complete a questionnaire on their quality. Michelle asked a random sample o her riendsto complete the same questionnaire or her cookies. They then compared theresults. Which o the ollowing statements about this study is alse?
( a ) Because George and Michelle have a di erent population o riends, their sampling procedure makes it diicult to compare the recipes.
( b ) Because George and Michelle each used only their own respective recipes,their cooking ability is conounded with the recipe quality.
( c ) Because George and Michelle each used only the ovens in their houses, the
recipe quality is conounded with the characteristics o the oven.( d ) Because George and Michelle used the same questionnaire, their results willgeneralize to the combined population o their riends.
( e ) Because George and Michelle each baked one batch, there is no replicationo the cookie recipes.
17. A large company is considering opening a ranchise in St. Louis and wants toestimate the mean household income or the area using a simple random sampleo households. Based on inormation rom a pilot study, the company assumesthat the standard deviation o household incomes is σ = $7,200. O the ollowing, which is the least number o households that should be surveyed to obtainan estimate that is within $200 o the true mean household income with
95 percent conidence?( a ) 1,375( b ) 1,300( c ) 5,200( d ) 5,500( e ) 7,700
7/15/2019 Statistics
http://slidepdf.com/reader/full/statistics-5632806504049 33/45
2
Sample Questions for Statstcs
© 2008 Te Cege Bar. A rgts reserve. Vst te Cege Bar te Web: www.cegebar.c.
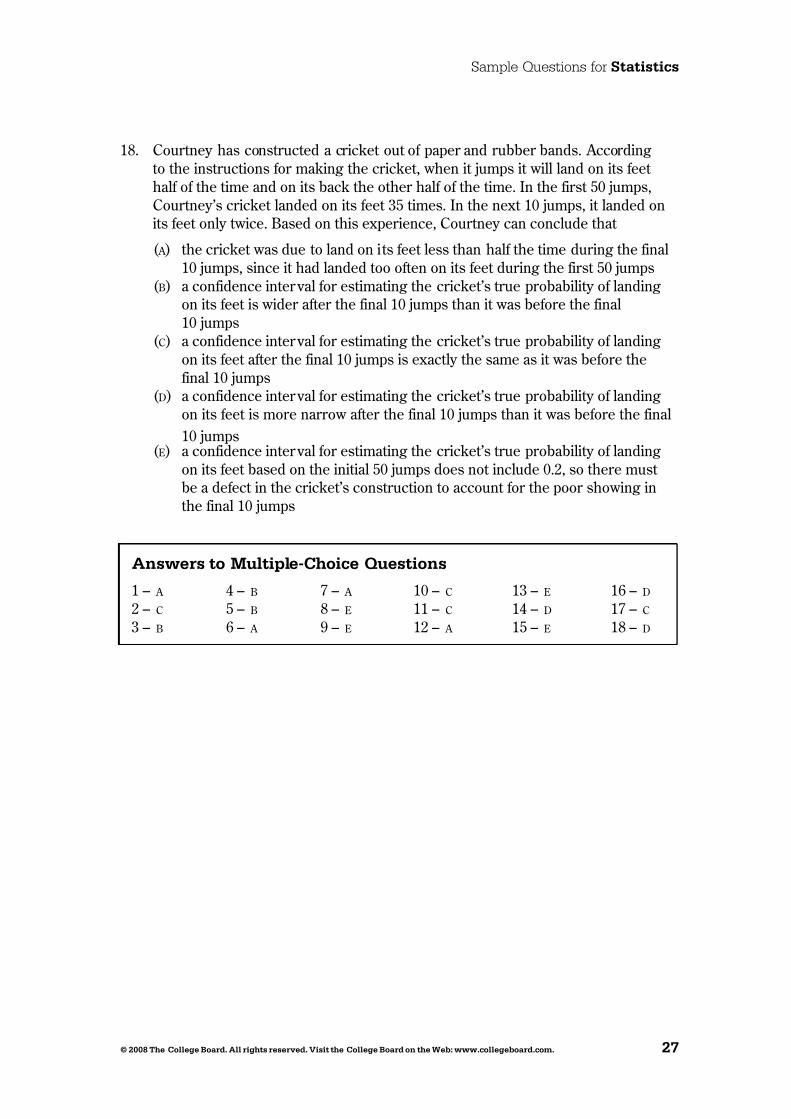
18. Courtney has constructed a cricket out o paper and rubber bands. Accordingto the instructions or making the cricket, when it jumps it will land on its eet hal o the time and on its back the other hal o the time. In the irst 50 jumps,Courtney’s cricket landed on its eet 35 times. In the next 10 jumps, it landed onits eet only twice. Based on this experience, Courtney can conclude that
( a ) the cricket was due to land on its eet less than hal the time during the inal10 jumps, since it had landed too oten on its eet during the irst 50 jumps
( b ) a conidence interval or estimating the cricket’s true probability o landingon its eet is wider ater the inal 10 jumps than it was beore the inal10 jumps
( c ) a conidence interval or estimating the cricket’s true probability o landingon its eet ater the inal 10 jumps is exactly the same as it was beore theinal 10 jumps
( d ) a conidence interval or estimating the cricket’s true probability o landingon its eet is more narrow ater the inal 10 jumps than it was beore the inal
10 jumps( e ) a conidence interval or estimating the cricket’s true probability o landing
on its eet based on the initial 50 jumps does not include 0.2, so there must be a deect in the cricket’s construction to account or the poor showing inthe inal 10 jumps
Aswers t mtpe-Cce Qests
1 – a 4 – b 7 – a 10 – c 13 – e 16 – d
2 – c 5 – b 8 – e 11 – c 14 – d 17 – c
3 – b 6 – a 9 – e 12 – a 15 – e 18 – d
7/15/2019 Statistics
http://slidepdf.com/reader/full/statistics-5632806504049 34/45
28
Sample Questions for Statstcs
© 2008 Te Cege Bar. A rgts reserve. Vst te Cege Bar te Web: www.cegebar.c.
Free-Respse Qests
In the ree-response section o the AP Statistics Exam, students are asked to answer ve questions and complete an investigative task. Each question is designed to be
answered in approximately 12 minutes. The longer investigative task is designed tobe answered in approximately 30 minutes.
Statistics is a discipline in which clear and complete communication is an essentialskill. The ree-response questions on the AP Statistics Exam require students to usetheir analytical, organizational, and communication skills to ormulate cogent answers and provide students with an opportunity to:
• Relate two or more dierent content areas (i.e., exploratory data analysis,experimental design and sampling, probability, and statistical inerence)as they ormulate a complete response or solution to a statistics or probability problem.
• Demonstrate their mastery o statistics in a response ormat that permits thestudents to determine how they will organize and present each response.
The purpose o the investigative task is not only to evaluate the student’sunderstanding in several content areas but also to assess his or her ability tointegrate statistical ideas and apply them in a new context or in a nonroutine way.
Scrg f Free-Respse Qests
The evaluation o student responses on the ree-response section o the AP StatisticsExam refects the dual importance o statistical knowledge and good communication. The ree-response questions and the investigative task are scored “holistically”; that is, each question’s response is evaluated as “a complete package.” With holistic
scoring, ater reading through the details o a student’s response, the scorer makes a judgment about the overall quality o the response. This is dierent rom “analytic”scoring, where the individual components to be evaluated in a student’s response arespecied in advance, and each component is given a value counting toward the overallscore.
Holistic scoring is well suited or questions where the student is required tosynthesize inormation and respond at least partially in written paragraphs, and or questions that could potentially generate multiple and diverse, but equally correct,responses. For example, an open-ended question may present data rom a real-liestudy and ask the student not only to analyze the data but also to comment on how the study’s protocol might be improved. Comments on improving the protocol might ocus on improving the sampling method, controlling conounding variables, or seeking more power by increasing the sample size. In this context, holistic scoringrepresents a recognition not only o the existence o multiple reasonable approachesto a statistical analysis, but a realization o the existence o a statistical synergy—i.e., that a quality student response is more than just the sum o its parts.

7/15/2019 Statistics
http://slidepdf.com/reader/full/statistics-5632806504049 35/45
2
Sample Questions for Statstcs
© 2008 Te Cege Bar. A rgts reserve. Vst te Cege Bar te Web: www.cegebar.c.
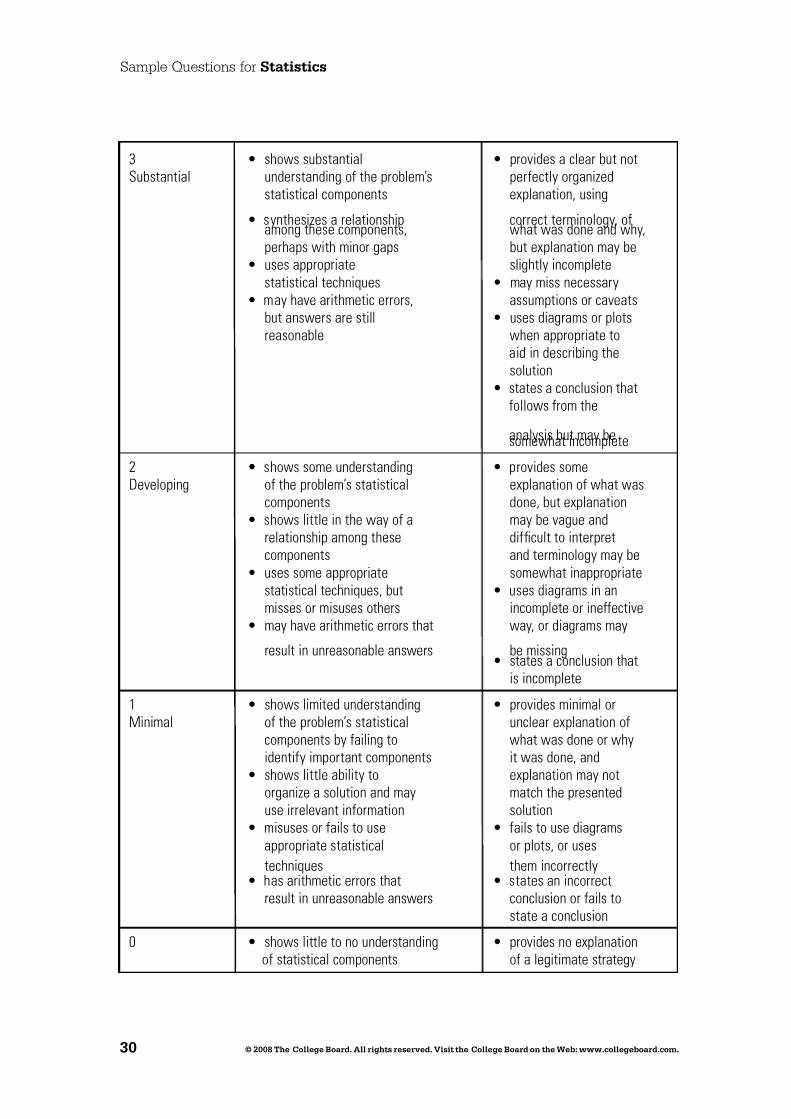
The AP Statistics scoring guideline (rubric) or each ree-response question hasve categories, numerically scored on a 0 to 4 scale. Each o these categoriesrepresents a level o quality in the student response. These levels o quality aredened on two dimensions: statistical knowledge and communication. The specicrubrics or each question are tied to a general template, which represents thedescriptions o the quality levels as envisioned by the Development Committee. Thisgeneral template is given in the ollowing table, “A Guide to Scoring Free-ResponseStatistics Questions.”
A GUIDE TO SCORING FREE-RESPONSE STATISTICS QUESTIONS:
THE CATEGORY DESCRIPTORS
Score Statistical Knowledge CommunicationDescriptors
Identifcationotheimportant Explanationowhatwas
componentsotheproblem doneandwhy,along
Demonstrationothestatistical withastatemento
conceptsandtechniquesthat conclusionsdrawnin
resultinacorrectsolutiono context
theproblem
4 • showscomplete • providesaclear,
Complete understandingotheproblem’s organized,andcomplete
statisticalcomponents explanation,using
• synthesizesacorrect correctterminology,o
relationshipamongthese whatwasdoneandwhy
components,perhapswith • statesappropriate noveltyandcreativity assumptionsandcaveats
• usesappropriateand • usesdiagramsorplots
correctlyexecuted whenappropriateto
statisticaltechniques aidindescribingthe
• Mayhaveminorarithmetic solution
errors,butanswersare • statesanappropriateand
stillreasonable completeconclusionin
context
7/15/2019 Statistics
http://slidepdf.com/reader/full/statistics-5632806504049 36/45
0
Sample Questions for Statstcs
© 2008 Te Cege Bar. A rgts reserve. Vst te Cege Bar te Web: www.cegebar.c.
3 • showssubstantial • providesaclearbutnot
Substantial understandingotheproblem’s perectlyorganized
statisticalcomponents explanation,using
• synthesizesarelationship correctterminology,o amongthesecomponents, whatwasdoneandwhy,
perhapswithminorgaps butexplanationmaybe
• usesappropriate slightlyincomplete
statisticaltechniques • maymissnecessary
• mayhavearithmeticerrors, assumptionsorcaveats
butanswersarestill • usesdiagramsorplots
reasonable whenappropriateto
aidindescribingthe
solution
• statesaconclusionthat
ollowsromthe
analysisbutmaybesomewhatincomplete
2 • showssomeunderstanding • providessome
Developing otheproblem’sstatistical explanationowhatwas
components done,butexplanation
• showslittleinthewayoa maybevagueand
relationshipamongthese difculttointerpret
components andterminologymaybe
• usessomeappropriate somewhatinappropriate
statisticaltechniques,but • usesdiagramsinan
missesormisusesothers incompleteorineective
• mayhavearithmeticerrorsthat way,ordiagramsmay
resultinunreasonableanswers bemissing • statesaconclusionthat
isincomplete
1 • showslimitedunderstanding • providesminimalor
Minimal otheproblem’sstatistical unclearexplanationo
componentsbyailingto whatwasdoneorwhy
identiyimportantcomponents itwasdone,and
• showslittleabilityto explanationmaynot
organizeasolutionandmay matchthepresented
useirrelevantinormation solution
• misusesorailstouse • ailstousediagrams
appropriatestatistical orplots,oruses
techniques themincorrectly • hasarithmeticerrorsthat • statesanincorrect
resultinunreasonableanswers conclusionorailsto
stateaconclusion
0 • showslittletonounderstanding • providesnoexplanation
ostatisticalcomponents oalegitimatestrategy
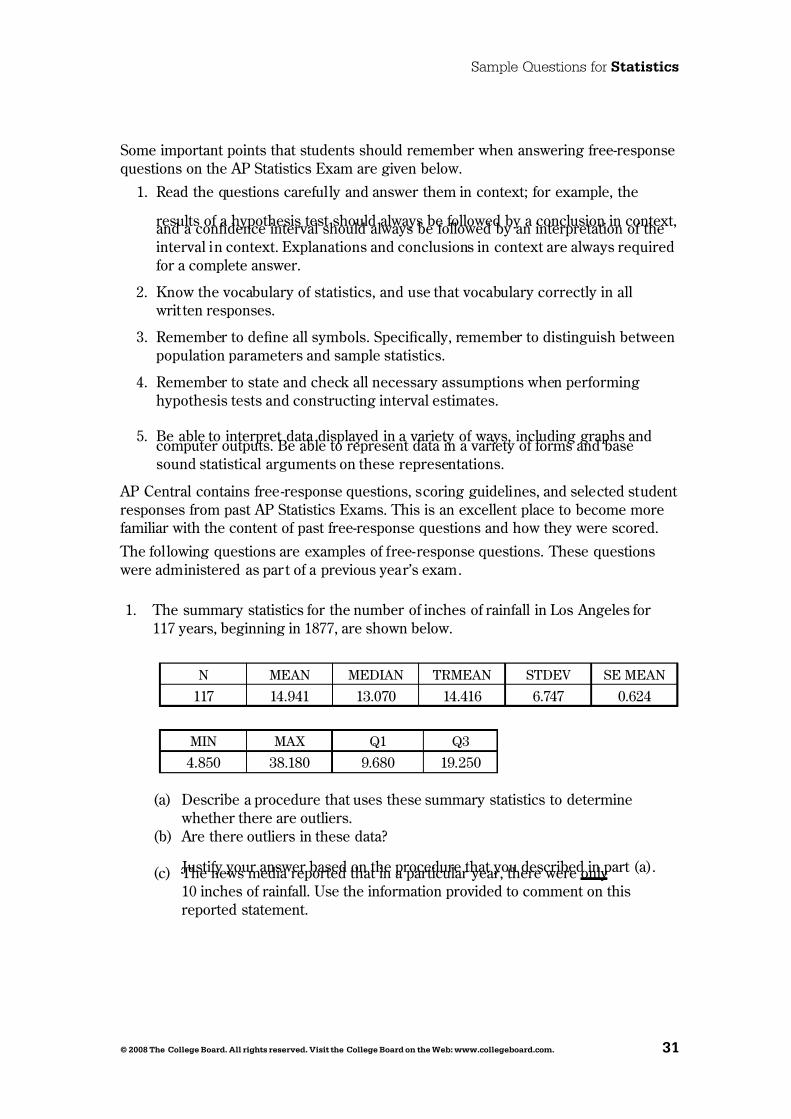
7/15/2019 Statistics
http://slidepdf.com/reader/full/statistics-5632806504049 37/45
Sample Questions for Statstcs
© 2008 Te Cege Bar. A rgts reserve. Vst te Cege Bar te Web: www.cegebar.c.
Some important points that students should remember when answering ree-responsequestions on the AP Statistics Exam are given below.
1. Read the questions careully and answer them in context; or example, the
results o a hypothesis test should always be ollowed by a conclusion in context,and a condence interval should always be ollowed by an interpretation o theinterval in context. Explanations and conclusions in context are always requiredor a complete answer.
2. Know the vocabulary o statistics, and use that vocabulary correctly in all writ ten responses.
3. Remember to dene all symbols. Specically, remember to distinguish betweenpopulation parameters and sample statistics.
4. Remember to state and check all necessary assumptions when perorminghypothesis tests and constructing interval estimates.
5. Be able to interpret data displayed in a variety o ways, including graphs andcomputer outputs. Be able to represent data in a variety o orms and basesound statistical arguments on these representations.
AP Central contains ree-response questions, scoring guidelines, and selected student responses rom past AP Statistics Exams. This is an excellent place to become moreamiliar with the content o past ree-response questions and how they were scored.
The ollowing questions are examples o ree-response questions. These questions were administered as part o a previous year’s exam.
1. The summary statistics or the number o inches o rainall in Los Angeles or 117 years, beginning in 1877, are shown below.
N MeaN MeDiaN trMeaN stDev se MeaN
117 14.941 13.070 14.416 6.747 0.624
MiN MaX Q1 Q3
4.850 38.180 9.680 19.250
(a) Describe a procedure that uses these summary statistics to determine whether there are outliers.
(b) Are there outliers in these data?
Justiy your answer based on the procedure that you described in part (a).( c ) The news media reported that in a particular year, there were only 10 inches o rainall. Use the inormation provided to comment on thisreported statement.

7/15/2019 Statistics
http://slidepdf.com/reader/full/statistics-5632806504049 38/45
2
Sample Questions for Statstcs
© 2008 Te Cege Bar. A rgts reserve. Vst te Cege Bar te Web: www.cegebar.c.
2. A department supervisor is considering purchasing one o two comparablephotocopy machines, A or B . Machine A costs $10,000 and machine B costs$10,500. This department replaces photocopy machines every three years. Therepair contract or machine A costs $50 per month and covers an unlimitednumber o repairs. The repair contract or machine B costs $200 per repair. Basedon past perormance, the distribution o the number o repairs needed over any one-year period or machine B is shown below.
Numb of r 0 1 2 3
pobbly 0.50 0.25 0.15 0.10
You are asked to give a recommendation based on overall cost as to whichmachine, A or B , along with its repair contract, should be purchased. What would your recommendation be? Give a statistical justiication to support your recommendation.
3. Every Monday a local radio station gives coupons away to 50 people whocorrectly answer a question about a news act rom the previous day’s newspaper. The coupons given away are numbered rom 1 to 50, with the irst personreceiving coupon 1, the second person receiving coupon 2, and so on, until all 50coupons are given away. On the ollowing Saturday, the radio station randomly draws numbers rom 1 to 50 and awards cash prizes to the holders o the coupons with these numbers. Numbers continue to be drawn without replacement untilthe total amount awarded irst equals or exceeds $300. I selected, coupons1 through 5 each have a cash value o $200, coupons 6 through 20 each have a cash value o $100, and coupons 21 through 50 each have a cash value o $50.
(a) Explain how you would conduct a simulation using the random number tableprovided below to estimate the distribution o the number o prize winnerseach week.
(b) Perorm your simulation three times. (That is, run three trials o your simulation.) Start at the letmost digit in the irst row o the table and moveacross. Make your procedure clear so that someone can ollow what youdid. You must do this by marking directly on or above the table. Report thenumber o winners in each o your three trials.
72749 13347 65030 26128 49067 02904 49953 74674 94617 13317
81638 36566 42709 33717 59943 12027 46547 61303 46699 76423
38449 46438 91579 01907 72146 05764 22400 94490 49833 09258

7/15/2019 Statistics
http://slidepdf.com/reader/full/statistics-5632806504049 39/45
Sample Questions for Statstcs
© 2008 Te Cege Bar. A rgts reserve. Vst te Cege Bar te Web: www.cegebar.c.
4. Students are designing an experiment to compare the productivity o two varietieso dwar ruit trees. The site or the experiment is a ield that is bordered by a densely orested area on the west (let) side. The ield has been divided intoeight plots o approximately the same area. The students have decided that thetest plots should be blocked. Four trees, two o each o the two varieties, will beassigned at random to the our plots within each block, with one tree planted ineach plot.
The two blocking schemes shown below are under consideration.For each scheme, one block is indicated by the white region and the other blockis indicated by the gray region in the igures.
( a ) Which o the blocking schemes, A or B, is better or this experiment? Explain your answer.
( b ) Even though the students have decided to block, they must randomly assignthe varieties o trees to the plots within each block. What is the purpose o this randomization in the context o this experiment?
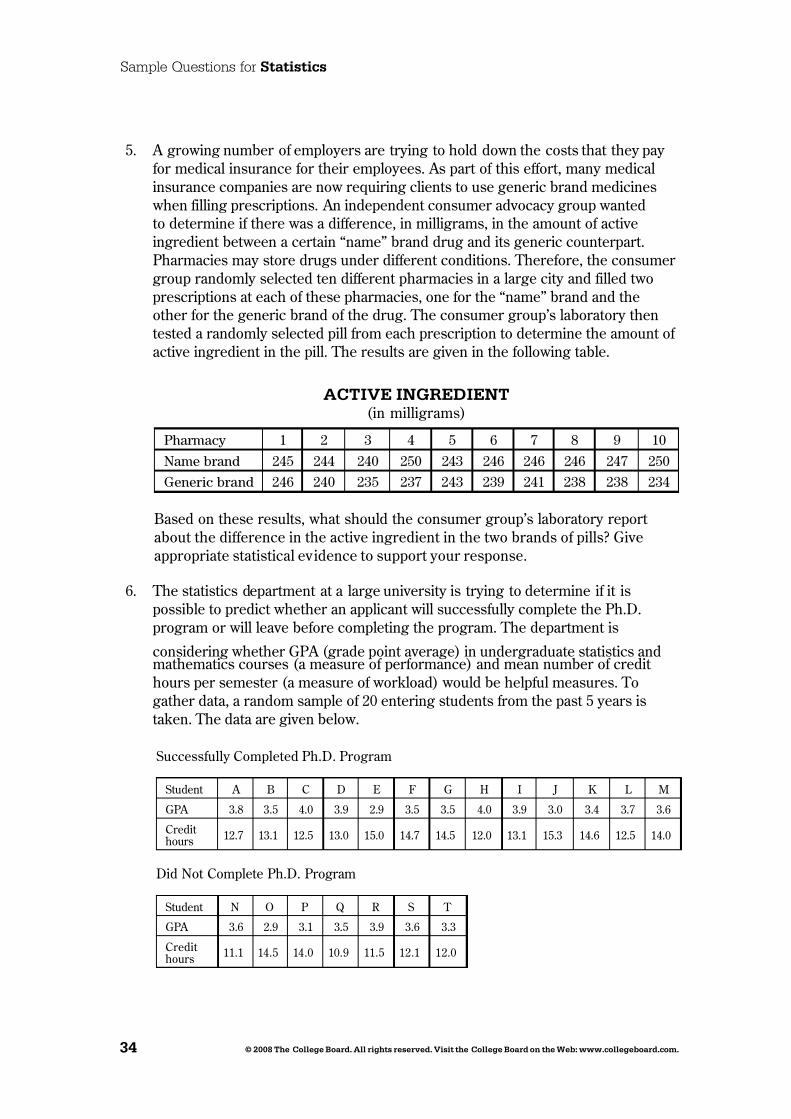
7/15/2019 Statistics
http://slidepdf.com/reader/full/statistics-5632806504049 40/45
Sample Questions for Statstcs
© 2008 Te Cege Bar. A rgts reserve. Vst te Cege Bar te Web: www.cegebar.c.
5. A growing number o employers are trying to hold down the costs that they pay or medical insurance or their employees. As part o this eort, many medicalinsurance companies are now requiring clients to use generic brand medicines when illing prescriptions. An independent consumer advocacy group wantedto determine i there was a dierence, in milligrams, in the amount o activeingredient between a certain “name” brand drug and its generic counterpart.Pharmacies may store drugs under dierent conditions. Thereore, the consumer group randomly selected ten dierent pharmacies in a large city and illed twoprescriptions at each o these pharmacies, one or the “name” brand and theother or the generic brand o the drug. The consumer group’s laboratory thentested a randomly selected pill rom each prescription to determine the amount o active ingredient in the pill. The results are given in the ollowing table.
ACTIVE InGREdIEnT(in milligrams)
phmy 1 2 3 4 5 6 7 8 9 10
Nm bnd 245 244 240 250 243 246 246 246 247 250
Gn bnd 246 240 235 237 243 239 241 238 238 234
Based on these results, what should the consumer group’s laboratory report about the dierence in the active ingredient in the two brands o pills? Giveappropriate statistical evidence to support your response.
6. The statistics department at a large university is trying to determine i it ispossible to predict whether an applicant will successully complete the Ph.D.program or will leave beore completing the program. The department is
considering whether GPA (grade point average) in undergraduate statistics andmathematics courses (a measure o perormance) and mean number o credit hours per semester (a measure o workload) would be helpul measures. Togather data, a random sample o 20 entering students rom the past 5 years istaken. The data are given below.
Successully Completed Ph.D. Program
Student A B C D E F G H I J K L M
GPA 3.8 3.5 4.0 3.9 2.9 3.5 3.5 4.0 3.9 3.0 3.4 3.7 3.6
Credit hours
12.7 13.1 12.5 13.0 15.0 14.7 14.5 12.0 13.1 15.3 14.6 12.5 14.0
Did Not Complete Ph.D. Program
Student N O P Q R S T
GPA 3.6 2.9 3.1 3.5 3.9 3.6 3.3
Credit hours
11.1 14.5 14.0 10.9 11.5 12.1 12.0

7/15/2019 Statistics
http://slidepdf.com/reader/full/statistics-5632806504049 41/45
Sample Questions for Statstcs
© 2008 Te Cege Bar. A rgts reserve. Vst te Cege Bar te Web: www.cegebar.c.
The regression output below resulted rom tting a line to the data in eachgroup. The residual plots (not shown) indicated no unusual patterns, and theassumptions necessary or inerence were judged to be reasonable.
Successully Completed Ph.D. Program
Predictor Coe StDev T PConstant 23.514 1.684 13.95 0.000GPA –2.7555 0.4668 –5.90 0.000S = 0.5658 R-Sq = 76.0%
Did Not Complete Ph.D. Program
Predictor Coe StDev T PConstant 24.200 3.474 6.97 0.001GPA –3.485 1.013 –3.44 0.018S = 0.8408 R-Sq = 70.3%
( a ) Use an appropriate graphical display to compare the GPA’s or the twogroups. Write a ew sentences commenting on your display.
( b ) For the students who successully completed the Ph.D. program, is there a signiicant relationship between GPA and mean number o credit hours per semester? Give a statistical justiication to support your response.
( c ) I a new applicant has a GPA o 3.5 and a mean number o credit hours per semester o 14.0, do you think this applicant will successully complete thePh.D. program? Give a statistical justiication to support your response.

7/15/2019 Statistics
http://slidepdf.com/reader/full/statistics-5632806504049 42/45

7/15/2019 Statistics
http://slidepdf.com/reader/full/statistics-5632806504049 43/45
© 2008 Te Cege Bar. A rgts reserve. Vst te Cege Bar te Web: www.cegebar.c.
Teacher Support
AP Cetra® (apcetra.cegebar.c)
You can nd the ollowing Web resources at AP Central ( ree registration required):
• AP Course Descriptions, AP Exam questions and scoring guidelines, samplesyllabi, and eature articles.
• A searchable Institutes and Workshops database, providing inormat ion about proessional development events.
• The Course Home Pages (apcentral.collegeboard.com/coursehomepages), which contain insightul articles, teaching t ips, act ivities, lab ideas, and other course-specic content contributed by colleagues in the AP community.
• Moderated electronic discussion groups (EDGs) or each AP course, provided toacilitate the exchange o ideas and practices.
AP Pbcats a oter Resrces
Free AP resources are available to help students, parents, AP Coordinators, and highschool and college aculty learn more about the AP Program and its courses andexams. Visit apcentral.collegeboard.com/reepubs.
Teacher’s Guides and Course Descriptions may be downloaded ree o chargerom AP Central; printed copies may be purchased through the College Board Store(store.collegeboard.com). Released Exams and other priced AP resources areavailable at the College Board Store.
Teacer’s Ges
For those about to teach an AP course or the rst time, or or experienced APteachers who would like to get some resh ideas or the classroom, the Teacher’s
Guide is an excellent resource. Each Teacher’s Guide contains syllabi developed by high school teachers currently teaching the AP course and college aculty whoteach the equivalent course at colleges and universities. Along with detailed courseoutlines and innovative teaching tips, you’ll also nd extensive lists o suggestedteaching resources.
Crse descrpts
Course Descriptions are available or each AP subject. They provide an outline o each AP course’s content, explain the kinds o skills students are expected todemonstrate in the corresponding introductory college-level course, and describe
the AP Exam. Sample multiple-choice questions with an answer key and sampleree-response questions are included. (The Course Description or AP Computer Science is available in PDF ormat only.)
Reease Eas
Periodically the AP Program releases a complete copy o each exam. In addition toproviding the multiple-choice questions and answers, the publication describes theprocess o scoring the ree-response questions and includes examples o students’actual responses, the scoring standards, and commentary that explains why theresponses received the scores they did.

7/15/2019 Statistics
http://slidepdf.com/reader/full/statistics-5632806504049 44/45
National OfceAdvanced Placement Program45 Columbus AvenueNew York, NY 10023-6992212 713-8066E-mail: [email protected]
AP ServicesP.O. Box 6671Princeton, NJ 08541-6671609 771-7300877 274-6474 (toll ree in the U.S.and Canada)E-mail: [email protected]
AP Canada Ofce2950 Douglas Street, Suite 550Victoria, BC, Canada V8T 4N4250 472-8561800 667-4548 (toll ree in Canada only)E-mail: [email protected]
AP International OfceServing all countries outside the U.S. and Canada
45 Columbus AvenueNew York, NY 10023-6992212 373-8738E-mail: [email protected]
Middle States Regional OfceServing Delaware, District of Columbia, Maryland,
New Jersey, New York, Pennsylvania,
Puerto Rico, and the U.S. Virgin Islands
Two Bala Plaza, Suite 900Bala Cynwyd, PA 19004-1501866 392-3019E-mail: [email protected]
Midwestern Regional OfceServing Illinois, Indiana, Iowa, Kansas,
Michigan, Minnesota, Missouri,
Nebraska, North Dakota, Ohio, South Dakota,West Virginia, and Wisconsin
6111 N. River Road, Suite 550Rosemont, IL 60018-5158866 392-4086E-mail: [email protected]
New England Regional OfceServing Connecticut, Maine, Massachusetts, New
Hampshire, Rhode Island, and Vermont
470 Totten Pond RoadWaltham, MA 02451-1982866 392-4089E-mail: [email protected]
Southern Regional OfceServing Alabama, Florida, Georgia, Kentucky,
Louisiana, Mississippi, North Carolina, South Carolina,
Tennessee, and Virginia
3700 Crestwood Parkway NW, Suite 700Duluth, GA 30096-7155
866 392-4088E-mail: [email protected]
Southwestern Regional OfceServing Arkansas, New Mexico, Oklahoma, and Texas
4330 South MoPac Expressway, Suite 200Austin, TX 78735-6735866 392-3017E-mail: [email protected]
Western Regional OfceServing Alaska, Arizona, California, Colorado, Hawaii,
Idaho, Montana, Nevada, Oregon, Utah, Washington,
and Wyoming 2099 Gateway Place, Suite 550San Jose, CA 95110-1051866 392-4078E-mail: [email protected]
Contact Us
7/15/2019 Statistics
http://slidepdf.com/reader/full/statistics-5632806504049 45/45
2007-08 Developmen Commiee nd Chief Reder
Kenneth Koehler, Iowa State University, Ames, Chair
Kathy Fritz, Plano West Senior High School, Texas
Dorinda Hewit, Diamond Bar High School, California
Chris Olsen, Thomas Jefferson High School, Cedar Rapids, IowaThomas Short, Indiana University of Pennsylvania
Josh Tabor, Canyon del Oro High School, Oro Valley, Arizona
Robert Taylor, Clemson University, South Carolina
Chief Reader: Christine Franklin, University of Georgia, Athens
ETS Consultants: Richard Chilcoat, Jeff Haberstroh, Luis Saldivia
apcentral.collegeboard.com
I.N. 070082359


