Page 1
© 2017 Cengage Learning. May not be scanned, copied or duplicated, or posted to a publicly accessible website, in whole or in part, except for use as permitted in a license distributed with a certain product or service or otherwise on a password-protected website or school-approved learning management system for classroom use.
Statistics for Business and Economics (13e)
Slides by
JohnLoucksSt. Edward’s
University
1
Statistics for Business and Economics (13e)Anderson, Sweeney, Williams, Camm, Cochran
© 2017 Cengage Learning
Slides by John Loucks
St. Edwards University
Page 2
© 2017 Cengage Learning. May not be scanned, copied or duplicated, or posted to a publicly accessible website, in whole or in part, except for use as permitted in a license distributed with a certain product or service or otherwise on a password-protected website or school-approved learning management system for classroom use.
Statistics for Business and Economics (13e)
Chapter 9Hypothesis Testing• Developing Null and Alternative Hypotheses• Type I and Type II Errors• Population Mean: s Known• Population Mean: s Unknown
• Population Proportion
2
Page 3
© 2017 Cengage Learning. May not be scanned, copied or duplicated, or posted to a publicly accessible website, in whole or in part, except for use as permitted in a license distributed with a certain product or service or otherwise on a password-protected website or school-approved learning management system for classroom use.
Statistics for Business and Economics (13e)
Hypothesis Testing• Hypothesis testing can be used to determine whether a statement about the
value of a population parameter should or should not be rejected.
• The null hypothesis, denoted by H0 , is a tentative assumption about a population parameter.
• The alternative hypothesis, denoted by Ha, is the opposite of what is stated in the null hypothesis.
• The hypothesis testing procedure uses data from a sample to test the two competing statements indicated by H0 and Ha.
3
Page 4
© 2017 Cengage Learning. May not be scanned, copied or duplicated, or posted to a publicly accessible website, in whole or in part, except for use as permitted in a license distributed with a certain product or service or otherwise on a password-protected website or school-approved learning management system for classroom use.
Statistics for Business and Economics (13e)
• A research hypothesis is a specific, clear, and testable proposition or predictive statement about the possible outcome of a scientific research study. It is a tentative statement about the relationship between two or more variables and a tentative solution of problem.
• Examples:(1) A medical trial is conducted to test whether or not a new medicine reduces cholesterol by 25%. State the null and alternative hypotheses.
H0 : The drug reduces cholesterol by 25%. p = 0.25
Ha : The drug does not reduce cholesterol by 25%. p ≠ 0.25
(2) We want to test whether the mean GPA of students in American colleges is different from 2.0 (out of 4.0). The null and alternative hypotheses are:
H0: μ = 2.0Ha: μ ≠ 2.0
4
Page 5
© 2017 Cengage Learning. May not be scanned, copied or duplicated, or posted to a publicly accessible website, in whole or in part, except for use as permitted in a license distributed with a certain product or service or otherwise on a password-protected website or school-approved learning management system for classroom use.
Statistics for Business and Economics (13e)
• It is not always obvious how the null and alternative hypotheses should be formulated.
• Care must be taken to structure the hypotheses appropriately so that the test conclusion provides the information the researcher wants.
• The context of the situation is very important in determining how the hypotheses should be stated.
• In some cases it is easier to identify the alternative hypothesis first. In other cases the null is easier.
• Correct hypothesis formulation will take practice.
Developing Null and Alternative Hypotheses
5
Page 6
© 2017 Cengage Learning. May not be scanned, copied or duplicated, or posted to a publicly accessible website, in whole or in part, except for use as permitted in a license distributed with a certain product or service or otherwise on a password-protected website or school-approved learning management system for classroom use.
Statistics for Business and Economics (13e)
Developing Null and Alternative Hypotheses• Alternative Hypothesis as a Research Hypothesis
• Many applications of hypothesis testing involve an attempt to gather evidence in support of a research hypothesis.
• In such cases, it is often best to begin with the alternative hypothesis and make it the conclusion that the researcher hopes to support.
• The conclusion that the research hypothesis is true is made if the sample data provide sufficient evidence to show that the null hypothesis can be rejected.
6
Page 7
© 2017 Cengage Learning. May not be scanned, copied or duplicated, or posted to a publicly accessible website, in whole or in part, except for use as permitted in a license distributed with a certain product or service or otherwise on a password-protected website or school-approved learning management system for classroom use.
Statistics for Business and Economics (13e)
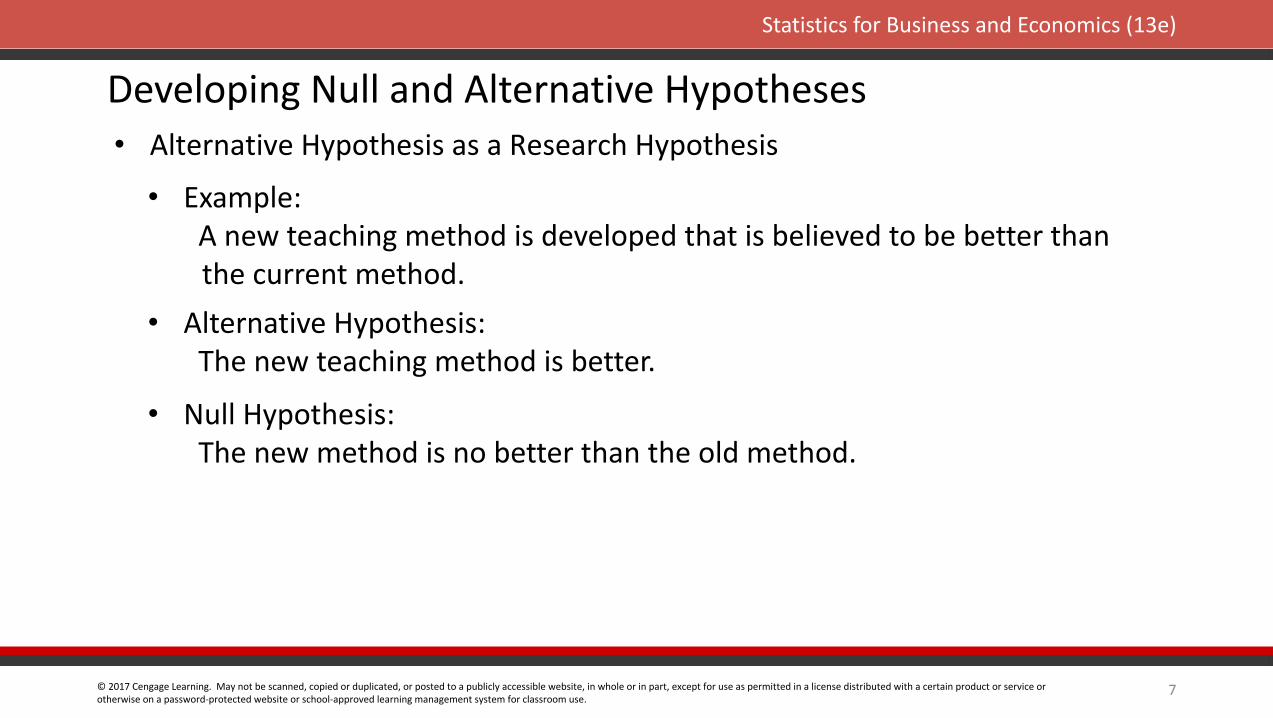
• Alternative Hypothesis as a Research Hypothesis
Developing Null and Alternative Hypotheses
• Example: A new teaching method is developed that is believed to be better than
the current method.• Alternative Hypothesis: The new teaching method is better.
• Null Hypothesis: The new method is no better than the old method.
7
Page 8
© 2017 Cengage Learning. May not be scanned, copied or duplicated, or posted to a publicly accessible website, in whole or in part, except for use as permitted in a license distributed with a certain product or service or otherwise on a password-protected website or school-approved learning management system for classroom use.
Statistics for Business and Economics (13e)
• Alternative Hypothesis as a Research Hypothesis
• Example: A new sales force bonus plan is developed in an attempt to increase
sales.• Alternative Hypothesis: The new bonus plan increase sales.
• Null Hypothesis: The new bonus plan does not increase sales.
8
Developing Null and Alternative Hypotheses
Page 9
© 2017 Cengage Learning. May not be scanned, copied or duplicated, or posted to a publicly accessible website, in whole or in part, except for use as permitted in a license distributed with a certain product or service or otherwise on a password-protected website or school-approved learning management system for classroom use.
Statistics for Business and Economics (13e)
• Alternative Hypothesis as a Research Hypothesis
• Example: A new drug is developed with the goal of lowering blood pressure more
than the existing drug.• Alternative Hypothesis: The new drug lowers blood pressure more than the existing drug.
• Null Hypothesis: The new drug does not lower blood pressure more than the existing
drug.
9
Developing Null and Alternative Hypotheses
Page 10
© 2017 Cengage Learning. May not be scanned, copied or duplicated, or posted to a publicly accessible website, in whole or in part, except for use as permitted in a license distributed with a certain product or service or otherwise on a password-protected website or school-approved learning management system for classroom use.
Statistics for Business and Economics (13e)
• Null Hypothesis as an Assumption to be Challenged• We might begin with a belief or assumption that a statement about the
value of a population parameter is true.• We then using a hypothesis test to challenge the assumption and
determine if there is statistical evidence to conclude that the assumption is incorrect.
• In these situations, it is helpful to develop the null hypothesis first.
10
Developing Null and Alternative Hypotheses
Page 11
© 2017 Cengage Learning. May not be scanned, copied or duplicated, or posted to a publicly accessible website, in whole or in part, except for use as permitted in a license distributed with a certain product or service or otherwise on a password-protected website or school-approved learning management system for classroom use.
Statistics for Business and Economics (13e)
• Example: The label on a soft drink bottle states that it contains 67.6 fluid ounces.
• Null Hypothesis: The label is correct. m > 67.6 ounces.
• Alternative Hypothesis: The label is incorrect. m < 67.6 ounces.
• Null Hypothesis as an Assumption to be Challenged
11
Developing Null and Alternative Hypotheses
Page 12
© 2017 Cengage Learning. May not be scanned, copied or duplicated, or posted to a publicly accessible website, in whole or in part, except for use as permitted in a license distributed with a certain product or service or otherwise on a password-protected website or school-approved learning management system for classroom use.
Statistics for Business and Economics (13e)
One-tailed(lower-tail)
One-tailed(upper-tail)
Two-tailed
Summary of Forms for Null and Alternative Hypotheses about a Population Mean• The equality part of the hypotheses always appears in the null hypothesis.
• In general, a hypothesis test about the value of a population mean m must take one of the following three forms (where m0 is the hypothesized value of the population mean).
12
Page 13
© 2017 Cengage Learning. May not be scanned, copied or duplicated, or posted to a publicly accessible website, in whole or in part, except for use as permitted in a license distributed with a certain product or service or otherwise on a password-protected website or school-approved learning management system for classroom use.
Statistics for Business and Economics (13e)
Null and Alternative Hypotheses• Example: Metro EMS
A major west coast city provides one of the most comprehensive emergency medical services in the world. Operating in a multiple hospital system with approximately 20 mobile medical units, the service goal is to respond to medical emergencies with a mean time of 12 minutes or less.
The director of medical services wants to formulate a hypothesis test that could use a sample of emergency response times to determine whether or not the service goal of 12 minutes or less is being achieved.
13
Page 14
© 2017 Cengage Learning. May not be scanned, copied or duplicated, or posted to a publicly accessible website, in whole or in part, except for use as permitted in a license distributed with a certain product or service or otherwise on a password-protected website or school-approved learning management system for classroom use.
Statistics for Business and Economics (13e)
The emergency service is meeting the response goal; no follow-up action is necessary.
The emergency service is not meeting the response goal; appropriate follow-up action is necessary.
H0: m < 12
Ha: m > 12
where: m = mean response time for the population of medical emergency requests
Null and Alternative Hypotheses
14
Page 15
© 2017 Cengage Learning. May not be scanned, copied or duplicated, or posted to a publicly accessible website, in whole or in part, except for use as permitted in a license distributed with a certain product or service or otherwise on a password-protected website or school-approved learning management system for classroom use.
Statistics for Business and Economics (13e)
15
Page 16
© 2017 Cengage Learning. May not be scanned, copied or duplicated, or posted to a publicly accessible website, in whole or in part, except for use as permitted in a license distributed with a certain product or service or otherwise on a password-protected website or school-approved learning management system for classroom use.
Statistics for Business and Economics (13e)
Type I Error• Because hypothesis tests are based on sample data, we must allow
for the possibility of errors.• A Type I error is rejecting H0 when it is true.
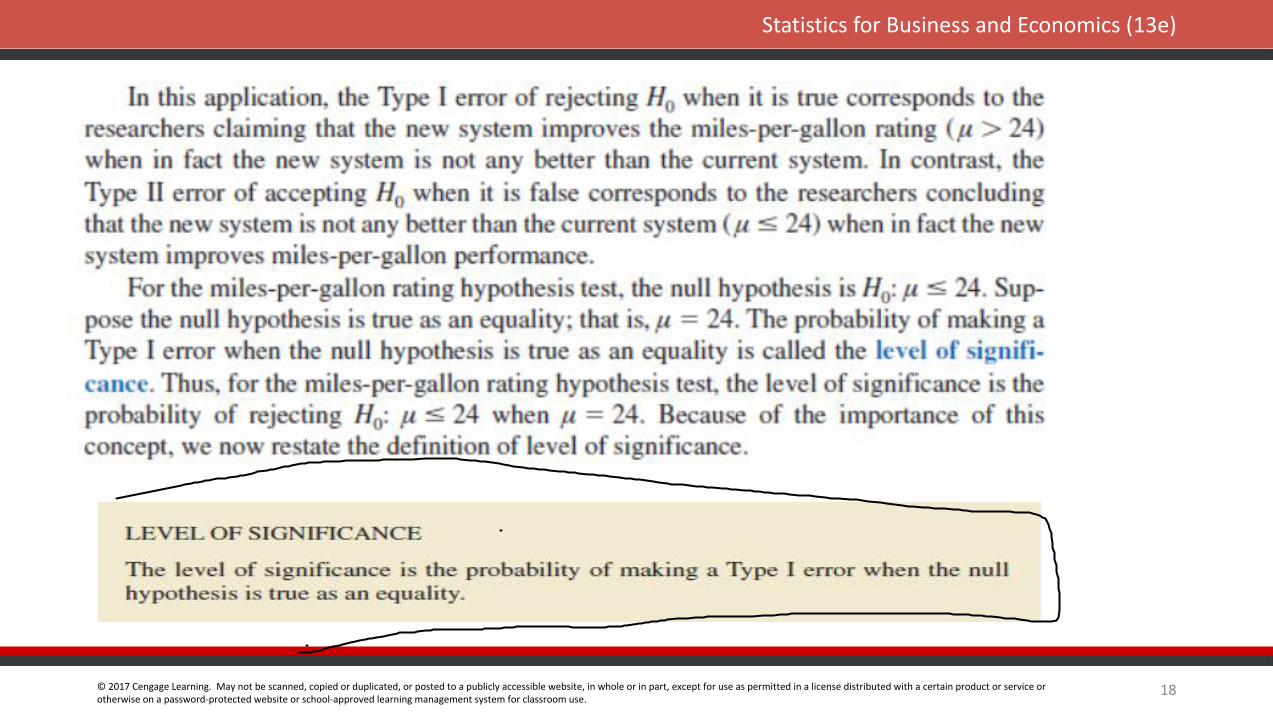
• The probability of making a Type I error when the null hypothesis is true as an equality is called the level of significance.
• Applications of hypothesis testing that only control the Type I error are often called significance tests.
16
Page 17
© 2017 Cengage Learning. May not be scanned, copied or duplicated, or posted to a publicly accessible website, in whole or in part, except for use as permitted in a license distributed with a certain product or service or otherwise on a password-protected website or school-approved learning management system for classroom use.
Statistics for Business and Economics (13e)
Example:• An automobile product research group develop a new fuel injection system designed to
increase the miles-per-gallon rating of a particular automobile. With the current model obtaining an average of 24 miles per gallon, the hypothesis test was formulated as follows:
17
Page 18
© 2017 Cengage Learning. May not be scanned, copied or duplicated, or posted to a publicly accessible website, in whole or in part, except for use as permitted in a license distributed with a certain product or service or otherwise on a password-protected website or school-approved learning management system for classroom use.
Statistics for Business and Economics (13e)
18
Page 19
© 2017 Cengage Learning. May not be scanned, copied or duplicated, or posted to a publicly accessible website, in whole or in part, except for use as permitted in a license distributed with a certain product or service or otherwise on a password-protected website or school-approved learning management system for classroom use.
Statistics for Business and Economics (13e)
Type II Error• A Type II error is accepting H0 when it is false.
• It is difficult to control for the probability of making a Type II error.
• Statisticians avoid the risk of making a Type II error by using “do not reject H0” and not “accept H0”.
19
Page 20
© 2017 Cengage Learning. May not be scanned, copied or duplicated, or posted to a publicly accessible website, in whole or in part, except for use as permitted in a license distributed with a certain product or service or otherwise on a password-protected website or school-approved learning management system for classroom use.
Statistics for Business and Economics (13e)
Type I and Type II Errors
CorrectDecision Type II Error
CorrectDecisionType I Error
Reject H0(Conclude m > 12)
Accept H0(Conclude m < 12)
H0 True(m < 12)
H0 False(m > 12)Conclusion
Population Condition
20
Page 21
© 2017 Cengage Learning. May not be scanned, copied or duplicated, or posted to a publicly accessible website, in whole or in part, except for use as permitted in a license distributed with a certain product or service or otherwise on a password-protected website or school-approved learning management system for classroom use.
Statistics for Business and Economics (13e)
p-Value Approach to One-Tailed Hypothesis Testing
• Reject H0 if the p-value < .
• The p-value is the probability, computed using the test statistic, that measures the support (or lack of support) provided by the sample for the null hypothesis.
• If the p-value is less than or equal to the level of significance , the value of the test statistic is in the rejection region.
21
Page 22
© 2017 Cengage Learning. May not be scanned, copied or duplicated, or posted to a publicly accessible website, in whole or in part, except for use as permitted in a license distributed with a certain product or service or otherwise on a password-protected website or school-approved learning management system for classroom use.
Statistics for Business and Economics (13e)
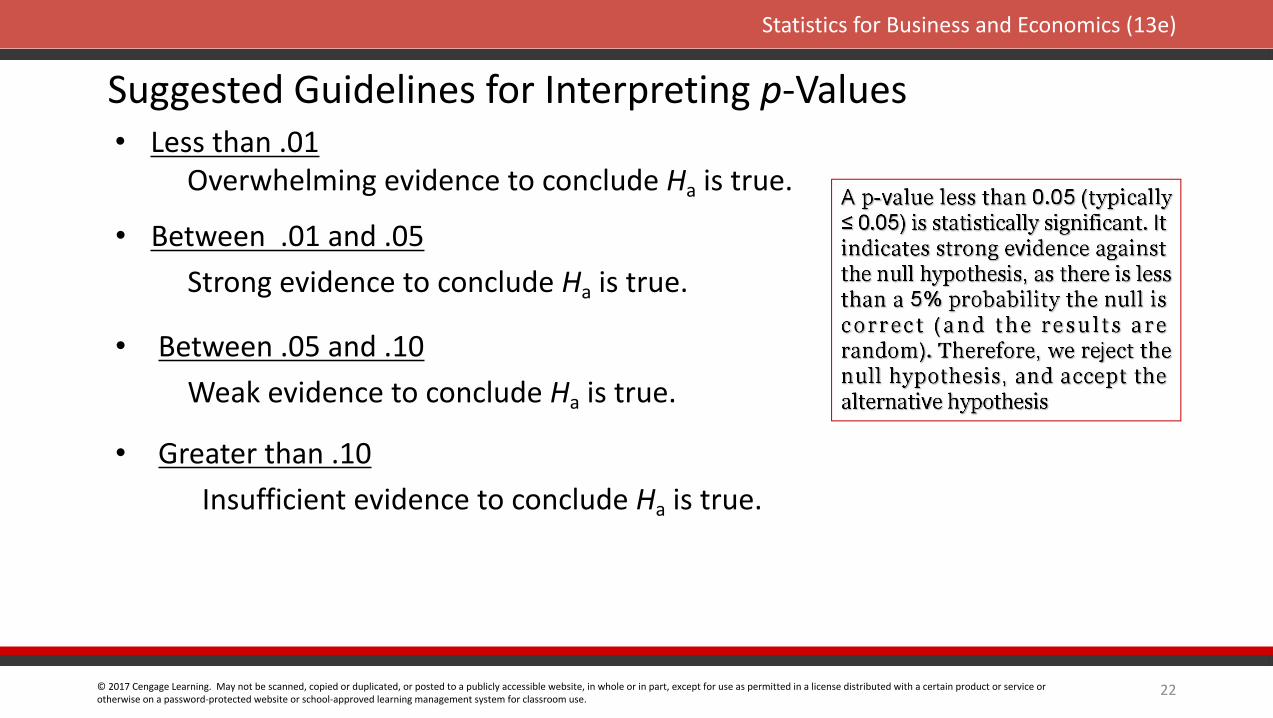
Suggested Guidelines for Interpreting p-Values• Less than .01 Overwhelming evidence to conclude Ha is true.
• Between .01 and .05 Strong evidence to conclude Ha is true.
• Between .05 and .10 Weak evidence to conclude Ha is true.
• Greater than .10 Insufficient evidence to conclude Ha is true.
22
Page 23
© 2017 Cengage Learning. May not be scanned, copied or duplicated, or posted to a publicly accessible website, in whole or in part, except for use as permitted in a license distributed with a certain product or service or otherwise on a password-protected website or school-approved learning management system for classroom use.
Statistics for Business and Economics (13e)
• p-Value Approach
p-value= .0721
0 z = -1.28
= .10
z
z =-1.46
Lower-Tailed Test About a Population Mean: s Known
SamplingDistribution of
23
p-Value < ,so reject H0.
Page 24
© 2017 Cengage Learning. May not be scanned, copied or duplicated, or posted to a publicly accessible website, in whole or in part, except for use as permitted in a license distributed with a certain product or service or otherwise on a password-protected website or school-approved learning management system for classroom use.
Statistics for Business and Economics (13e)
• p-Value Approach
p-Value .011
0 z = 1.75
= .04
z
z =2.29
Upper-Tailed Test About a Population Mean: s Known
SamplingDistribution of
24
(p-Value < ,so reject H0.)
Page 25
© 2017 Cengage Learning. May not be scanned, copied or duplicated, or posted to a publicly accessible website, in whole or in part, except for use as permitted in a license distributed with a certain product or service or otherwise on a password-protected website or school-approved learning management system for classroom use.
Statistics for Business and Economics (13e)
Critical Value Approach to One-Tailed Hypothesis Testing• The test statistic z has a standard normal probability distribution.
• We can use the standard normal probability distribution table to find the z-value with an area of in the lower (or upper) tail of the distribution.
• The value of the test statistic that established the boundary of the rejection region is called the critical value for the test.
• The rejection rule is:• Lower tail: Reject H0 if z < -z• Upper tail: Reject H0 if z > z
25
Page 26
© 2017 Cengage Learning. May not be scanned, copied or duplicated, or posted to a publicly accessible website, in whole or in part, except for use as permitted in a license distributed with a certain product or service or otherwise on a password-protected website or school-approved learning management system for classroom use.
Statistics for Business and Economics (13e)
1
0 -z = -1.28
Reject H0
Do Not Reject H0
z
Lower-Tailed Test About a Population Mean: s Known• Critical Value Approach
SamplingDistribution of
26
Page 27
© 2017 Cengage Learning. May not be scanned, copied or duplicated, or posted to a publicly accessible website, in whole or in part, except for use as permitted in a license distributed with a certain product or service or otherwise on a password-protected website or school-approved learning management system for classroom use.
Statistics for Business and Economics (13e)
.05
0 z = 1.645
Reject H0
Do Not Reject H0
z
Upper-Tailed Test About a Population Mean: s Known• Critical Value Approach
SamplingDistribution of
27
Page 28
© 2017 Cengage Learning. May not be scanned, copied or duplicated, or posted to a publicly accessible website, in whole or in part, except for use as permitted in a license distributed with a certain product or service or otherwise on a password-protected website or school-approved learning management system for classroom use.
Statistics for Business and Economics (13e)
Steps of Hypothesis TestingStep 1. Develop the null and alternative hypotheses.
Step 2. Specify the level of significance .
Step 3. Collect the sample data and compute the value of the test statistic.
p-Value Approach
Step 4. Use the value of the test statistic to compute the p-value.
Step 5. Reject H0 if p-value < .
28
Page 29
© 2017 Cengage Learning. May not be scanned, copied or duplicated, or posted to a publicly accessible website, in whole or in part, except for use as permitted in a license distributed with a certain product or service or otherwise on a password-protected website or school-approved learning management system for classroom use.
Statistics for Business and Economics (13e)
Critical Value Approach
Step 4. Use the level of significance to determine the critical value and the rejection rule.
Step 5. Use the value of the test statistic and the rejection rule to determine whether to reject H0.
Steps of Hypothesis Testing
29
Page 30
© 2017 Cengage Learning. May not be scanned, copied or duplicated, or posted to a publicly accessible website, in whole or in part, except for use as permitted in a license distributed with a certain product or service or otherwise on a password-protected website or school-approved learning management system for classroom use.
Statistics for Business and Economics (13e)
• Example: Metro EMS The response times for a random sample of 40 medical emergencies were tabulated. The sample mean is 13.25 minutes. The population standarddeviation is believed to be 3.2 minutes.
The EMS director wants to perform a hypothesis test, with a .05 level of significance, to determine whether the service goal of 12 minutes or less is being achieved.
One-Tailed Tests About a Population Mean: s Known
30
Page 31
© 2017 Cengage Learning. May not be scanned, copied or duplicated, or posted to a publicly accessible website, in whole or in part, except for use as permitted in a license distributed with a certain product or service or otherwise on a password-protected website or school-approved learning management system for classroom use.
Statistics for Business and Economics (13e)
1. Develop the hypotheses.
2. Specify the level of significance. = .05
H0: m< 12Ha: m > 12
• p -Value and Critical Value Approaches
3. Compute the value of the test statistic.
31
One-Tailed Tests About a Population Mean: s Known
Page 32
© 2017 Cengage Learning. May not be scanned, copied or duplicated, or posted to a publicly accessible website, in whole or in part, except for use as permitted in a license distributed with a certain product or service or otherwise on a password-protected website or school-approved learning management system for classroom use.
Statistics for Business and Economics (13e)
5. Determine whether to reject H0.
• p –Value Approach
4. Compute the p –value.
For z = 2.47, cumulative probability = .9932.
p-value = 1 - .9932 = .0068
Because p-value = .0068 < = .05, we reject H0.
There is sufficient statistical evidenceto infer that Metro EMS is not meeting
the response goal of 12 minutes.
32
One-Tailed Tests About a Population Mean: s Known
Page 33
© 2017 Cengage Learning. May not be scanned, copied or duplicated, or posted to a publicly accessible website, in whole or in part, except for use as permitted in a license distributed with a certain product or service or otherwise on a password-protected website or school-approved learning management system for classroom use.
Statistics for Business and Economics (13e)
• p –Value Approach
p-value
0 z =1.645
= .05
z
z =2.47
SamplingDistribution of
33
One-Tailed Tests About a Population Mean: s Known
(p-Value < ,so reject H0.
Page 34
© 2017 Cengage Learning. May not be scanned, copied or duplicated, or posted to a publicly accessible website, in whole or in part, except for use as permitted in a license distributed with a certain product or service or otherwise on a password-protected website or school-approved learning management system for classroom use.
Statistics for Business and Economics (13e)
5. Determine whether to reject H0.
There is sufficient statistical evidenceto infer that Metro EMS is not meeting
the response goal of 12 minutes.
Because 2.47 > 1.645, we reject H0.
• Critical Value Approach
For = .05, z.05 = 1.645
4. Determine the critical value and rejection rule.
Reject H0 if z > 1.645
34
One-Tailed Tests About a Population Mean: s Known
Page 35
© 2017 Cengage Learning. May not be scanned, copied or duplicated, or posted to a publicly accessible website, in whole or in part, except for use as permitted in a license distributed with a certain product or service or otherwise on a password-protected website or school-approved learning management system for classroom use.
Statistics for Business and Economics (13e)
35
Page 36
© 2017 Cengage Learning. May not be scanned, copied or duplicated, or posted to a publicly accessible website, in whole or in part, except for use as permitted in a license distributed with a certain product or service or otherwise on a password-protected website or school-approved learning management system for classroom use.
Statistics for Business and Economics (13e)
p-Value Approach to Two-Tailed Hypothesis Testing
• The rejection rule: Reject H0 if the p-value < .
• Compute the p-value using the following three steps:
3. Double the tail area obtained in step 2 to obtain the p-value.
2. If z is in the upper tail (z > 0), compute the probability that z is greater than or equal to the value of the test statistic. If z is in the lower tail (z < 0), compute the probability that z is less than or equal to the value of the test statistic.
1. Compute the value of the test statistic z.
36
Page 37
© 2017 Cengage Learning. May not be scanned, copied or duplicated, or posted to a publicly accessible website, in whole or in part, except for use as permitted in a license distributed with a certain product or service or otherwise on a password-protected website or school-approved learning management system for classroom use.
Statistics for Business and Economics (13e)
Critical Value Approach to Two-Tailed Hypothesis Testing• The critical values will occur in both the lower and upper tails of the standard
normal curve.
• The rejection rule is: Reject H0 if z < -z/2 or z > z/2.
• Use the standard normal probability distribution table to find z/2 (the z-value with an area of /2 in the upper tail of the distribution).
37
Page 38
© 2017 Cengage Learning. May not be scanned, copied or duplicated, or posted to a publicly accessible website, in whole or in part, except for use as permitted in a license distributed with a certain product or service or otherwise on a password-protected website or school-approved learning management system for classroom use.
Statistics for Business and Economics (13e)
• Example: Glow Toothpaste
Quality assurance procedures call for the continuation of the filling process if the sample results are consistent with the assumption that the mean filling weight for the population of toothpaste tubes is 6 oz.; otherwise the process will be adjusted.
The production line for Glow toothpaste is designed to fill tubes with a mean weight of 6 oz. Periodically, a sample of 30 tubes will be selected in order to check the filling process.
Two-Tailed Tests About a Population Mean: s Known
38
Page 39
© 2017 Cengage Learning. May not be scanned, copied or duplicated, or posted to a publicly accessible website, in whole or in part, except for use as permitted in a license distributed with a certain product or service or otherwise on a password-protected website or school-approved learning management system for classroom use.
Statistics for Business and Economics (13e)
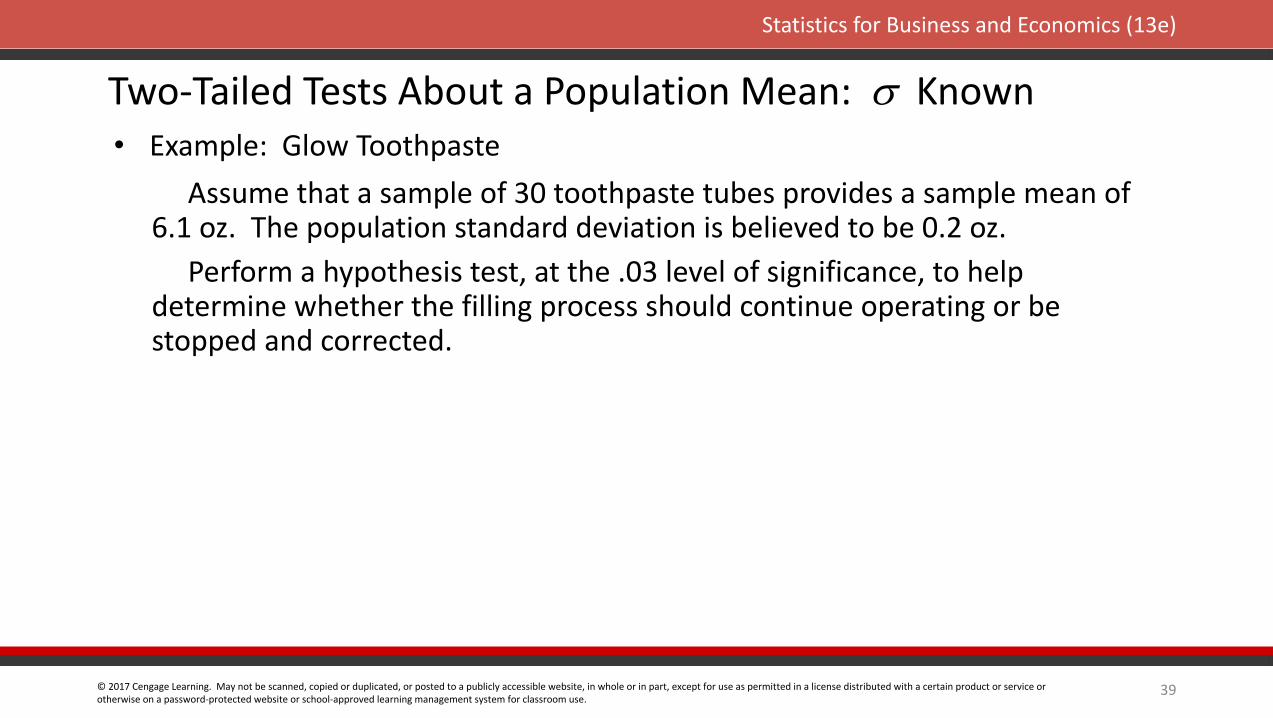
Perform a hypothesis test, at the .03 level of significance, to help determine whether the filling process should continue operating or be stopped and corrected.
Assume that a sample of 30 toothpaste tubes provides a sample mean of 6.1 oz. The population standard deviation is believed to be 0.2 oz.
• Example: Glow Toothpaste
39
Two-Tailed Tests About a Population Mean: s Known
Page 40
© 2017 Cengage Learning. May not be scanned, copied or duplicated, or posted to a publicly accessible website, in whole or in part, except for use as permitted in a license distributed with a certain product or service or otherwise on a password-protected website or school-approved learning management system for classroom use.
Statistics for Business and Economics (13e)
1. Determine the hypotheses.
2. Specify the level of significance.
3. Compute the value of the test statistic.
= .03
• p –Value and Critical Value Approaches
40
Two-Tailed Tests About a Population Mean: s Known
Page 41
© 2017 Cengage Learning. May not be scanned, copied or duplicated, or posted to a publicly accessible website, in whole or in part, except for use as permitted in a license distributed with a certain product or service or otherwise on a password-protected website or school-approved learning management system for classroom use.
Statistics for Business and Economics (13e)
5. Determine whether to reject H0.
• p –Value Approach
4. Compute the p –value.
For z = 2.74, cumulative probability = .9969
p-value = 2(1 - .9969) = .0062
Because p-value = .0062 < = .03, we reject H0.There is sufficient statistical evidence to
infer that the alternative hypothesis is true (i.e. the mean filling weight is not 6 ounces).
41
Two-Tailed Tests About a Population Mean: s Known
Page 42
© 2017 Cengage Learning. May not be scanned, copied or duplicated, or posted to a publicly accessible website, in whole or in part, except for use as permitted in a license distributed with a certain product or service or otherwise on a password-protected website or school-approved learning management system for classroom use.
Statistics for Business and Economics (13e)
/2 = .015
0z/2 = 2.17
z
/2 = .015
• p-Value Approach
-z/2 = -2.17z = 2.74z = -2.74
1/2p-value= .0031
1/2p-value= .0031
42
Two-Tailed Tests About a Population Mean: s Known
Page 43
© 2017 Cengage Learning. May not be scanned, copied or duplicated, or posted to a publicly accessible website, in whole or in part, except for use as permitted in a license distributed with a certain product or service or otherwise on a password-protected website or school-approved learning management system for classroom use.
Statistics for Business and Economics (13e)
• Critical Value Approach
5. Determine whether to reject H0.
There is sufficient statistical evidence toinfer that the alternative hypothesis is true
(i.e. the mean filling weight is not 6 ounces).
Because 2.74 > 2.17, we reject H0.
For /2 = .03/2 = .015, z.015 = 2.17
4. Determine the critical value and rejection rule.
Reject H0 if z < -2.17 or z > 2.17
43
Two-Tailed Tests About a Population Mean: s Known
Page 44
© 2017 Cengage Learning. May not be scanned, copied or duplicated, or posted to a publicly accessible website, in whole or in part, except for use as permitted in a license distributed with a certain product or service or otherwise on a password-protected website or school-approved learning management system for classroom use.
Statistics for Business and Economics (13e)
/2 = .015
0 2.17
Reject H0
Do Not Reject H0
z
Reject H0
-2.17
• Critical Value Approach
/2 = .015
SamplingDistribution of
44
Two-Tailed Tests About a Population Mean: s Known
Page 45
© 2017 Cengage Learning. May not be scanned, copied or duplicated, or posted to a publicly accessible website, in whole or in part, except for use as permitted in a license distributed with a certain product or service or otherwise on a password-protected website or school-approved learning management system for classroom use.
Statistics for Business and Economics (13e)
Confidence Interval Approach toTwo-Tailed Tests About a Population Mean
• If the confidence interval contains the hypothesized value m0, do not reject H0. Otherwise, reject H0. (Actually, H0 should be rejected if m0 happens to be equal to one of the end points of the confidence interval.)
45
Page 46
© 2017 Cengage Learning. May not be scanned, copied or duplicated, or posted to a publicly accessible website, in whole or in part, except for use as permitted in a license distributed with a certain product or service or otherwise on a password-protected website or school-approved learning management system for classroom use.
Statistics for Business and Economics (13e)
46
Page 47
© 2017 Cengage Learning. May not be scanned, copied or duplicated, or posted to a publicly accessible website, in whole or in part, except for use as permitted in a license distributed with a certain product or service or otherwise on a password-protected website or school-approved learning management system for classroom use.
Statistics for Business and Economics (13e)
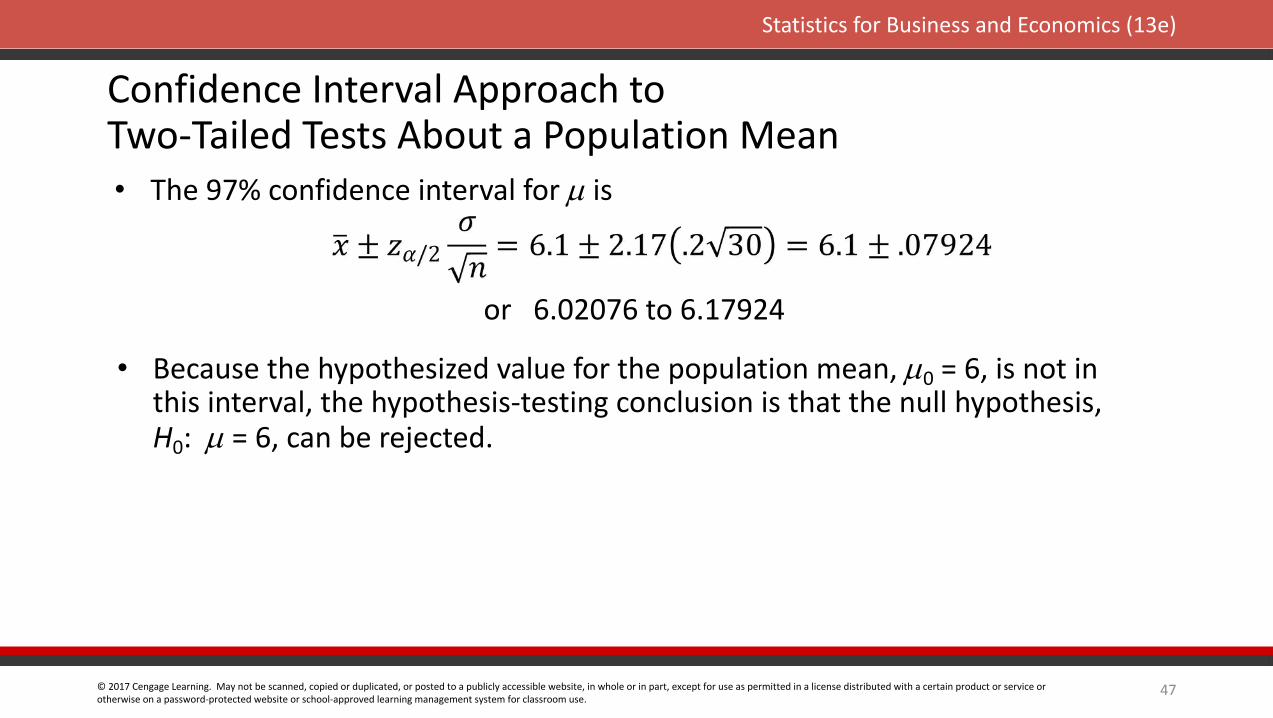
Confidence Interval Approach toTwo-Tailed Tests About a Population Mean• The 97% confidence interval for m is
• Because the hypothesized value for the population mean, m0 = 6, is not in this interval, the hypothesis-testing conclusion is that the null hypothesis, H0: m = 6, can be rejected.
or 6.02076 to 6.17924
47
Page 48
© 2017 Cengage Learning. May not be scanned, copied or duplicated, or posted to a publicly accessible website, in whole or in part, except for use as permitted in a license distributed with a certain product or service or otherwise on a password-protected website or school-approved learning management system for classroom use.
Statistics for Business and Economics (13e)
Tests About a Population Mean: s Unknown• Test Statistic:
• This test statistic has a t distribution with n - 1 degrees of freedom.
48
Page 49
© 2017 Cengage Learning. May not be scanned, copied or duplicated, or posted to a publicly accessible website, in whole or in part, except for use as permitted in a license distributed with a certain product or service or otherwise on a password-protected website or school-approved learning management system for classroom use.
Statistics for Business and Economics (13e)
• Rejection Rule: p -Value Approach
H0: m < m0 Reject H0 if t > t
Reject H0 if t < -t
Reject H0 if t < - t/2 or t > t/2
H0: m > m0
H0: m = m0
• Rejection Rule: Critical Value Approach
Reject H0 if p –value <
49
Tests About a Population Mean: s Unknown
Page 50
© 2017 Cengage Learning. May not be scanned, copied or duplicated, or posted to a publicly accessible website, in whole or in part, except for use as permitted in a license distributed with a certain product or service or otherwise on a password-protected website or school-approved learning management system for classroom use.
Statistics for Business and Economics (13e)
p -Values and the t Distribution • The format of the t distribution table provided in most statistics textbooks does
not have sufficient detail to determine the exact p-value for a hypothesis test.
• However, we can still use the t distribution table to identify a range for the p-value.
• An advantage of computer software packages is that the computer output will provide the p-value for the t distribution.
50
Page 51
© 2017 Cengage Learning. May not be scanned, copied or duplicated, or posted to a publicly accessible website, in whole or in part, except for use as permitted in a license distributed with a certain product or service or otherwise on a password-protected website or school-approved learning management system for classroom use.
Statistics for Business and Economics (13e)
A State Highway Patrol periodically samples vehicle speeds at various locations on a particular roadway. The sample of vehicle speeds is used totest the hypothesis H0: m < 65.
Example: Highway Patrol• One-Tailed Test About a Population Mean: s Unknown
The locations where H0 is rejected are deemed the best locations for radar traps. At Location F, a sample of 64 vehicles shows a mean speed of 66.2 mph with a standard deviation of 4.2 mph. Use a = .05 to test the hypothesis.
51
Page 52
© 2017 Cengage Learning. May not be scanned, copied or duplicated, or posted to a publicly accessible website, in whole or in part, except for use as permitted in a license distributed with a certain product or service or otherwise on a password-protected website or school-approved learning management system for classroom use.
Statistics for Business and Economics (13e)
One-Tailed Test About a Population Mean: s Unknown
1. Determine the hypotheses.
2. Specify the level of significance.
3. Compute the value of the test statistic.
= .05
• p –Value and Critical Value Approaches
H0: m < 65Ha: m > 65
52
Page 53
© 2017 Cengage Learning. May not be scanned, copied or duplicated, or posted to a publicly accessible website, in whole or in part, except for use as permitted in a license distributed with a certain product or service or otherwise on a password-protected website or school-approved learning management system for classroom use.
Statistics for Business and Economics (13e)
• p –Value Approach
5. Determine whether to reject H0.
4. Compute the p –value.
For t = 2.286, the p-value must be less than .025(for t = 1.998) and greater than .01 (for t = 2.387).
.01 < p–value < .025
Because p-value < = .05, we reject H0.We are at least 95% confident that the mean speed of vehicles at Location F is greater than 65 mph.
53
One-Tailed Test About a Population Mean: s Unknown
Page 54
© 2017 Cengage Learning. May not be scanned, copied or duplicated, or posted to a publicly accessible website, in whole or in part, except for use as permitted in a license distributed with a certain product or service or otherwise on a password-protected website or school-approved learning management system for classroom use.
Statistics for Business and Economics (13e)
• Critical Value Approach
5. Determine whether to reject H0.
We are at least 95% confident that the mean speed of vehicles at Location F is greater than 65 mph. Location F is a good candidate for a radar trap.
Because 2.286 > 1.669, we reject H0.
For = .05 and d.f. = 64 – 1 = 63, t.05 = 1.669
4. Determine the critical value and rejection rule.
Reject H0 if t > 1.669
54
One-Tailed Test About a Population Mean: s Unknown
Page 55
© 2017 Cengage Learning. May not be scanned, copied or duplicated, or posted to a publicly accessible website, in whole or in part, except for use as permitted in a license distributed with a certain product or service or otherwise on a password-protected website or school-approved learning management system for classroom use.
Statistics for Business and Economics (13e)
()
0 t =1.669
Reject H0
Do Not Reject H0
t
p-value< .025
t =2.286
55
One-Tailed Test About a Population Mean: s Unknown
(p-Value < ,so reject H0.
Page 56
© 2017 Cengage Learning. May not be scanned, copied or duplicated, or posted to a publicly accessible website, in whole or in part, except for use as permitted in a license distributed with a certain product or service or otherwise on a password-protected website or school-approved learning management system for classroom use.
Statistics for Business and Economics (13e)
• The equality part of the hypotheses always appears in the null hypothesis.
• In general, a hypothesis test about the value of a population proportion p
must take one of the following three forms (where p0 is the hypothesized value of the population proportion).
A Summary of Forms for Null and Alternative Hypotheses About a Population Proportion
One-tailed(lower tail)
One-tailed(upper tail)
Two-tailed
56
Page 57
© 2017 Cengage Learning. May not be scanned, copied or duplicated, or posted to a publicly accessible website, in whole or in part, except for use as permitted in a license distributed with a certain product or service or otherwise on a password-protected website or school-approved learning management system for classroom use.
Statistics for Business and Economics (13e)
• Test Statistic:
Tests About a Population Proportion
where:
assuming np > 5 and n(1 – p) > 5
57
Page 58
© 2017 Cengage Learning. May not be scanned, copied or duplicated, or posted to a publicly accessible website, in whole or in part, except for use as permitted in a license distributed with a certain product or service or otherwise on a password-protected website or school-approved learning management system for classroom use.
Statistics for Business and Economics (13e)
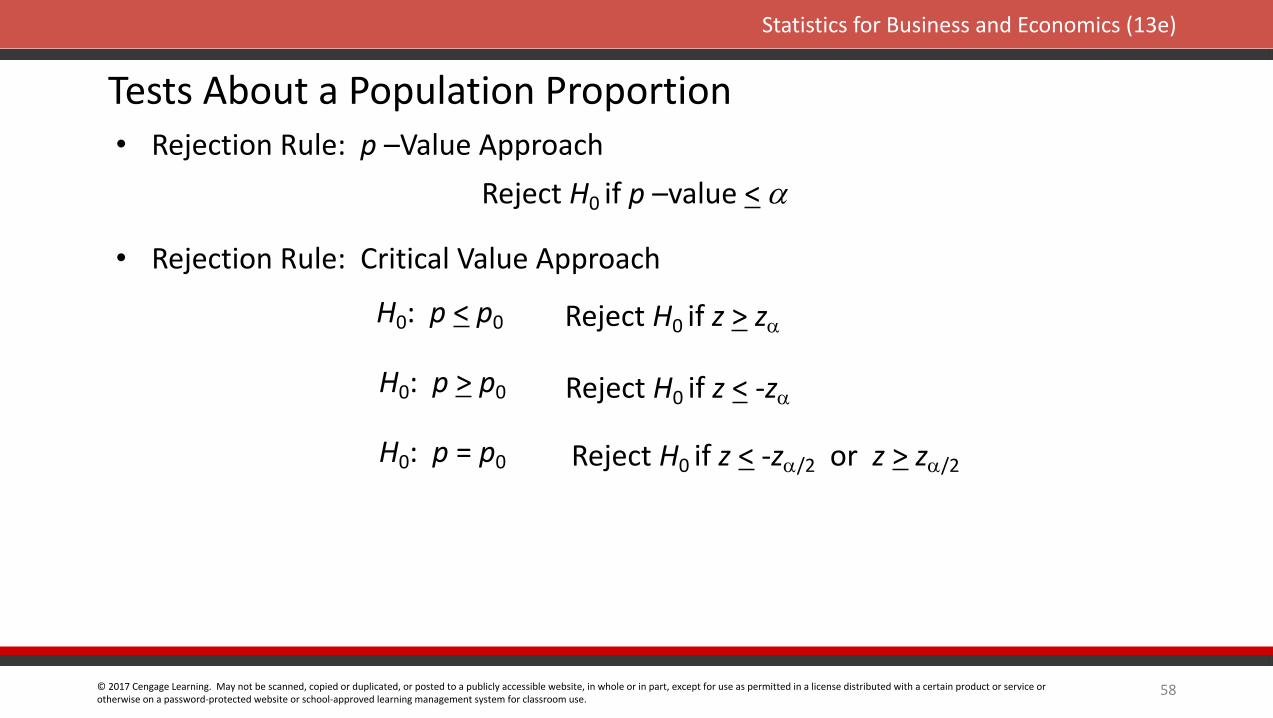
• Rejection Rule: p –Value Approach
H0: p < p0 Reject H0 if z > z
Reject H0 if z < -z
Reject H0 if z < -z/2 or z > z/2
H0: p > p0
H0: p = p0
Reject H0 if p –value <
• Rejection Rule: Critical Value Approach
58
Tests About a Population Proportion
Page 59
© 2017 Cengage Learning. May not be scanned, copied or duplicated, or posted to a publicly accessible website, in whole or in part, except for use as permitted in a license distributed with a certain product or service or otherwise on a password-protected website or school-approved learning management system for classroom use.
Statistics for Business and Economics (13e)
• Example: National Safety Council (NSC) For a Christmas and New Year’s week, the National Safety Council estimated that 500 people would be killed and 25,000 injured on the nation’s roads. The NSC claimed that 50% of the accidents would be caused by drunk driving.
Two-Tailed Test About a Population Proportion
A sample of 120 accidents showed that 67 were caused by drunk driving. Use these data to test the NSC’s claim with a = .05.
59
Page 60
© 2017 Cengage Learning. May not be scanned, copied or duplicated, or posted to a publicly accessible website, in whole or in part, except for use as permitted in a license distributed with a certain product or service or otherwise on a password-protected website or school-approved learning management system for classroom use.
Statistics for Business and Economics (13e)
1. Determine the hypotheses.
2. Specify the level of significance.
3. Compute the value of the test statistic.
= .05
• p –Value and Critical Value Approaches
60
Two-Tailed Test About a Population Proportion
Page 61
© 2017 Cengage Learning. May not be scanned, copied or duplicated, or posted to a publicly accessible website, in whole or in part, except for use as permitted in a license distributed with a certain product or service or otherwise on a password-protected website or school-approved learning management system for classroom use.
Statistics for Business and Economics (13e)
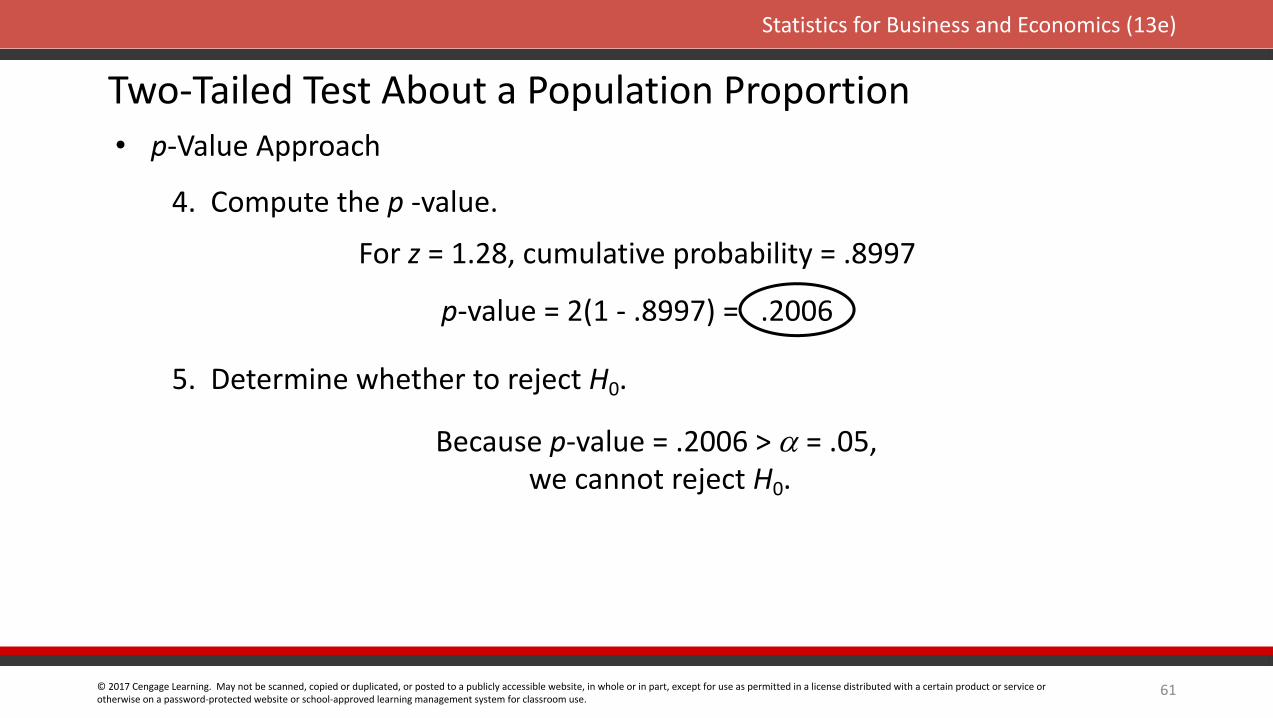
• p-Value Approach
4. Compute the p -value.
5. Determine whether to reject H0.
Because p-value = .2006 > = .05, we cannot reject H0.
For z = 1.28, cumulative probability = .8997
p-value = 2(1 - .8997) = .2006
61
Two-Tailed Test About a Population Proportion
Page 62
© 2017 Cengage Learning. May not be scanned, copied or duplicated, or posted to a publicly accessible website, in whole or in part, except for use as permitted in a license distributed with a certain product or service or otherwise on a password-protected website or school-approved learning management system for classroom use.
Statistics for Business and Economics (13e)
• Critical Value Approach
5. Determine whether to reject H0.
For /2 = .05/2 = .025, z.025 = 1.96
4. Determine the critical values and rejection rule.
Reject H0 if z < -1.96 or z > 1.96
Because 1.278 > -1.96 and < 1.96,we cannot reject H0.
62
Two-Tailed Test About a Population Proportion
Page 63
© 2017 Cengage Learning. May not be scanned, copied or duplicated, or posted to a publicly accessible website, in whole or in part, except for use as permitted in a license distributed with a certain product or service or otherwise on a password-protected website or school-approved learning management system for classroom use.
Statistics for Business and Economics (13e)
63
Page 64
© 2017 Cengage Learning. May not be scanned, copied or duplicated, or posted to a publicly accessible website, in whole or in part, except for use as permitted in a license distributed with a certain product or service or otherwise on a password-protected website or school-approved learning management system for classroom use.
Statistics for Business and Economics (13e)
End of Chapter 9
64