47
Statistics: Index Number Conceptualization By: Soumen Roy, B.Com (H), AICWA.
| Date post: | 07-Apr-2018 |
| Category: |
Documents |
| Upload: | ruth-cadet |
| View: | 227 times |
| Download: | 2 times |
8/4/2019 Statistics - Index Number
http://slidepdf.com/reader/full/statistics-index-number 1/47
Statistics: Index Number
Conceptualization By:
Soumen Roy, B.Com (H), AICWA.
8/4/2019 Statistics - Index Number
http://slidepdf.com/reader/full/statistics-index-number 2/47
Learning Objectives
Acquaintance with Key Terms
Conceptualizations By: Soumen Roy 2
Introduction to overall concept
Solving of basic problems
8/4/2019 Statistics - Index Number
http://slidepdf.com/reader/full/statistics-index-number 3/47
Key Terms - Slide I of III
Index NumberPrice Index
* Whole Price Index
eta r ce n exQuantity Index
Value Index
Base Period
Current Period
Conceptualization By Soumen Roy 3
8/4/2019 Statistics - Index Number
http://slidepdf.com/reader/full/statistics-index-number 4/47
Key Terms - Slide II of III
Simple Aggregate Index NumberSimple Average Price Relative Index
ei hted A re te Index mber
4
* Laspeyre’s Method
* Paasche’s Method
* Fisher’s Ideal Method
* Bowley’s Method
* Marshall-Edgeworth Method
* Kelly’s Method
8/4/2019 Statistics - Index Number
http://slidepdf.com/reader/full/statistics-index-number 5/47
Key Terms - Slide III of III
Quantity / Volume Index NumberTest of Consistency
* Unit Test
* Time Reversal Test
* Factor Reversal Test
Consumer Price Index Number
Conceptualization By Soumen Roy 5
8/4/2019 Statistics - Index Number
http://slidepdf.com/reader/full/statistics-index-number 6/47
Index Number
What is Index Number?….is a statisticalmeasure designed to show changes in variable or a group of related
variables with respect to time, geographic location or other
characteristic.
- For example, if we want to compare the price level of 2009 with what itwas in 2008, we shall have to consider a group of variables such as
price of wheat, rice, vegetables, cloth, house rent etc.,
- We want one figure to indicate the changes of different commodities as
a whole. This is called an Index number.- In general, index numbers are used to measure changes over time in
magnitude which are not capable of direct measurement.
Conceptualization By Soumen Roy 6
8/4/2019 Statistics - Index Number
http://slidepdf.com/reader/full/statistics-index-number 7/47
Characteristics of Index Number
Index numbers are specified averages
Index n mbers re ex ressed in ercent e
Index numbers measure changes not
capable of direct measurement.
Index numbers are for comparison.
Conceptualization By Soumen Roy 7
8/4/2019 Statistics - Index Number
http://slidepdf.com/reader/full/statistics-index-number 8/47
Uses of Index Numbers
They measure the relative change.They are of better comparison.
The re economic b rometers.
They compare the standard of living.
They provide guidelines to policy.
They measure the purchasing power of money.
Conceptualization By Soumen Roy 8
8/4/2019 Statistics - Index Number
http://slidepdf.com/reader/full/statistics-index-number 9/47
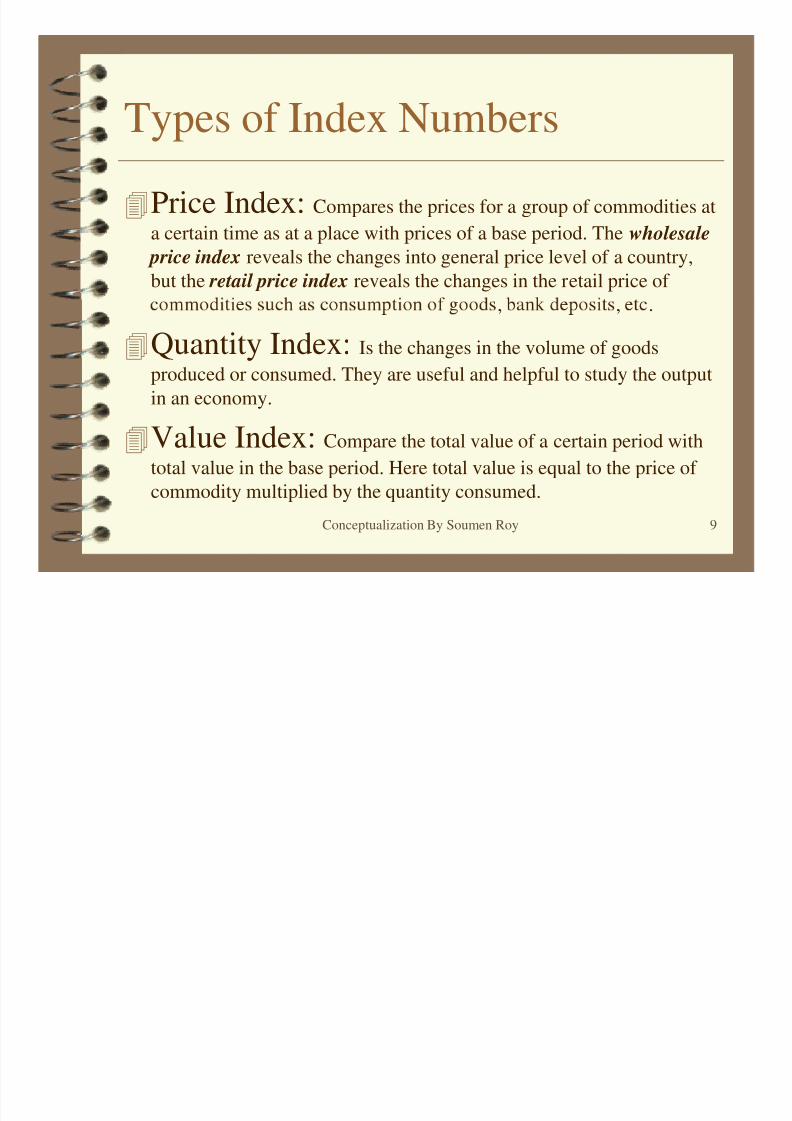
Types of Index Numbers
Price Index: Compares the prices for a group of commodities ata certain time as at a place with prices of a base period. The wholesale
price index reveals the changes into general price level of a country,
but the retail price index reveals the changes in the retail price of
, , .
Quantity Index: Is the changes in the volume of goods
produced or consumed. They are useful and helpful to study the output
in an economy.
Value Index: Compare the total value of a certain period with
total value in the base period. Here total value is equal to the price of
commodity multiplied by the quantity consumed.
Conceptualization By Soumen Roy 9
8/4/2019 Statistics - Index Number
http://slidepdf.com/reader/full/statistics-index-number 10/47
Notations
The following notations would be usedthrough out the presentation:
P1 = Price of current year
P0 = Price of base year
q1 = Quantity of current year
q0 = Quantity of base year
Conceptualization By Soumen Roy 10
8/4/2019 Statistics - Index Number
http://slidepdf.com/reader/full/statistics-index-number 11/47
Problems in construction of Index Numbers
Purpose of the index numbersSelection of base period
election of items
Selection of source of data
Collection of data
Selection of average
System of weighting
Conceptualization By Soumen Roy 11
8/4/2019 Statistics - Index Number
http://slidepdf.com/reader/full/statistics-index-number 12/47
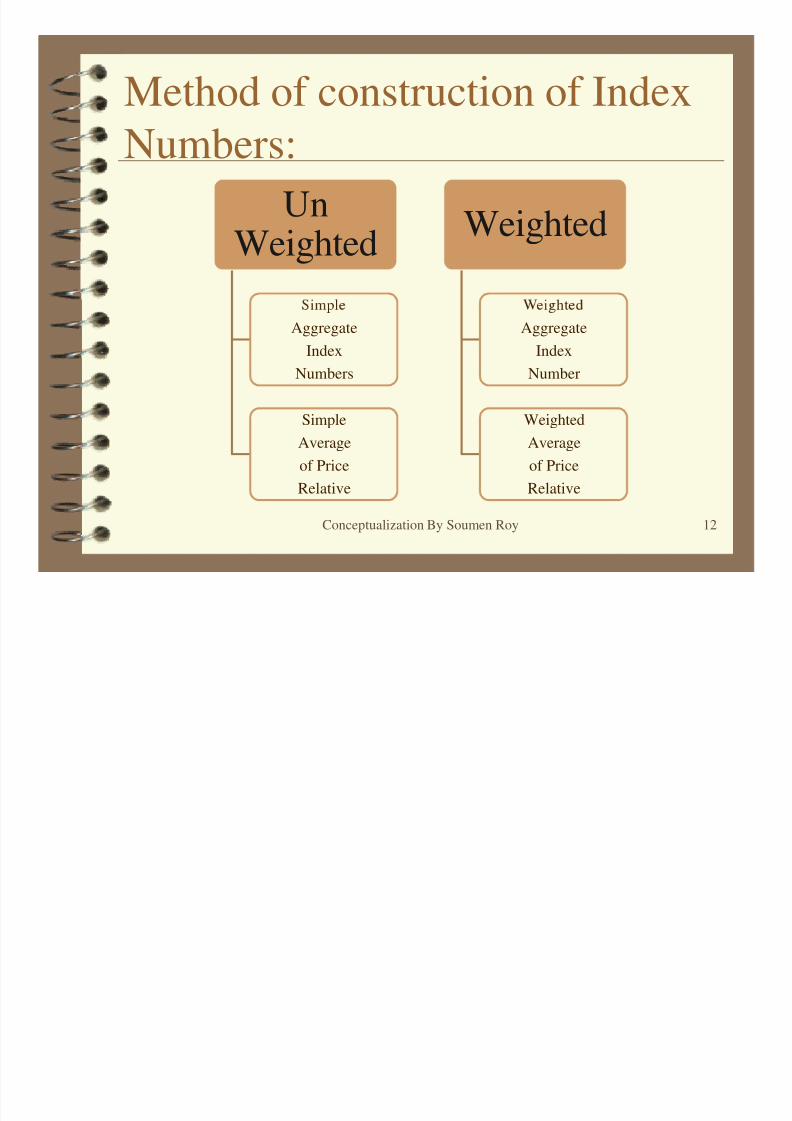
Method of construction of IndexNumbers:
UnWeighted Weighted
Conceptualization By Soumen Roy 12
Aggregate
Index
Numbers
Simple
Average
of Price
Relative
Aggregate
Index
Number
Weighted
Average
of Price
Relative
8/4/2019 Statistics - Index Number
http://slidepdf.com/reader/full/statistics-index-number 13/47
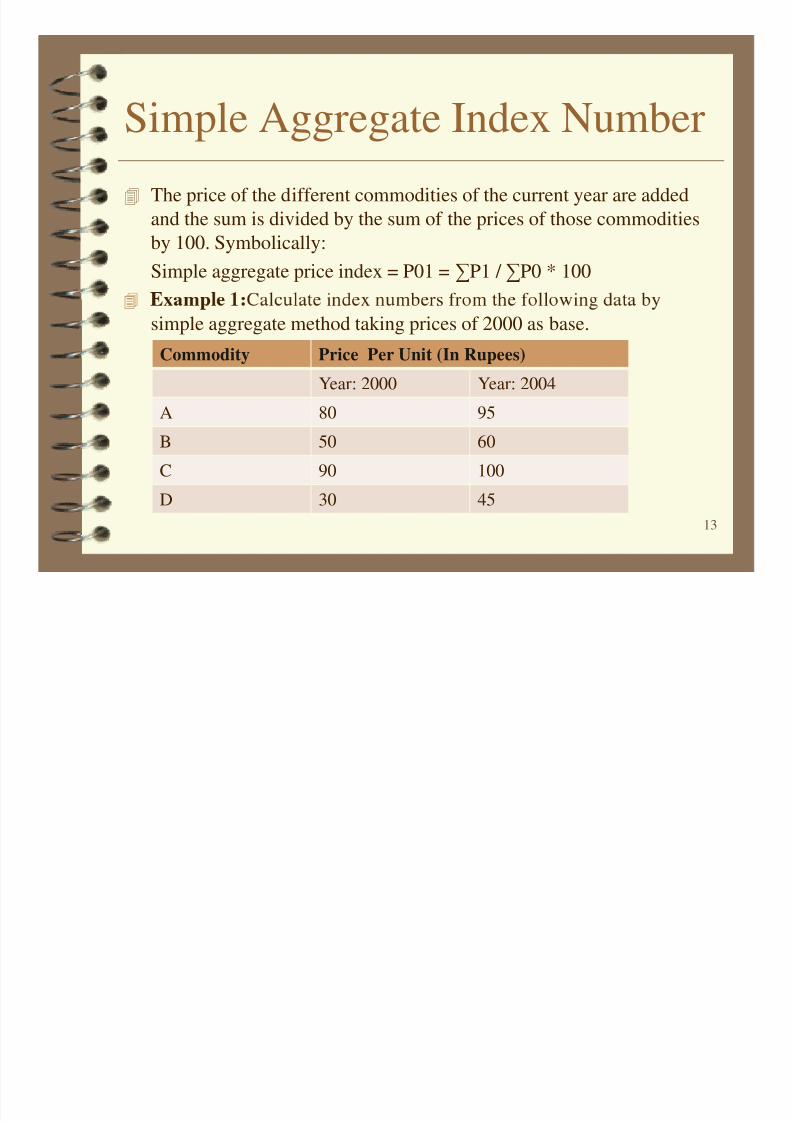
Simple Aggregate Index Number
The price of the different commodities of the current year are added
and the sum is divided by the sum of the prices of those commoditiesby 100. Symbolically:
Simple aggregate price index = P01 = ∑P1 / ∑P0 * 100
simple aggregate method taking prices of 2000 as base.
13
Commodity Price Per Unit (In Rupees)
Year: 2000 Year: 2004
A 80 95
B 50 60
C 90 100
D 30 45
8/4/2019 Statistics - Index Number
http://slidepdf.com/reader/full/statistics-index-number 14/47
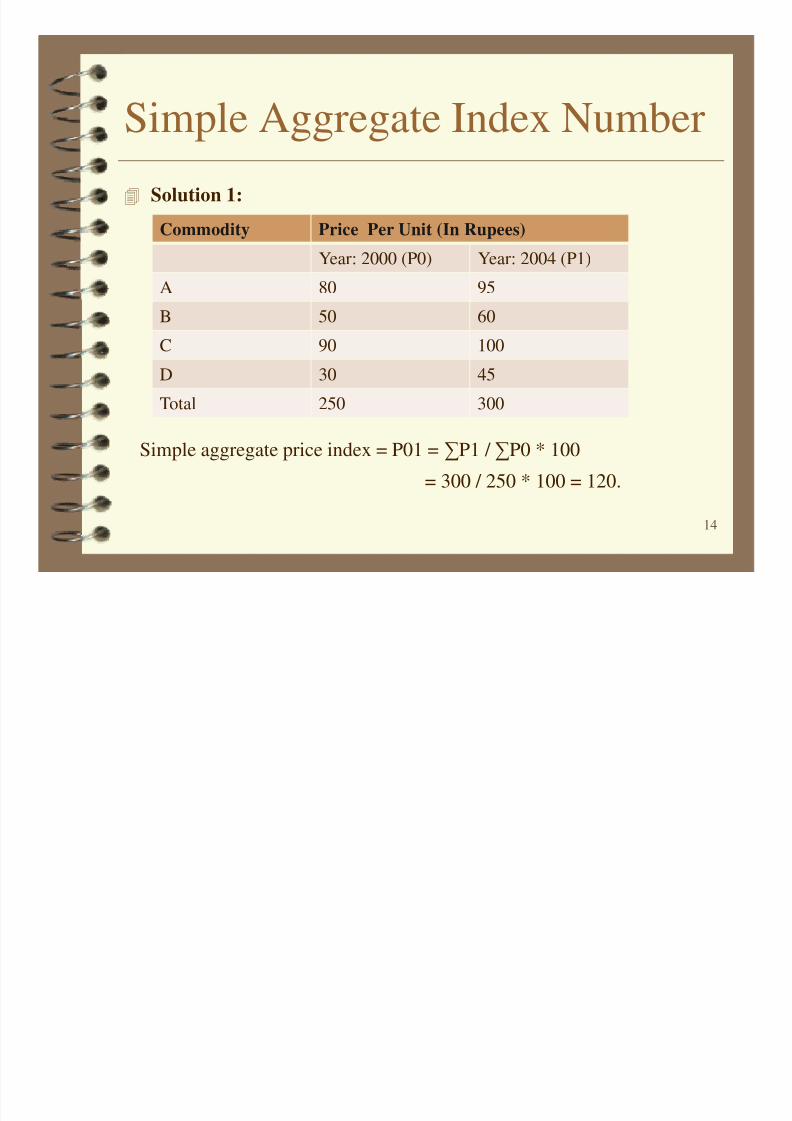
Simple Aggregate Index Number
Solution 1:
Commodity Price Per Unit (In Rupees)
Year: 2000 (P0) Year: 2004 (P1)
A 80 95
Simple aggregate price index = P01 = ∑P1 / ∑P0 * 100
= 300 / 250 * 100 = 120.
14
B 50 60C 90 100
D 30 45
Total 250 300
8/4/2019 Statistics - Index Number
http://slidepdf.com/reader/full/statistics-index-number 15/47
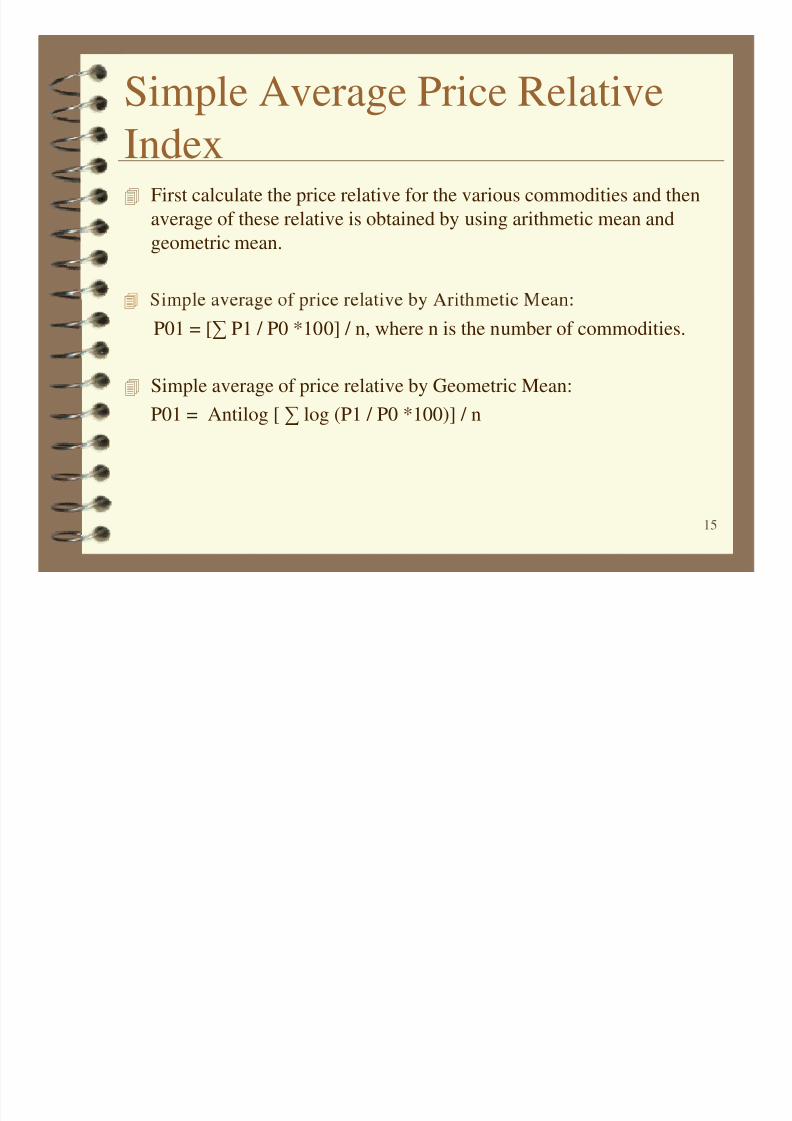
Simple Average Price RelativeIndex First calculate the price relative for the various commodities and then
average of these relative is obtained by using arithmetic mean andgeometric mean.
P01 = [∑ P1 / P0 *100] / n, where n is the number of commodities.
Simple average of price relative by Geometric Mean:
P01 = Antilog [ ∑ log (P1 / P0 *100)] / n
15
8/4/2019 Statistics - Index Number
http://slidepdf.com/reader/full/statistics-index-number 16/47
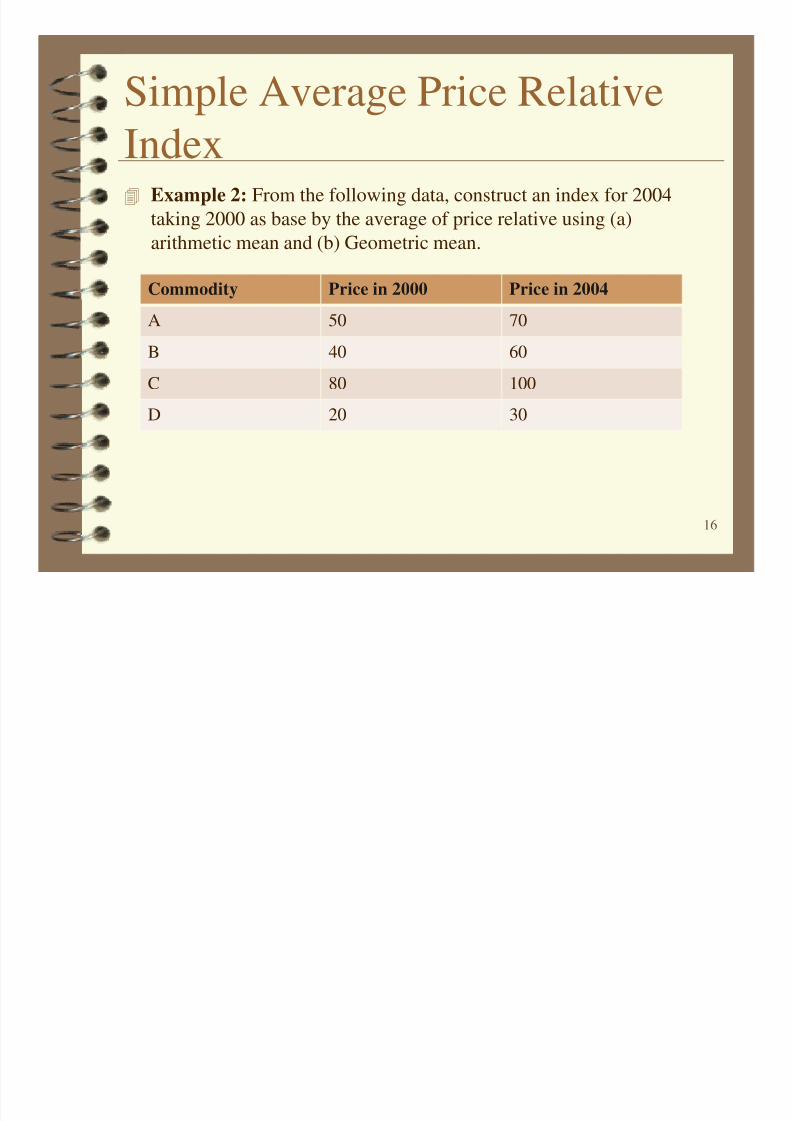
Simple Average Price RelativeIndex Example 2: From the following data, construct an index for 2004
taking 2000 as base by the average of price relative using (a)arithmetic mean and (b) Geometric mean.
Commodity Price in 2000 Price in 2004
16
A 50 70
B 40 60
C 80 100
D 20 30
8/4/2019 Statistics - Index Number
http://slidepdf.com/reader/full/statistics-index-number 17/47
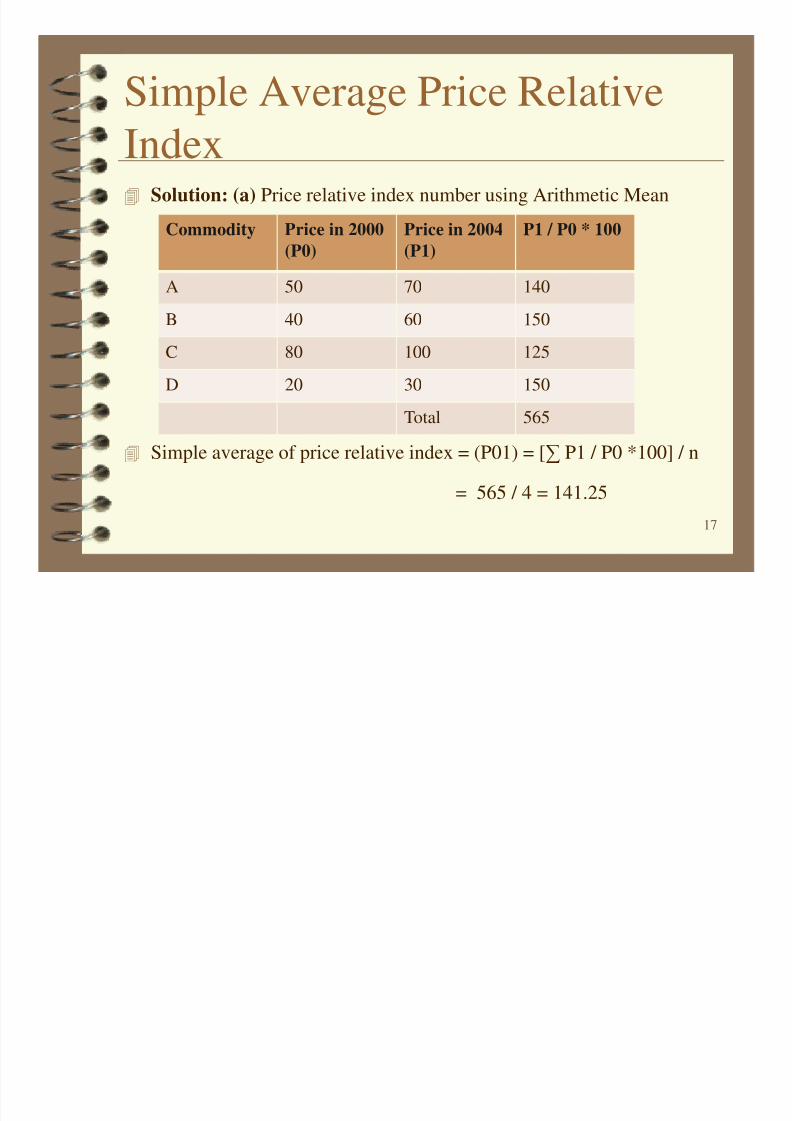
Simple Average Price RelativeIndex Solution: (a) Price relative index number using Arithmetic Mean
Commodity Price in 2000
(P0)
Price in 2004
(P1)
P1 / P0 * 100
A 50 70 140
Simple average of price relative index = (P01) = [∑ P1 / P0 *100] / n
= 565 / 4 = 141.25
17
B 40 60 150
C 80 100 125
D 20 30 150
Total 565
8/4/2019 Statistics - Index Number
http://slidepdf.com/reader/full/statistics-index-number 18/47
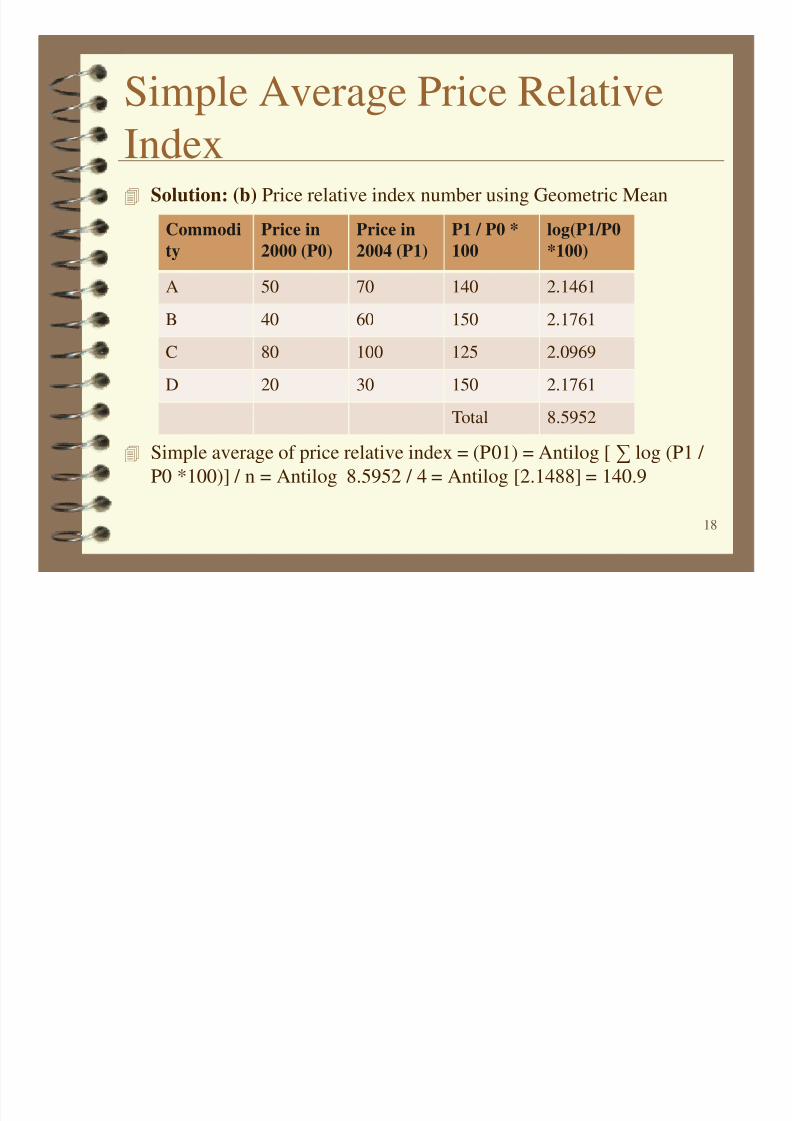
Simple Average Price RelativeIndex Solution: (b) Price relative index number using Geometric Mean
Commodi
ty
Price in
2000 (P0)
Price in
2004 (P1)
P1 / P0 *
100
log(P1/P0
*100)
A 50 70 140 2.1461
Simple average of price relative index = (P01) = Antilog [ ∑ log (P1 /
P0 *100)] / n = Antilog 8.5952 / 4 = Antilog [2.1488] = 140.9
18
B 40 60 150 2.1761
C 80 100 125 2.0969
D 20 30 150 2.1761
Total 8.5952
8/4/2019 Statistics - Index Number
http://slidepdf.com/reader/full/statistics-index-number 19/47
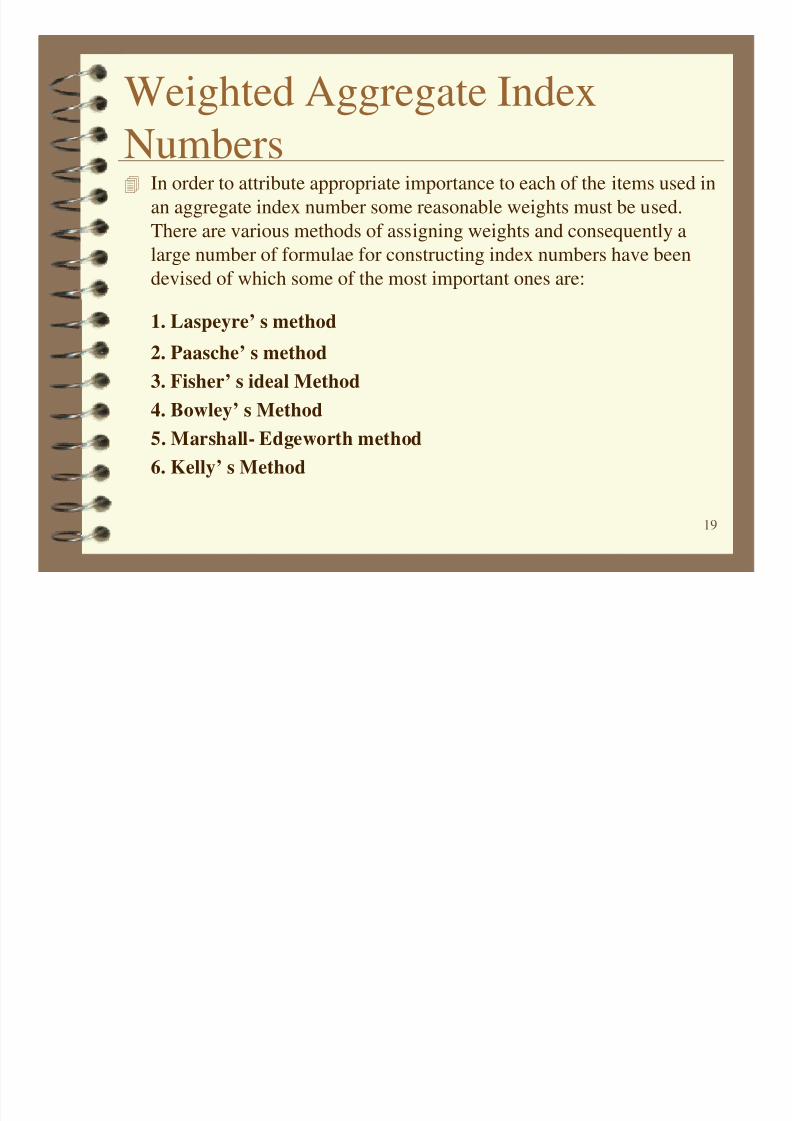
Weighted Aggregate IndexNumbers In order to attribute appropriate importance to each of the items used in
an aggregate index number some reasonable weights must be used.
There are various methods of assigning weights and consequently a
large number of formulae for constructing index numbers have been
devised of which some of the most important ones are:
1. Laspeyre’ s method2. Paasche’ s method
3. Fisher’ s ideal Method
4. Bowley’ s Method
5. Marshall- Edgeworth method
6. Kelly’ s Method
19
8/4/2019 Statistics - Index Number
http://slidepdf.com/reader/full/statistics-index-number 20/47
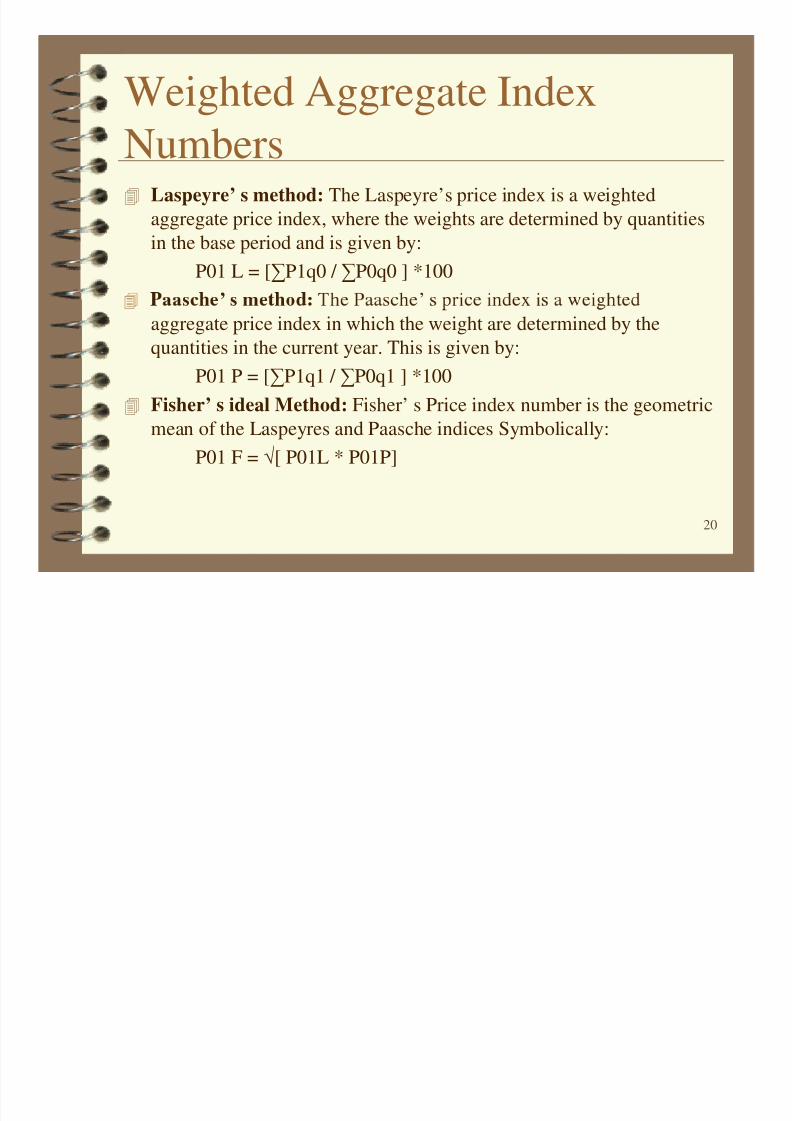
Weighted Aggregate IndexNumbers Laspeyre’ s method: The Laspeyre’s price index is a weighted
aggregate price index, where the weights are determined by quantitiesin the base period and is given by:
P01 L = [∑P1q0 / ∑P0q0 ] *100
’ ’
aggregate price index in which the weight are determined by thequantities in the current year. This is given by:
P01 P = [∑P1q1 / ∑P0q1 ] *100
Fisher’ s ideal Method: Fisher’ s Price index number is the geometric
mean of the Laspeyres and Paasche indices Symbolically:P01 F = √[ P01L * P01P]
20
8/4/2019 Statistics - Index Number
http://slidepdf.com/reader/full/statistics-index-number 21/47
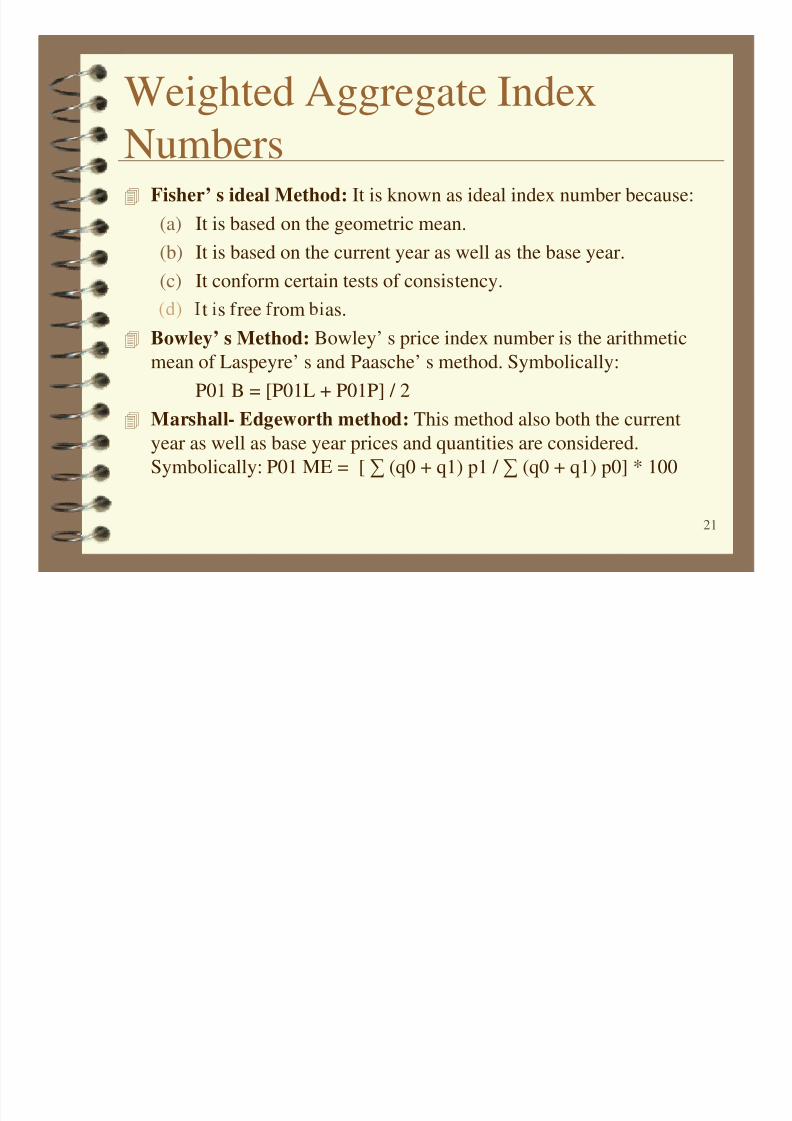
Weighted Aggregate IndexNumbers Fisher’ s ideal Method: It is known as ideal index number because:
(a) It is based on the geometric mean.
(b) It is based on the current year as well as the base year.
(c) It conform certain tests of consistency.
t s ree rom as.
Bowley’ s Method: Bowley’ s price index number is the arithmetic
mean of Laspeyre’ s and Paasche’ s method. Symbolically:
P01 B = [P01L + P01P] / 2
Marshall- Edgeworth method: This method also both the current
year as well as base year prices and quantities are considered.
Symbolically: P01 ME = [ ∑ (q0 + q1) p1 / ∑ (q0 + q1) p0] * 100
21
8/4/2019 Statistics - Index Number
http://slidepdf.com/reader/full/statistics-index-number 22/47
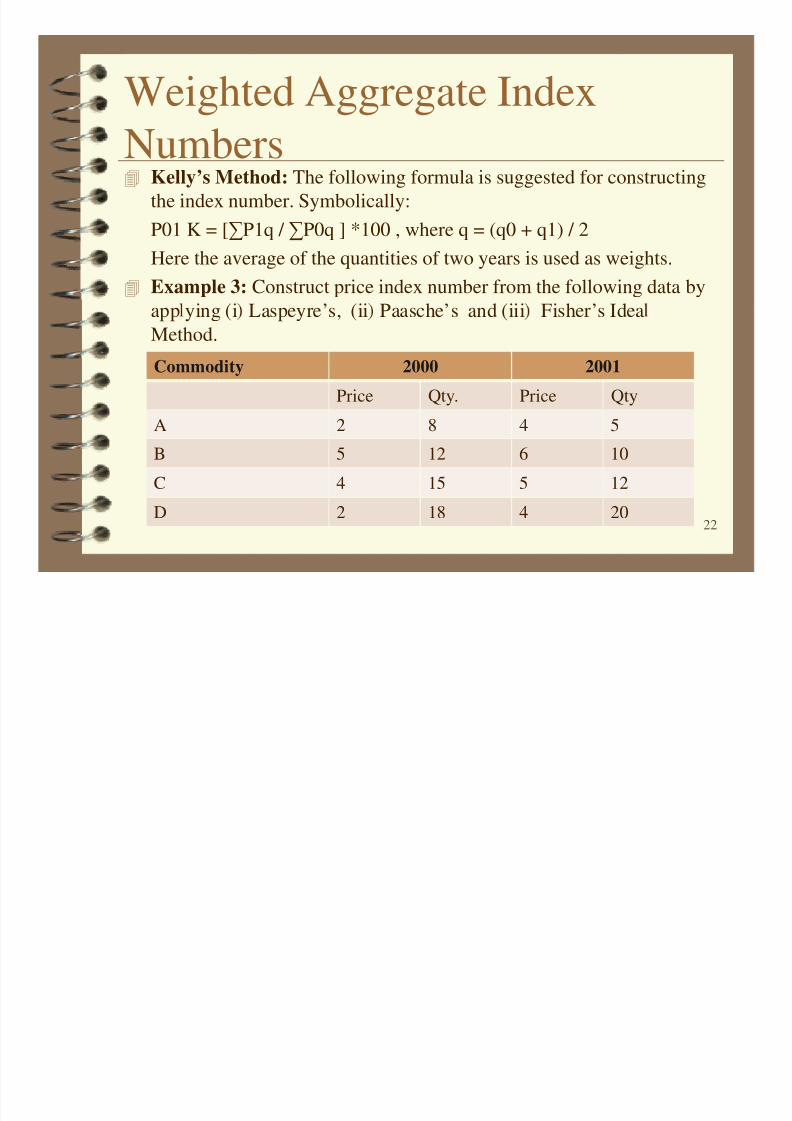
Weighted Aggregate IndexNumbers Kelly’s Method: The following formula is suggested for constructing
the index number. Symbolically:
P01 K = [∑P1q / ∑P0q ] *100 , where q = (q0 + q1) / 2
Here the average of the quantities of two years is used as weights.
Example 3: Construct price index number from the following data by
app ying (i Laspeyre’s, (ii Paasche’s and (iii Fisher’s Idea
Method.
22
Commodity 2000 2001
Price Qty. Price Qty
A 2 8 4 5B 5 12 6 10
C 4 15 5 12
D 2 18 4 20
8/4/2019 Statistics - Index Number
http://slidepdf.com/reader/full/statistics-index-number 23/47
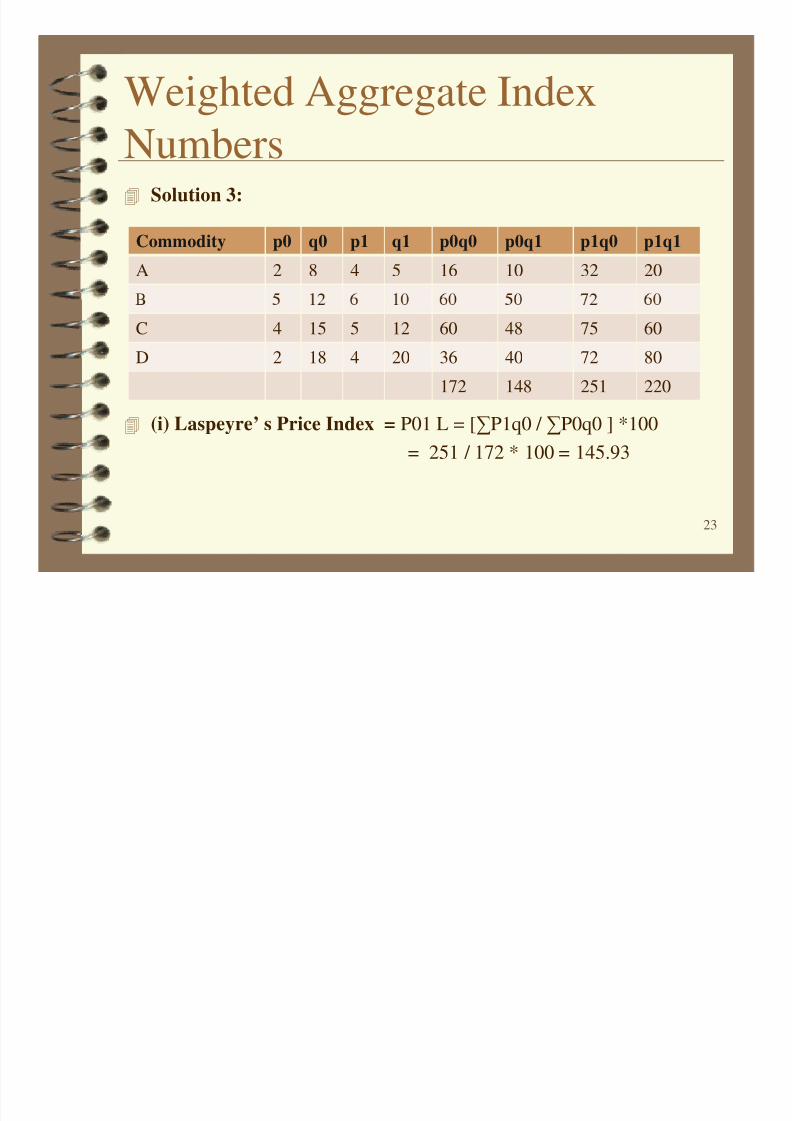
Weighted Aggregate IndexNumbers Solution 3:
Commodity p0 q0 p1 q1 p0q0 p0q1 p1q0 p1q1
A 2 8 4 5 16 10 32 20
(i) Laspeyre’ s Price Index = P01 L = [∑P1q0 / ∑P0q0 ] *100= 251 / 172 * 100 = 145.93
23
C 4 15 5 12 60 48 75 60
D 2 18 4 20 36 40 72 80
172 148 251 220
8/4/2019 Statistics - Index Number
http://slidepdf.com/reader/full/statistics-index-number 24/47
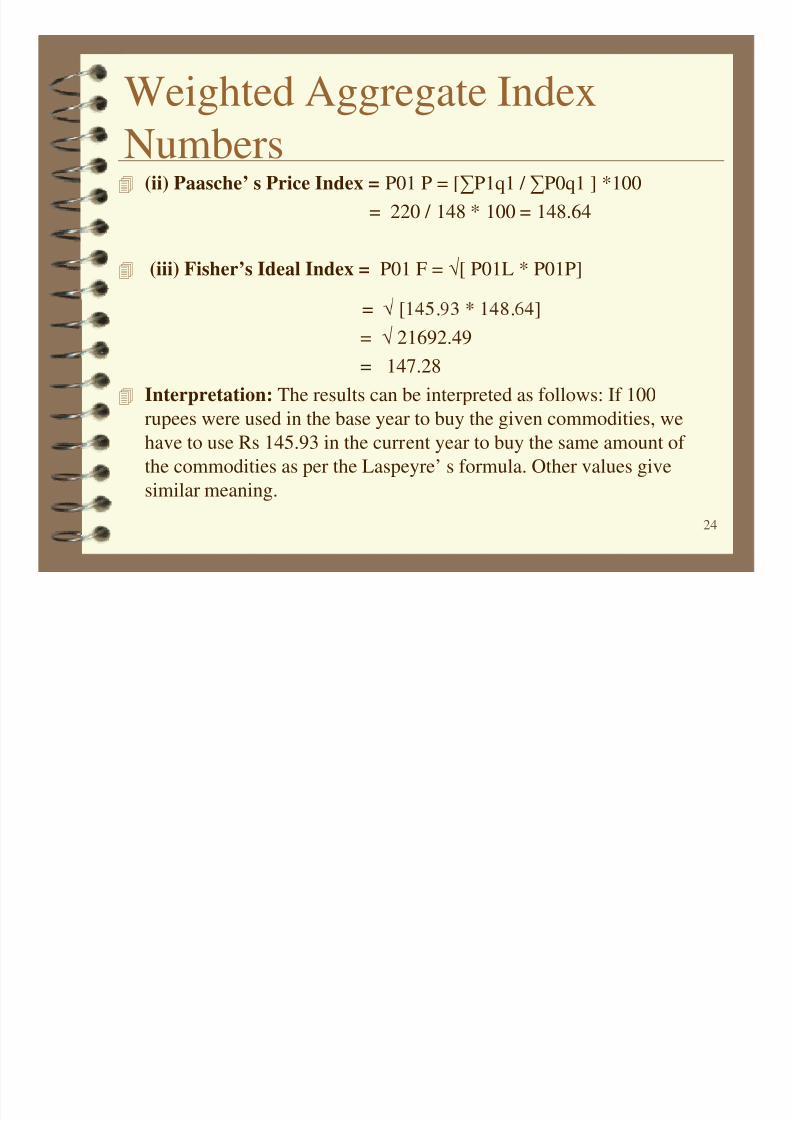
Weighted Aggregate IndexNumbers (ii) Paasche’ s Price Index = P01 P = [∑P1q1 / ∑P0q1 ] *100
= 220 / 148 * 100 = 148.64
(iii) Fisher’s Ideal Index = P01 F = √[ P01L * P01P]
= . .
= √ 21692.49
= 147.28
Interpretation: The results can be interpreted as follows: If 100
rupees were used in the base year to buy the given commodities, we
have to use Rs 145.93 in the current year to buy the same amount of
the commodities as per the Laspeyre’ s formula. Other values give
similar meaning.
24
8/4/2019 Statistics - Index Number
http://slidepdf.com/reader/full/statistics-index-number 25/47
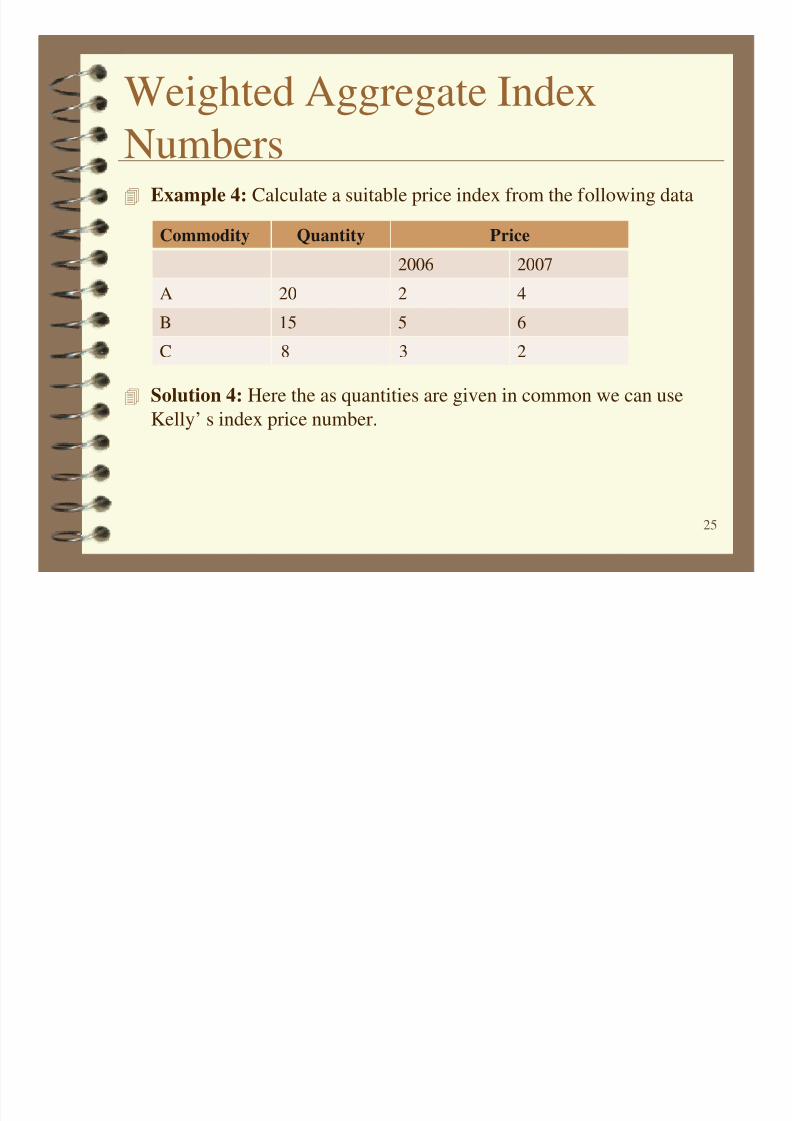
Weighted Aggregate IndexNumbers Example 4: Calculate a suitable price index from the following data
Commodity Quantity Price
2006 2007
A 20 2 4
Solution 4: Here the as quantities are given in common we can use
Kelly’ s index price number.
25
B 15 5 6C 8 3 2
8/4/2019 Statistics - Index Number
http://slidepdf.com/reader/full/statistics-index-number 26/47
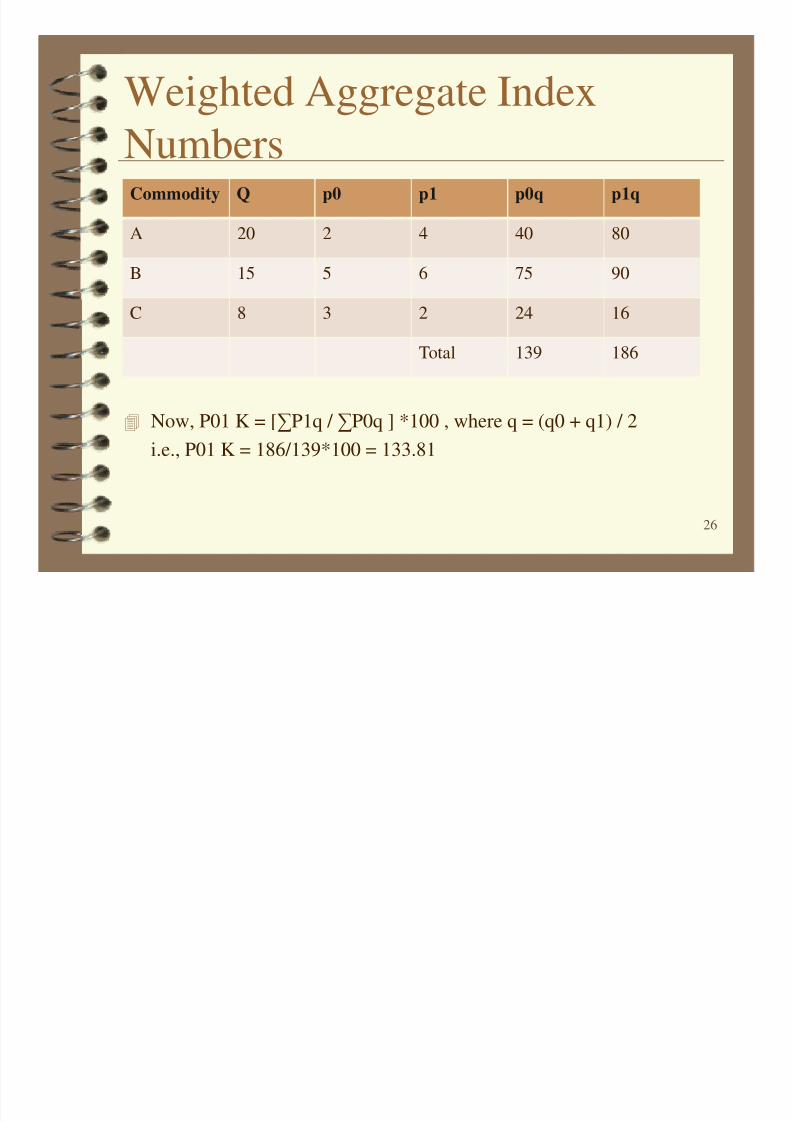
Weighted Aggregate IndexNumbersCommodity Q p0 p1 p0q p1q
A 20 2 4 40 80
B 15 5 6 75 90
26
Now, P01 K = [∑P1q / ∑P0q ] *100 , where q = (q0 + q1) / 2
i.e., P01 K = 186/139*100 = 133.81
C 8 3 2 24 16
Total 139 186
8/4/2019 Statistics - Index Number
http://slidepdf.com/reader/full/statistics-index-number 27/47
Weighted Average of PriceRelative Index When the specific weights are given for each commodity, the weighted
index number is calculated by the formula: ∑pw / ∑w, whereW= Weight of the commodity
P = the price relative index
.
Note:
When the base year value P0q0 is taken as weight, i.e., W= P0q0, then
the above becomes Laspeyre’s formula.
When the weights are taken as W=P0q1, then the above becomes
Paasche’s formula
27
8/4/2019 Statistics - Index Number
http://slidepdf.com/reader/full/statistics-index-number 28/47
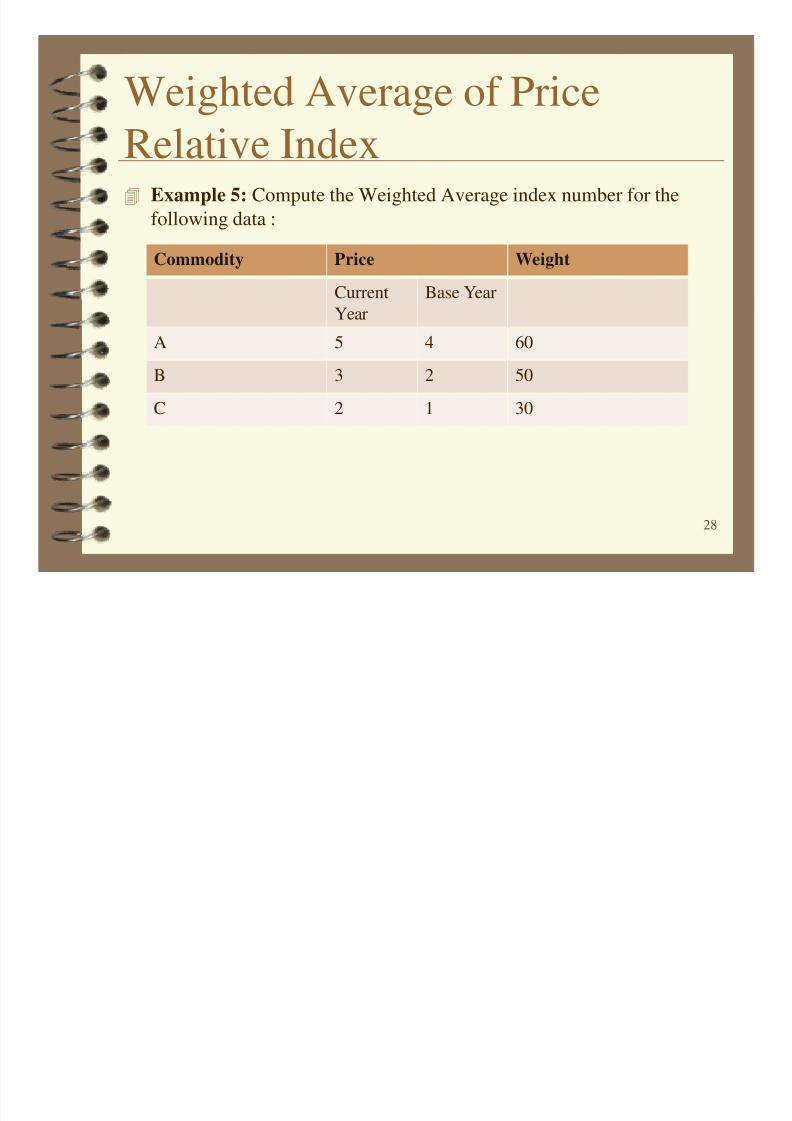
Weighted Average of PriceRelative Index Example 5: Compute the Weighted Average index number for the
following data :
Commodity Price Weight
Current Base Year
28
Year
A 5 4 60
B 3 2 50
C 2 1 30
8/4/2019 Statistics - Index Number
http://slidepdf.com/reader/full/statistics-index-number 29/47
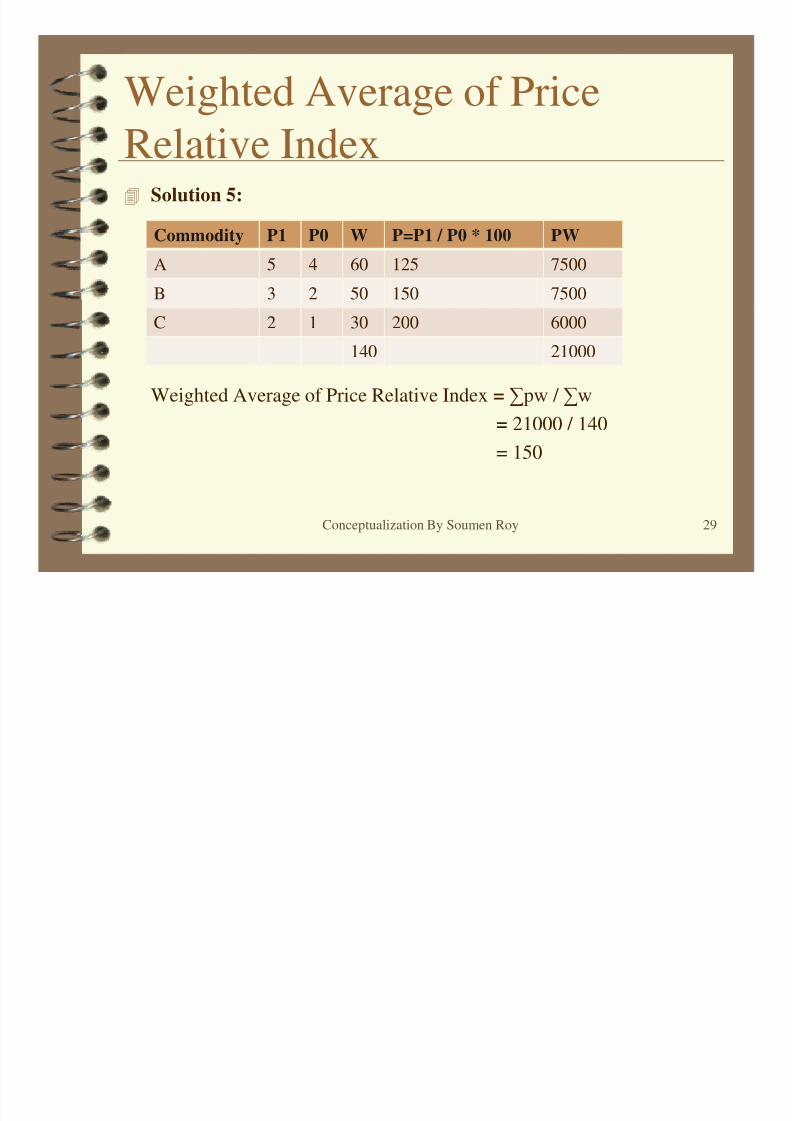
Weighted Average of PriceRelative Index Solution 5:
Commodity P1 P0 W P=P1 / P0 * 100 PW
A 5 4 60 125 7500
B 3 2 50 150 7500
Weighted Average of Price Relative Index = ∑pw / ∑w
= 21000 / 140= 150
Conceptualization By Soumen Roy 29
C 2 1 30 200 6000140 21000
8/4/2019 Statistics - Index Number
http://slidepdf.com/reader/full/statistics-index-number 30/47
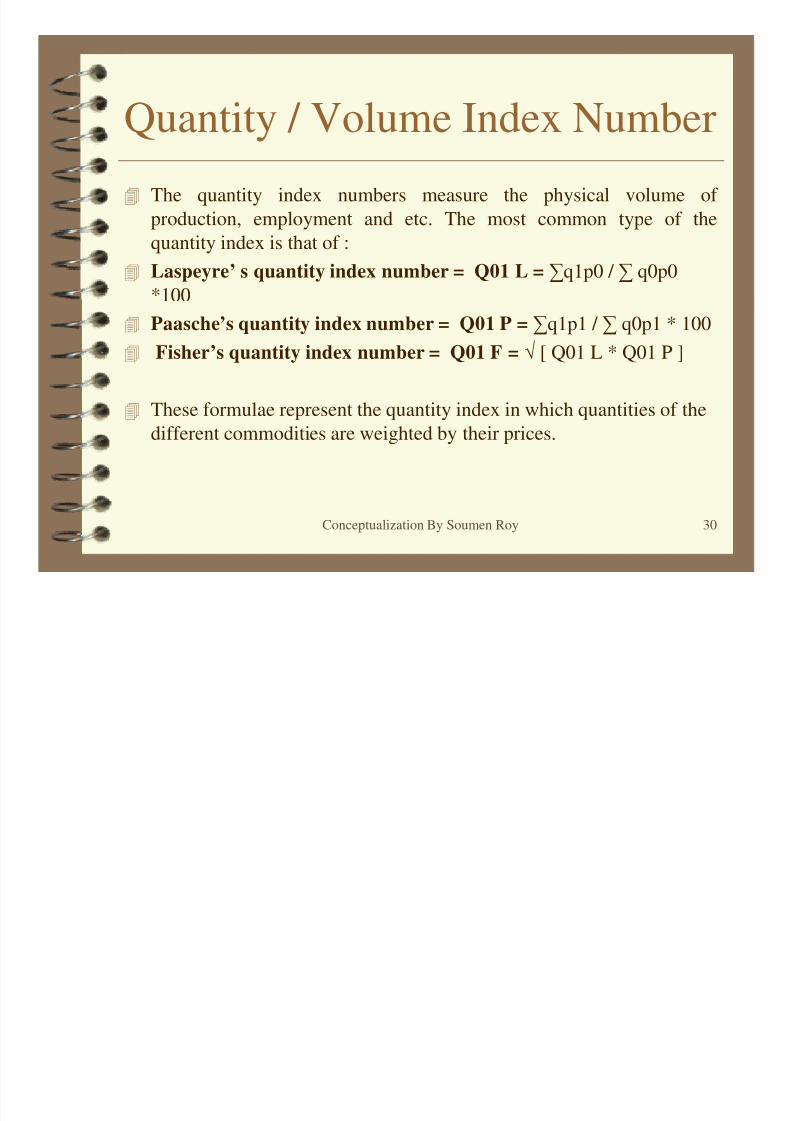
Quantity / Volume Index Number
The quantity index numbers measure the physical volume of
production, employment and etc. The most common type of thequantity index is that of :
Laspeyre’ s quantity index number = Q01 L = ∑q1p0 / ∑ q0p0
*100
Paasche’s quantity index number = Q01 P = ∑q1p1 / ∑ q0p1 * 100 Fisher’s quantity index number = Q01 F = √ [ Q01 L * Q01 P ]
These formulae represent the quantity index in which quantities of the
different commodities are weighted by their prices.
Conceptualization By Soumen Roy 30
8/4/2019 Statistics - Index Number
http://slidepdf.com/reader/full/statistics-index-number 31/47
Quantity / Volume Index Number
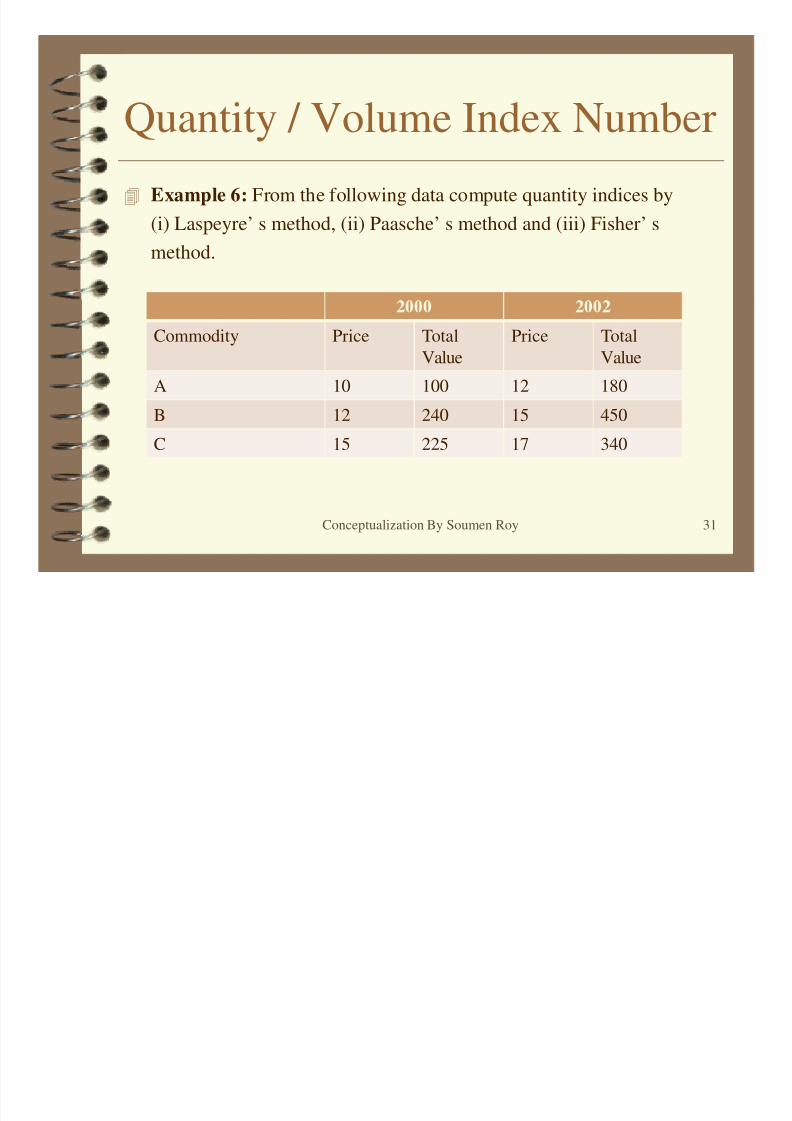
Example 6: From the following data compute quantity indices by
(i) Laspeyre’ s method, (ii) Paasche’ s method and (iii) Fisher’ s
method.
Conceptualization By Soumen Roy 31
Commodity Price Total
Value
Price Total
Value
A 10 100 12 180
B 12 240 15 450
C 15 225 17 340
8/4/2019 Statistics - Index Number
http://slidepdf.com/reader/full/statistics-index-number 32/47
Quantity / Volume Index Number
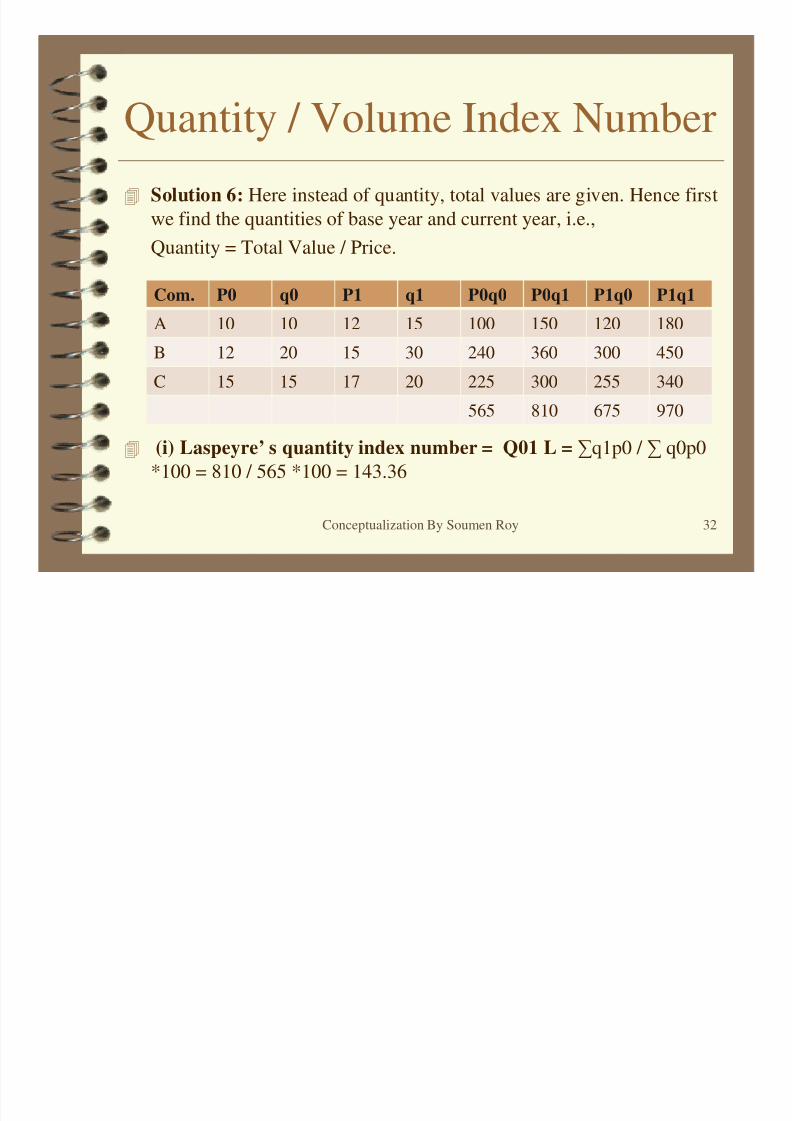
Solution 6: Here instead of quantity, total values are given. Hence first
we find the quantities of base year and current year, i.e.,Quantity = Total Value / Price.
Com. P0 q0 P1 q1 P0q0 P0q1 P1q0 P1q1
(i) Laspeyre’ s quantity index number = Q01 L = ∑q1p0 / ∑ q0p0
*100 = 810 / 565 *100 = 143.36
Conceptualization By Soumen Roy 32
A 10 10 12 15 100 150 120 180B 12 20 15 30 240 360 300 450
C 15 15 17 20 225 300 255 340
565 810 675 970
8/4/2019 Statistics - Index Number
http://slidepdf.com/reader/full/statistics-index-number 33/47
Quantity / Volume Index Number
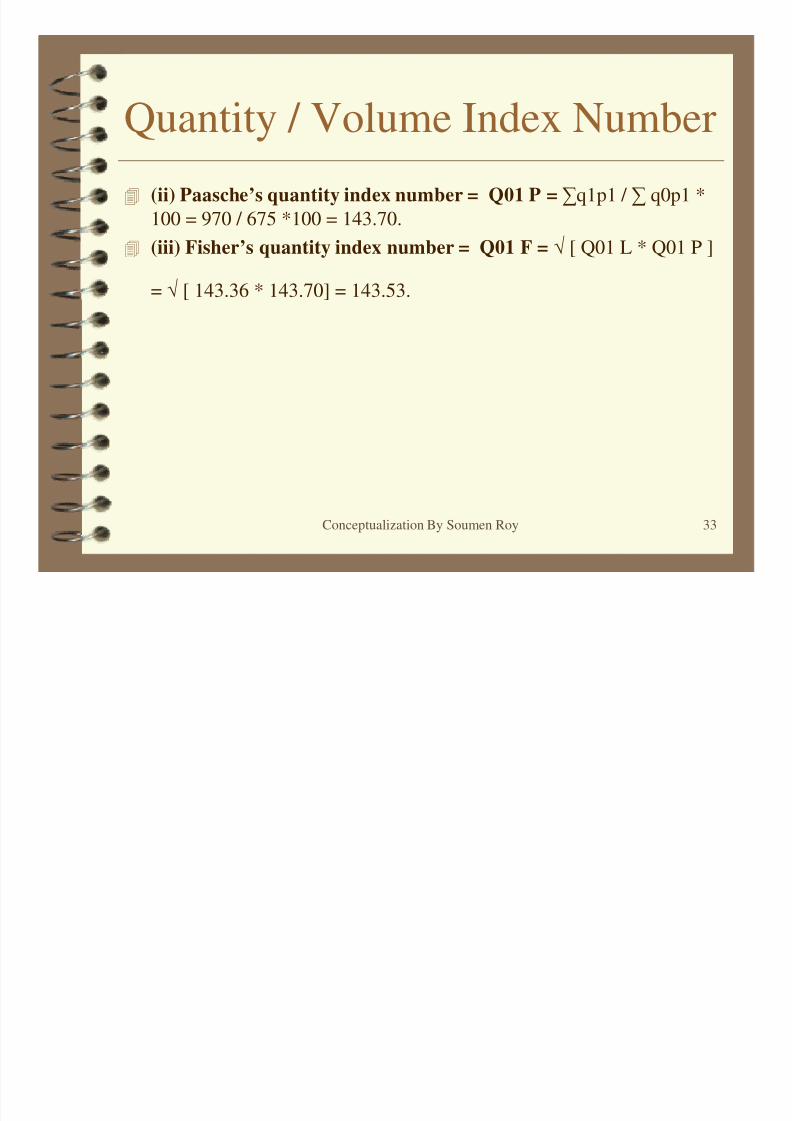
(ii) Paasche’s quantity index number = Q01 P = ∑q1p1 / ∑ q0p1 *
100 = 970 / 675 *100 = 143.70. (iii) Fisher’s quantity index number = Q01 F = √ [ Q01 L * Q01 P ]
= √ [ 143.36 * 143.70] = 143.53.
Conceptualization By Soumen Roy 33
8/4/2019 Statistics - Index Number
http://slidepdf.com/reader/full/statistics-index-number 34/47
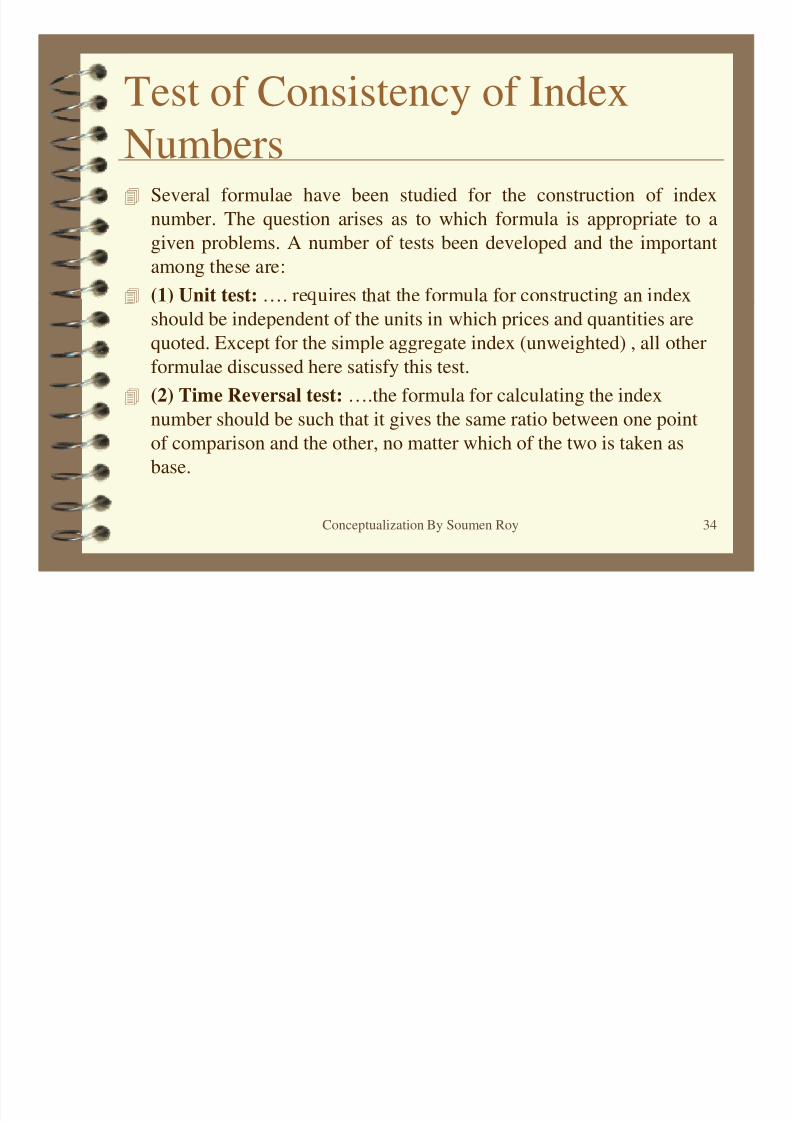
Test of Consistency of IndexNumbers Several formulae have been studied for the construction of index
number. The question arises as to which formula is appropriate to agiven problems. A number of tests been developed and the important
among these are:
(1) Unit test: …. re uires that the formula for constructin an index
should be independent of the units in which prices and quantities arequoted. Except for the simple aggregate index (unweighted) , all other
formulae discussed here satisfy this test.
(2) Time Reversal test: ….the formula for calculating the index
number should be such that it gives the same ratio between one point
of comparison and the other, no matter which of the two is taken as
base.
Conceptualization By Soumen Roy 34
8/4/2019 Statistics - Index Number
http://slidepdf.com/reader/full/statistics-index-number 35/47
Test of Consistency of Index
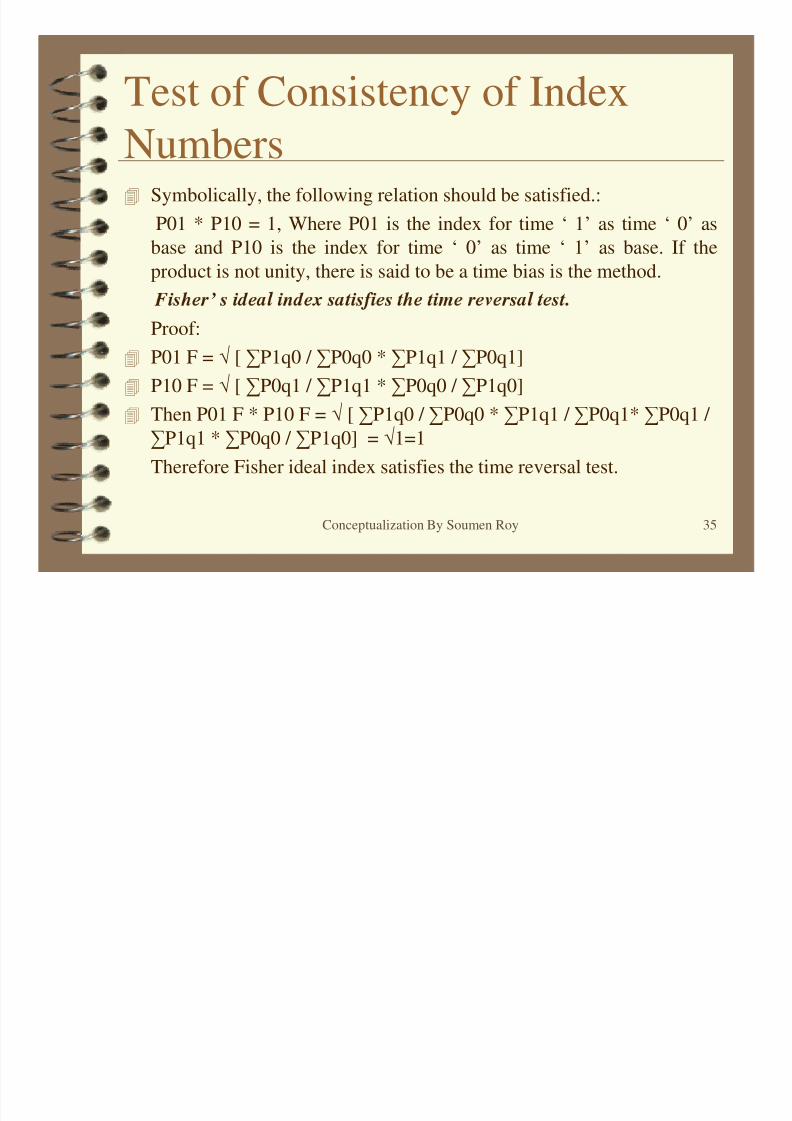
Numbers Symbolically, the following relation should be satisfied.:
P01 * P10 = 1, Where P01 is the index for time ‘ 1’ as time ‘ 0’ asbase and P10 is the index for time ‘ 0’ as time ‘ 1’ as base. If the
product is not unity, there is said to be a time bias is the method.
’
Proof: P01 F = √ [ ∑P1q0 / ∑P0q0 * ∑P1q1 / ∑P0q1]
P10 F = √ [ ∑P0q1 / ∑P1q1 * ∑P0q0 / ∑P1q0]
Then P01 F * P10 F = √ [ ∑P1q0 / ∑P0q0 * ∑P1q1 / ∑P0q1* ∑P0q1 /
∑P1q1 * ∑P0q0 / ∑P1q0] = √1=1
Therefore Fisher ideal index satisfies the time reversal test.
Conceptualization By Soumen Roy 35
8/4/2019 Statistics - Index Number
http://slidepdf.com/reader/full/statistics-index-number 36/47
Test of Consistency of Index
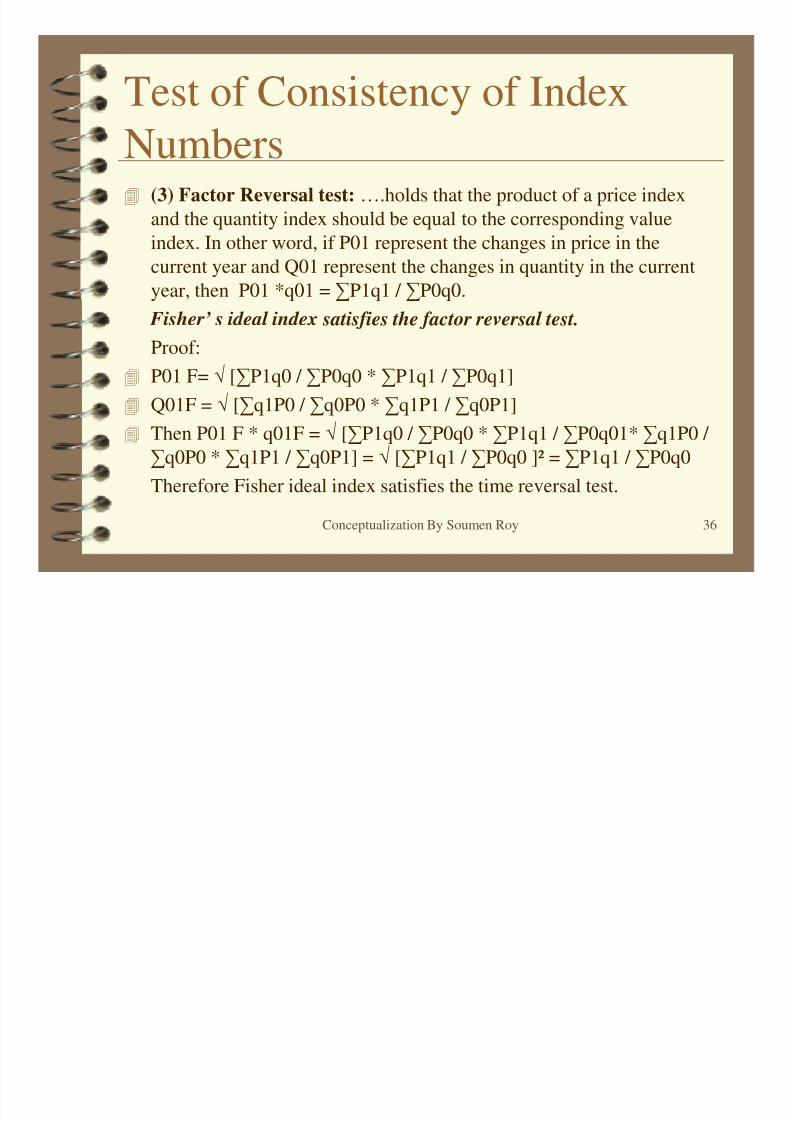
Numbers (3) Factor Reversal test: ….holds that the product of a price index
and the quantity index should be equal to the corresponding valueindex. In other word, if P01 represent the changes in price in the
current year and Q01 represent the changes in quantity in the current
year, then P01 *q01 = ∑P1q1 / ∑P0q0.
Fisher’ s ideal index satisfies the factor reversal test.Proof:
P01 F= √ [∑P1q0 / ∑P0q0 * ∑P1q1 / ∑P0q1]
Q01F = √ [∑q1P0 / ∑q0P0 * ∑q1P1 / ∑q0P1]
Then P01 F * q01F = √ [∑P1q0 / ∑P0q0 * ∑P1q1 / ∑P0q01* ∑q1P0 / ∑q0P0 * ∑q1P1 / ∑q0P1] = √ [∑P1q1 / ∑P0q0 ]² = ∑P1q1 / ∑P0q0
Therefore Fisher ideal index satisfies the time reversal test.
Conceptualization By Soumen Roy 36
8/4/2019 Statistics - Index Number
http://slidepdf.com/reader/full/statistics-index-number 37/47
Test of Consistency of Index
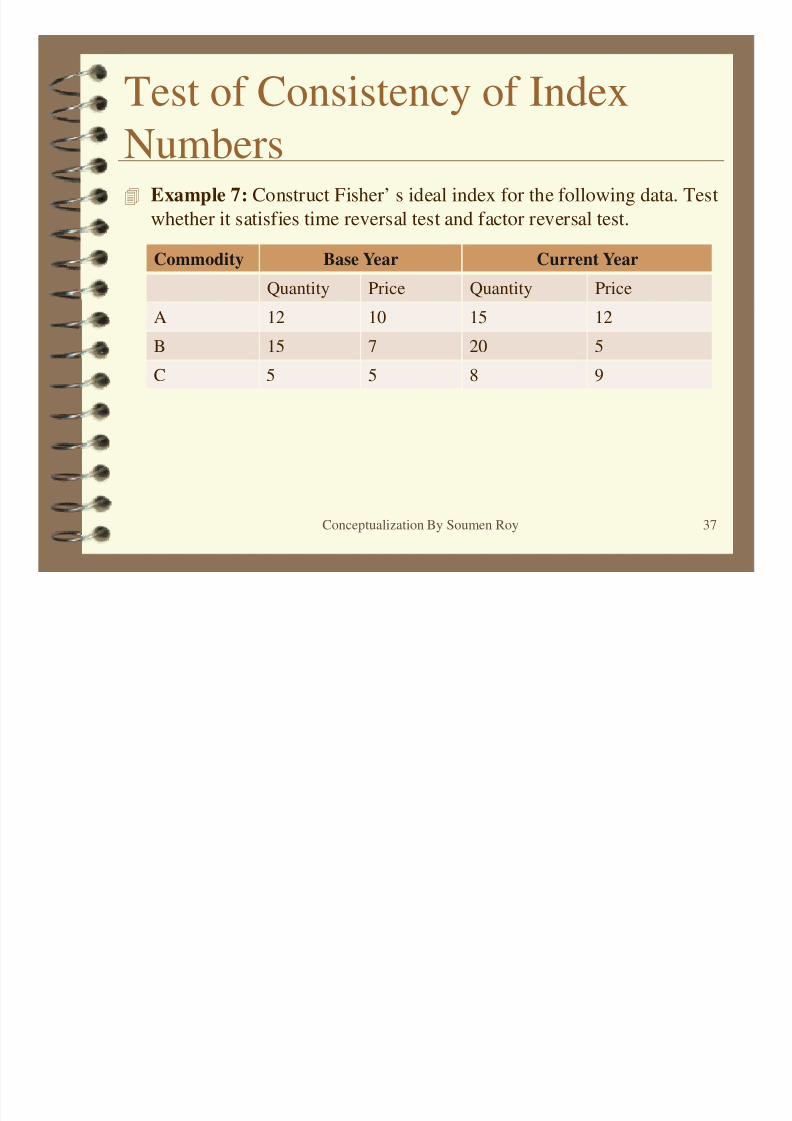
Numbers Example 7: Construct Fisher’ s ideal index for the following data. Test
whether it satisfies time reversal test and factor reversal test.
Commodity Base Year Current Year
Quantity Price Quantity Price
Conceptualization By Soumen Roy 37
A 12 10 15 12
B 15 7 20 5
C 5 5 8 9
8/4/2019 Statistics - Index Number
http://slidepdf.com/reader/full/statistics-index-number 38/47
Test of Consistency of Index
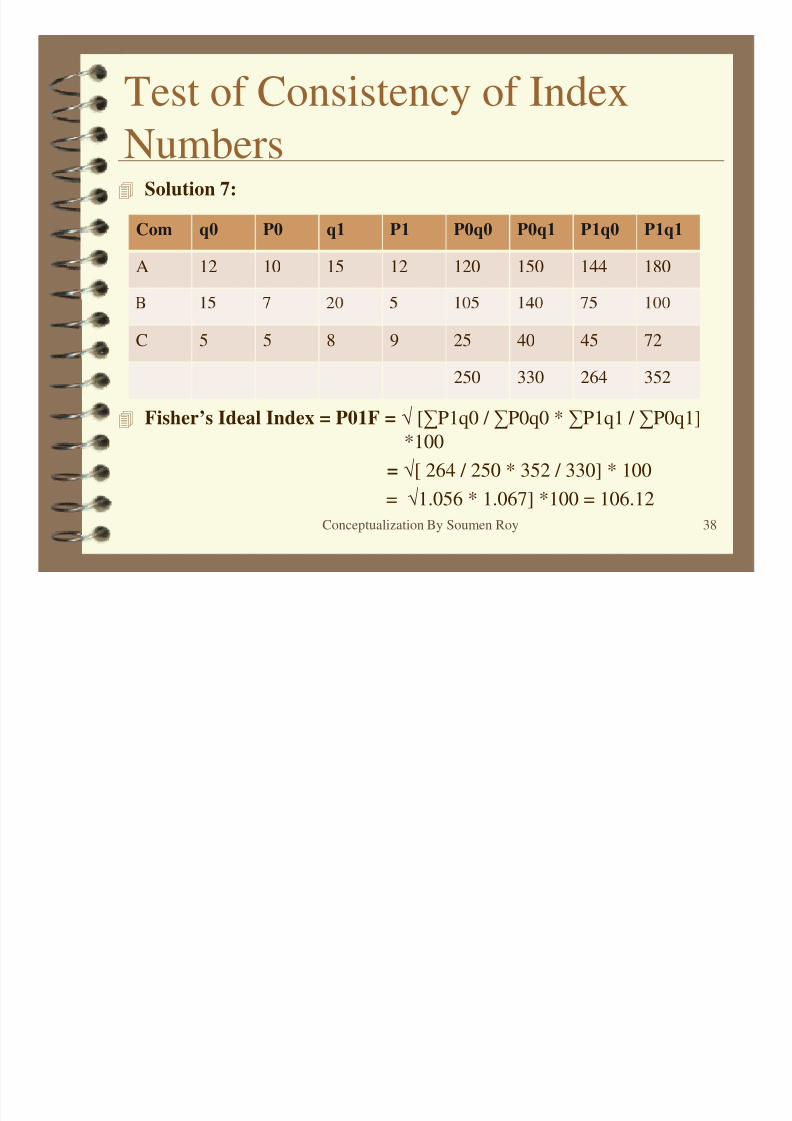
Numbers Solution 7:
Com q0 P0 q1 P1 P0q0 P0q1 P1q0 P1q1
A 12 10 15 12 120 150 144 180
Fisher’s Ideal Index = P01F = √ [∑P1q0 / ∑P0q0 * ∑P1q1 / ∑P0q1]
*100
= √[ 264 / 250 * 352 / 330] * 100
= √1.056 * 1.067] *100 = 106.12
Conceptualization By Soumen Roy 38
C 5 5 8 9 25 40 45 72
250 330 264 352
8/4/2019 Statistics - Index Number
http://slidepdf.com/reader/full/statistics-index-number 39/47
Test of Consistency of Index
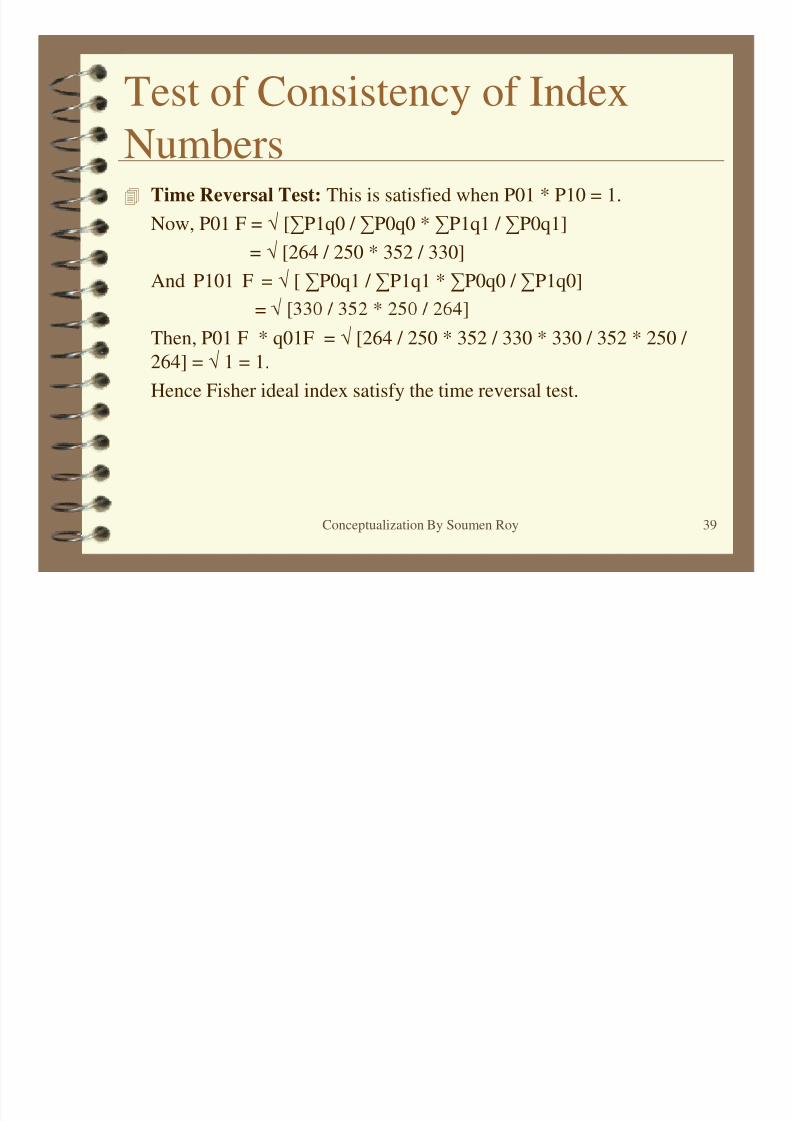
Numbers Time Reversal Test: This is satisfied when P01 * P10 = 1.
Now, P01 F = √ [∑P1q0 / ∑P0q0 * ∑P1q1 / ∑P0q1]= √ [264 / 250 * 352 / 330]
And P101 F = √ [ ∑P0q1 / ∑P1q1 * ∑P0q0 / ∑P1q0]
=
Then, P01 F * q01F = √ [264 / 250 * 352 / 330 * 330 / 352 * 250 /
264] = √ 1 = 1.
Hence Fisher ideal index satisfy the time reversal test.
Conceptualization By Soumen Roy 39
8/4/2019 Statistics - Index Number
http://slidepdf.com/reader/full/statistics-index-number 40/47
Test of Consistency of Index
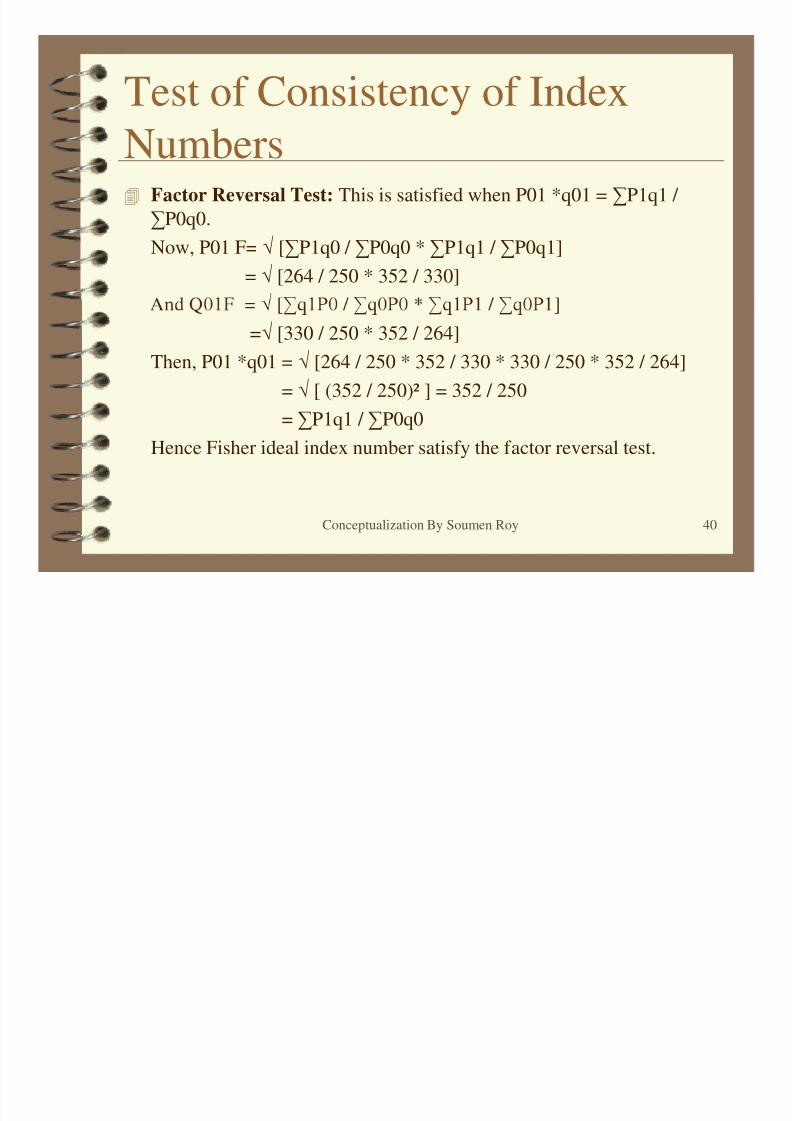
Numbers Factor Reversal Test: This is satisfied when P01 *q01 = ∑P1q1 /
∑P0q0.Now, P01 F= √ [∑P1q0 / ∑P0q0 * ∑P1q1 / ∑P0q1]
= √ [264 / 250 * 352 / 330]
=√ [330 / 250 * 352 / 264]
Then, P01 *q01 = √ [264 / 250 * 352 / 330 * 330 / 250 * 352 / 264]
= √ [ (352 / 250)² ] = 352 / 250
= ∑P1q1 / ∑P0q0
Hence Fisher ideal index number satisfy the factor reversal test.
Conceptualization By Soumen Roy 40
8/4/2019 Statistics - Index Number
http://slidepdf.com/reader/full/statistics-index-number 41/47
Consumer Price Index
Also called the cost of living index.
It represent the average change over time in the prices paid by the
ultimate consumer of a specified basket of goods and services.
A change in the price level affects the costs of living of different
classes of people differently.
The scope of consumer price is necessary, to specify the population
group covered. For example, working class, poor class, middle class,richer class, etc and the geographical areas must be covered as urban,
rural, town, city etc.
Conceptualization By Soumen Roy 41

8/4/2019 Statistics - Index Number
http://slidepdf.com/reader/full/statistics-index-number 42/47
Use of Consumer Price Index
Very useful in wage negotiations, wage contracts and
dearness allowance adjustment in many countries.
At government level, the index numbers are used for wage
policy, price policy, rent control, taxation and general
economic policies.
Change in the purchasing power of money and real can be
measured.
Index numbers are also used for analyzing market price for
particular kinds of goods and services.
Conceptualization By Soumen Roy 42
8/4/2019 Statistics - Index Number
http://slidepdf.com/reader/full/statistics-index-number 43/47
Method of Constructing
Consumer Price Index
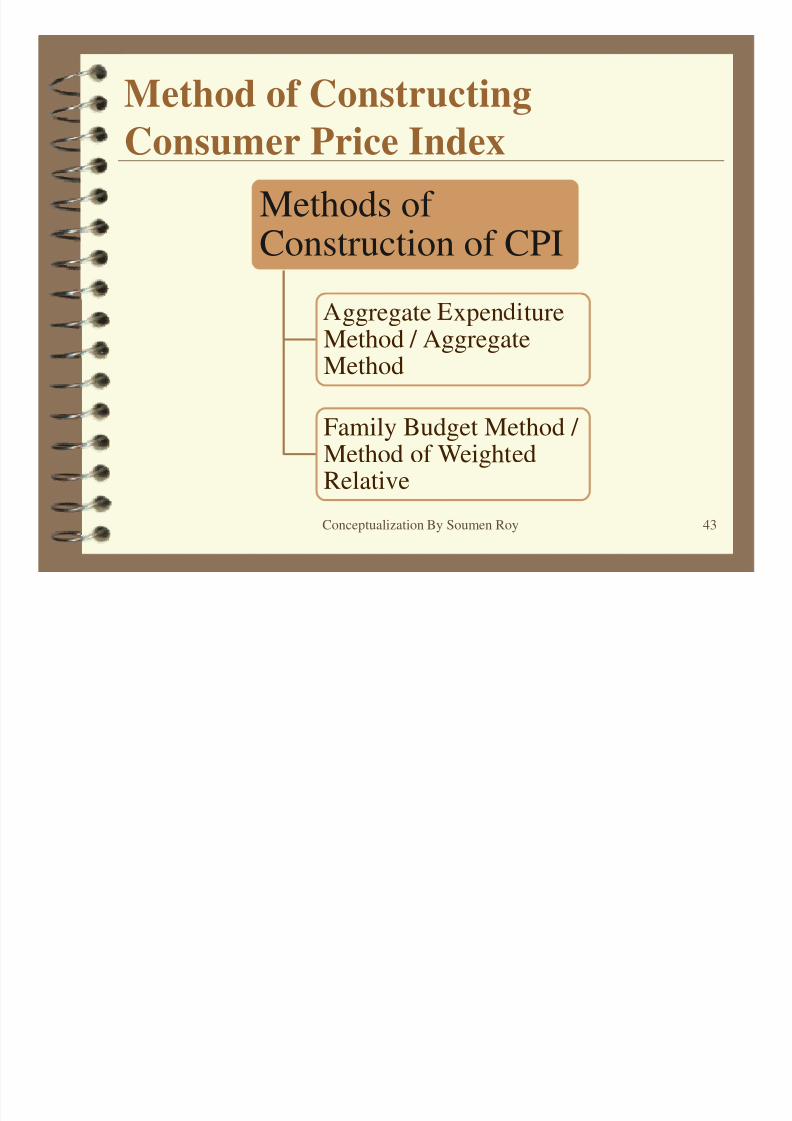
Methods of Construction of CPI
ggregate xpen tureMethod / AggregateMethod
Family Budget Method / Method of WeightedRelative
Conceptualization By Soumen Roy 43
8/4/2019 Statistics - Index Number
http://slidepdf.com/reader/full/statistics-index-number 44/47
Method of Constructing
Consumer Price Index
Aggregate Expenditure method: This method is based upon the
Laspeyre’ s method . It is widely used. The quantities of commoditiesconsumed by a particular group in the base year are the weight. The
formula is Consumer Price Index number = ∑P1q0 / ∑P0q0
Famil Bud et method or Method of Wei hted Relatives: This
method is estimated aggregate expenditure of an average family on
various items and it is weighted. The formula is Consumer Price index
number = ∑Pw / ∑w, Where P = (P1 / P0 * 100) for each item. w =
value weight i.e., P0q0.
Note: “Weighted average price relative method” which we have
studied before and “Family Budget method” are the same for findingout consumer price index.
Conceptualization By Soumen Roy 44
8/4/2019 Statistics - Index Number
http://slidepdf.com/reader/full/statistics-index-number 45/47
Consumer Price Index
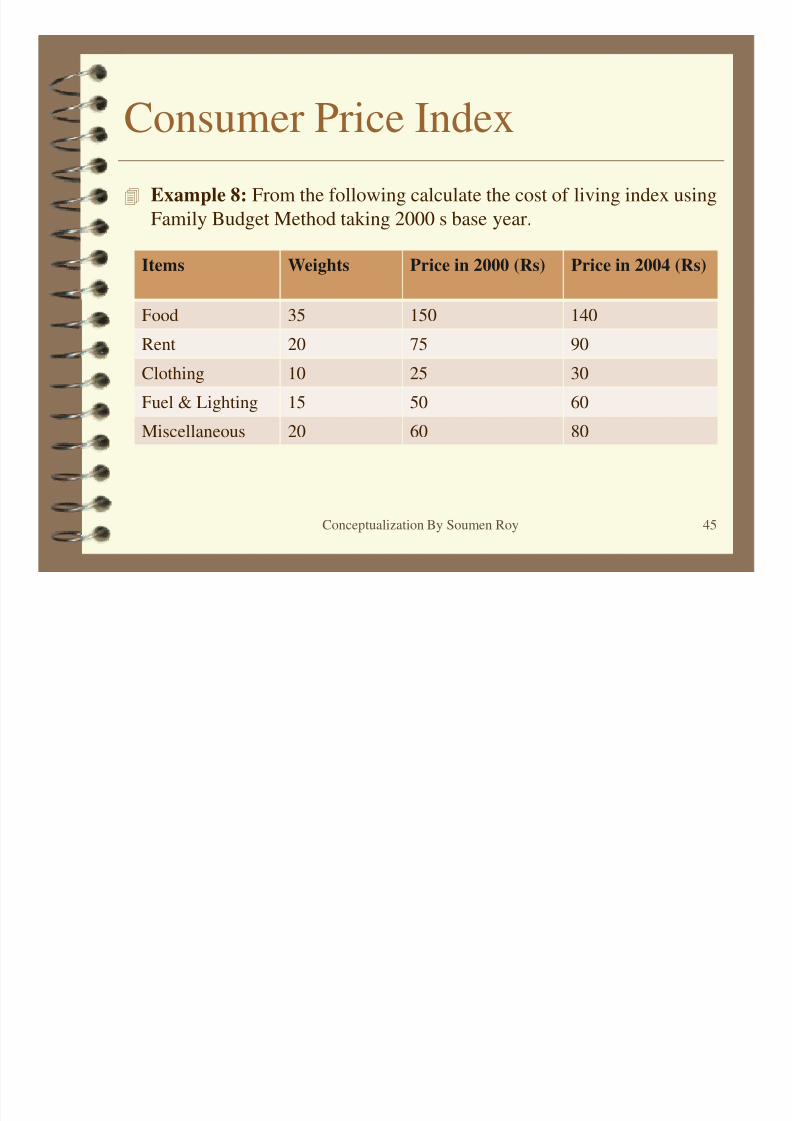
Example 8: From the following calculate the cost of living index using
Family Budget Method taking 2000 s base year.
Items Weights Price in 2000 (Rs) Price in 2004 (Rs)
Conceptualization By Soumen Roy 45
Food 35 150 140
Rent 20 75 90
Clothing 10 25 30
Fuel & Lighting 15 50 60
Miscellaneous 20 60 80
8/4/2019 Statistics - Index Number
http://slidepdf.com/reader/full/statistics-index-number 46/47
Consumer Price Index
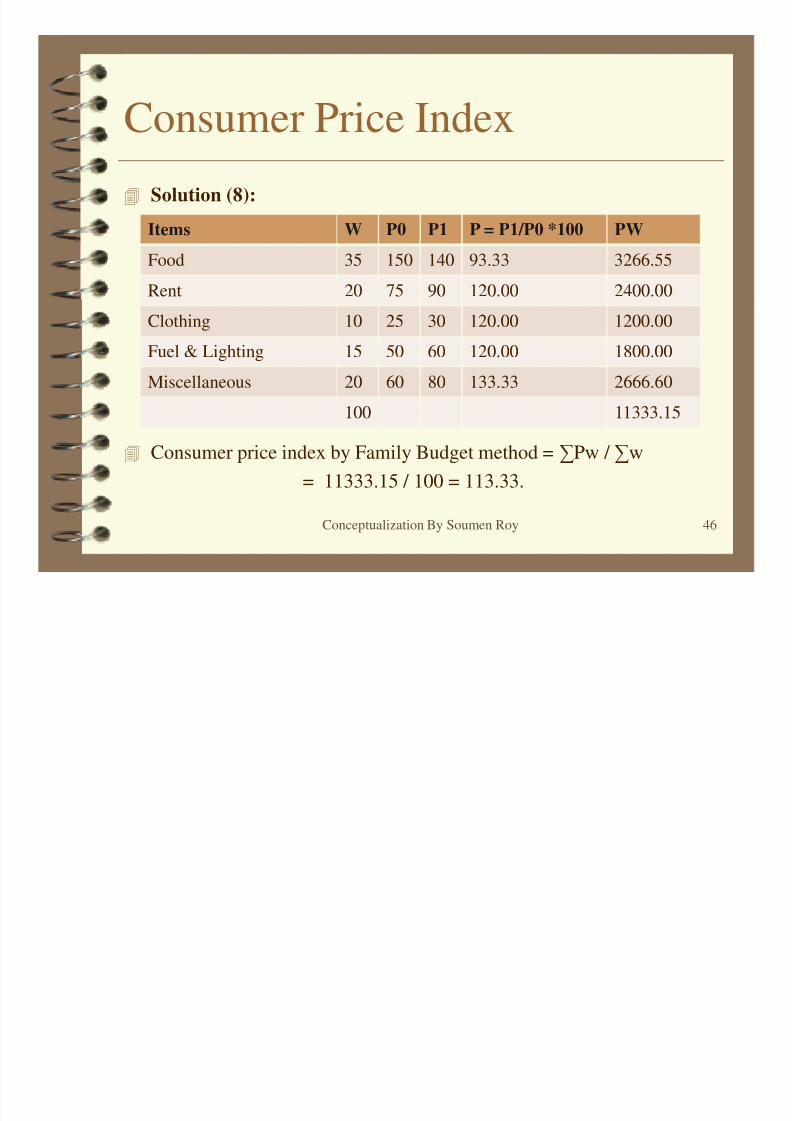
Solution (8):
Items W P0 P1 P = P1/P0 *100 PW
Food 35 150 140 93.33 3266.55
Rent 20 75 90 120.00 2400.00
Consumer price index by Family Budget method = ∑Pw / ∑w
= 11333.15 / 100 = 113.33.
Conceptualization By Soumen Roy 46
Clothing 10 25 30 120.00 1200.00
Fuel & Lighting 15 50 60 120.00 1800.00
Miscellaneous 20 60 80 133.33 2666.60
100 11333.15
8/4/2019 Statistics - Index Number
http://slidepdf.com/reader/full/statistics-index-number 47/47
Acknowledgements
rio s so rces from internet free from IPR
restriction.
Conceptualization By Soumen Roy 47


