Statistics Problems Measures of Central Tendency : - 1. The following data represents yield per acre (in kgs.) for a number of farms. Find the arithmetic mean. Yield Per Acre 700- 750 750- 800 800- 850 850- 900 900- 950 950- 1000 No. of Farms 32 43 55 22 17 18 Ans. 825.8 kgs. 2. Find arithmetic mean. Height in cms. 148- 152 152- 156 156- 160 160- 164 164- 168 168- 172 172- 176 No. of Person s 3 5 9 15 10 6 2 _ Ans. X = 162 cms. 3. The following is the distribution of net profits in thousands of Rs. of 650 factories in 2004-05. Find the quartiles. Profit in (lakhs of Rs.) 150- 175 175- 200 200- 225 225- 250 250- 275 275- 300 No. of Factories 100 115 125 120 100 90 Ans. Q 1 = Rs. 18858700, Q 2 = Rs. 22200000, Q 3 = 25687500
Transcript
Statistics Problems
Measures of Central Tendency: -
1. The following data represents yield per acre (in kgs.) for a number of farms.Find the arithmetic mean.
Yield Per Acre 700-750 750-800 800-850 850-900 900-950 950-1000No. of Farms 32 43 55 22 17 18
6. Find the standard deviation and coefficient of variation for the following data:
Daily CollectionIn Rs. (00)
2500-3000
3000-3500
3500-4000
4000-4500
4500-5000
No. of Agents 11 15 18 14 8
Ans. sd = Rs. 6280.4106, CV = 16.99
Correlation Analysis: -
1. Calculate Karl Pearsons’ coefficient of correlation for the following data:
x 17 8 12 13 10 12y 13 7 10 11 8 9
Ans. r = 0.9767
2. The distribution of marks in Adverting (x) and marks in Business Planning (y) for a group of ten students is given below. Calculate product moment coefficient of correlation.
3. The following data gives the experience (x) in years of eight machine operators and their performance ratings (y). Calculate the coefficient of correlation between them and interpret it.
x 16 13 17 4 3 11 7 14y 88 87 89 72 70 82 78 84
Ans. r = 0.9803, high degree imperfect positive correlation.
4. Find Pearson’s coefficient of correlation for the following data.
5. Find the coefficient of correlation for the following data.
Marks in Statistics 53 59 72 43 93 35 55 80Marks in Economics 35 49 63 36 15 28 38 71
Ans. 0.9676
Linear Regression
1. From the following data, find the regression equation and further estimate y if x = 16.
Ans. y = 9.76 + 0.66x, y = 20.32
2. The heights in cms of a group of mothers and daughters are given below. Find the regression equation and hence find the most likely height of a mother when daughter’s height is 164 cms.
Ans. y = 32.47 + 0.81x, y = 163.69
3. The following data gives the marks obtained at the preliminary examination (x) and the final examination (y) for a group of 10 students. Obtain the regression equation of y on x. Hence find the most probable marks at the final examination of a student who has scored 70 marks at the preliminary examination.
4. The following data gives the expenditure on advertising, expressed in hundreds of Rs. (x) and the expenditure on office staff, expressed in thousands of Rs. (y), for 7 different companies. Find the regression equation and hence estimate the expenditure on advertising when the expenditure on office staff is Rs. 97000.
x 129 137 138 135 139 134 145
x 3 4 6 10 12 13y 12 11 15 16 19 17
Height of Mother (x) 157 160 163 165 167 168 170 164Height of Daughter (y)
162 159 165 167 172 170 168 166
y 98 94 93 91 96 95 100
Ans. y = 72.05 + 0.17x, y = Rs. 94780.
5. The following data represents the figures in kgs for demands of two commodities A and B. Find the most probable demand for B when demand for A is 115 kgs.
Demand for A (x) 107 113 109 103 110 117 114Demand for B (y) 105 110 103 100 110 111 108
Ans. y = 22.15 + 0.77x, y = 110.7
Elementary Probability Theory
1. A box contains 20 tickets numbered 1 to 20. A ticket is drawn at random from the box. Find the probability that the number on the ticket drawn is (i) divisible by 3 (ii) not divisible by 5 (iii) divisible by 3 and 4 (iv) divisible by 3 or 4.
Solution: -(i) 0.3(ii) 0.8(iii) 0.05(iv) 0.5
2. From a well-shuffled pack of cards, a card is drawn at random; find the probability that the card drawn is (i) an ace, (ii) a heart card, (iii) a king of hearts.
Solution: -(i) 1/13(ii) 1/4(iii) 1/52
3. If two fair dice are rolled, find the probability that the sum of the numbers appearing on the uppermost faces of the dice is (i) greater than 7,(ii) a perfect square.
Solution: -(i) 5/12(ii) 7/36
4. Two fair dice are rolled, find the probability that the number on the uppermost face of the first dice is greater than that of the other.
Ans. 5/125. A card is drawn at random from a well-shuffled pack of cards. What is the
probability that the card drawn is (i) a spade, (ii) Ace of spades, (iii) a spade or a heart, (iv) a picture card?
Ans. (i) 1/4 (ii) 1/52, (iii) 1/2, (iv) 3/13
6. Two cards are drawn from a well-shuffled pack of cards. What is the probability that (i) both are red cards, (ii) both are picture cards, (iii) one is a heart card and the other is a club, (iv) both are kings, (v) one of them is an ace card.
7. From a well-shuffled pack of cards, two cards are drawn at random one after the other without replacement. Find the probability that:
(i) the first card is a king and the other a queen,(ii) the least one of them is a king card,(iii) both the cards are of the same colour.
Solution: -
(i) 4/663 (ii) 33/221(iii) 1/2
8. A box contains 5 red and 4 blue balls and another box contains 4 red and 7 blue balls. A ball is selected t random from the first box and without noting the color put in the other. A ball is then drawn from the second box. What is the probability that it is blue?
Solution: -
67/108
9. From the past experience it is known that A can solve 3 examples out of given 5 and B can solve 4 examples out of given 7. An example is given to both of
them to solve independently. Find the probability that (i) the example remains unsolved; (ii) the example is solved, (iii) only one of them solves the example.
Solution: -
(i) 6/35(ii) 29/35(iii) 17/35
10. The odds are 3 to 2 against person A’s living till he is 70 years old and whose age now is 50 years. The odds are 3 to 4 in favour of person B’s living till he is 60 years and whose age now is 40 years. What is the chance that at least one of those persons will be alive 20 years hence?
Solution: -
23/35
11. From a well-shuffled pack of cards two cards are drawn one after the other (a) with replacement, (b) without replacement, find the probability that:
(i) the first card is a diamond and the other a spade,(ii) one of them is a king and other a queen,(iii) both the cards are from the same suit,(iv) at least one of them is an ace.
Ans.: -
(a) (i) 1/16, (ii) 2/13, (iii) 1/4, (iv) 25/169(b) (i) 13/204, (ii) 8/663, (ii) 4/17, (iv) 33/221
12. A box contains 6 white and 7 black balls and the other box contains 5 white and 3 black balls. A ball is selected at random from the first box and without noting the colour put in the other. A ball is then selected from the second box; find the probability that is white.
Ans.: -
71/117
13. The contents of two identical urns are 2 white, 3 black balls and 3 white, 4 black balls respectively. One urn is selected at random and two balls are
drawn from it. What is the chance that the balls drawn are one white and one black?
Ans.: -
41/70
14. An urn contains 4 blue and 3 green balls. A ball is drawn at random from the urn; its color is noted and kept aside. Two balls of opposite color are added to the urn. A ball is then drawn from the urn; find the probability that the ball is green.
Ans.: -
13/28
15. The odds in favour of a hitting a target are 4:3 and odds against B hitting a target are 2:3. If both of them shoot at the target independently, find the probability that the target is hit.
Ans.: -
29/35
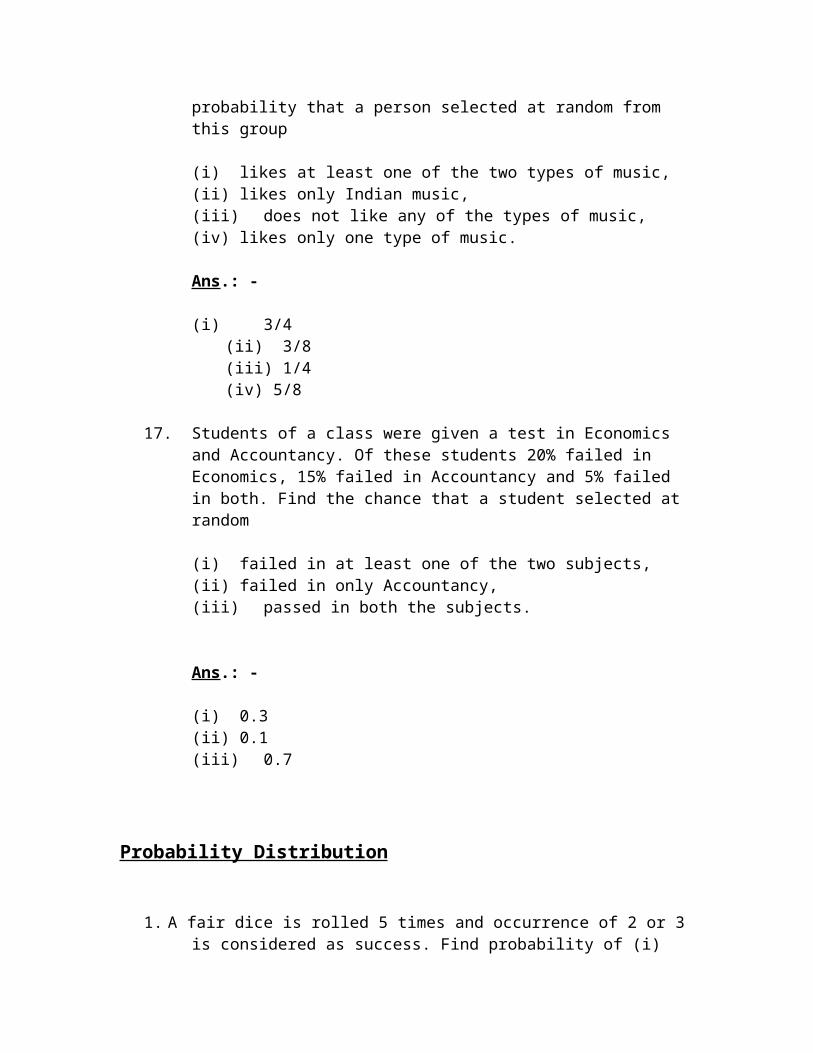
16. In a group of 80 persons, 30 like Western music, 40 like Indian music and 10 like both. Find the probability that a person selected at random from this group
(i) likes at least one of the two types of music,(ii) likes only Indian music,(iii) does not like any of the types of music,(iv) likes only one type of music.
Ans.: -
(i) 3/4 (ii) 3/8 (iii) 1/4 (iv) 5/8
17. Students of a class were given a test in Economics and Accountancy. Of these students 20% failed in Economics, 15% failed in Accountancy and 5% failed in both. Find the chance that a student selected at random
(i) failed in at least one of the two subjects,(ii) failed in only Accountancy,
(iii) passed in both the subjects.
Ans.: -
(i) 0.3(ii) 0.1(iii) 0.7
Probability Distribution
1. A fair dice is rolled 5 times and occurrence of 2 or 3 is considered as success. Find probability of (i) exactly one success, (ii) at least 4 successes, (iii) mean.
Ans.: -
(i) 80/243,(ii) 11/243,(iii) 5/3.
2. The incidence of certain disease is such that on an average 20% of workers suffer from it. If 5 workers are selected at random, find the probability that (i) exactly 2 workers suffer from the disease, (ii) not more than 2 workers suffer from the disease.
Ans.: -
(i) 128/625,(ii) 2944/3125.
3. In an examination 60% candidates were unsuccessful. What is the probability that out of 4 candidates at least 3 passed the examination?
Ans.: -
112/625
4. Suppose that half of the families of a town are subscribers of cable network. 100 investigators are appointed to find out its truth. Each investigator interviewed 10 families. How many investigators are expected to report that three or less families interviewed by them are subscribers of cable network?
Ans.: -
175. An experiment succeeds twice as often a sit fails. What is the probability that in
next five trails there will be (i) three successes, (ii) at least 3 successes?
Ans.: -
(i) 80/243,(ii) 64/81.
Normal Distribution
1. 1500 candidates appeared for a certain examination. The mean marks were 58 with a standard deviation of 5 marks.
Assuming the distribution of marks to be NormalFind: -
(i) the proportion of students securing more than 63 marks.(ii) The number of students securing marks between 60 and 68.(iii) The percentage of students with marks below 53.
Solution: -
(i) 0.1587(ii) 4.83(iii) 15.87
2. If the weights of 10000 soldiers in a regiment are normally distributed with a mean of 72 kgs and a standard deviation of 5 kgs how many soldiers have weights above 80 kgs? Also find the percentage of soldiers with weights between 70 and 77 kgs.
Solution: -
(i) 548(ii) 49.67
3. Average yield of a certain crop was found to be 20.5 kgs per plot with
standard deviation 3.2 kgs. Assuming Normal distribution, (i) how many plots out of 1000 will have a yield of 25 kgs or more (ii) what percentage of plots will yield between 17.3 kgs and 26.9 kgs.
Ans.: -
(i) 79 plots(ii) 81.85%
4. A firm has 300 accounts which are normally distributed with a mean of Rs. 10,000 and standard deviation of Rs. 1000. Find: -(i) The number of accounts with amounts lying between Rs. 8000 and Rs.
11000.(ii) The number of accounts with an amount of Rs. 7500 or less.
Ans.: -
(i) 2456(ii) 19.
5. A survey of 10,000 T.V. sets revealed that the life in hours of T.V. picture tubes is normally distributed with a mean of 1000 hrs and a standard deviation of 100 hrs.(i) How many picture tubes lasted more than 800hrs?(ii) How many lasted between 1000 hrs & 11000 hrs?(iii) Find the percentage of tubes with life between 800 hrs and 1000 hrs.
Ans.: -
(i) 9773(ii) 3413(iii) 47.73
6. The arithmetic mean of purchases per day by a customer in a store is Rs. 25 with a standard deviation of Rs. 10. If on a particular day, 100 customers purchased worth Rs. 37.80 or more find the total number of customers who purchased from the store that day, assuming normal distribution (1000).
7. In an intelligence test administered on 1000 students, the average score was 42 and the standard deviation was 6. Assuming Normal distribution, find: -
(i) The number of students exceeding a score of 54.(ii) The score exceeded by the top 100 students.(iii) The score below which the scores of 100 students with minimum
makes lie.
Ans.: -
(i) 23(ii) 49.5(iii) 34.5
Problems on Poisson Distribution
1. If 2 percent of electric bulbs manufactured by a certain company are defective, find the probability that in a sample of 200 bulbs,
(i) less than 2 bulbs, (ii) more than 3 bulbs, are defective.
(Given e-4 = 0.0183).
Solution: -
(i) 0.0915(ii) 0.567
2. Records show that the probability is 0.00002 that a car will have a flat tyre while driving over a certain bridge. Use the Poisson Probability distribution to determine the probability that among 20,000 cars driven over this bridge, not more than one will have a flat tyre.(Given e-0.2 = 0.819, and e-0.4 = 0.670)
Solution:-
0.9380
3. A local electrical appliances shop has found from experience that the demand for tube lights is distributed as Poison with a mean of 4 tube lights per week. If the shop keeps 6 tubes during a particular week, what is the probability that the demand will exceed supply during that week? (Given e-4 = 0.0183).
Solution:-
0.1114
4. It is known from past experience that in a certain plant there are on the average 4 industrial accidents per month. Find the probability that in a given month there will be les than 4 accidents. (e-4 = 0.0183).