60
Elena Zamagni Istituto di Ematologia “Seragnoli” Università di Bologna Stato dell’arte: dalle opzioni terapeutiche alla strategia terapeutica nel 2017
| Date post: | 27-Feb-2019 |
| Category: |
Documents |
| Upload: | nguyenminh |
| View: | 217 times |
| Download: | 0 times |

Elena Zamagni
Istituto di Ematologia “Seragnoli”
Università di Bologna
Stato dell’arte: dalle opzioni terapeutiche
alla strategia terapeutica nel 2017

Eligibility for ASCT
Yes No
First option: VMP, Rd, or MPT
Second option: VCD, VD, VTD
Other option: BP, CTD
Induction: 3-drug regimens
VTD
VCD
RVD
PAD
200 mg/m2 Melphalan followed by ASCT
Short-term consolidation
VTD
RVD
Maintenance
Lenalidomide
Bortezomib
FRONTLINE THERAPY
Frontline therapy of multiple myeloma.
Moreau P, Attal M, Facon T.
Blood. 2015 May 14;125(20):3076-3084. Epub 2015 Apr 2. Review

Actual treatment paradigm for patients who are eligible for ASCT
• Maximize the depth of response• Minimize the burden of residual tumor cells
Cavo M et al. Blood 2011;117(23):6063-73; Cavo et al. Blood 2012;120(1):9-19.
NOVEL AGENTS
Induction therapy
Autograft 1 or 2
Consolidation Maintenance

Meta-analysis: Bortezomib-based versus non-bortezomib-based induction prior to ASCT
• Integrated analysis (n=1572) of 3 randomized trials: Bortezomib-based versus non-bortezomib-based induction regimens
• Median follow-up ~37 months
Primary end point: Post transplant CR+nCR and PFS Sonneveld et al. J Clin Oncol 2013;31(26):3279-87.
Response rate
Bortezomib-
based induction
(n=775)
Non-bortezomib-
based induction
(n=772)
OR 95% CI P
Post-transplant (%)
CR+nCR 38 24 2.05 1.64–2.56 < 0.001
Bortezomib-
based induction
Non-bortezomib-
based inductionHR 95% CI P
Median PFS, mos 35.9 28.6 0.75 0.65–0.85 < 0.001
3-yr PFS, % 50.0 41.1

• VTD and VD have been approved by the EMA for the induction treatment of adult
patients with previously untreated multiple myeloma who are eligible for transplant
Cavo M et al. Blood 2011;117(23):6063-73.
Current standard induction regimens
Induction with
3 drugsBort-dex + IMiD / cyclo / doxo
VTD* / VRD
VCD
PAD*
CTD*/TAD*
2 drugs
Bort-dex*
RD/Rd
Thal-dex
Strong preference for 3-drug bortezomib-based regimens
Up to 35% CR and 60% ≥ VGPR
How to choose? Very few phase 3 comparisons

• 504 patients
• Comparable VGPR rate:
37% vs 34%
• SAE: 24% vs 33% (P= 0.04)
Mai EK, et al. Leukemia. 2015;29:1721-9
VCD vs PAD inductionGMMG-MM5 phase 3 trial

VTD (4-cycles)*
N = 169
VCD (4-cycles)†
N = 169
p-value
≥ CR 13.0% 8.9% 0.22
≥ VGPR 66.3% 56.2% 0.05
1. Moreau, P et al. Blood 2016;127:2569-74;
2. Cavo et al. Leukemia 2015;29(12):2429-31.
VTD vs VCD induction: Response
IFM 2013-04 trial (prospective, intent-to-treat analysis)1
‡ Bortezomib 1.3mg/m2 twice weekly + Thalidomide 100200mg/day + Dexamethasone 320mg/cycle (3 X 21-day cycles)§Bortezomib 1.3mg/m2 SC D1,4,8,11 + Cyclophosphamide 500 g/m2/day IV D1,8 + Dexamethasone 40 mg/day PO D 1, 2, 4, 5,8, 9,11, 12 (3 X 21-day cycles)
*Bortezomib 1.3 mg/m2/day SC D1,4,8,11 + Thalidomide 100 mg/day PO D1–21 + Dexamethasone 40 mg/day PO D1–4, D9–12†Bortezomib 1.3 mg/m2 /day SC D1,4,8,11 + Cyclophosphamide 500 g/m2 /day PO D1,8,15 + Dexamethasone 40 mg/day PO D1–4, D9–12
VTD (3-cycles)‡
N = 236
VCD (3-cycles)§
N = 236
p-value
≥ CR 19% 6% < 0.001
≥ VGPR 64% 37% < 0.001
GIMEMA MMY-3006 and EMN-02 studies (retrospective, case-matched analysis)2

% VTD, N = 169 VCD, N = 169 p-value
Any grade 3 or 4 AEs 63.9 68.2 0.40
Hematologic toxicities, grade 3 or 4
Anemia 4.1 9.5 0.05
Neutropenia 18.9 33.1 0.003
Thrombocytopenia 4.7 10.6 0.04
Non-hematologic toxicities, grade 3 or 4
Peripheral neuropathy 7.7 2.9 0.05
VTD vs VCD induction: Toxicity
Toxicities assessed according to NCI CTCAE, version 4.0.
1. Moreau, P et al. Blood 2016;127:2569-74;
2. Cavo et al. Leukemia 2015;29(12):2429-31.
VTD, N = 236 VCD, N = 236 p-value
Any grade 3 or 4 AE 27% 26% 0.754
Hematologic toxicities, grade 3 or 4
Anemia 0 7% <0.001
Neutropenia 2% 8% 0.003
Thrombocytopenia <1% 4% 0.006
Non-hematologic toxicities, grade 3 or 4
Peripheral neuropathy 7% 2% 0.009
IFM 2013-04 trial (prospective, intent-to-treat analysis)1
GIMEMA MMY-3006 and EMN-02 studies (retrospective, case-matched analysis)2

ASCT vs VRDIFM 2009 phase 3 trial
HDM, high-dose melphalan; IFM, Intergroupe Francophone Du Myelome. Attal M, et al. Blood. 2015;126:391.
700 patients < 66 years old with newly diagnosed, symptomatic MM
3x VRD
5x VRD
HDM + ASCT
2x VRD
Lenalidomide maintenance for 12 months

ASCT vs VRD: Best response and PFS
FCM, flow cytometry. Attal M, et al. N Engl J Med. 2017; in press.
VRD
(N=350)
ASCT
(N=350)
P-
value
CR, % 49 59
0.02
VGPR, % 29 29
PR, % 20 11
< PR, % 2 1
At least
VGPR, %
78 88 0.001
MRD –ve by
FCM, n (%)
228 (65) 280 (80) 0.001
PFSSecond interim analysis of IFM DFCI 2009 study

VMP x 4 cycles
n = 497
Melphalan (HDM)*
+ single or double ASCT
n = 695
VCD induction
x 3-4 cycles +
PBSC collection
VRD
consolidation
x 2 cycles
R1
No consolidation
*
Primary endpoint: PFS from R1 (VMP vs ASCT)
All pts received lenalidomide maintenance until relapse/progression
R2
* Randomization was to VMP vs HDM-1 (1:1) in centers with a single ASCT policy and to VMP vs HDM-1 vs HDM 1-2
(1:1:1) in centers with a double ASCT policy
Stratification: ISS I vs II vs III
ASCT vs VMPEMN02/HO95 MM phase 3 trial
Cavo M, et al. Blood. 2016;128:673; as presented at ASH 2016.
Cavo M, et al. J Clin Oncol. 2016;34 (suppl; abstr 8000); as presented at ASCO 2016.
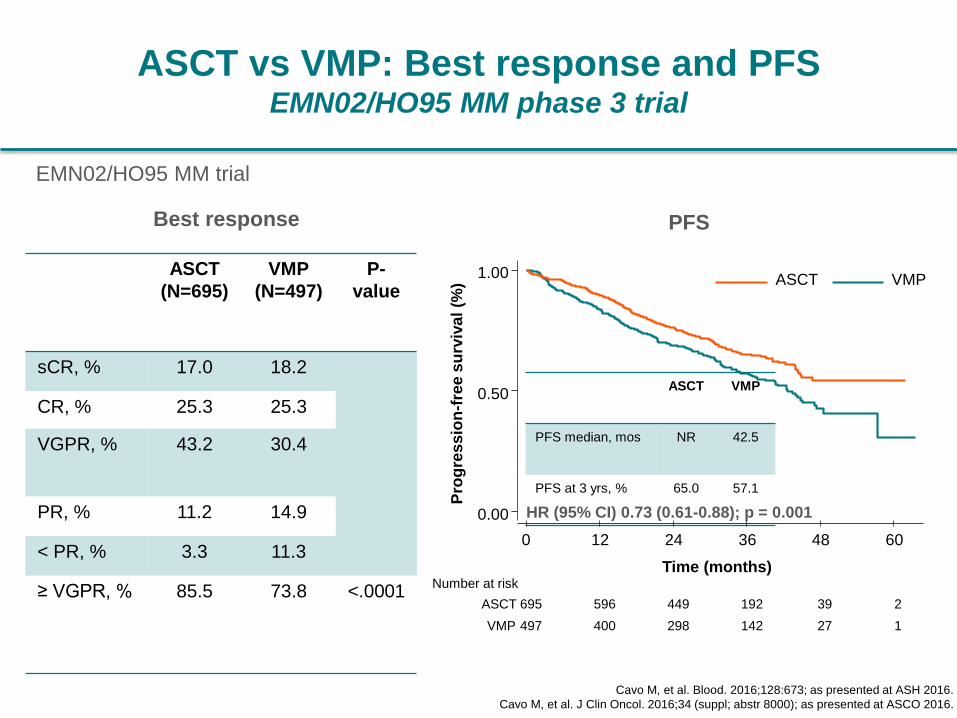
ASCT vs VMP: Best response and PFSEMN02/HO95 MM phase 3 trial
Cavo M, et al. Blood. 2016;128:673; as presented at ASH 2016.
Cavo M, et al. J Clin Oncol. 2016;34 (suppl; abstr 8000); as presented at ASCO 2016.
ASCT
(N=695)
VMP
(N=497)
P-
value
sCR, % 17.0 18.2
CR, % 25.3 25.3
VGPR, % 43.2 30.4
PR, % 11.2 14.9
< PR, % 3.3 11.3
≥ VGPR, % 85.5 73.8 <.0001
ASCT VMP
PFS median, mos NR 42.5
PFS at 3 yrs, % 65.0 57.1
HR (95% CI) 0.73 (0.61-0.88); p = 0.001
Best response PFS
EMN02/HO95 MM trial
0.00
0.50
1.00
Pro
gre
ss
ion
-fre
e s
urv
iva
l (%
)
497 400 298 142 27 1VMP
695 596 449 192 39 2ASCT
Number at risk
0 12 24 36 48 60
Time (months)
ASCT VMP

Upfront single vs double ASCT:EMN02/HO95 MM phase 3 trial
Median follow-up: 32 months (IQR 26-41) Cavo M, et al. Blood. 2016;128:991; as presented at ASH 2016.
HDM-2 HDM-1
PFS median, mos NR NR
PFS at 3 yrs, % 73.6 62.2
HR (95% CI) 0.70 (0.49-1.01); p = 0.05
0.00
0.50
1.00
Pro
bab
ilit
y (
%)
0 12 24 36 48 60
Months
HDM2 HDM1
208 171 132 50 9 0HDM1
207 185 145 69 19 1HDM2
Number at risk
PFS by randomization 1 (HDM-1 vs HDM-2)
Overall survival data
was not yet mature

HR (95% CI) 0.49 (0.24-0.99); p = 0.046
HDM-2 HDM-1
PFS median, mos 46.8 26.5
PFS at 3 yrs, % 64.9 41.4
Upfront single vs double ASCT
in patients with high-risk cytogenetics
Cavo M, et al. Blood. 2016;128:991; as presented at ASH 2016.
PFS by randomization 1 (HDM-1 vs HDM-2)EMN02/HO95 MM trial
0.00
0.50
1.00
Pro
bab
ilit
y (
%)
0 12 24 36 48 60
Months
HDM2 HDM1
43 34 20 7 1 0
38 35 28 9 2 1
HDM1
HDM2
Number at risk

EMN02 / HO95 MM 15
no consolidationVRDCox LR P=0.045 (adjusted for 1st random.)
N435450
F137115
no consolidation
VRD
At risk:435450
336371
187196
4952
no consolidation
VRD
0
25
50
75
100
Cum
ula
tive p
erc
enta
ge
months0 12 24 36
Progression free survival
HR = 0.78 (0.61-1.00)
Progression-free survival
Sonneveld P et al. ASH 2016

METANALYSIS OF LENALIDOMIDE MAINTENANCE RADOMIZED STUDIES
OS: Median Follow-Up of 80 Months
0.00 10 20 30 40 50 60 70 80 90 100 110 120
0.2
0.4
0.6
0.8
1.0
There is a 26% reduction in risk of death, representing an
estimated 2.5-year increase in median survival
605 578 555 509 474 431 385 282 200 95 20 1 0
604 569 542 505 458 425 350 271 174 71 10 0
Overall Survival, mos
Su
rviv
al P
rob
ab
ilit
y
Patients at risk
7-yr OS
62%
50%
N = 1209LENALIDOMIDE CONTROL
Median OS
(95% CI), mos
NE
(NE-NE)
86.0
(79.8-96.0)
HR (95% CI)
P value
0.74 (0.62-0.89)
.001

Problemi aperti:
• Ruolo del doppio trapianto autologo (dati
contrastanti studio EMN02 e STaMINA
(BMT-CTN)
• Ruolo del consolidamento (dati contrastanti
studio EMN02 e STaMINA)
• Disponibilità e durata ottimale della terapia
di mantenimento
• Terapia modellata sul rischio

• First option: VMP (EMA approved 2008), Ld
(EMA approved 2015), or MPT (EMA
approved 2008)
• Second option: VCD, VD, VTD
• Other options: BP, CTD
AVAILABLE FRONTLINE THERAPY IN NEWLY
DIAGNOSED MM PATIENTS NOT ELIGIBLE FOR ASCT
Fayers et al. Blood 2011
San Miguel JF, et al. N Engl J Med 2008;359:906-17
Mateos MV, J Clin Oncol 2010, April 5
Rajkumar SV, et al. Lancet Oncol 2010;11:29-37
Benboubker et al. N Engl J Med. 2014 Sep 4;371(10):906-17
Mateos MV et al. Haematologica 2015

VMP modifications:
- Bi weekly, VISTA (San Miguel, N Engl J Med 2008)
- Once a week (Mateos, Lancet Oncol 2010)
- Maintenance (Mateos, Blood 2012 & Blood 2014)
- Bortezomib sc (Moreau, Lancet Oncol 2011)

Future
MP based :
Daratumumab- VMP vs VMP: Alcyone
Ld based :
VRD: SWOG SO777 study (Durie B et al, Lancet 2017)
Ixazomib-Ld vs Ld: Tourmaline 2
Elotuzumab-Ld vs Ld: Eloquent 1
Daratumumab-Ld vs Ld: Maia
Pembrolizumab-Ld vs Ld: MK 3475
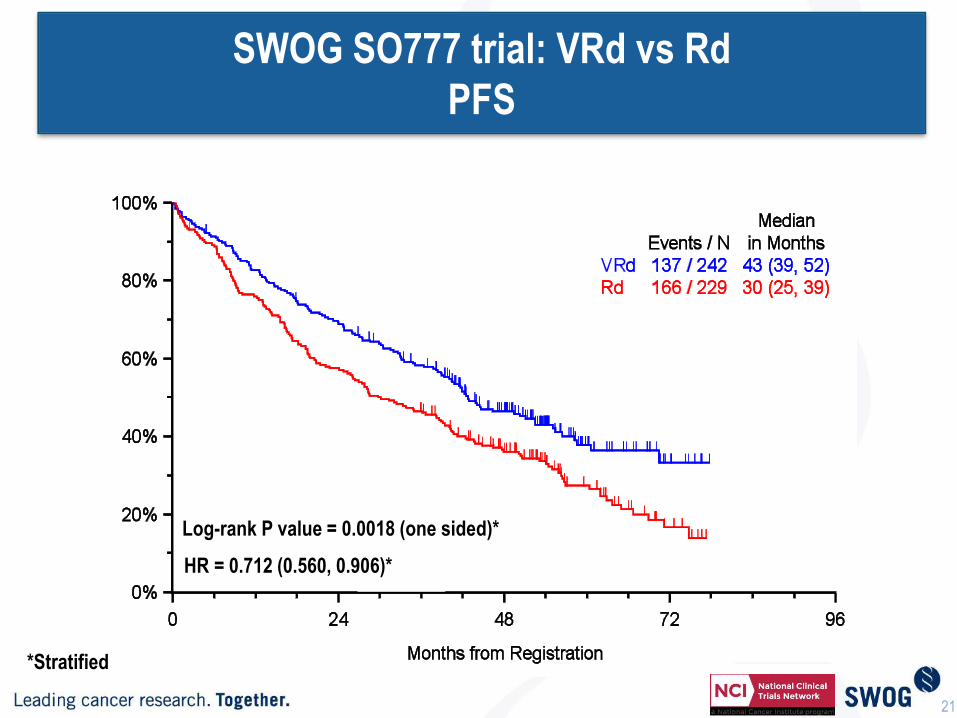
SWOG SO777 trial: VRd vs Rd
PFS
Log-rank P value = 0.0018 (one sided)*
*Stratified
21
HR = 0.712 (0.560, 0.906)*

Overall Survival By Assigned Treatment Arm
Log-rank P value = 0.0250 (two sided)*
HR = 0.709 (0.516, 0.973)*
22
*Stratified
SWOG SO777 trial: VRd vs Rd
OS

KRd induction followed by ASCT
a Phase 1/2 trial (N=53); extended treatment with KRd without (w/o) ASCT
b Phase 2 trial (N=72), extended KRd followed by ASCT Jakubowiak A, et al. As presented at EHA 2016; abstract S101.
ab

Newly diagnosed
multiple myeloma
patients eligible
for ASCT
N= 425
Endpoints:
• Primary:
VGPR
• Secondary:
ORR, DoR,
TTNT, OS,
MRD
Arm A: KRd Arm A: KRd
Arm B: KCd Arm B: KCd
One cycle = 28 days
Arm C: KRd
Induction (4 cycles) Consolidation (4 cycles)
Lenalidomide
Maintenance
One cycle = 28 days
Lenalidomide
+
Carfilzomib
R RTo Progression
or Intolerance
A
S
C
T
Total 12 Cycles
One cycle = 28 days
KRd vs KCd induction therapyFORTE study
www.clinicaltrials.gov; NCT02203643.
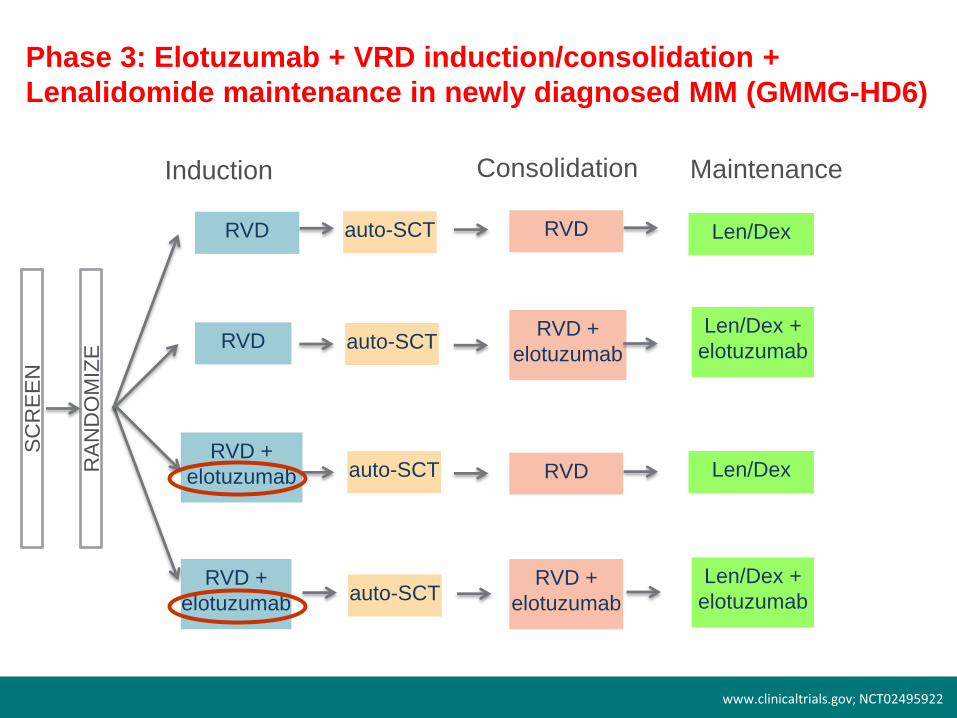
Phase 3: Elotuzumab + VRD induction/consolidation +
Lenalidomide maintenance in newly diagnosed MM (GMMG-HD6)
SC
RE
EN
RA
ND
OM
IZE
RVD
RVD
RVD +
elotuzumab
RVD +
elotuzumab
auto-SCT
auto-SCT
auto-SCT
auto-SCT
RVD
RVD +
elotuzumab
RVD
RVD +
elotuzumab
Len/Dex
Len/Dex +
elotuzumab
Len/Dex +
elotuzumab
Len/Dex
Induction Consolidation Maintenance
www.clinicaltrials.gov; NCT02495922
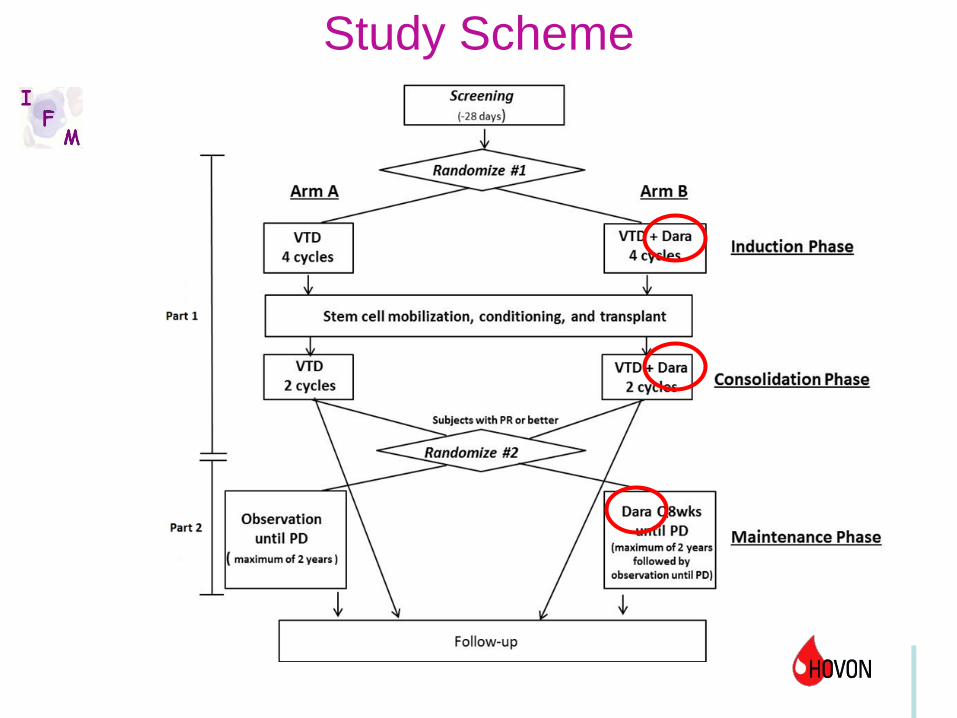
Study Scheme

TREATMENT AT RELAPSE:
DISEASE AND PATIENT RELATED FACTORS
The challenge when treating patients with relapsed or refractory disease is to select
the optimal treatment by BALANCING EFFICACY, TOXICITY and SEVERITY OF
RELAPSE.
It is necessary to consider:
DISEASE RELATED FACTORS: quality and duration of response to initial
therapy, class of agent used, indolent or aggressive relapse, high risk features such
as cytogenetic abnormalities (del17p, t(4;14), ampl1q21), extramedullary disease
(EMD), plasma cell leukemia;
PATIENT RELATED FACTORS: age, performance status (PS), comorbidities,
quality of life, renal function, hematopoietic reserve, prior drug exposure, ongoing
toxicities from prior therapies, peripheral neuropathy (PN), venous thromboembolism
(VTE).
Mohty B et al, Leukemia 2012; Ludwig H et al, Leukemia Research 2012;
Castelli R et al, Oncology 2013

Main randomized trials in R/R MM until 2015
1.Richardson PG, et al. N Engl J Med. 2005; 352:2487-2498 2.Orlowski RZ, et al J Clin Oncol. 2007: 3892-3901.
3.Weber DM, et al N Engl J Med. 2007; 357: 2133-2142 4. Dimopoulous M, et al. N Engl J med,. 2007; 357: 2123-2132, 5. San
Miguel et al, Lancet Oncol 2013; 14(11): 1055-66
Regimen ORR, % CR, % TTP/PFS,
mo
OS
Bortezomib vs
Dexamethasone1
38 vs 18 6 vs 1 6.2 vs 3.5 80% vs 66% @ 1
year
Bortezomib+Doxil
vs Bortezomib2
44 vs 41 4 vs 2 9.3 vs 6.5 76% vs 65% @ 15
mo
Lenalidomide-
dexamethasone vs
Dexamethasone3,4
61/60.2 vs
19./24
14.1/15.9 vs
0.6/3.4
11.1/11.3 vs
4.7/4.7
29.6/NR vs
20.2/20.6 mo
Pomalidomide –
dexamethasone vs
Dexamethasone5
31 vs 10 1 vs 0 4 vs 1.9 12.7 vs 8.1 mo
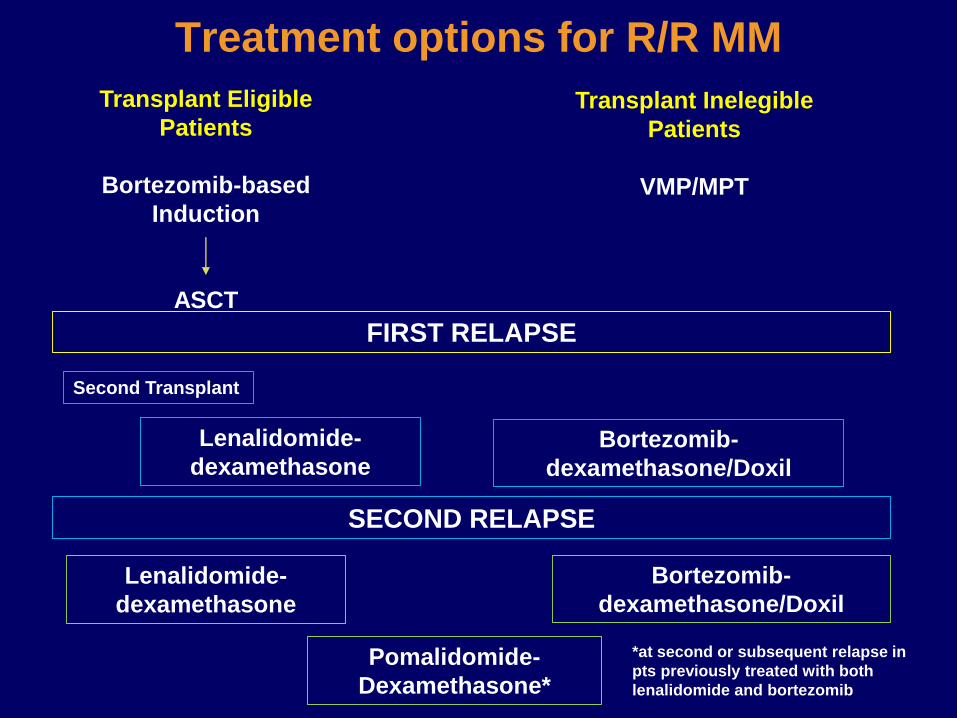
Treatment options for R/R MM
Transplant Eligible
Patients
Bortezomib-based
Induction
ASCT
Transplant Inelegible
Patients
VMP/MPT
FIRST RELAPSE
Lenalidomide-
dexamethasoneBortezomib-
dexamethasone/Doxil
SECOND RELAPSE
Second Transplant
Lenalidomide-
dexamethasone
Bortezomib-
dexamethasone/Doxil
Pomalidomide-
Dexamethasone*
*at second or subsequent relapse in
pts previously treated with both
lenalidomide and bortezomib

RETREATMENT WITH BORTEZOMIB
Knopf K et al, ASH 2012
META-ANALYSIS of the efficacy and safety of Bortezomib retreatment
in patients with multiple myeloma
ORR,
%
TTP,
months
OS,
months
PN G 3-4,
%
All patients (n = 1051) 39 7,5 16,6 3
Prior therapies:
≤ 4> 4
4329
8,27,1
13,320,0
Therapy:
- Bortezomib ± Dex (5 studies)- Combination (18 studies)
5136
7,97,1
19,216,1
Only relapsed not refractory
to Bortezomib
57 8,5 19,7

Bortezomib Carfilzomib Ixazomib Marizomib
Structure &
chemical
class
Boronate3 Epoxyketone3 Boronate3 Lactam/β-lactone3
Type of
InhibitionReversible4 Irreversible4 Reversible4 Irreversible4
Mechanism
of Action
•Inhibits preferentially
β5, but also β1 and
β22
•Formation of
tetrahedral
intermediate with side-
chain hydroxyl groups
(with proteasome and
other classes of
proteases)6
•Inhibits preferentially
β5, but also β1 and
β22
•Formation of covalent
adduct with N-
terminal threonine
active site
(exclusively within the
proteasome)6
•Inhibits
preferentially
β5, but also β1
and β22
•Inhibits all three
proteolytic
activities, with
IC50 values in
the nM range5
Route of
Administrati
on
Intravenous,
subcutaneous4 Intravenous3 Oral4 Intravenous4
Proteasome inhibitors
1 Mujtaba and Dou. Discov Med 2011;12(67):471-80; 2 Muz et al., Drug Des Devel Ther 2016;10:217-26; 3
Wang. Oncology (Williston Park) 2011; 25 Suppl 2:19-24; 4 Kurtin and Bilotti. J Adv Pract Oncol
2013;4(5):307-21; 5 Potts et al.,
Curr Cancer Drug Targets 2011;11(3):254-84; 6 Arastu-Kapur et al. Clin Cancer Res 2011;17:2734-43.
Proteasome inhibitors vary by chemical class, mechanism of action, type of inhibition1-6

Monoclonal antibodies
Target Antibody Mechanism of
action
Activity as
single
agent
Activity/under
evaluation in
combo
CS1
(SLAM
F7)
Elotuzumab
(Humanized IgG1k)
ADCC
Enhance NK
activity
Interference with
cell interaction
- + VD
+ Rd
CD38 Daratumumab
(Fully human IgG1k) ADCC
CDC
ADCP
Direct induction
of apopotosis
Modulation CD38
function
+ + V-based
+ Rd
+ Pd
Isatuximab
(SAR650984; chimeric
IgG1k)
+ + VCD
+ Rd
MOR202
(fully human IgG1l)
+
MM: multiple myeloma; ADCC: antibody depandent cell-mediated cytotoxicity; ADCP: antibody depedent cell-
mediated phagocytosis; CDC; complement dependent cytotoxicity; VD: bortezomib-dexamethasone; Rd:
lenalidomide;dexamethasone; Pd: pomalidomide-dexamethasone; VCD: bortezomib-cyclophosphamide-
dexamethasone; V: bortezomib

Relapse following VMP or VTD/VCD based ASCT

• Lenalidomide-dex
• Lenalidomide-dex + third agent
• Carfilzomib (ASPIRE)
• Elotuzumab (ELOQUENT)
• Ixazomib (TOURMALINE)
• Daratumumab (POLLUX)

1.0
0.8
0.6
0.4
0.2
0.0
Pro
port
ion S
urv
ivin
g
Without
Pro
gre
ssio
n
KRd
Rd
0 6 12 18 24 30 36 42 48
Months Since Randomization
KRd Rd
(n=396) (n=396)
Median PFS, mo 26.3 17.6
HR (KRd/Rd) (95% CI) 0,69 (0.57–0.83)
P value (one-sided) <0.0001
No. at Risk:
KRd
Rd
396 332 279 222 179 112 24 1
396 287 206 151 117 72 18 1
Stewart K et al, NEJM 2015
ASPIRE: Carfilzomib, Lenalidomide, and Dexamethasone (KRd) vs Lenalidomide and Dexamethasone (Rd) PFS

Safety: KRd vs Rd
Category
KRd
(n=392
)
Rd
(n=389)
Median treatment
duration, weeks88.0 57.0
Any AE, %
Grade ≥3 treatment-
emergent AE
96.9
83.7
97.2
80.7
Treatment
discontinuations, %
PD
AE
69.9
39.8
15.3
77.9
50.1
17.7
Serious AE, % 59.7 53.7
Deaths within 30 days
of last dose, %
PD
Aes
7.7
0.5
6.9
8.5
1.3
6.9
AE, adverse event; KRd, carfilzomib with lenalidomide and weekly dexamethasone; Rd, lenalidomide
and weekly dexamethasone.
Stewart AK, et al. N Engl J Med 2015;372:142–52.
Adverse event of
interest, %
KRd (n=392) Rd (n=389)
All
Grade
Grade
≥3
All
Grade
Grade
≥3
Dyspnoea 19.4 2.8 14.9 1.8
Peripheral
neuropathy† 17.1 2.6 17.0 3.1
Hypertension 14.3 4.3 6.9 1.8
Acute renal failure† 8.4 3.3 7.2 3.1
Cardiac failure† 6.4 3.8 4.1 1.8
Deep vein
thrombosis6.6 1.8 3.9 1.0
Ischaemic heart
disease† 5.9 3.3 4.6 2.1
Pulmonary
embolism3.6 3.1 2.3 2.3
Second primary
malignancy† 2.8 2.3 3.3 2.8
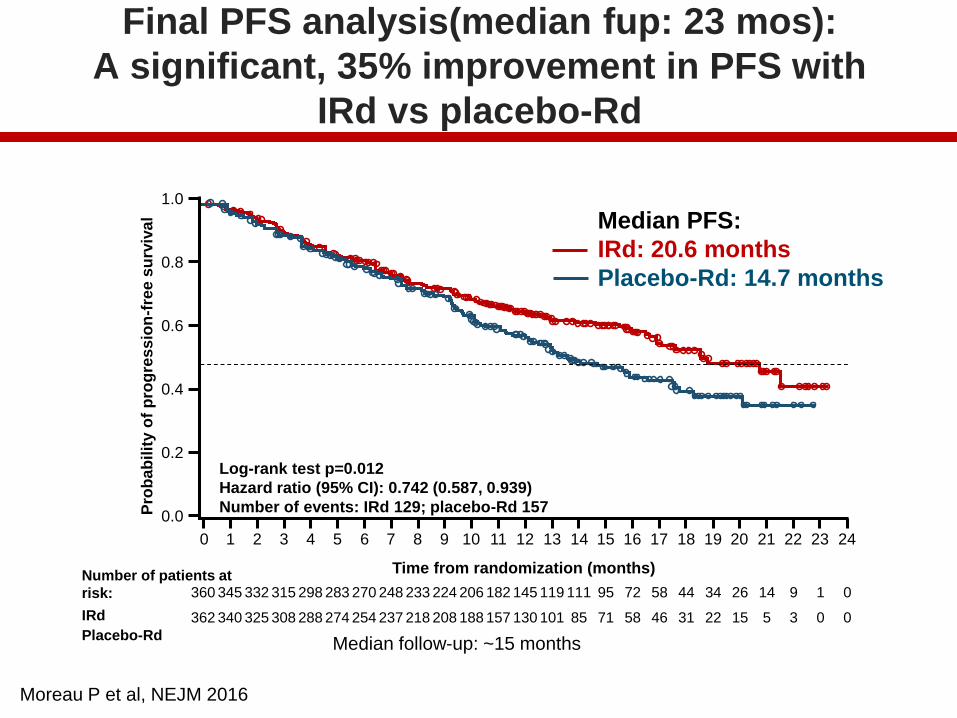
Final PFS analysis(median fup: 23 mos):
A significant, 35% improvement in PFS with
IRd vs placebo-Rd
Number of patients at
risk:
IRd
Placebo-Rd
360 345 332 315 298 283 270 248 233 224 206 182 145 119 111 95 72 58 44 34 26 14 9 1 0
362 340 325 308 288 274 254 237 218 208 188 157 130 101 85 71 58 46 31 22 15 5 3 0 0
1.0
0.8
0.6
0.4
0.2
0.0
0 1 2 3 4 5 6 7 8 9 10 11 12 13 14 15 16 17 18 19 20 21 22 23 24
Pro
ba
bilit
y o
f p
rog
res
sio
n-f
ree
su
rviv
al
Time from randomization (months)
Log-rank test p=0.012
Hazard ratio (95% CI): 0.742 (0.587, 0.939)
Number of events: IRd 129; placebo-Rd 157
Median PFS:
IRd: 20.6 months
Placebo-Rd: 14.7 months
Median follow-up: ~15 months
Moreau P et al, NEJM 2016

AEs after median follow-up of 23 months: increased
rates with IRd driven by low-grade events
IRd (N=361), % Placebo-Rd (N=359), %
Preferred terms All-grade Grade 3 Grade 4 All-grade Grade 3 Grade 4
AEs overlapping with lenalidomide
Diarrhea 45 6 0 39 3 0
Constipation 35 <1 0 26 <1 0
Nausea 29 2 0 22 0 0
Vomiting 23 1 0 12 <1 0
Rash 36 5 0 23 2 0
Back pain 24 <1 0 17 3 0
Upper respiratory
tract infection23 <1 0 19 0 0
Thrombocytopenia 31 12 7 16 5 4
AEs with proteasome inhibitors
Peripheral
neuropathy
27 2 0 22 2 0
Peripheral edema 28 1 0 20 1 0
AEs with lenalidomide
Thromboembolism 8 2 <1 11 3 <1
Neutropenia 33 18 5 31 18 6
Moreau P et al, NEJM 2016

ELOQUENT-2: Elo Rd vs Rd
Progression-Free Survival
PFS analysis used the primary definition of PFS
E-Ld−treated patients had a 30% reduction in the risk of disease progression or
death; treatment difference at 1 and 2 years was 11% and 14%, respectively
0.0
0.1
0.2
0.3
0.4
0.5
0.6
0.7
0.8
0.9
1.0
380 2 4 6 8 10 12 14 16 18 20 22 24 26 28 30 32 34 36
No. of patients at risk:
E-Ld
Ld
321
325
303
295
279
249
259
216
232
192
215
173
195
158
178
141
157
123
143
106
128
89
117
72
85
48
59
36
42
21
32
13
12
7
7
2
57%
68%
27%
41%
1-year PFS 2-year PFS
PFS (months)
Pro
ba
bil
ity p
rog
res
sio
n f
ree
From N Engl J Med, Lonial S et al, Elotuzumab Therapy for Relapsed or Refractory Multiple Myeloma. Copyright © (2015) Massachusetts Medical Society. Reprinted with
permission
E-Ld Ld
HR 0.70 (95% CI 0.57, 0.85);
p=0.0004
Median PFS
(95% CI)
19.4 mo
(16.6, 22.2)
14.9 mo
(12.1, 17.2)
E-Ld
Ld
1
0
0
0
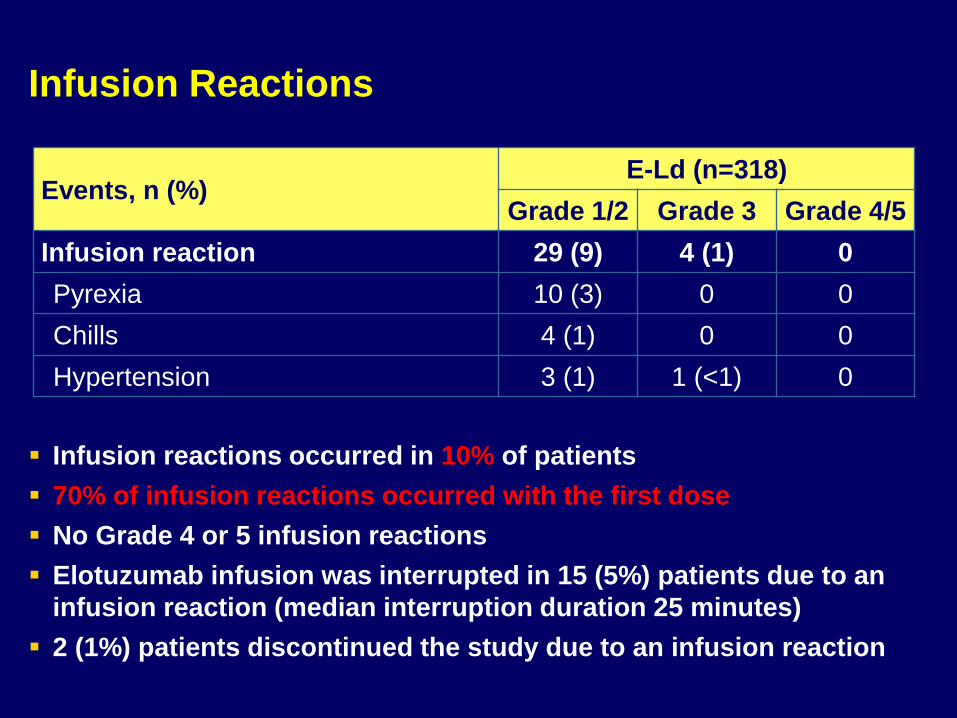
Infusion Reactions
Infusion reactions occurred in 10% of patients
70% of infusion reactions occurred with the first dose
No Grade 4 or 5 infusion reactions
Elotuzumab infusion was interrupted in 15 (5%) patients due to an
infusion reaction (median interruption duration 25 minutes)
2 (1%) patients discontinued the study due to an infusion reaction
Events, n (%)E-Ld (n=318)
Grade 1/2 Grade 3 Grade 4/5
Infusion reaction 29 (9) 4 (1) 0
Pyrexia 10 (3) 0 0
Chills 4 (1) 0 0
Hypertension 3 (1) 1 (<1) 0

POLLUX: Dara Rd vs Rd (ASH 2016)
41
Note: PFS: ITT population; ORR: response-evaluable population.*Kaplan-Meier estimate; aP <0.0001 for DRd vs Rd.
% s
urv
ivin
g w
ith
ou
t p
rog
ressio
n
0
20
40
60
80
100
0 3 6 9 12 18 21 27
283
286
249
266
206
249
181
237
159
227
132
194
5
15
0
1Rd
DRd
No. at risk Months
24
0
0
15
48
82
76%
49%
18-month
PFS*
Rd
DRd
Median:
17.5 months
HR: 0.37 (95% CI, 0.28-0.50; P <0.0001)
Ove
rall
respo
nse
ra
te, %
15
32
32
25
2312
23
8
0
10
20
30
40
50
60
70
80
90
100
DRd (n = 281) Rd (n = 276)
sCR
CR
VGPR
PR
ORR = 93%
ORR = 76%
P <0.0001
≥VGPR:
78%a
≥CR:
46%a
≥VGPR:
45%
≥CR:
20%
Median follow-up: 17.3 (range, 0-24.5) months
Responses continue to deepen in the DRd group with longer follow-up
Median:
not reached

Lenalidomide-Based Studies
POLLUXDRd [1]
PFS HR vs Rd (95% CI)
0.37 (0.27-0.52)
ORR 93%
≥ VGPR 76%
≥ CR 43%
Duration of response, mos
NE
OS HR vs Rd(95% CI)
0.64(0.40-1.01)
1. Dimopoulos M, et al. NEJM 2016.2. Stewart AK, et al. N Engl J Med. 2015;372:142-152.3. Lonial S, et al. N Engl J Med. 2015;373:621-631.4. Dimopoulos MA, et al. Blood. 2015;126:Abstract 28. 5. Moreau P, et al. N Engl J Med. 2016;374:1621-1634.
ASPIREKRd [2]
ELOQUENT-2ERd [3,4]
TOURMALINE-MM1
IxaRd[5]
0.69 (0.57-0.83)
0.73 (0.60-0.89)
0.74 (0.59-0.94)
87% 79% 78%
70% 34% 48%
32% 5% 14%
28.6 20.7 20.5
0.79(0.63-0.99)
0.77 (0.61-0.97)
NE
Not only efficacy!!!!

Lenalidomide-Based Studies
POLLUXDRd[1]
N° Median lines1 (1-11)82% 1-2
Prior Len (%) 18
Prior Bort (%) 86 (PI)
Refractory pop. (%) 28
Bort-refractory (%) 20
HR cyto (%) 9
1. Dimopoulos M, et al. NEJM 2016.2. Stewart AK, et al. N Engl J Med. 2015;372:142-152.3. Lonial S, et al. N Engl J Med. 2015;373:621-631.4. Dimopoulos MA, et al. Blood. 2015;126:Abstract 28. 5. Moreau P, et al. N Engl J Med. 2016;374:1621-1634.
ASPIREKRd[2]
ELOQUENT-2ERd[3,4]
TOURMALINE-MM1
IxaRd[5]
2 2 59% 1-2
20 5 12
66 68 69
UK 35 12 (7% primary)
15 22 NA
12 31 21

Lenalidomide-Based Studies: sub-groups analysis of PFS advantage over Rd of the triplet combination
POLLUXDRd [1]
HR overall population 0,37
Higher Age HR 0,11 (> 75 yr)
HR cyto@18 mos: 66% vs
85%
Moderate renal impairment (CreaCl 30-60)
UK
Refractory population HR 0,47
Bort exposure =
Bort refractory HR 0,50
1. Dimopoulos M, et al. NEJM 2016.2. Stewart AK, et al. N Engl J Med. 2015;372:142-152.3. Lonial S, et al. N Engl J Med. 2015;373:621-631.
.
ASPIREKRd [2]
ELOQUENT-2ERd [3,4]
TOURMALINE-MM1
IxaRd [5]
0,69 0,73 0,74
HR 0,87 (> 65 yr) 0,65 (≥ 65 yr)
Med PFS 23 vs29 mos
0,65Med PFS 21 vs
20,6 mos
UK (93% creaclear > 50)
0,56 (CreaClear < 60)
UK
UK 0,56 0,71
= = =
HR 0,79 vs 0,69 UK UK
.4. Dimopoulos MA, et al. Blood. 2015;126:Abstract 28.
5. Moreau P, et al. N Engl J Med. 2016;374:1621-1634.

Burden on Healthcare System and Patients
Ixazomib-Rd Carfilzomib-Rd Elotuzumab-Rd Dara-Rd
Route of
administration
PO IV IV IV
Dosing schedule Days 1, 8, and
15 of
28-day cycle
Days 1, 2, 8, 9, 15,
and 16 of
28-day cycle
Days 1, 8, 15, 22
of 28-day of cycles
1-2 then Days 1
and 15, cycle 3+
Days 1, 8, 15, 22
of cycles 1-2
Days 1, 15 of
cycles 3-6
Day 1 of cycle 7+
Hospital/clinic
visit
Every 4 ks Twice a k Weekly x 8 then
twice montly
Weekly x 8 then
twice monthly
Minimum clinic
visits based on
18 cycles
18 96 44 28
Administration
time in clinic/
hospital per visit
0 hours Over 2 hrs About 2- 5 hrs 3-6 hrs
Premedication N N Y Y
Prehydration N Additional IV
hydration needed
especially before
each dose in cycle
1, may be in other
cycles
N N

Which regimen to choose with Ld?
Elderly patient,
difficulties of access to
the hospital
Elderly patient, indolent
disease, biochemical
relapse, RI?, del 17p?
Young patient, no cardiac
co-morbidities, aggressive
relapse, need to achieve
MRD negativity (HR cyto)
KRd
Dara-Rd
Ixa-Rd
Elo-Rd

Relapse following Ld or lena maintenance

• Median follow-up: 11.2 months
• OS advantage with extended FUP (IMW New Delhi 2017)
1.0
0.8
0.6
0.4
0.2
0
Pro
po
rtio
n S
urv
ivin
g
With
out P
rog
ressio
n
0
Months Since Randomization
Kd
Vd
Kd
(n=464)
171 (37)
18.7
Vd
(n=465)
243 (52)
9.40.53 (0.44–0.65)
1-sided P<0.0001
Disease progression or death – n (%)
Median PFS – months
HR for Kd vs Vd (95% CI)
6 12 18 24 30
Dimopoulos D et al, Lancet Oncology 2016
ENDEAVOR: Carfilzomib and Dexamethasone (Kd) vs Bortezomib and Dexamethasone (Vd): PFS
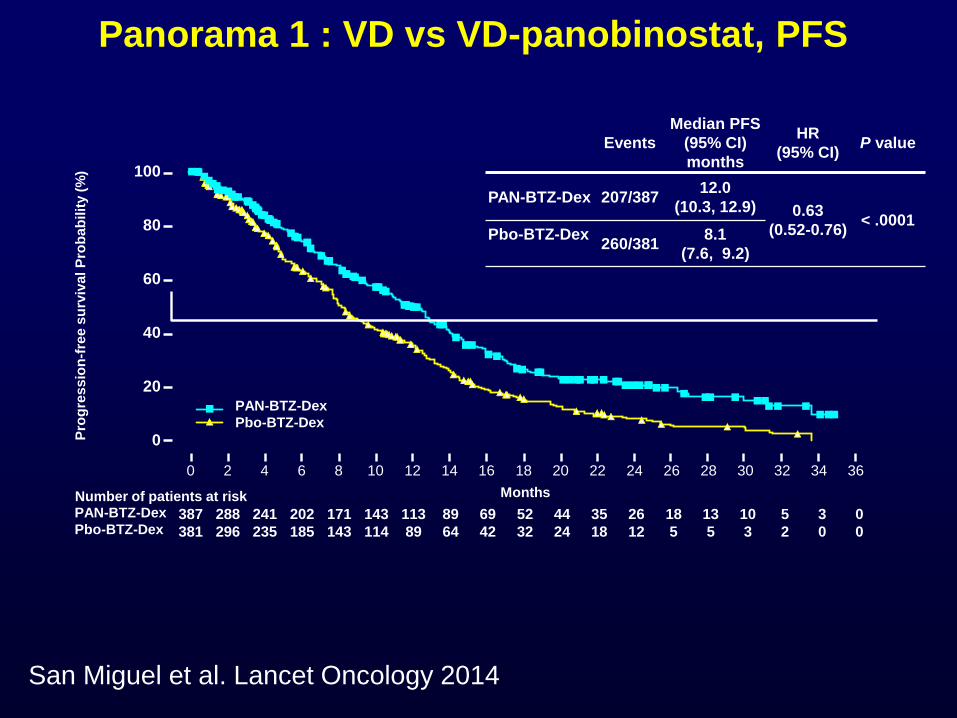
San Miguel et al. Lancet Oncology 2014
Panorama 1 : VD vs VD-panobinostat, PFS
100
80
60
40
20
0
0 2 4 6 8 10 12 14 16 18 20 22 24 26 28 30 32 34 36
387 288 241 202 171 143 113 89 69 52 44 35 26 18 13 10 5 3 0
381 296 235 185 143 114 89 64 42 32 24 18 12 5 5 3 2 0 0
MonthsNumber of patients at riskPAN-BTZ-Dex
Pbo-BTZ-Dex
Pro
gre
ssio
n-f
ree s
urv
ival P
rob
ab
ilit
y (
%)
Events
Median PFS
(95% CI)
months
HR
(95% CI)P value
PAN-BTZ-Dex 207/38712.0
(10.3, 12.9) 0.63
(0.52-0.76)< .0001
Pbo-BTZ-Dex 260/381
8.1
(7.6, 9.2)
PAN-BTZ-Dex
Pbo-BTZ-Dex

Non-Hematologic AEsGrade 3/4 Diarrhea and Asthenia/Fatigue Observed
aCombined incidence of hypoesthesia, muscular weakness, neuralgia, neuropathy peripheral, paraesthesia, peripheral sensory neuropathy,
polyneuropathy.
PAN-BTZ-Dex (n = 381) Pbo-BTZ-Dex (n = 377)
Preferred term – % All grades Grade 3/4 All grades Grade 3/4
Diarrhea 68.2 25.5 41.6 8.0
Peripheral neuropathya 60.6 17.6 67.1 14.6
Asthenia/fatigue 57.0 23.9 40.6 11.9
Nausea 36.2 5.5 20.7 0.5
Peripheral edema 28.6 2.1 19.1 0.3
Decreased appetite 28.1 3.1 12.5 1.1
Constipation 26.8 1.0 32.6 1.1
Pyrexia 26.0 1.3 14.9 1.9
Vomiting 25.7 7.3 13.0 1.3
Cough 21.3 1.0 18.6 0
• Discontinuation due to diarrhea (4.5%) and fatigue (2.9%) on PAN arm
PANORAMA 1

CASTOR: Dara Vd vs Vd (ASH 2016)
ITT, intent to treat.
Note: PFS: ITT population; ORR: response-evaluable population.aKaplan-Meier estimate.bP <0.0001 for DVd versus Vd. 51
Median (range) follow-up: 13.0 (0-21.3) months
Responses continue to deepen in the DVd group with longer follow-up
– An additional 7% achieved ≥CR with longer follow-up
HR: 0.33 (95% CI, 0.26-0.43; P <0.0001)
Median:
not reached
59.5%
21.5%
12-month PFSa
Vd
DVd
Median:
7.1 months
% s
urv
ivin
g w
ith
ou
t p
rogre
ssio
n
0
20
40
60
80
100
0 3 6 9 12 15 18 24
247
251
182
215
129
198
73
160
23
91
9
33
0
5
0
1Vd
DVd
No. at riskMonths
21
0
0
0
10
20
30
40
50
60
70
80
90
100
DVd (n = 240) Vd (n = 234)
OR
R, %
sCR
CR
VGPR
PR
ORRb = 84%
ORRb = 63%
P <0.0001
35%
19%
7%
34%
19%
8%2%
≥VGPR
62%b
≥CR
26%b
≥VGPR
29%
≥CR
10%
22%
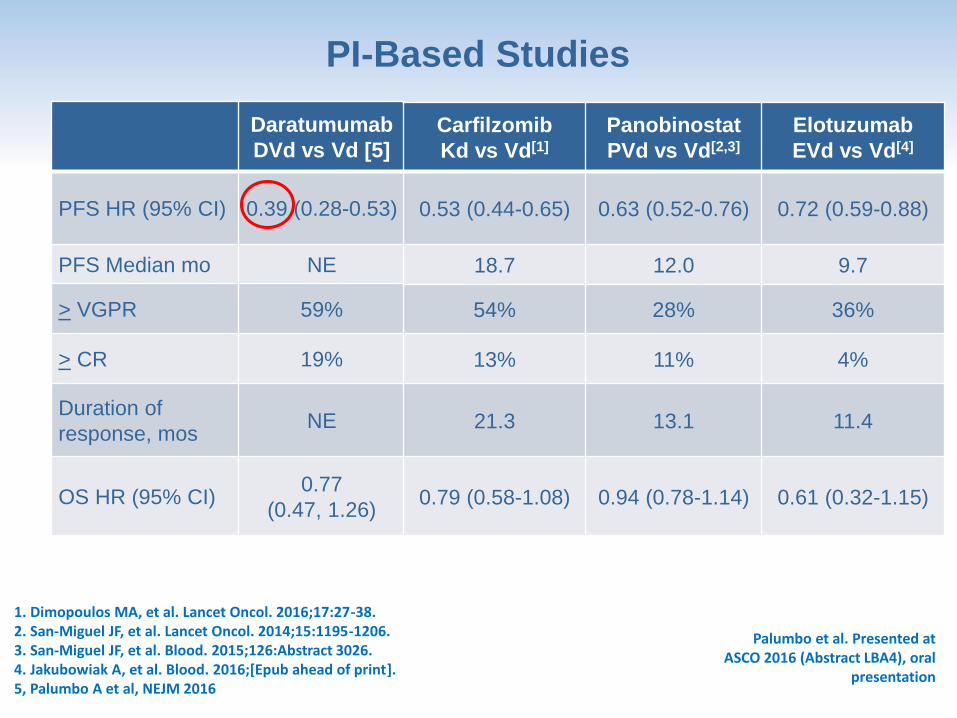
PI-Based Studies
Daratumumab
DVd vs Vd [5]
PFS HR (95% CI) 0.39 (0.28-0.53)
PFS Median mo NE
> VGPR 59%
> CR 19%
Duration of
response, mosNE
OS HR (95% CI)0.77
(0.47, 1.26)
Carfilzomib
Kd vs Vd[1]
Panobinostat
PVd vs Vd[2,3]
Elotuzumab
EVd vs Vd[4]
0.53 (0.44-0.65) 0.63 (0.52-0.76) 0.72 (0.59-0.88)
18.7 12.0 9.7
54% 28% 36%
13% 11% 4%
21.3 13.1 11.4
0.79 (0.58-1.08) 0.94 (0.78-1.14) 0.61 (0.32-1.15)
1. Dimopoulos MA, et al. Lancet Oncol. 2016;17:27-38.2. San-Miguel JF, et al. Lancet Oncol. 2014;15:1195-1206.3. San-Miguel JF, et al. Blood. 2015;126:Abstract 3026.4. Jakubowiak A, et al. Blood. 2016;[Epub ahead of print].5, Palumbo A et al, NEJM 2016
Palumbo et al. Presented at ASCO 2016 (Abstract LBA4), oral
presentation

Daratumumab
DVd vs Vd [5]
N° Median lines 2
Prior Len (%) 71
Prior PIs (%) 67
Refractory pop. (%) 30
Len-refractory (%) 30
HR cyto (%) 16 (del 17p)
8 (t 4;14)
Carfilzomib
Kd vs Vd[1]
Panobinostat
PVd vs Vd[2,3]
Elotuzumab
EVd vs Vd[4]
2 1 1
38 19 50
54 44 49
UK 35 UK
24 UK UK
21 5 NA
PI-Based Studies
Palumbo et al. Presented at ASCO 2016 (Abstract LBA4), oral
presentation
1. Dimopoulos MA, et al. Lancet Oncol. 2016;17:27-38.2. San-Miguel JF, et al. Lancet Oncol. 2014;15:1195-1206.3. San-Miguel JF, et al. Blood. 2015;126:Abstract 3026.4. Jakubowiak A, et al. Blood. 2016;[Epub ahead of print].5, Palumbo A et al, NEJM 2016

Adverse eventsCOMBINATION GRADE 3 / 4 (%)
ASPIRE
ELOQUENT
TOURMALINE
POLLUX
PANORAMA
ENDEAVOR
POLLUX
Rd + Carfilzomib
Rd + Elotuzumab
Rd + Ixazomib
Rd + Daratumumab
Vd + Panobinostat
Kd
Vd + Daratumumab
HYPERTENSION (4)
CARDIAC FAILURE (4)
ACUTE RENAL FAILURE (3)
INFUSION REACTION (1)
RASH (5)
INFUSION REACTION (5)
DIARRHEA (25)
FATIGUE (24)
VOMITING (7)
HYPERTENSION (9)
DYSPNEA (5)
CARDIAC FAILURE (5)
INFUSION REACTION (9)
HYPERTENSION (7)54

Beyond 1 – 3 prior lines

MM-003 trial: Pom-dex vs Dex
San Miguel et al, Lancet Oncol 2013;14:1055-66
Dimopoulos et al, Blood 2013 (suppl,abstr 408)

Cyclophosphamide : 400 mg oral D1, D8, D15Baz RC et al, Blood 2016
Phase II randomized trial of Pom-dex
vs Cyclo-Pom-dex: PFS

58
16 mg/kg (N = 148)
Response n (%) 95% CI
ORRClinical benefit (ORR + MR)VGPR or better (sCR+CR+VGPR)CR or better (sCR+CR)
46 (31.1)55 (37.2)20 (13.5)
7 (4.7)
23.7-39.229.4-45.58.5-20.11.9-9.5
sCRCRVGPRPRMRSDPDNE
3 (2.0)4 (2.7)
13 (8.8)26 (17.6)
9 (6.1)68 (45.9)18 (12.2)
7 (4.7)
0.4-5.80.7-6.8
4.8-14.611.8-24.72.8-11.2
37.7-54.37.4-18.51.9-9.5
• Median DOR = 7.6 (95% CI,
5.6-NE) months
• Median (range) time to
response = 0.95 (0.5-5.6)
months
• Of 10 patients with an initial PR,
7 went to on to achieve VGPR
with further treatment and 3
patients with an initial PR
achieved deeper responses of
CR (1 patient) and sCR (2
patients)
• Responses in 4 patients with an
initial VGPR continued to
deepen to CR (3 patients) and
sCR (1 patient)
CI, confidence interval; ORR, overall response rate; MR, minimal response; VGPR, very good partial response; CR, complete response; sCR, stringent complete response; PR, partial response; SD, stable disease; PD, progressive disease; NE, not evaluable.
Patients received a median of 5 prior lines of therapy
86.5% of patients were double refractory to a PI and IMiD
DARATUMUMAB SINGLE AGENT
1. Lokhorst HM, et al. N Engl J Med. 2015;373:1207-19.
2. Lonial S, et al. Lancet. 2016;387:1551-60.
3. Usmani SZ, et al. Blood. 2016;128:37-44.

Treatment options for R/R MMTransplant Eligible
Patients
Bortezomib-based
Induction
Autologous Transplant
Transplant Inelegible
Patients
VMP/MPT
Rd
FIRST RELAPSE
Rd, KRd, ERd,IRd, Dara-Rd Vd, EVd, Kd, Dara-Vd
SECOND RELAPSE
Second
Transplant
Rd,KRd,ERd,Ird, Dara-Rd Vd,EVd,Kd, Dara-Vd
Pomalidomide-
Dexamethasone
Kd
Daratumumab Single
Agent
Clinical trials(MoAbs, check-point
inhibitors, venetoclax,
selinexor, anti BCMA…)
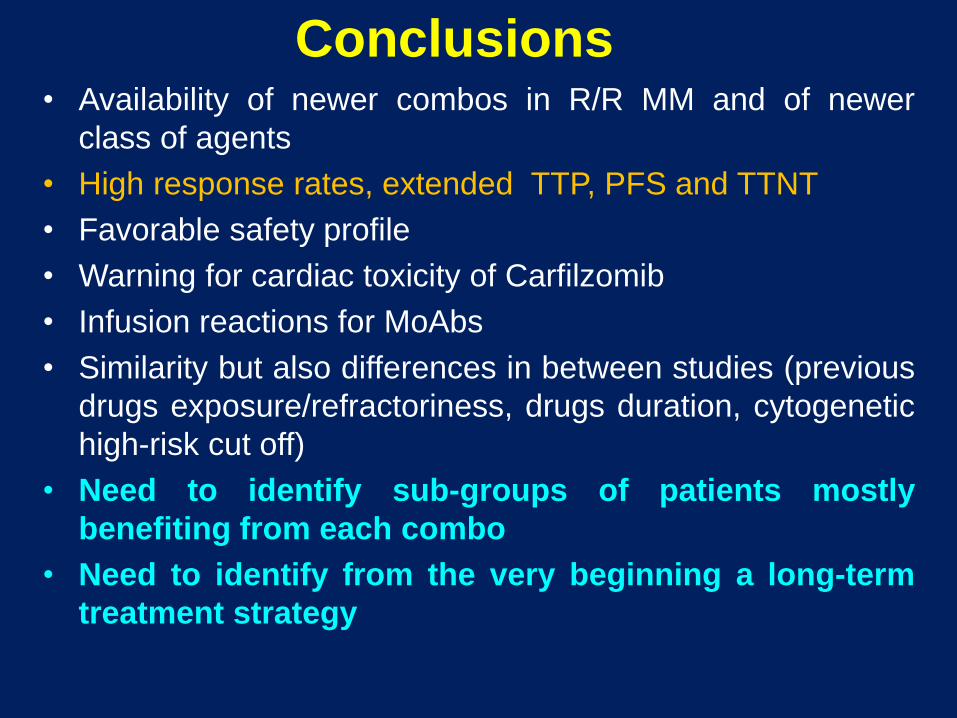
Conclusions• Availability of newer combos in R/R MM and of newer
class of agents
• High response rates, extended TTP, PFS and TTNT
• Favorable safety profile
• Warning for cardiac toxicity of Carfilzomib
• Infusion reactions for MoAbs
• Similarity but also differences in between studies (previous
drugs exposure/refractoriness, drugs duration, cytogenetic
high-risk cut off)
• Need to identify sub-groups of patients mostly
benefiting from each combo
• Need to identify from the very beginning a long-term
treatment strategy


