NORTHWEST FOREST PLAN T HE FIRST 15 YEARS ( 1 99 4 – 2 008) Pacific Northwest Research Station Forest Service United States Department of Agriculture General Technical Report PNW-GTR-848 August 2011 Status and Trend of Nesting Habitat for the Marbled Murrelet Martin G. Raphael, Gary A. Falxa, Katie M. Dugger, Beth M. Galleher, Deanna Lynch, Sherri L. Miller, S. Kim Nelson, and Richard D. Young
Transcript
Northwest Forest PlaN
The FirsT 15 Years (1994–2008)
Pacific NorthwestResearch Station
Forest Service
United States Department of Agriculture
General Technical ReportPNW-GTR-848August 2011
Status and Trend of Nesting Habitat for the Marbled Murrelet
Martin G. Raphael, Gary A. Falxa, Katie M. Dugger, Beth M. Galleher, Deanna Lynch, Sherri L. Miller, S. Kim Nelson, and Richard D. Young
The Forest Service of the U.S. Department of Agriculture is dedicated to the principle of multiple use management of the Nation’s forest resources for sustained yields of wood, water, forage, wildlife, and recreation. Through forestry research, cooperation with the States and private forest owners, and management of the national forests and national grasslands, it strives—as directed by Congress—to provide increasingly greater service to a growing Nation.
The U.S. Department of Agriculture (USDA) prohibits discrimination in all its programs and activities on the basis of race, color, national origin, age, disability, and where applicable, sex, marital status, familial status, parental status, religion, sexual orientation, genetic information, political beliefs, reprisal, or because all or part of an individual’s income is derived from any public assistance program. (Not all prohibited bases apply to all programs.) Persons with disabilities who require alternative means for communication of program information (Braille, large print, audiotape, etc.) should contact USDA’s TARGET Center at (202) 720-2600 (voice and TDD). To file a complaint of discrimination, write USDA, Director, Office of Civil Rights, Room 1400 Independence Avenue, SW, Washington, DC 20250-9410 or call (800) 795-3272 (voice) or (202) 720-6382 (TDD). USDA is an equal opportunity provider and employer.
AuthorsMartin G. Raphael is a research wildlife biologist, and Beth M. Galleher is a geographic information systems (GIS) analyst, U.S. Department of Agriculture, Forest Service, Pacific Northwest Research Station, 3625 93rd Ave. SW, Olympia, WA 98512; Gary A. Falxa is a fish and wildlife biologist, U.S. Fish and Wildlife Service, Arcata Fish and Wildlife Office, 1655 Heindon Rd., Arcata, CA 95521; Katie M. Dugger is a research professor, Department of Fisheries and Wildlife, Oregon State University, Corvallis, OR 97331; Deanna Lynch is a fish and wildlife biologist, U.S. Department of the Interior, Fish and Wildlife Service, Washington Fish and Wildlife Office, Division of Listing and Recovery, 510 Desmond Dr., Suite 102, Lacey, WA 98503; Sherri L. Miller is a wildlife biologist (retired), U.S. Department of Agriculture, Forest Service, Pacific Southwest Research Station, 1700 Bayview Drive, Arcata, CA 95521; S. Kim Nelson is a research wildlife biologist, Oregon Cooperative Wildlife Research Unit, Oregon State University, Department of Fisheries and Wildlife, 104 Nash Hall, Corvallis, OR 97331; and Richard D. Young is a GIS analyst, U.S. Department of the Interior, Fish and Wildlife Service, Pacific Regional Office, Ecological Services, 911 NE 11th Ave., Portland, OR 97232.
Cover: Marbled murrelet on nest. Large, mossy limb and overhead cover that helps conceal the nest are typical of murrelet nests. Photo by Nick Hatch, USFS-PNW.
i
AbstractRaphael, Martin G.; Falxa, Gary A.; Dugger, Katie M.; Galleher, Beth M.; Lynch,
Deanna; Miller, Sherri L.; Nelson, S. Kim; Young, Richard D. 2011. Northwest Forest Plan—the first 15 years (1994–2008): status and trend of nesting habitat for the marbled murrelet. Gen. Tech. Rep. PNW-GTR-848. Portland, OR: U.S. Department of Agriculture, Forest Service, Pacific Northwest Research Station. 52 p.
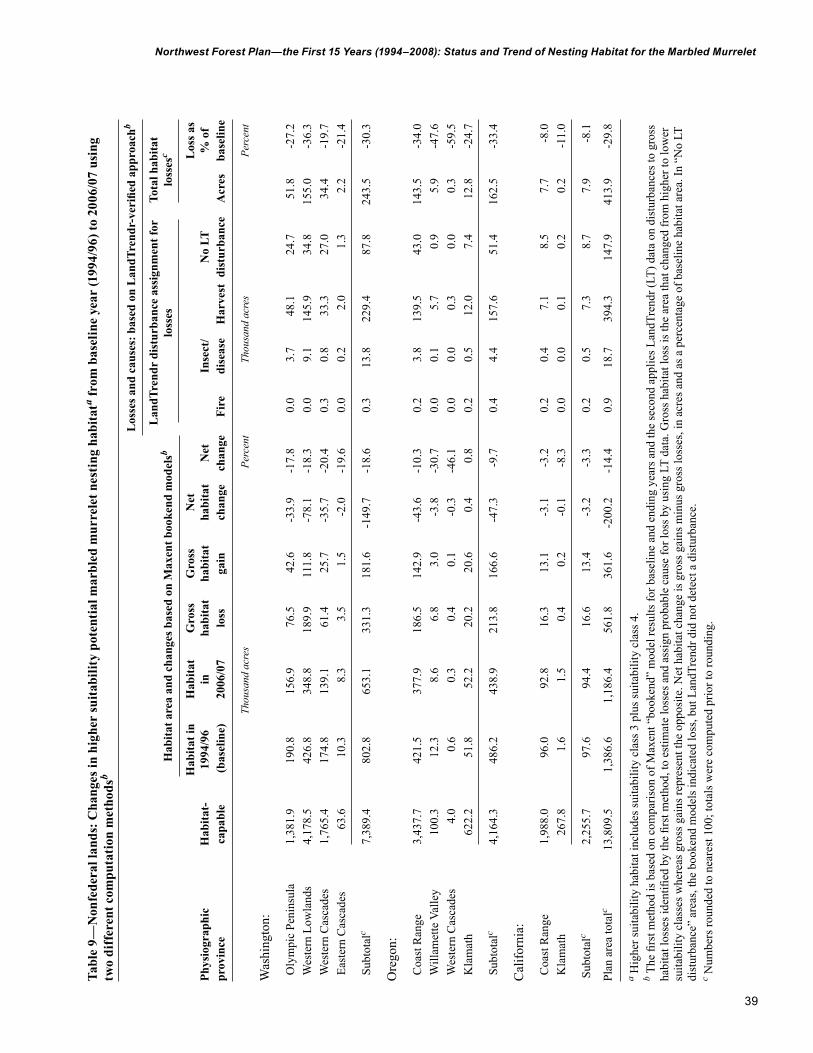
The primary objectives of the effectiveness monitoring plan for the marbled murrelet (Brachyramphus marmoratus) include mapping baseline nesting habitat (at the start of the Northwest Forest Plan [the Plan]) and estimating changes in that habitat over time. Using vegetation data derived from satellite imagery, we modeled habitat suitability by using a maximum entropy model. We used Maxent software to compute habitat suitability scores from vegetation and physiographic attributes based on comparisons of conditions at 342 sites that were occupied by marbled murrelets (equal numbers of confirmed nest sites and likely nest sites) and average conditions over all forested lands in which the murrelets occurred. We estimated 3.8 million acres of higher suitability nesting habitat over all lands in the murrelet’s range in Washington, Oregon, and California at the start of the Plan (1994/96). Most (89 percent) baseline habitat on federally administered lands occurred within reserved-land allocations. A substantial amount (36 percent) of baseline habitat occurred on nonfederal lands. Over all lands, we observed a net loss of about 7 percent of higher suitability potential nesting habitat from the baseline period to 2006/07. If we focus on losses and ignore gains, we estimate a loss of about 13 percent of the higher suitability habitat present at baseline, over this same period. Fire has been the major cause of loss of nesting habitat on federal lands since the Plan was implemented; timber harvest is the primary cause of loss on nonfederal lands. We also found that murrelet population size is strongly and positively correlated with amount of nesting habitat, suggesting that conserva-tion of remaining nesting habitat and restoration of currently unsuitable habitat is key to murrelet recovery.
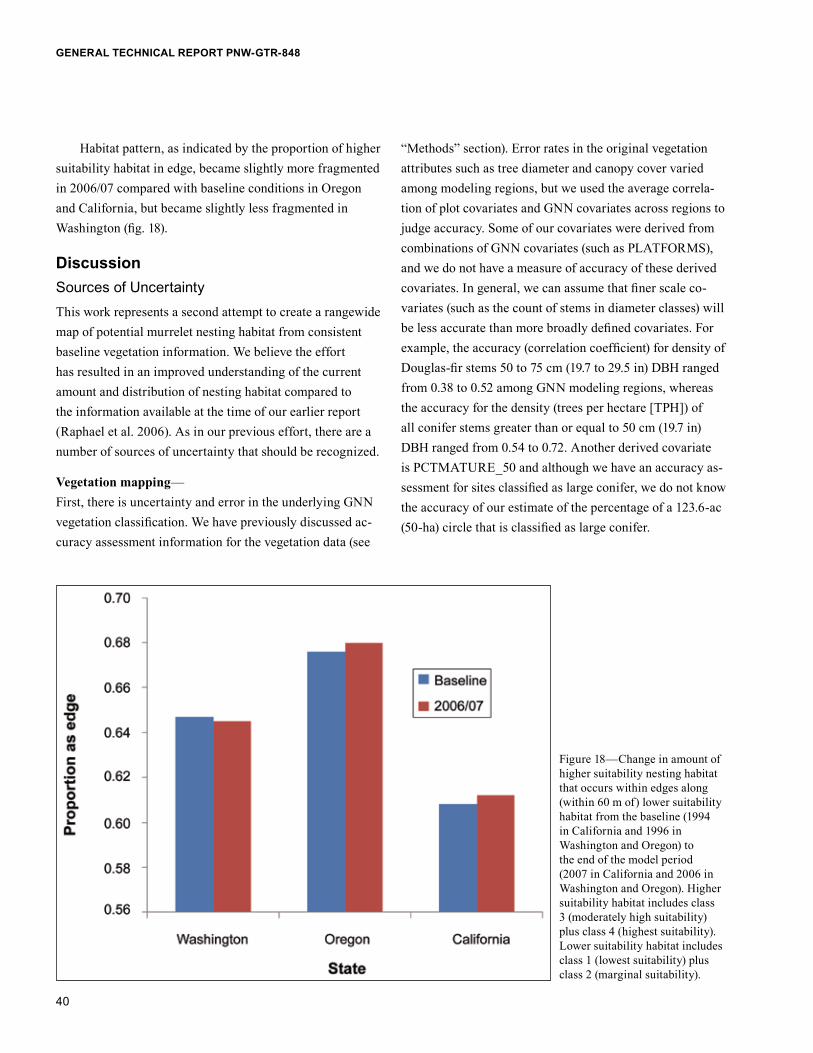
PrefaceThis is the second in the series of monitoring reports from the Marbled Murrelet Effective-ness Monitoring module under the Northwest Forest Plan (the Plan). This report focuses on monitoring results on the status and trend for marbled murrelet (Brachyramphus marmo-ratus) nesting habitat through the first 15 years of the Plan (1994–2008), and a companion report focuses on results from murrelet population monitoring during this period.
In the 1980s, public controversy intensified in the Pacific Northwest over timber harvest in old-growth forests, declining species populations (i.e., spotted owls, marbled murrelets, Pacific salmon), and the role of federal forests in regional and local economies. The northern spotted owl (Strix occidentalis caurina) was listed as a threatened species in 1990, and lawsuits over federal timber sales and injunctions on timber harvests within the range of the owl followed shortly thereafter. This turmoil over forest management in the region led to a Presidential conference in Portland, Oregon, to address the human and environmental needs served by federal forest lands of the Pacific Northwest, including northern California. In 1993, President Clinton announced his proposed “Forest Plan for a Sustainable Economy and a Sustainable Environment” (Northwest Forest Plan). Over the next year, environmental analysis was completed and a Northwest Forest Plan record of decision (ROD)1 was signed in 1994, legally adopting new management direction. The ROD amended existing management plans for 19 national forests and 7 Bureau of Land Management districts in California, Oregon, and Washington (24 million acres of federal land within the 57-million-acre range of the northern spotted owl).
The Plan provides a framework for an ecosystem approach to the management of those 24 million acres of federal lands2 (see footnote 1). It established the overarching conservation goals of (1) protecting and enhancing habitat for species associated with late-successional and old-growth forests, (2) restoring and maintaining the ecological integrity of watersheds and aquatic ecosystems, and (3) providing a predictable level of timber sales and other services, as well as maintaining the stability of rural communities and economies.
1 U.S. Department of Agriculture, Forest Service; U.S. Department of the Interior, Bureau of Land Management [USDA and USDI]. 1994. Record of decision for amendments to Forest Service and Bureau of Land Management planning documents within the range of the northern spotted owl. [Place of publica-tion unknown]. 74 p. [plus attachment A: standards and guidelines].
2 U.S. Department of Agriculture, Forest Service; U.S. Department of the Interior, Bureau of Land Management [USDA and USDI]. 1994. Final supplemental environmental impact statement on management of habitat for late-successional and old-growth forest related species within the range of the northern spotted owl (Northwest Forest Plan). Portland, OR. 2 vol.
iii
The Plan relies on monitoring programs to detect changes in ecological and social systems relevant to success in meeting conservation objectives, and on adaptive manage-ment processes that evaluate and use monitoring information to adjust conservation and management practices.3 To this end, an interagency effectiveness monitoring framework was implemented to meet requirements for tracking status and trend for watershed condi-tion, late-successional and old-growth forests, social and economic conditions, tribal relationships, and population and habitat for marbled murrelets and northern spotted owls. Monitoring results are evaluated and reported in 1- and 5-year intervals. Monitoring results for the first 10 years are documented in a series of general technical reports posted at http://www.fs.fed.us/pnw/publications/gtrs.shtml.
3 Mulder, B.S.; Noon, B.R.; Spies, T.A.; Raphael, M.G.; Palmer, C.J.; Olsen, A.R.; Reeves, G.H.; Welsh, H.H., tech. coords. 1999. The strategy and design of the effectiveness monitoring program for the North-west Forest Plan. Gen. Tech. Rep. PNW-GTR-437. Portland, OR: U.S. Department of Agriculture, Forest Service, Pacific Northwest Research Station. 138 p.
iv
Contents 1 Introduction 1 Methods 1 Analytical Methods 2 Study Area 4 Land Use Allocations 7 Data Sources for Covariates10 Covariate Selection and Screening12 Data Preparation12 Murrelet Locations13 Habitat Change14 LandTrendr15 Model Refinements16 Summarizing Maxent Output19 Habitat Pattern–Edge Versus Core19 Murrelet Abundance Patterns20 Results20 Covariates20 Model Performance27 Baseline Habitat Suitability34 Habitat Change40 Discussion40 Sources of Uncertainty42 Interpretation of Model Output42 Comparison With Previous Estimates43 Implications of Results44 Relation to Murrelet Population Estimates46 Acknowledgments46 Metric Equivalents46 References
1
Northwest Forest Plan—the First 15 Years (1994–2008): Status and Trend of Nesting Habitat for the Marbled Murrelet
IntroductionAlthough the marbled murrelet (Brachyramphus marmo-ratus) is a seabird that spends most of its time foraging in coastal waters, it was selected for monitoring because it is associated with late-successional and old-growth forests for nesting and because conservation of the murrelet was an explicate objective of the Northwest Forest Plan (the Plan) (FEMAT 1993). The murrelet nests mostly on large branches or other suitable platforms in large trees (Hamer and Nelson 1995, Nelson 1997, Ralph et al. 1995). The con-servation of nesting habitat is central to murrelet recovery (USFWS 1997). Owing mostly to timber harvest, only a small percentage (5 to 20 percent) of original old-growth forests remain in Washington, Oregon, and California (Morrison 1988; Norheim 1996, 1997; USFWS 1997), and mostly in relatively small, fragmented patches or in forest parks and reserves.
Marbled murrelet effectiveness monitoring assesses status and trends in marbled murrelet populations and nesting habitat to answer the questions: Are marbled murrelet populations associated with the Plan area stable, increasing, or decreasing? Is the Plan maintaining and restoring marbled murrelet nesting habitat? To address these questions, the Plan’s marbled murrelet monitoring has two components: population and habitat (Madsen et al. 1999). For habitat monitoring, the approach is to establish a baseline level of nesting habitat by first modeling habitat relationships, and then comparing habitat changes to the baseline (Huff et al. 2006a, Raphael et al. 2006). Population size and trends are monitored by using a unified sampling design and standardized survey methods (Miller et al. 2006, Raphael et al. 2007). Thus, trends in both murrelet nesting habitat and populations are tracked over time. The ultimate goal is to relate population trends to nesting habitat condi-tions (Madsen et al. 1999).
The first monitoring report for murrelets (Huff et al. 2006a) introduced the monitoring program, reviewed marbled murrelet biology, and presented results from monitoring of murrelet populations during the first 10 years of the Plan by using multiple modeling approaches to develop baseline estimates of the amount and distribution
of marbled murrelet potential nesting habitat. That report is posted at http://www.fs.fed.us/pnw/pubs/pnw_gtr650.pdf.
This publication builds on the 10-year report, focus-ing on results of a new approach for estimating baseline potential nesting habitat, and on changes to date from that baseline. As in the 10-year report, we use a habitat suitabil-ity modeling approach to estimate the amount and spatial distribution of potential nesting habitat. Inputs to the models again include spatial data on a suite of habitat characteris-tics hypothesized to affect murrelet nesting habitat suit-ability and location data for sites used by nesting murrelets. New in this analysis are habitat modeling tools (maximum entropy modeling), spatial data on habitat attributes at the start and end of the period (using gradient nearest neighbor [GNN] methods), spatial data on vegetation disturbances and causes during the period (using Landsat-based detec-tion of Trends in Disturbance and Recovery methods [LandTrendr]), and an expanded set of murrelet nest sites. The baseline (1994/96) level for marbled murrelet potential nesting habitat that is established in this report, using these improved data and technologies, replaces the baseline esti- mates in the 10-year report (Huff et al. 2006b, Raphael et al. 2006).
MethodsAnalytical MethodsTo model relative suitability of marbled murrelet nesting habitat, we used recently developed habitat suitability mod-eling software called Maxent1 (Phillips et al. 2006, Phillips and Dudík 2008). Maxent uses a machine learning process to estimate the most uniform probability of occurrence at unobserved locations (maximum entropy) given known constraints (observations of presence data). In other words, it estimates probabilities of occurrence at unobserved locations by using information at the observed locations and assuming as little as possible about background sites for which there is not information (Baldwin 2009). It uses
1 The use of trade or firm names in this publication is for reader information and does not imply endorsement by the U.S. Depart-ment of Agriculture of any product or service.
2
GENERAL TECHNICAL REPORT PNW-GTR-848
species presence-only data, similar to Biomapper software (Hirzel et al. 2002), which is based on Ecological Niche Factor Analysis, and which was used to develop the 10-year monitoring habitat maps (Raphael et al. 2006).
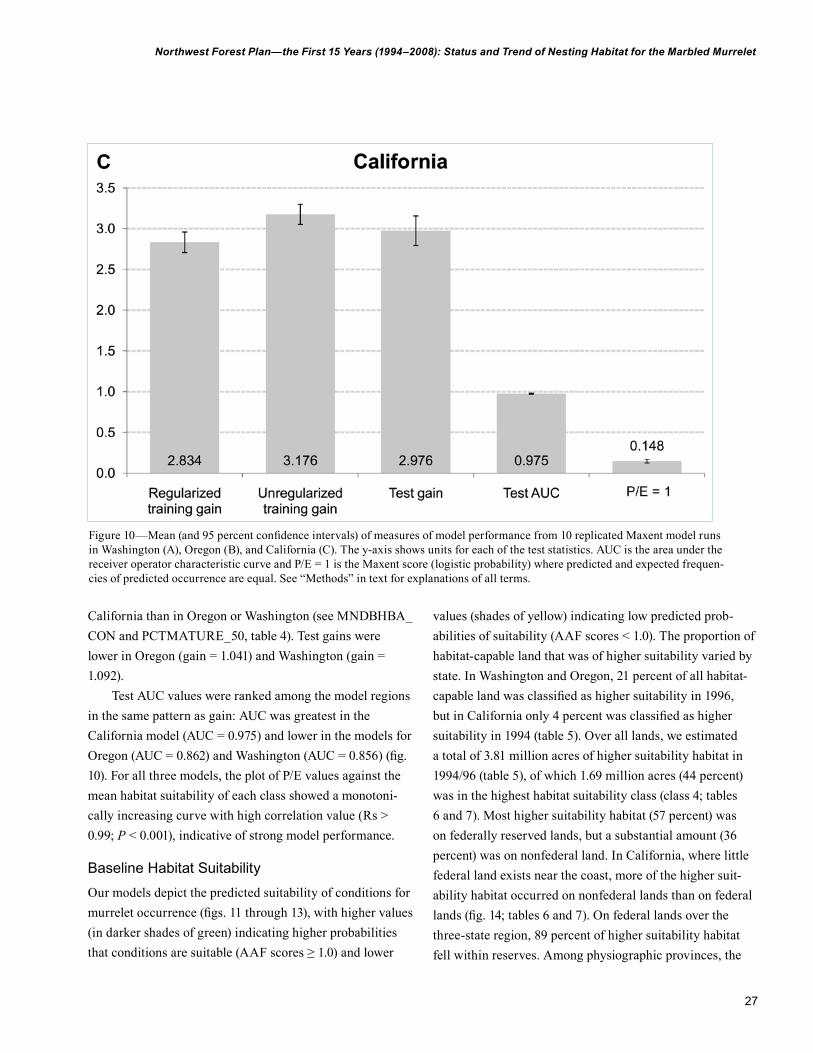
Along with the northern spotted owl (Strix occidentalis caurina) habitat monitoring group (Davis and Dugger, in press), we tested several habitat modeling methods by using available data such as regionwide location data of red tree voles (Arborimus longicaudus). The methods we tested included Biomapper (Hirzel et al. 2002), Maxent (Phillips et al. 2006), Mahalonobis distance (Jenness 2003), and a Resource Selection Probability Function (Manly et al. 2002). We also compared model results from Biomapper and Maxent by using “virtual species” data sets provided by A. Hirzel (the developer of Biomapper) with known species occurrence and distributions. In addition, we replicated the analysis from our earlier report (Raphael et al. 2006) with Biomapper, a resource selection probability function (RSPF), and with Maxent, by using the same covariates and marbled murrelet locations and study area boundaries. One example of the results of these tests is illustrated in figure 1. Here we portray the area under a receiver-operator characteristic (ROC) curve resulting from each model, denoted as AUC on the y-axis. A larger value indicates a better model, and the AUC from Maxent exceeded that of the other approaches with this test data set. We found that as long as species occurrence data were fairly well distributed within the modeled region, Maxent outperformed the other methods.
Comparisons between Maxent and a number of the newer habitat modeling approaches are available in the literature, and, in most cases, Maxent performed as well or better than other methods (Elith et al. 2006, Hernandez et al. 2006, Phillips et al. 2006). In addition to the advantage of only requiring presence-only data (Raphael et al. 2006), Maxent includes a user-friendly interface, is able to run replicated models for testing purposes, provides informa-tion on the importance of the environmental covariates used in modeling, and, unlike other modeling platforms, is easily able to “project” or extrapolate the trained model results to another area or to the same area during a different timeframe (e.g., model results from analysis of 1994/96
environmental data projected to 2006/07 environmental data). After consideration of Maxent’s advantages, we selected it as the habitat modeling tool for this reporting cycle.
Study AreaOur target area was all habitat-capable land, including both federally administered and nonfederal lands, within the range of the murrelet in Washington, Oregon, and California, except for the area south of San Francisco, which is outside the Plan area. We defined “habitat-capable” as those lands capable of supporting forest structure with the potential to provide murrelet nesting habitat. In Oregon and California, we limited our habitat modeling to the Plan mur-relet Zone 1 (fig. 2), which, as described later, includes those areas nearer the coast where all known murrelet nests and
Figure 1—Receiver-operator characteristic (ROC) curves compar-ing performance of Biomapper, Resource Selection Probability Function (RSPF), and Maxent models based on the same sets of species locations and environmental data. Sensitivity is the prob-ability that a true presence will be correctly classified as present (should be high for a good model) and specificity is the probability that a true absence (or pseudo-absence in the case of presence-only models) will be correctly classified as absent or unsuitable; 1 minus specificity (horizontal axis) is the probability of a true absence being misclassified (low values indicate a better model). A greater value for the area under the ROC curve (AUC) indicates a better model with greater predictive power in separating suitable from unsuitable sites. For the Maxent curve, AUC = 0.904; for RSPF, AUC = 0.851; for Biomapper, AUC = 0.805.
3
Northwest Forest Plan—the First 15 Years (1994–2008): Status and Trend of Nesting Habitat for the Marbled Murrelet
Figure 2—Locations of marbled murrelet nest sites (including downy young and egg shells) and occupied sites used as training data for building habitat suitability models by using Maxent software. See “Murrelet Locations” for definitions of nest sites and occupied sites.
4
GENERAL TECHNICAL REPORT PNW-GTR-848
nearly all murrelet detections are located. In Washington, where there is evidence of more extensive murrelet use of this area farther from the coast, the analysis area included the Plan murrelet Zone 2.
Areas we excluded were those not habitat-capable, including lands above tree line; permanently nonforested lands; water bodies; developed areas such as towns, cities, and intensive agriculture; and other such lands. These excluded lands were based on land class data from the U.S. Geological Society (USGS) Gap Analysis Program (GAP; available at http://gapanalysis.nbii.gov/) and the National Land Cover Database (NLCD) (Vogelmann et al. 2001). The GAP data represent the distribution of ecological sys- tems and land cover classes at a 1-ha (2.47-ac) resolution (Comer et al. 2003). We used the NLCD “impervious” data to exclude developed open space and GAP data to identify and exclude subalpine and steppe areas. Isolated fragments of less than two-thirds acre were dissolved to match the habitat-capable state of the surrounding area.
Land Use AllocationsThe Plan created a number of land use allocation (LUA) classes on federal lands in the Plan area, which are broadly categorized as reserved and nonreserved lands (Huff et al. 2006a). We summarized data into federal–reserved, federal nonreserved, and nonfederal land use allocations. An updated map of the Plan’s LUAs was produced in 2002 for the 10-year monitoring report (Huff et al. 2006a). It replaced the original 1994 version, which was mapped with older geographic information systems (GIS) technology (USDA and USDI 1994a, 1994b). This first update improved some allocation boundaries based on subsequent work by individual national forests and corrected some mapping inconsistencies, but more importantly, it incorporated allocation changes that occurred between 1994 and 2002. This map was considered an improvement from the earlier version; however, some limitations remained, including the inability to map riparian reserves (which can cover significant amounts of land where stream densities are high) and inconsistencies in how administratively withdrawn areas (e.g., those areas withdrawn from the lands available for timber harvest at the discretion of individual national forests) were mapped (Davis and Lint 2005, Huff et al.
2006a). Errors that remained after the 2002 update included the misidentification of a state-owned park in the redwood region of California as federally owned National Park Ser-vice land and inaccurate or missing boundaries of national wildlife refuges, mainly in Washington and Oregon. Other minor GIS mapping issues included edge matching incon-sistencies that caused “sliver gaps” (a narrow gap between two adjacent LUAs inadvertently created as a result of merging digital layers from different sources) and inconsis-tent attribution of large water bodies.
A second update of LUAs done in 2009 is used for this 15-year report, with a revised distribution of reserved and nonreserved allocations (fig. 3). This new version incorporates major LUA changes that occurred between 2002 and 2009, corrects the known errors identified above in the version used for the 10-year report, and also corrects the majority of map registration errors that result in gaps or “slivers” (fig. 4). Minor issues with inconsistent mapping of administratively withdrawn areas remain, and a small amount of federally owned lands are awaiting official LUA designations. These areas, which represent approximately 0.1 percent of the total area modeled, are identified as “not designated” in the 2009 map and are reported in the nonreserved category in this report. Riparian reserves still remain unmapped because, as Moeur et al. (2005) noted, “…at the Plan scale, they cannot be reliably distinguished from matrix because of a lack of consistency in defining intermittent stream corridors and varying definitions for riparian buffers.”
The Plan allowed for land exchanges involving late-successional reserves (LSR) if they provide benefits equal to or better than current conditions; such as to improve area, distribution, and connectivity of the LSR system (USDA and USDI 1994a, 1994b). Compared to the 2002 map, the 2009 LUA map showed a net increase of about 90,000 acres of “Congressionally-reserved” lands within our murrelet analysis area that can be attributed to conversion from one of the other “federal reserved” allocations. These gains do not affect our analysis area because they were from one “federal reserve” allocation class to another, and our analy-ses treated all federal reserved lands as a whole. However, the total amount of federal reserved lands also increased
5
Northwest Forest Plan—the First 15 Years (1994–2008): Status and Trend of Nesting Habitat for the Marbled Murrelet
Figure 3—Locations of Northwest Forest Plan reserved and nonreserved land use allocations on federal lands within the range of the marbled murrelet (2009). Reserves include congressionally reserved lands (National Parks and wilder-ness), late-successional reserves, and other lands withdrawn from timber harvest. Nonfederal lands are depicted in gray. Plan murrelet zones are denoted as Zone 1 closer to the west coast and Zone 2 farther away from the coast.
6
GENERAL TECHNICAL REPORT PNW-GTR-848
Figure 4—Changes in Northwest Forest Plan land use allocation designations on federal lands within the range of the marbled murrelet (2002 to 2009). Plan murrelet zones are denoted as Zone 1 closer to the west coast and Zone 2 farther away from the coast.
7
Northwest Forest Plan—the First 15 Years (1994–2008): Status and Trend of Nesting Habitat for the Marbled Murrelet
since 2002, and we noted within our murrelet analysis area a net increase of about 27,000 acres of federal lands, includ-ing about 19,000 acres in reserved allocations, and 8,000 acres in nonreserved allocations (fig. 4).
Given the most recent information, the latest changes in reserved allocations have resulted in a slightly increased area and improvement of the distribution and connectivity of the reserved allocation system.
Data Sources for Covariates
Forest composition and structure covariates— As part of the Plan effectiveness monitoring program, scientists mapped detailed attributes of forest composition and structure for all forested land in the Plan area by using GNN imputation (Ohmann et al. 2010); the GNN method integrates vegetation measurements from regional grids of field plots, mapped environmental data, and Landsat im-agery to ascribe detailed ground attributes of vegetation to each pixel in a digital landscape map (Ohmann and Gregory 2002). The GNN analyses created maps for two time pe-riods: a baseline year (1996 for Washington and Oregon, 1994 for California), and a year representing the end of the analysis period (2006 for Washington and Oregon, 2007 for California). The resulting GNN vegetation attribute data provided the core source of covariates (table 1) used for habitat modeling and mapping, and cover the entire breadth of the murrelet’s nesting range from Washington to north-ern California for two distinct points in time. We call these two time periods “bookends” because the changes in habitat that we analyzed and report on occurred between these two endpoints. The satellite imagery from which GNN was cre-ated was from 1994 and 2007 in California and 1996 and 2006 in Oregon and Washington. The on-the-ground plot data used by GNN to create the vegetation maps cover the period from 1991 to 2000 for the baseline period, and 2001 to 2008 for the ending time period. The GNN products pro-vided a resolution of 30-m (98-ft) pixels. The GNN covari-ates used in our models included CANCOV_CON (conifer canopy cover), CANCOV_HDW (hardwood canopy cover), diameter diversity index (DDI), MNDBHBA_CON (basal-area weighted mean diameter of conifers), VEGCLASS (a categorical covariate describing structural classes ranging
from early seral to old forest), and QMDC_DOM (quadratic mean diameter of dominant trees). The GNN attributes also contributed to other covariates, as described below.
Platforms covariate— Murrelets most often nest on larger limbs of coniferous trees. This type of nest location is termed a “platform” and counts of platforms are very often good predictors of suit-able murrelet nesting habitat (Burger 2002, Burger et al. 2010, Nelson 1997). The PLATFORMS covariate was com-puted from the GNN data and data from previous studies (Raphael, n.d.) in which numbers of platforms were counted on a very large sample of trees—by tree species and diam-eter class—from plots scattered throughout the murrelet range. We computed mean numbers of platforms by tree species and diameter at breast height (DBH) class, and then applied these means to tree counts from the GNN data. The mean number of platforms for each species and DBH group (table 2) was multiplied by the associated GNN attribute data on conifer trees per hectare (e.g., TPH_PSME_50_75 for density of Douglas-fir trees in the 50 to 75 cm [19.7 to 29.5 in] DBH class) to estimate total platforms in each pixel. Because PLATFORMS was highly correlated with MNDBHBA_CON in California, we dropped PLATFORMS from the California model, and retained MNDBHBA_CON in that state.
Climate covariates— Climate covariates were derived from PRISM data (Daly et al. 2008), plus a FOG covariate. PRISM-derived covari-ates (table 1) included JULY_MAXT (mean maximum temperature for July), and SMR_PRECIP (mean precipita-tion for May to September period). These covariates, which were used only in Calfornia, were included to represent summer climate regime, including temperature and heat stress, which may affect the thermal regime at poten-tial murrelet nest sites, as well as forest composition and structure, including epiphyte growth. For example, some have hypothesized that nesting murrelets may select areas with lower heat stress (McShane et al. 2004, Meyer and Miller 2002). We did not include the PRISM covariates in the final Oregon and Washington models because during initial Maxent model testing they contributed little to model performance.
8
GENERAL TECHNICAL REPORT PNW-GTR-848
Table 1—Covariates used as input to Maxenta
Abbreviation Description Unit Source
PLATFORMS Platforms per acre derived from data from Number per Derived from GNN (gradient nearest neighbor) on TPH acre GNN (trees per hectare) by species and DBH (diameter at breast height). See table 2.
CANCOV_CON Canopy cover of all conifers. Percentage GNN
CANCOV_HDW Canopy cover of all hardwoods. Percentage GNN
DDI Diameter diversity index: measure of No units GNN structural diversity of a forest stand based on tree densities in different DBH classes (5–24cm [2–9 in], 25–49 cm [10–19 in], 50–99 cm [20–39 in], and ≥100 cm [40 in]). See McComb et al. 2002 for details.
MNDBHBA_CON Basal-area weighted mean diameter of Inches GNN all live conifers.
MULTISTORY_50 Percentage of 50-ha (124-ac) circular area Percentage Derived from classified as GNN IMAP_LAYERS (number GNN of tree canopy layers present) equal 3.
PCTMATURE_50 Percentage of 50-ha (124-ac) circular Percentage Derived from area classified as GNN VEGCLASS GNN 10 (large conifer, moderate to closed canopy) or 11 (giant conifer, moderate to closed canopy).
JULY_MAXT Mean July maximum temperature. Degrees PRISM Fahrenheit
SMR_PRECIP Mean precipitation from May to September. Inches PRISM
FOG The average value of effective Scaled to Henderson precipitation from fog drip and 1 unit = et al., in press low clouds. 20 inches
SLOPE_PCT Slope. Percentage USGS NED 30-m DEM
BRIGHTNESS Tasseled cap transformation of Index LandTrendr Landsat thematic mapper (TM) data measuring overall reflectance. Generally differentiates dry from wet soils.
GREENNESS Tasseled cap transformation of Landsat Index LandTrendr TM data measuring presence and density of green vegetation.
WETNESS Tasseled cap transformation of Index LandTrendr Landsat TM data measuring moisture status of the environment.a Maxent is a habitat suitability modeling software used in this study to model relative suitability of marbled murrelet nesting habitat.
9
Northwest Forest Plan—the First 15 Years (1994–2008): Status and Trend of Nesting Habitat for the Marbled Murrelet
Table 2—Mean number of potential nest platforms per tree as a function of tree species and size (diameter at breast height [DBH])a
Mean number of platforms by DBH class (cm)
Common name Scientific name 50–75 75–100 100–125 125–150 ≥ 150
Douglas-fir Pseudotsuga menziesii (Mirb.) Franco 0.275 1.725 4.721 7.989 11.911Redwood Sequoia sempervirens 0.188 0.423 2.244 3.703 10.199Sitka spruce Picea sitchensis (Bong.) Carrier 0.851 3.357 5.429 12.000 11.676Western hemlock Tsuga heterophylla (Raf.) Sarg. 1.130 3.896 6.272 7.133 6.382Western redcedar Thuja plicata Donn ex D. Don 0.212 1.076 2.311 3.488 4.488Other conifers 0.514 2.017 4.359 7.350 6.611a Potential platforms defined as horizontal limbs 6 inches or larger in diameter. Data from this table were used to create the PLAT-FORMS covariate. See “Methods” for details.
In California, which has a mediterranean climate, we included FOG as a covariate because cool summer fog is a characteristic of coastal forests in northern California where summer precipitation is negligible, but fog greatly moder-ates summer temperatures and humidity near the coast. Fog also plays an important ecological role in the distribution of coast redwood (Sequoia sempervirens Lamb. ex D. Don) Endl.) forest (Sawyer et al. 2000), with which murrelets are closely associated in California (Meyer et al. 2002). The fog spatial layer was developed by Henderson et al. (in press) and represents the average value of effective precipita-tion added by fog drip and low clouds. One unit of “fog effect” equals 20 in of effective precipitation. We did not include FOG or the other climate covariates in the Oregon and Washington model regions that are characterized by maritime climates and where we expected less influence of climate on murrelet habitat selection.
Landscape covariates— Previous studies (Raphael et al. 1995) found that murre-lets select larger patches of contiguous forest for nesting. To address patch characteristics, we created two covari-ates, MULTISTORY_50 and PCTMATURE_50. These covariates were derived from GNN IMAP_LAYERS and VEGCLASS covariates, respectively. For each pixel, we evaluated forest condition on a 50-ha (124-ac) circular neighborhood centered on the pixel, assigning the percent-age of the circle in mature-forest condition (see table 1) to the pixel.
Landsat covariates— We obtained three additional attributes (BRIGHTNESS, GREENNESS, and WETNESS) to further characterize veg-etation condition, all based on tasseled cap transformations of 1994/96 and 2006/07 Landsat thematic mapper spectral data (see Kennedy et al. 2010 for methods). These data provide a way to optimize imagery viewing for vegetation studies. In particular, BRIGHTNESS is useful for differen-tiating bare soil from vegetation, GREENNESS indicates the presence and density of vegetation, and WETNESS provides a measure of moisture in both vegetation and soil (Cohen et al. 1995, Crist and Cicone 1984). The BRIGHT-NESS, GREENNESS, and WETNESS grids we used were produced as part of LandTrendr and were also used in the GNN modeling (Moeur et al., in press). See “Results” for details.
Other data sources— We used 2009 versions of the physiographic province layer (which also defines the Plan area) (FEMAT 1993), and the marbled murrelet range layer, to define the extent of our analysis and report outcomes based on these areas. Revisions to the original FEMAT (1993) physiographic province layer (available at http://www.reo.gov/gis/data/gis-data/index.htm) involved correction of state boundaries us-ing 1:24,000-scale digital topographic maps and inclusion of a more detailed, higher resolution coastline, which included several islands that were previously omitted. Revisions to the 2004 version of the murrelet range layer (also avail-able at http://www.reo.gov/gis/data/gisdata/index.htm) were
10
GENERAL TECHNICAL REPORT PNW-GTR-848
confined to inclusion of the higher resolution coastline. The murrelet’s range south of Canada was divided into six mar-bled murrelet “conservation zones” in the species’ recov-ery plan (USFWS 1997), and the conservation zones were broken into strata for purposes of population monitoring (Raphael et al. 2006). Five of these conservation zones (1 through 5) overlap the Plan area (fig. 2). We extended inland the breaks between conservation zones and strata, primar-ily by following watershed lines, so that we could examine relationships between nesting habitat and at-sea murrelet populations.
The terrestrial (nesting) portion of the marbled murrelet range was defined during Plan development and consists of Plan marbled murrelet inland zones 1 and 2. Plan murrelet inland Zone 1 is a 10- to 35-mi-wide zone closer to the coast, defined by the Plan, where the majority of murrelet nests and detections are located, and inland Zone 2 is farther inland and includes areas where detection data indicated only a small fraction of the murrelet population nests (FEMAT 1993). To avoid confusion with the conserva-tion zones of the recovery plan, we will refer to the inland marbled murrelet zones established by the Plan as “Plan murrelet zones.” As shown in figure 2, the murrelet’s inland range covers only a portion of the Plan area. Our analysis covers only lands within the overlap of the Plan area and marbled murrelet range.
We used 1999 U.S. Geological Survey National Eleva-tion Data 98-ft (30-m) digital elevation model (DEM) data for estimating percentage of slope (http://gisdata.usgs.gov/NED/).
Covariate Selection and ScreeningWe selected a candidate set of environmental covariates by using ecological knowledge of the species’ nesting habitat, from literature and our experience. We then used Pearson correlations to reduce multicollinearity among the covari-ates included in our model. For covariate pairs for which correlations exceeded 0.90, we retained the covariate that had the most support in literature or our experience, and that had higher mapping accuracy, and dropped the other. We then partitioned the covariate data by state and recom-puted correlation matrices for each state. Next, we screened
for correlations greater than 0.70 within a state and for that state dropped the covariate that had the least support as described above. Our final covariate list is summarized in table 1.
Accuracy assessment— Our screening of potential GNN covariates considered ac-curacy assessment data provided by the GNN project. The assessments used a form of ground-truthing, by compar-ing observed values for a grid of field inventory plots with the GNN-predicted (modeled) values for those same plots. This provided accuracy data for the four GNN attributes used directly in our models (table 1). Accuracy assess-ments were not available for non-GNN covariates or for derived GNN covariates, but were available for some of the GNN attributes that contributed to the PCTMATURE_50 and PLATFORMS covariates. The GNN accuracy assess-ments are available at http://www.fsl.orst.edu/lemma/main.php?project=nwfp&id=studyAreas.
Table 3 summarizes the accuracy assessment results by GNN modeling region for GNN attributes that contributed directly or indirectly to model input covariates. Accuracy, as measured by correlation “r” values, ranged from 0.45 to 0.80 among modeling regions for the four attributes used directly as covariates, plus the three that were the basis for the PCTMATURE_50; conifer canopy cover was the most accurate. Accuracy was less variable when averaged over the four modeling regions (r = 0.59 to 0.72), and averaged lowest in the California Coast region, where the sample size for field inventory plots was small and where clouds and fog tended to obscure imagery (Ohmann 2010).
The PLATFORMS covariate was based in part on GNN attribute data on tree density by species and DBH class. Creating these required the tree density data to be subdivided into 30 categories for each modeling region (five DBH classes for each of six species groups), often resulting in small sample sizes for these attributes, with the exception of the more abundant species, such as Douglas-fir. This may be why accuracy statistics for these attributes were gener-ally low, with accuracy highest for Douglas-fir (table 3). Trees greater than 100 cm DBH contribute most to platform numbers, and when all conifers of this size class were
11
Northwest Forest Plan—the First 15 Years (1994–2008): Status and Trend of Nesting Habitat for the Marbled Murrelet
Tabl
e 3—
Acc
urac
y as
sess
men
t dat
a fo
r gr
adie
nt n
eare
st n
eigh
bor
(GN
N) a
ttri
bute
s use
d as
cov
aria
tes i
n m
urre
let n
est h
abita
t mod
elin
ga
Cor
rela
tion
coef
ficie
nts a
nd R
MSE
by
GN
N m
odel
ing
regi
on
W
ashi
ngto
n C
oast
O
rego
n C
oast
O
rego
n an
d
and
Cas
cade
s R
ange
C
alifo
rnia
Kla
mat
h C
alifo
rnia
Coa
st
C
orre
latio
n
Cor
rela
tion
C
orre
latio
n
Cor
rela
tion
Cov
aria
te
GN
N a
ttri
bute
R
MSE
co
effic
ient
R
MSE
co
effic
ient
R
MSE
co
effic
ient
R
MSE
co
effic
ient
Con
ifer c
anop
y co
ver
CA
NC
OV
_CO
N
0.22
0.
80
0.30
0.
73
0.41
0.
68
0.49
0.
65H
ardw
ood
cano
py c
over
C
AN
CO
V_H
DW
1.
49
0.66
0.
84
0.58
0.
71
0.68
0.
53
0.52
Tree
dia
met
er d
iver
sity
in
dex
DD
I N
A
NA
N
A
NA
0.
39
0.65
0.
38
0.52
Bas
al-a
rea
wei
ghte
d m
ean
diam
eter
at b
reas
t hei
ght
(DB
H) a
ll co
nife
rs
MN
DB
HB
A_C
ON
0.
45
0.70
0.
48
0.70
0.
53
0.52
0.
65
0.45
C
ontri
buto
rs:
Q
MD
A_D
OM
0.
43
0.72
0.
41
0.78
0.
52
0.53
0.
55
0.55
PCTM
ATU
RE_
50
BA
H_P
RO
P 1.
75
0.68
0.
99
0.61
0.
78
0.68
0.
56
0.60
C
AN
CO
V
0.20
0.
75
0.22
0.
70
0.27
0.
71
0.22
0.
70
Con
tribu
tors
:
TPH
_OC
(mis
c. c
onife
r)
5.40
0.
42
11.3
0 0.
09
5.31
0.
25
—
—PL
ATFO
RM
S TP
H_P
SME
(Dou
glas
-fir)
4.
15
0.31
2.
33
0.49
3.
27
0.30
—
—
TP
H_T
SHE
(w. h
emlo
ck)
4.53
0.
38
12.6
1 0.
18
—
—
—
—
TPH
C_G
E_10
0 (a
ll
coni
fers
≥10
0 cm
[40
in]
D
BH
) 1.
89
0.56
1.
62
0.63
1.
98
0.46
—
—
a Va
lues
pre
sent
ed a
re n
orm
aliz
ed ro
ot m
ean
squa
re e
rror
(RM
SE) a
nd c
orre
latio
n co
effic
ient
s (‘r
’), f
or in
divi
dual
GN
N m
odel
ing
regi
ons.
Incl
udes
four
attr
ibut
es u
sed
dire
ctly
as c
ovar
iate
s, an
d se
vera
l GN
N a
ttrib
utes
, whi
ch c
ontri
bute
d to
war
d th
e PL
ATFO
RM
S an
d PC
TMAT
UR
E_50
cov
aria
tes.
For P
LATF
OR
MS,
GN
N p
rovi
ded
trees
pe
r hec
tare
(TPH
) dat
a us
ing
five
diam
eter
cla
sses
for e
ach
spec
ies;
num
bers
are
mea
n ac
cura
cy v
alue
s for
five
GN
N c
lass
es. F
or P
LATF
OR
MS,
the
tabl
e om
its sp
ecie
s, su
ch
as w
este
rn re
dced
ar, a
nd w
este
rn h
emlo
ck fo
r the
Ore
gon
and
Cal
iforn
ia K
lam
aths
, with
insu
ffici
ent s
ampl
e si
zes f
or th
e ac
cura
cy a
sses
smen
t. PL
ATFO
RM
S w
as n
ot u
sed
in
Cal
iforn
ia m
odel
s. Sa
mpl
e si
zes w
ere
smal
l (<2
5) fo
r tw
o di
amet
er c
lass
es fo
r TPH
_TSH
E in
Ore
gon
Coa
st R
ange
.
12
GENERAL TECHNICAL REPORT PNW-GTR-848
pooled (TPHC_GE_100), accuracy was greater, with cor-relations ranging from 0.46 to 0.63 (table 3). Thus, although accuracy was low for some GNN attributes contributing to the PLATFORMS covariate, it was higher for attributes representing the most abundant tree species (Douglas-fir), and when sample sizes were increased by pooling larger conifer trees across species.
Data PreparationAll covariates were processed as Arc/Info (ESRI 1982–2008) or ArcGIS rasters (ESRI 1999–2009) at 30-m (98-ft) resolution, the native resolution of the GNN data. An Arc/Info smoothing function was applied to all covariate rasters, except MULTISTORY_50 and PCTMATURE_50, to assign the mean value of the 3- by 3-pixel neighborhood to the cell. We used this smoothing function to reflect the spatial uncertainty in our murrelet location data, but still main-tained a spatial resolution < 2.5 ac. All covariate rasters were converted to ASCII files for input into Maxent and Maxent ASCII output back to rasters using Arc/Info (ESRI 1982–2008).
Murrelet LocationsWe used agency records to identify two types of murrelet nest locations to serve as species presence sites for training the Maxent models: (1) known nest locations and (2) stand locations where murrelet occupancy behavior was observed during audio-visual surveys of potential habitat (Evans Mack et al. 2003), using all available records through 2007. In both cases, we used only records where inspection of digital aerial photographs confirmed that older forest remained at the location in our baseline modeling year (1994 in California and 1996 in Washington and Oregon). We initially focused on known nest locations, but this yielded relatively small sample sizes (54 in Washington, 65 in Oregon, and 52 in California), and did not always provide representative spatial distribution across potential murrelet habitat. Therefore, we added a random sample of “occupied” sites equal in number to the sample of nest sites for each state. We used an equal number of occupied and nest sites to minimize any potential bias in one data set or the other, as
neither data set was collected via random sampling and may have biases. For example, many of the occupied sites were surveyed prior to timber harvest, so site selection for these surveys was guided by timber considerations. We assumed that when pooled, the nest and occupied location data used in our habitat modeling represented the breadth of possible murrelet habitat types (McShane et al. 2004, Nelson et al. 2006, Raphael et al. 2006). These known nest and occupied location data (fig. 2) were used to train the Maxent habitat distribution model.
Location data for known nest and occupied sites were collected from a variety of sources. In Washington, the primary source was a database maintained by the Wash-ington Department of Fish and Wildlife, plus nests located by a radiotelemetry study (Bloxton and Raphael 2009). California sources included a database maintained by the California Department of Fish and Game, supplemented by records assembled by the U.S. Fish and Wildlife Service. For Oregon, data sources were the U.S. Forest Service, the U.S. Bureau of Land Management, the Oregon Department of Forestry, and published and unpublished research (Nelson 2010, Nelson and Wilson 2002, Ripple et al. 2003).
For known nest locations, we included (1) known nest trees located by visual observations and by radiotelemetry of nesting murrelets (n = 125); (2) sites where downy, flightless murrelets had been found on the ground (n = 7); and (3) sites where murrelet eggshells had been found on the ground, typically at the base of a suitable nest tree (n = 39). Numbers of locations of downy young plus eggshells were 9, 4, and 33 in Washington, Oregon, and California, respectively. For the occupied sites, behaviors denoting an “occupied” location included one or more of the following: murrelets circling at or below the forest canopy; circling above the canopy by no more than one canopy height; flying through in a straight flight path below the canopy; landing in, perching, or departing from a tree; or birds emitting three or more calls from a fixed point in a tree within 328 feet of an observer (Evans Mack et al. 2003).
We manually screened the data on known nest site locations with the aid of aerial photography, base GNN vegetation mapping data, and communications with original data sources to confirm and correct locations and remove
13
Northwest Forest Plan—the First 15 Years (1994–2008): Status and Trend of Nesting Habitat for the Marbled Murrelet
duplicate records. In the final data set, all nest locations were greater than 98 ft apart (the resolution of our modeling).
The selection of occupied sites used to train the Maxent model involved a series of filters and screenings. Filters were used to eliminate duplicate sites and those that fell within 164 ft (50 m) of a known nest site. Additionally, the Washington and Oregon databases were so robust (4,900+ and 4,300+ records, respectively), that a filter was applied to randomly eliminate sites within 5,774 ft of each other. This was done to maximize the distribution of the points among different habitat stands, as well as to reduce the number of records in the databases to a more manageable size for the manual screening process. The subset of occupied sites produced by the filtering process was then screened by manual inspection of each site location by using digital aerial photography. Sites were eliminated if forest condi-tions at the site were clearly nonhabitat (e.g., clearcut, young forest, roadway, open water) in the baseline year. Finally, a stratified random selection was made from the remaining sites equal to the number of known nest sites within a state, and stratified by physiographic provinces within states proportional to the amount of habitat-capable lands in each province.
Because no known nest sites and few occupied sites (seven in Washington, nine in Oregon) occurred in Plan murrelet Zone 2 (the portions of the murrelet’s breeding range farthest from the coast), we limited the Maxent model development to the areas nearer the coast that represent Plan murrelet Zone 1. Thus all training sites used were within Plan murrelet Zone 1. In Washington, the model based on Plan murrelet Zone 1 data was subsequently projected onto Plan murrelet Zone 2, to estimate the distribution of po-tential nest habitat for that area. In Oregon and California, we limited our habitat analysis to the Plan murrelet Zone 1 (fig. 2) because of the scant evidence for murrelet use of these inland areas (Alegria et al. 2002, Hunter et al. 1998). In California, we found no records for murrelet use of Plan murrelet Zone 2. There are nine occupied sites in Plan murrelet Zone 2 in Oregon, but they are all clustered near the boundary with Plan murrelet Zone 1 in a small area near Roseburg, and evidence is lacking for use of Plan murrelet
Zone 2 elsewhere in the state. In Washington, the occupied sites from Plan murrelet Zone 2 were much more evenly distributed spatially and with respect to distance from the coast, and we decided to include Plan murrelet Zone 2 in our analysis area.
Habitat ChangeWe used two methods to assess change in the amount and distribution of habitat from the baseline (1994 in California and 1996 in Oregon and Washington) to “current” condi-tions represented by 2006 data in Oregon and Washington and 2007 data in California. For the first method (the “book-end approach”), we compared amounts of habitat estimated by the Maxent models for two time periods: (1) the baseline year, and (2) estimates for 2006/07, which we obtained by projecting the Maxent model from the baseline period to the covariate values for 2006/07. Projecting the model in this manner could result in a projected model with validity is-sues if covariate values in the 2006/07 data were outside the range of covariate values in the baseline study area used to build the Maxent model (Phillips et al. 2006); however, all covariate values were within the range of baseline values. By comparing mapped habitat suitability for the two time periods, we estimated change as the balance between losses and gains of higher suitability habitat during the analysis period. Habitat loss was defined as those pixels that moved from suitability classes 3 or 4 to suitability classes 1 or 2 (habitat suitability classes are discussed below), and vice versa for habitat gains. This method cannot identify cause of habitat losses. Our second approach, “LandTrendr-veri-fied,” used forest disturbance data provided by LandTrendr to refine the estimates of habitat loss as determined by the bookend approach. This allowed us to identify likely causes of habitat loss, focusing on areas where bookend losses were also mapped as disturbed by LandTrendr.
For the second approach, we calculated losses as follows: first, we used the Maxent bookend model results from each state to identify habitat that had changed from higher to lower suitability during the analysis period. We then examined these bookend “losses” spatially by using the LandTrendr disturbance attribute data from the same time period, with four LandTrendr disturbance classes: (1) no
14
GENERAL TECHNICAL REPORT PNW-GTR-848
disturbance, (2) fire, (3) harvest (primarily, but can include short-term disturbances other than fire and harvest), and (4) insect damage (and other long-term disturbance agents). Bookend losses in the latter three classes we considered “verified” by LandTrendr, that is, both the bookend analyses indicated a loss of suitable habitat for that pixel and the LandTrendr data also indicated a disturbance and assigned a disturbance type.
Salient differences between these two methods of esti-mating habitat change are (1) the “bookend approach” pro-vided net change in habitat as a result of gains and losses, whereas the “LandTrendr-verified approach” estimated only losses, while providing no information on potential habitat gains; and (2) the latter method used information from two sources (the Maxent models and LandTrendr) to estimate losses, and provided data on likely causes of habitat loss. The strengths and weaknesses of the two approaches are addressed in the “Discussion.”
LandTrendrLandTrendr is a new approach (Cohen et al. 2010; Kennedy et al. 2007, 2010) for extracting information on changes at the land surface by using yearly Landsat satellite time- series imagery. The use of annual time-series images provides a powerful tool for detecting and describing both subtle and abrupt changes in land cover. This power stems in large part from using a long time series of images from the same location to separate imagery noise from actual change (Kennedy et al. 2007). Using spectral data, the LandTrendr method produces temporal trajectories on a pixel-by-pixel basis. These trajectories are then analyzed to identify relatively slowly occurring processes, such as vegetation regrowth or cover loss from disease or other stressors, and cover loss from abrupt events such as harvest or fire. The approach includes creating mosaic images by using multiple images per year to minimize the effects of cloud cover, normalization to remove most atmospheric effects, and methods to remove ephemeral noise-induced spikes caused by smoke, snow, clouds, or shadows. The technique also uses a tool (known as TimeSync) developed to assess the robustness of the LandTrendr outputs (Cohen et al. 2010).
For our analyses, we used the LandTrendr information on vegetation cover loss to inform us about disturbance events. The LandTrendr data we used were provided by its developers at Oregon State University (R.E. Kennedy and Z. Yang) and the USDA Forest Service Pacific Northwest Research Station (W.B. Cohen). LandTrendr used the same Landsat imagery as used for the GNN modeling of vegeta-tion characteristics for the bookend years of 1994/96 and 2006/07. Because LandTrendr used annual images for the analysis period and GNN used one year’s imagery for each bookend, the GNN models used a subset of the imagery data used by LandTrendr. The LandTrendr data covered the entire analysis area and time period, and provided informa-tion at 30-m (98-ft) pixel resolution on the initial year of disturbance, and the magnitude and duration of disturb-ances. Magnitude is expressed in terms of percentage of total vegetation cover change during the disturbance, and duration is measured in years. LandTrendr also provided data on likely cause of disturbances (vegetation cover loss), classified into four types: no disturbance, fire, short- duration disturbance other than fire (primarily harvest), and long-duration disturbance (typically insect damage, but can also include pathogens and occasionally other nonabrupt processes). For short-term (abrupt) disturbances, burned areas were identified based on fire-perimeter spatial data from Monitoring Trends in Burn Severity (MTBS, http://mtbs.gov), Geospatial Multi-Agency Coordination (GeoMAC, http://www.geomac.gov), and other sources. The remaining short-term disturbances were assigned a probable cause of harvest. For identifying disturbances, LandTrendr used a threshold of reduction in vegetation cover (magni-tude) of at least 10 percent for long-duration disturbance and up to 15 percent for short-duration disturbances of 1 year (Kennedy 2010). LandTrendr provided information on up to three disturbances per pixel over the analysis period, ranked as primary, secondary, or tertiary based on magnitude and extent of a disturbance. We used only data from the two highest ranking disturbances during our period of analysis because very little area (about 1,200 ac or 0.002 percent of the Plan analysis area) had a tertiary disturbance event between 1994 and 2007. By comparison, about 9 percent of the murrelet analysis area recorded an initial LandTrendr
15
Northwest Forest Plan—the First 15 Years (1994–2008): Status and Trend of Nesting Habitat for the Marbled Murrelet
“primary” disturbance and 0.2 percent recorded a “sec-ondary” disturbance event. We decided that the minimal information gained by including tertiary disturbances did not merit the additional analyses.
Model RefinementsOnce we selected our final set of covariates, we began a se-ries of Maxent model runs to evaluate model performance. Our intent was to find a parsimonious model that retained a relatively high level of model performance. To evaluate model performance, we used training and test model gain, and area under the curve statistics (AUC) (Boyce et al. 2002, Fielding and Bell 1997). Gain is closely related to deviance, a measure of goodness of fit used in generalized additive and generalized linear models and is available as part of the model output in Maxent (Phillips et al. 2006). The lowest value of gain is 0 and it usually increases toward an asymptote as the fit of the model to the training data improves. During a run, Maxent is generating a probability distribution over pixels in the grid, starting from a uniform distribution and repeatedly improving the fit to the data. The gain is defined as the average log probability of the presence samples, minus a constant that makes the uniform distribution have zero gain. At the end of a run, the gain indicates how closely the model is concentrated around the presence samples; for example, if the gain is 2, it means that the average likelihood of the presence samples is exp(2), or approximately 7.4 times higher than that of a random back-ground pixel (Phillips, n.d.). For a given model run, separate gain statistics were generated for the training (75 percent) and test (25 percent) portions of the available presence sites.
The other measure of model performance, AUC, is the area under a receiver operator characteristic (ROC) curve (Boyce et al. 2002, Hirzel et al. 2006). The AUC is a measure of model performance that essentially illustrates how well one can distinguish presence sites from the avail- able background sites (some of which are likely to be oc-cupied by or suitable for murrelets). Values range from 0 to 1.0, and location data that cannot be distinguished from the background with any greater probability than a random coin toss would yield an AUC score of 0.5. We present AUC
values generated by using test data, which are data held back during model development and then used to test model fit and accuracy.
Maxent also provides a choice of covariate relation-ships to include in a model, called “features.” Feature types include Linear, Quadratic, Threshold, Hinge, and Product. These features set the possible shapes of the relationship between a covariate and the response (i.e., the Maxent probability distribution) or allow for covariate interactions (product features). A user can select any combination of these feature types. A model with linear features requires the fewest parameters, as only one parameter (slope) is es-timated for each covariate. Quadratic relationships require both a slope and exponent parameters for each covariate. Hinge features create a piece-wise approximation to any distribution. The number of parameters for any one covari-ate increases for each “hinge” in the modeled distribution, and a complex distribution can result in many parameters. The Product feature allows for interactions among all pairs of covariates. The total number of parameters for any model depends, therefore, on the types of features selected and the complexity of the response curves between the covari-ates and the probability scores. In addition, Maxent has a “regularization” constant that can be specified. Increasing the regularization value above the default has the effect of smoothing the response curve, thereby reducing the number of parameters in the model (see Phillips and Dudik 2008 for a thorough examination of the regularization settings).
We ran a number of Maxent models (fig. 5), each time varying the set of features we selected and the setting for regularization. We then plotted AUC and gain for each model against the total number of parameters required by the model. One would expect greater gain and greater AUC in models with larger numbers of parameters, just as a regression model with more covariates will generally explain more variance in a data set than a model with fewer covariates. The penalty for large numbers of parameters can be overfitting the data. If the model is overfitted to train-ing data, then it will perform badly when applied to new data (i.e., test data that were not used to create the model). We used this method to refine models for each of the three
16
GENERAL TECHNICAL REPORT PNW-GTR-848
Figure 5—Relationship between area under the receiver operator characteristic curve (AUC) for a variety of Maxent model feature sets and the number of model parameters in the Washington study area. Model features are abbreviated as L (linear), P (product or interaction), H (hinge), A (auto, in which any combina-tion of features can be selected automatically by the software), T (threshold), and Q (quadratic). Numbers following the model feature indicate regularization setting. See Phillips and Dudik (2008) for definitions of feature types. Note that models “LQP” and “LQP_1.5A” have relatively large Test AUC values with moder-ate numbers of parameters, indicating parsimonious models that perform well.
states, and in each case, the Linear plus Quadratic plus Product features performed best relative to numbers of pa-rameters required (fig. 5). Once we selected this feature set, we did further tests to fine tune the regularization setting in each state from the default value of 1.0 to several slightly higher values ranging to 2.0 (see Phillips and Dudik 2008). These final comparisons, based on 10 replicated model runs, led us to select the default regularization setting (1.0) in California and Washington, and a regularization setting of 1.5 in Oregon (fig. 6).
Summarizing Maxent OutputOnce we selected our final model structure, we used k-fold cross-validation to build our models in each modeling region (i.e., for each state) and computed an area-adjusted frequency (AAF) index (Boyce et al. 2002, Hirzel et al.
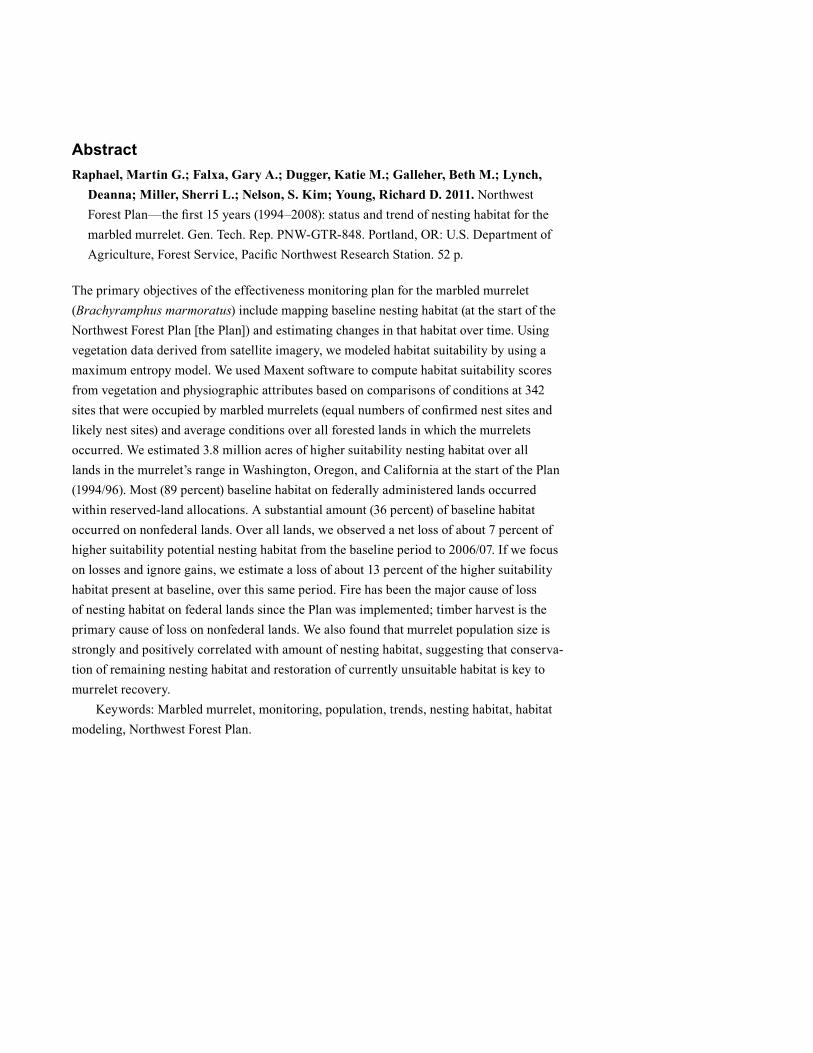
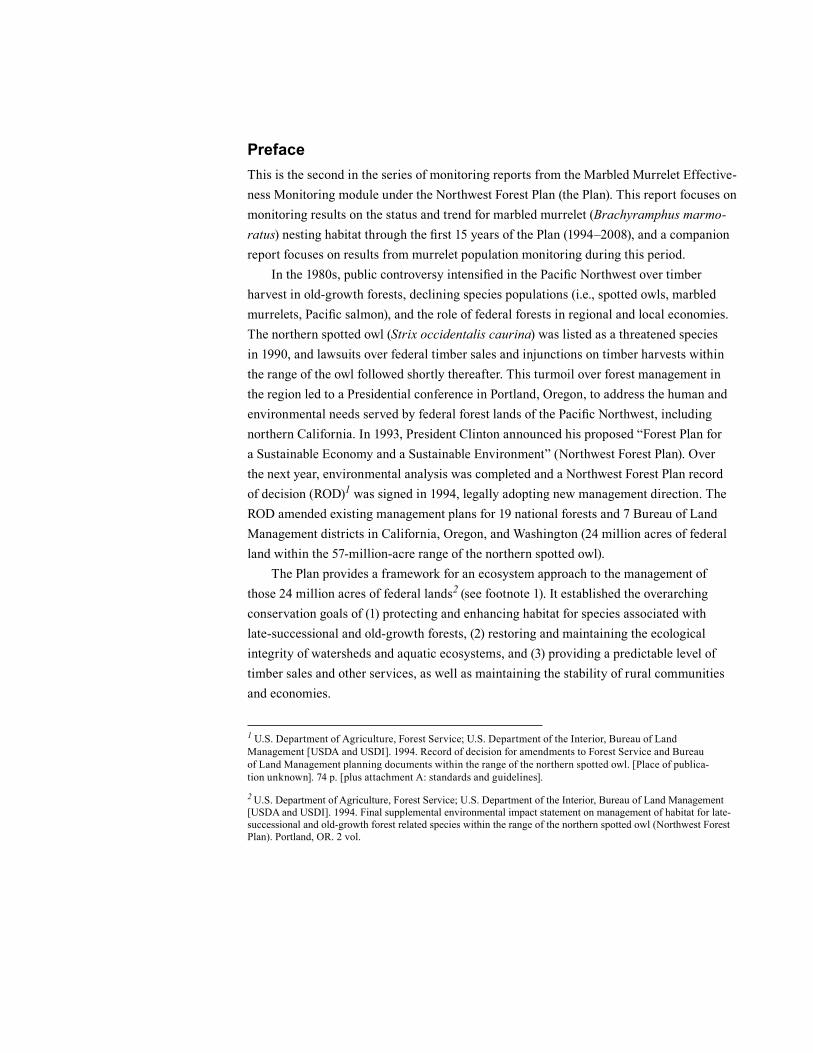
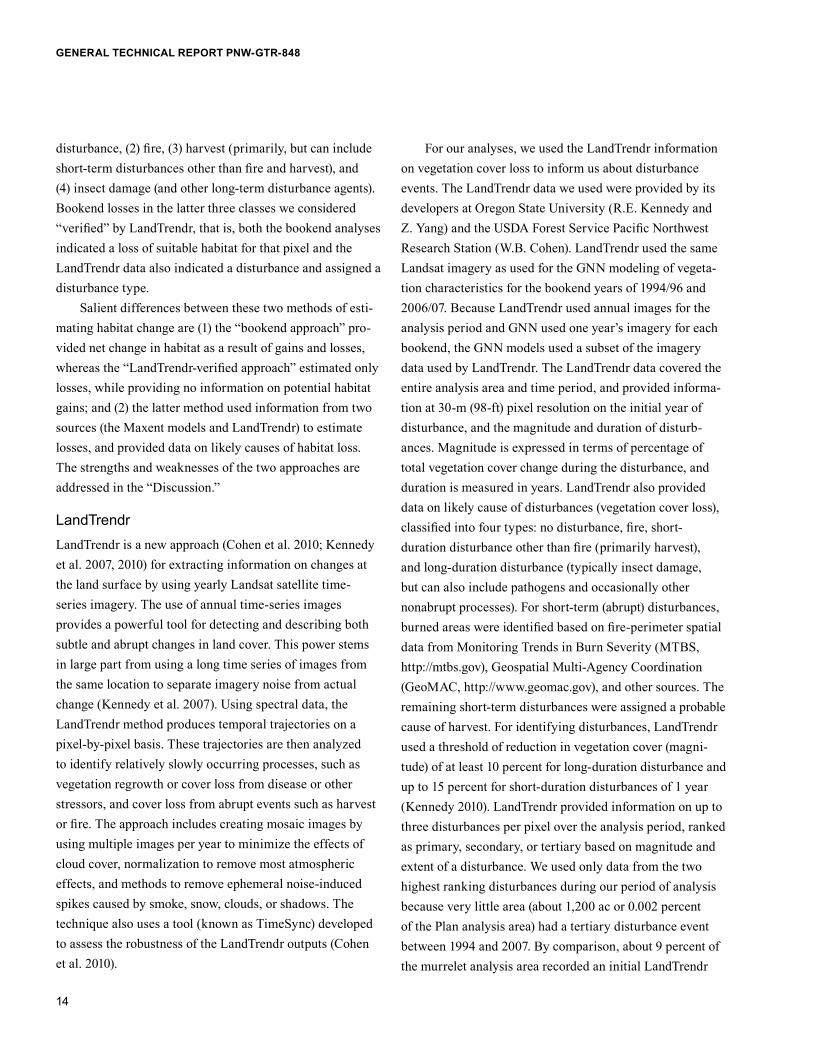
2006) from a set of 10 replicated model runs for each state (fig. 7). The primary output from the Maxent model is a logistic probability for each pixel in the model region. The logistic probability can be interpreted as the relative likeli- hood of murrelet presence at that pixel given the set of environmental covariates at that pixel. For our study, AAF is the relationship between the proportions of murrelet locations (presence sites) with various estimated logistic probability values divided by the proportion of the available landscape that is estimated to have those same probability values. Values less than 1.0 indicate that the proportion of murrelet locations in those probability classes was less than the proportion in the landscape, whereas AAF values greater than 1.0 indicate the proportion of murrelet locations in those probability classes was greater than the propor- tion of the landscape in those same probability classes.
17
Northwest Forest Plan—the First 15 Years (1994–2008): Status and Trend of Nesting Habitat for the Marbled Murrelet
Figure 6—Illustration of mean and 95 percent confidence intervals for test gain (a measure of model performance—larger values indicate stronger models) and numbers of parameters of a Maxent model using Linear, Quadratic, and Product (LQP) features in the Oregon study area for three alternative settings of regular-ization, varying from 1.0 (the default), 1.5 and 2.0. Confidence intervals were calculated from results of 10 repli-cated model runs in which 25 percent of the murrelet sites were randomly selected and held out.
Figure 7—Mean and 95 percent confidence intervals of the ratio between predicted and expected frequencies (P/E ratio) of occurrence from 10 replicated Maxent model runs in Washington (A), Oregon (B), and California (C). We used the point where the P/E ratio = 1.0 to separate higher and lower suitability habitat. Each of these regions was further subdivided into two classes based on the mean logis-tic probability of all study area pixels in the range 0 to P/E = 1.0 and from 1.0 to the maximum score.
18
GENERAL TECHNICAL REPORT PNW-GTR-848
Figure 7—Continued
19
Northwest Forest Plan—the First 15 Years (1994–2008): Status and Trend of Nesting Habitat for the Marbled Murrelet
For example, if 1 percent of the landscape was estimated to fall within a logistic probability value of 0.8, but 10 percent of the murrelet locations were estimated to have logistic probability values of 0.8, the AAF value would be 10.
For each set of 10 replicated model runs, we set Maxent to partition the presence sites into 75 percent to be used to train the model, and withholding 25 percent for testing the performance of the resulting model. We retained this approach for the final model runs for each modeling region because the replicated model iterations with ran-domly partitioned presence sites provided data to assess the average behavior of the models; this also allowed for statistical testing of performance (see below). We computed the AAF values from the test data for each of the 10 runs, then computed a mean and standard deviation (SD) for the AAF values across all Maxent logistic probabilities (fig. 7). As recommended by Hirzel et al. (2006), we used a moving window of 0.1 width and a resolution of 0.01 to perform these calculations. We subsequently used the point where the ratio of predicted probability of presence versus expected probability of presence (P/E) = 1.0 (i.e., where the predicted frequency of test sites equals the expected frequency of test sites) as a threshold to separate higher from lower habitat suitability. We further subdivided the regions of lower and higher relative habitat suitability into two halves, defined by computing the mean of the distribu-tion of scores between the low score and the threshold (P/E = 1) and the distribution between the AAF threshold and the high score (illustrated in fig. 7), creating four habitat suitability classes. We used these four classes to summarize acreages of habitat into four levels from lowest to highest relative habitat suitability. We defined class 1 (lowest likeli-hood of suitability), class 2 (marginal likelihood of suit-ability), class 3 (moderately high likelihood of suitability), and class 4 (highest likelihood of suitability). For purposes of summarizing data in the text, we pooled class 3 and class 4 and refer to these pooled classes as “higher suitability habitat.” The plot of P/E against the mean habitat suitability of each class (fig. 7) provides a test for model performance, as a good model is expected to show a monotonically increasing curve (Boyce et al. 2002), for which we tested by
using the Spearman rank correlation coefficient (Boyce et al. 2002, Hirzel et al. 2006).
To portray variability in our estimates of amounts of suitable nesting habitat, we computed 95 percent confidence intervals for mean acres of higher suitability habitat (those pixels with logistic scores above the cutoff where the P/E ratio is > 1.0). To do this calculation, we obtained the 10 sets of logistic probability maps from the 10 replicated Maxent runs, calculated acres above the threshold from each map, and then computed the variance and confidence interval from the 10 replicated maps for each study region (state).
Habitat Pattern–Edge Versus CoreMarbled murrelet nest success is reduced along forested edges owing to higher rates of nest depredation near edges (Malt and Lank 2007, Manley and Nelson 1999, Raphael et al. 2002). For that reason, we investigated the configura-tion of potential habitat by computing how much of that habitat occurred along edges versus within-forest interior conditions. We defined core habitat as the internal portion of a contiguous block that is > 295 ft (three 30-m pixels) from the edge. We defined edge habitat as all habitat that is within 295 ft of nonhabitat. We used GUIDOS v1.3 to con-duct the pattern analysis (Soille and Vogt 2009, http://forest.jrc.ec.europa.eu/biodiversity/GUIDOS/). We worked within the entire area modeled (i.e., an entire state) to eliminate as much artificial edge as possible. We resampled the binary grids (a pixel was coded as either higher or lower suitability habitat) from 98 to 197 ft (30 to 60 m) prior to input into GUIDOS by using nearest neighbor resampling method. This method (which is recommended for categorical data) finds the location of the new 197-ft (60-m) cell center on the output grid and the corresponding cell with the closest cell center on the input 98-ft (30-m) grid and then assigns that 197-ft (60-m) cell the value of that 98-ft (30-m) cell. For purposes of reporting results, we converted the data back to the 98-ft pixel scale by resampling.
Murrelet Abundance PatternsTo investigate whether our estimates of amounts of habitat can be used to predict the abundance of marbled mur-relets, we tallied acreage of habitat in each suitability class
20
GENERAL TECHNICAL REPORT PNW-GTR-848
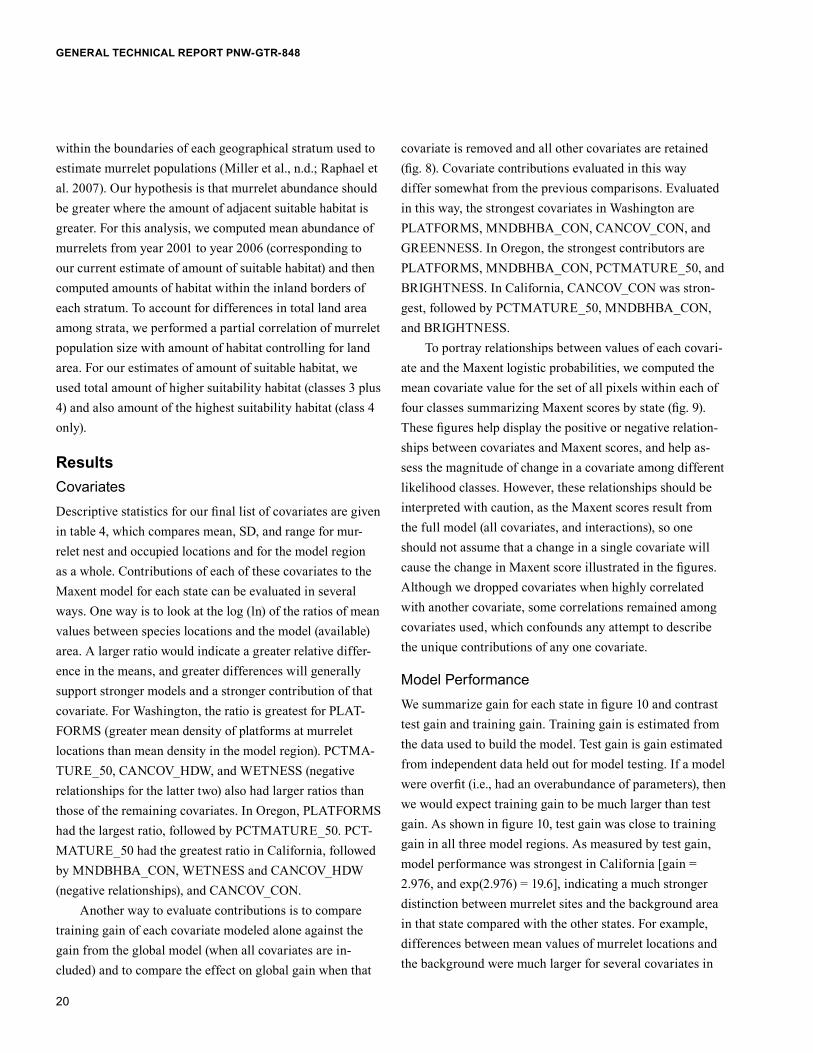
within the boundaries of each geographical stratum used to estimate murrelet populations (Miller et al., n.d.; Raphael et al. 2007). Our hypothesis is that murrelet abundance should be greater where the amount of adjacent suitable habitat is greater. For this analysis, we computed mean abundance of murrelets from year 2001 to year 2006 (corresponding to our current estimate of amount of suitable habitat) and then computed amounts of habitat within the inland borders of each stratum. To account for differences in total land area among strata, we performed a partial correlation of murrelet population size with amount of habitat controlling for land area. For our estimates of amount of suitable habitat, we used total amount of higher suitability habitat (classes 3 plus 4) and also amount of the highest suitability habitat (class 4 only).
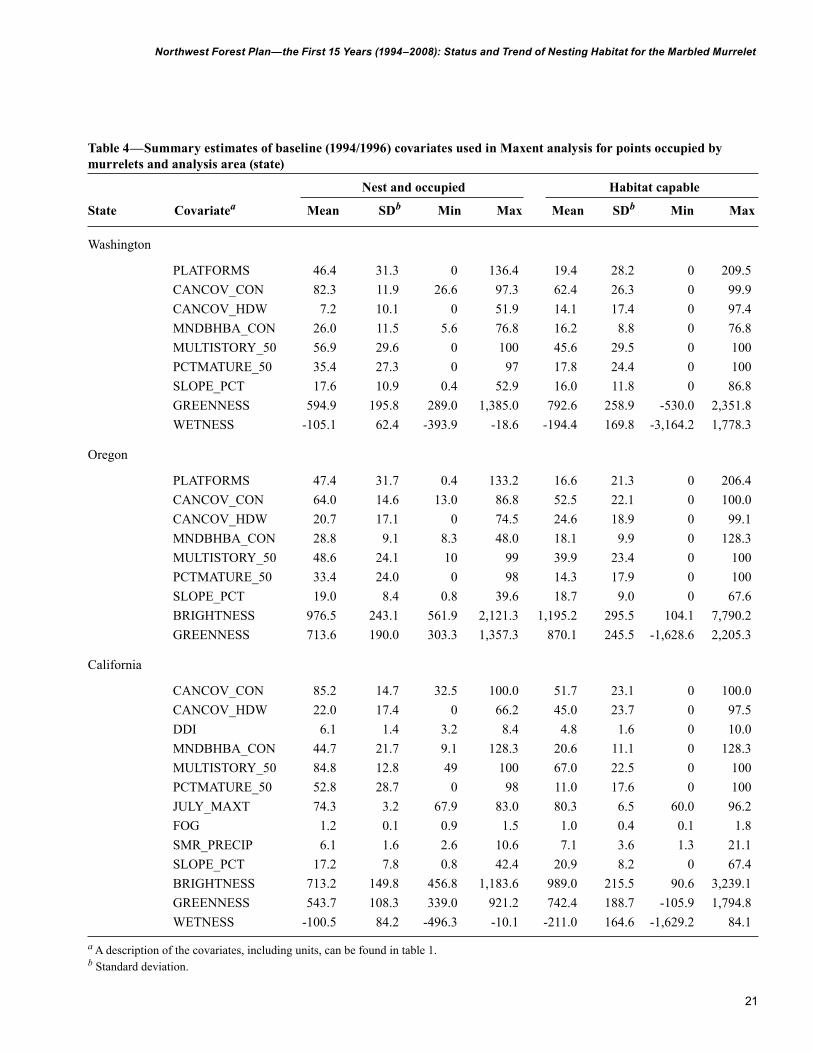
ResultsCovariatesDescriptive statistics for our final list of covariates are given in table 4, which compares mean, SD, and range for mur-relet nest and occupied locations and for the model region as a whole. Contributions of each of these covariates to the Maxent model for each state can be evaluated in several ways. One way is to look at the log (ln) of the ratios of mean values between species locations and the model (available) area. A larger ratio would indicate a greater relative differ-ence in the means, and greater differences will generally support stronger models and a stronger contribution of that covariate. For Washington, the ratio is greatest for PLAT-FORMS (greater mean density of platforms at murrelet locations than mean density in the model region). PCTMA-TURE_50, CANCOV_HDW, and WETNESS (negative relationships for the latter two) also had larger ratios than those of the remaining covariates. In Oregon, PLATFORMS had the largest ratio, followed by PCTMATURE_50. PCT-MATURE_50 had the greatest ratio in California, followed by MNDBHBA_CON, WETNESS and CANCOV_HDW (negative relationships), and CANCOV_CON.
Another way to evaluate contributions is to compare training gain of each covariate modeled alone against the gain from the global model (when all covariates are in-cluded) and to compare the effect on global gain when that
covariate is removed and all other covariates are retained (fig. 8). Covariate contributions evaluated in this way differ somewhat from the previous comparisons. Evaluated in this way, the strongest covariates in Washington are PLATFORMS, MNDBHBA_CON, CANCOV_CON, and GREENNESS. In Oregon, the strongest contributors are PLATFORMS, MNDBHBA_CON, PCTMATURE_50, and BRIGHTNESS. In California, CANCOV_CON was stron-gest, followed by PCTMATURE_50, MNDBHBA_CON, and BRIGHTNESS.
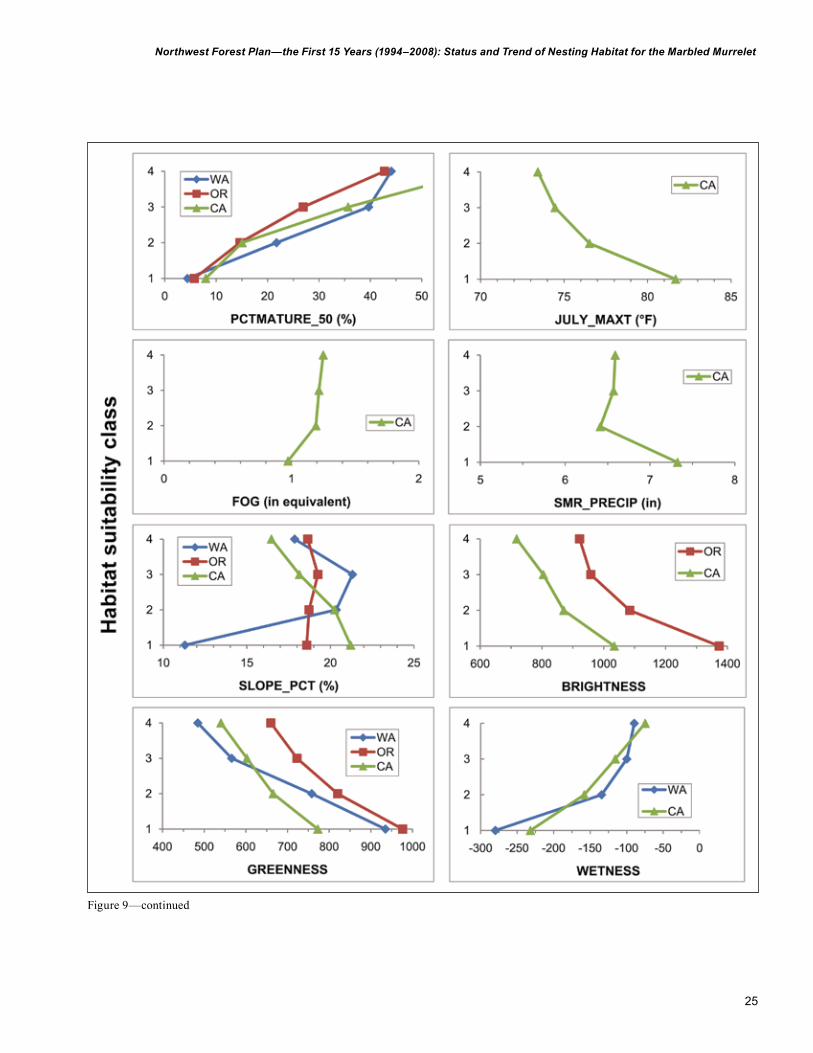
To portray relationships between values of each covari-ate and the Maxent logistic probabilities, we computed the mean covariate value for the set of all pixels within each of four classes summarizing Maxent scores by state (fig. 9). These figures help display the positive or negative relation-ships between covariates and Maxent scores, and help as-sess the magnitude of change in a covariate among different likelihood classes. However, these relationships should be interpreted with caution, as the Maxent scores result from the full model (all covariates, and interactions), so one should not assume that a change in a single covariate will cause the change in Maxent score illustrated in the figures. Although we dropped covariates when highly correlated with another covariate, some correlations remained among covariates used, which confounds any attempt to describe the unique contributions of any one covariate.
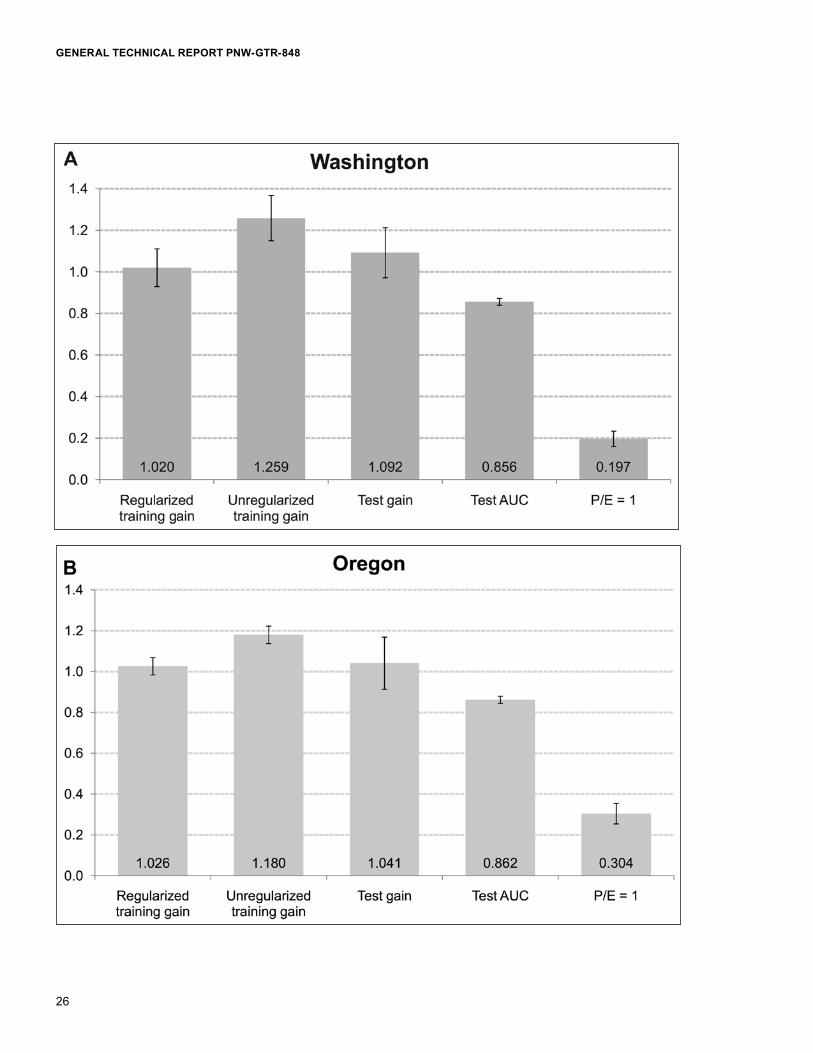
Model PerformanceWe summarize gain for each state in figure 10 and contrast test gain and training gain. Training gain is estimated from the data used to build the model. Test gain is gain estimated from independent data held out for model testing. If a model were overfit (i.e., had an overabundance of parameters), then we would expect training gain to be much larger than test gain. As shown in figure 10, test gain was close to training gain in all three model regions. As measured by test gain, model performance was strongest in California [gain = 2.976, and exp(2.976) = 19.6], indicating a much stronger distinction between murrelet sites and the background area in that state compared with the other states. For example, differences between mean values of murrelet locations and the background were much larger for several covariates in
21
Northwest Forest Plan—the First 15 Years (1994–2008): Status and Trend of Nesting Habitat for the Marbled Murrelet
Table 4—Summary estimates of baseline (1994/1996) covariates used in Maxent analysis for points occupied by murrelets and analysis area (state)
Nest and occupied Habitat capable
State Covariatea Mean SDb Min Max Mean SDb Min Max
a A description of the covariates, including units, can be found in table 1.b Standard deviation.
22
GENERAL TECHNICAL REPORT PNW-GTR-848
23
Northwest Forest Plan—the First 15 Years (1994–2008): Status and Trend of Nesting Habitat for the Marbled Murrelet
Figure 8—Contributions of environmental variables (covariates) to Maxent models of habitat suitability in Washington (A), Oregon (B), and California (C). The green bar indicates gain from a model with all covariates included in a model. The brown bars indicate gain from a model with only that covariate included. The dark blue bar is the reduction in gain (relative to the green bar) that would occur if that covariate were removed from the model but all other covariates were in place.
24
GENERAL TECHNICAL REPORT PNW-GTR-848
Figure 9—Relationships between individual covariates and final Maxent logistic probabilities summarized by habitat suitability class for each state.
25
Northwest Forest Plan—the First 15 Years (1994–2008): Status and Trend of Nesting Habitat for the Marbled Murrelet
Figure 9—continued
26
GENERAL TECHNICAL REPORT PNW-GTR-848
27
Northwest Forest Plan—the First 15 Years (1994–2008): Status and Trend of Nesting Habitat for the Marbled Murrelet
Figure 10—Mean (and 95 percent confidence intervals) of measures of model performance from 10 replicated Maxent model runs in Washington (A), Oregon (B), and California (C). The y-axis shows units for each of the test statistics. AUC is the area under the receiver operator characteristic curve and P/E = 1 is the Maxent score (logistic probability) where predicted and expected frequen-cies of predicted occurrence are equal. See “Methods” in text for explanations of all terms.
California than in Oregon or Washington (see MNDBHBA_ CON and PCTMATURE_50, table 4). Test gains were lower in Oregon (gain = 1.041) and Washington (gain = 1.092).
Test AUC values were ranked among the model regions in the same pattern as gain: AUC was greatest in the California model (AUC = 0.975) and lower in the models for Oregon (AUC = 0.862) and Washington (AUC = 0.856) (fig. 10). For all three models, the plot of P/E values against the mean habitat suitability of each class showed a monotoni-cally increasing curve with high correlation value (Rs > 0.99; P < 0.001), indicative of strong model performance.
Baseline Habitat SuitabilityOur models depict the predicted suitability of conditions for murrelet occurrence (figs. 11 through 13), with higher values (in darker shades of green) indicating higher probabilities that conditions are suitable (AAF scores ≥ 1.0) and lower
values (shades of yellow) indicating low predicted prob-abilities of suitability (AAF scores < 1.0). The proportion of habitat-capable land that was of higher suitability varied by state. In Washington and Oregon, 21 percent of all habitat-capable land was classified as higher suitability in 1996, but in California only 4 percent was classified as higher suitability in 1994 (table 5). Over all lands, we estimated a total of 3.81 million acres of higher suitability habitat in 1994/96 (table 5), of which 1.69 million acres (44 percent) was in the highest habitat suitability class (class 4; tables 6 and 7). Most higher suitability habitat (57 percent) was on federally reserved lands, but a substantial amount (36 percent) was on nonfederal land. In California, where little federal land exists near the coast, more of the higher suit-ability habitat occurred on nonfederal lands than on federal lands (fig. 14; tables 6 and 7). On federal lands over the three-state region, 89 percent of higher suitability habitat fell within reserves. Among physiographic provinces, the
28
GENERAL TECHNICAL REPORT PNW-GTR-848
Figu
re 1
1—H
abita
t sui
tabi
lity
map
for W
ashi
ngto
n, a
s of b
asel
ine
in 1
996.
Pla
n m
urre
let z
ones
are
den
oted
as Z
one
1 cl
oser
to th
e w
est c
oast
and
Zon
e 2
fart
her a
way
from
th
e co
ast.
29
Northwest Forest Plan—the First 15 Years (1994–2008): Status and Trend of Nesting Habitat for the Marbled Murrelet
Figure 12—Habitat suitability map for Oregon, as of baseline in 1996. Plan murrelet zones are denoted as Zone 1 closer to the west coast and Zone 2 farther away from the coast.
30
GENERAL TECHNICAL REPORT PNW-GTR-848
Figure 13—Habitat suitability map for California, as of baseline in 1994. Plan murrelet zones are denoted as Zone 1 closer to the west coast and Zone 2 farther away from the coast.
31
Northwest Forest Plan—the First 15 Years (1994–2008): Status and Trend of Nesting Habitat for the Marbled Murrelet
Table 5—Estimated amount and distribution of potential marbled murrelet nesting habitat at the start of the Northwest Forest Plan (baseline, 1994/96) and losses owing to harvest, fire, and other causes from the baseline year to 2006/07a
Higher suitability nesting habitat
Habitat- Baseline LossesLand class capable (1994/96) % Fire Harvest Otherb Total %
Total 20,711.6 3,812.3 18.4 57.8 409.7 23.2 490.7 12.9
a Totals were computed prior to rounding. Higher suitability potential nesting habitat includes class 3 (moderately high suitability) plus class 4 (highest suitability).b Other includes insects, disease, and other longer term disturbances.
32
GENERAL TECHNICAL REPORT PNW-GTR-848Ta
ble
6—D
istr
ibut
ion
of p
oten
tial m
urre
let n
estin
g ha
bita
t on
fede
ral l
ands
, by
habi
tat s
uita
bilit
y cl
ass,
for
the
base
line
peri
od
(199
4 or
199
6)a
H
abita
t cap
able
(100
0s o
f acr
es)
Hab
itat c
apab
le (1
000s
of a
cres
)
N
onre
serv
ed
Res
erve
d
N
ot
Not
H
abita
t
habi
tat
habi
tat
capa
ble
Stat
e/pr
ovin
ce
capa
ble
Cla
ss 1
C
lass
2
Cla
ss 3
C
lass
4
capa
ble
Cla
ss 1
C
lass
2
Cla
ss 3
C
lass
4
tota
l
Was
hing
ton:
(Max
entb sc
ore)
0–.1
2 0.
12–.
37
0.37
–.52
0.
52–1
0–.1
2 0.
12–.
37
0.37
–.52
0.
52–1
Oly
mpi
c Pe
nins
ula
1.1
47.3
55
.7
12.6
6.
7 19
1.4
139.
0 54
1.6
299.
8 23
7.3
1,34
0.2
Wes
tern
Low
land
s 0.
1 0.
3 0.
2 0.
0 0.
0 45
.6
28.6
19
.6
16.8
16
.0
81.5
Wes
tern
Cas
cade
s 17
.1
77.2
98
.7
35.8
27
.3
469.
1 22
6.4
617.
9 38
2.5
364.
1 1,
829.
9 E
aste
rn C
asca
des
10.9
14
.8
23.6
17
.9
13.5
53
.3
17.0
52
.2
36.6
34
.6
210.
1
Tot
al
29.2
13
9.7
178.
2 66
.3
47.5
75
9.4
411.
0 1,
231.
3 73
5.7
652.
1 3,
461.
7
Ore
gon:
(Max
ent s
core
)
0–.1
0 0.
10–.
30
0.30
–.49
0.
49–1
0–.1
0 0.
10–.
30
0.30
–.49
0.
49–1
Coa
st R
ange
3.
8 14
8.7
119.
3 43
.0
41.9
29
.9
266.
9 26
1.4
173.
9 30
3.5
1,35
8.8
Will
amet
te V
alle
y 0.
2 0.
7 0.
4 0.
1 0.
3 4.
0 1.
7 0.
4 0.
2 0.
3 4.
2 W
este
rn C
asca
des
0.0
0.0
0.0
0.0
0.0
0.0
0.2
0.2
0.2
0.2
0.8
Kla
mat
h 1.
8 67
.7
94.4
41
.9
16.7
7.
6 21
9.1
375.
6 17
7.5
89.4
1,
082.
3
Tot
al
5.8
217.
2 21
4.1
85.0
59
.0
41.5
48
7.9
637.
7 35
1.7
393.
4 2,
446.
1
Cal
iforn
ia:
(Max
ent s
core
)
0–.0
1 0.
01–.
15
0.15
–.36
0.
36–1
0–.0
1 0.
01–.
15
0.15
–.36
0.
36–1
Coa
st R
ange
2.
5 10
.8
4.0
1.0
2.1
61.2
13
9.8
64.6
11
.4
14.9
24
8.6
Kla
mat
h 4.
6 17
6.8
22.4
1.
5 0.
2 13
.7
482.
0 59
.1
3.5
0.4
745.
8
Tot
al
7.1
187.
6 26
.4
2.6
2.3
74.9
62
1.7
123.
7 14
.9
15.3
99
4.4
Plan
are
a to
tal
42.1
54
4.5
418.
7 15
3.9
108.
7 87
5.8
1,52
0.6
1,99
2.6
1,10
2.3
1,06
0.8
6,90
2.1
a Num
bers
roun
ded
to n
eare
st 1
00; t
otal
s wer
e co
mpu
ted
prio
r to
roun
ding
. Cla
ss 1
= lo
wes
t sui
tabi
lity,
Cla
ss 2
= m
argi
nal s
uita
bilit
y, C
lass
3 =
mod
erat
ely
high
suit-
abili
ty, a
nd C
lass
4 =
hig
hest
suita
bilit
y.b M
axen
t is a
hab
itat s
uita
bilit
y m
odel
ing
softw
are
used
in th
is st
udy
to m
odel
rela
tive
suita
bilit
y of
mar
bled
mur
rele
t ne
stin
g ha
bita
t.
33
Northwest Forest Plan—the First 15 Years (1994–2008): Status and Trend of Nesting Habitat for the Marbled Murrelet
Table 7—Distribution of potential murrelet nesting habitat on nonfederal lands, by habitat suitability class, for the baseline period (1994 or 1996)a
Habitat capable (1000s of acres)
Not Habitat habitat capable State/province capable Class 1 Class 2 Class 3 Class 4 total
Plan area total 3,249.9 8,673.7 3,749.1 863.7 522.9 13,809.5a Numbers rounded to nearest 100; totals were computed prior to rounding. Class 1 = lowest suitability, Class 2 = marginal suitability, Class 3 = moderately high suitability, and Class 4 = highest suitability.b Maxent is a habitat suitability modeling software used in this study to model relative suitability of marbled murrelet nesting habitat.
34
GENERAL TECHNICAL REPORT PNW-GTR-848
Figure 14—Baseline (1994 in California and 1996 in Oregon and Washington) amounts of higher suitability habitat by ownership and state. Higher suitability nesting habitat includes class 3 (moderately high suitability) plus class 4 (highest suitability).
largest amounts of higher suitability habitat occurred in the Western Cascades of Washington, Olympic Peninsula, and Oregon Coast Range provinces (fig. 15; tables 6 and 7).
The spatial configuration of higher suitability habitat varied by state and land allocation. We used the ratio of edge habitat to total habitat (i.e., the proportion of higher suitability habitat that occurs within 197 ft [60 m] of an edge versus the total edge and core habitat) to assess habitat configuration patterns. Higher suitability habitat on non-federal lands occurred mostly within edges, especially in Oregon and Washington where habitat in edges was about 80 percent of total habitat (fig. 16); habitat in reserves on federal lands had the lowest proportion of edge habitat in all three states, but that proportion still exceeded 50 percent in all states.
Habitat ChangeAs discussed above, we used two methods to assess change in the amount and distribution of habitat from the baseline (1994 in California and 1996 in Oregon and Washington) to “current” conditions represented by 2006 data in Oregon
and Washington and 2007 data in California. Net change in higher suitability habitat varied depending on method. Un-der the bookend approach, which considers both gains and losses, we estimate that higher suitability habitat declined from 3.81 million acres to 3.54 million acres: 8.9 percent, 4.7 percent, and 2.0 percent in Washington, Oregon, and California, respectively (fig. 17; tables 8 and 9). Under the LandTrendr-verified approach, which allows only for losses, higher suitability habitat declined by greater amounts: 11.0, 16.7, and 6.3 percent in the three states, respectively (table 5). For both methods, change in habitat is within the 95 percent confidence interval of our baseline estimate in all three states (fig. 17). Loss of higher suitability habitat was greatest on nonfederal lands (losses exceeded 30 percent of baseline in Washington and Oregon) and lowest from fed-erally reserved lands (table 5). The cause of loss varies by land ownership. On federal lands, most of this loss of higher suitability habitat (74 percent) was due to fire, and about 20 percent (15,300 acres) was due to harvest (table 5). On nonfederal lands, most loss (95 percent) was due to harvest (table 5). See tables 8 and 9 for details on habitat change by land allocation and physiographic province.
35
Northwest Forest Plan—the First 15 Years (1994–2008): Status and Trend of Nesting Habitat for the Marbled Murrelet
Figure 15—Baseline (1994 in California and 1996 in Oregon and Washington) amounts of nesting habitat by suitability class and by physiographic province. OLY = Washington Olympic Peninsula, WLO = Washington Western Lowlands, WCW = Washington Western Cascades, ECW = Washington Eastern Cascades, COA = Oregon Coast Range, WIL = Oregon Willamette Valley, WCO = Oregon Western Cascades, KLA = Oregon Klamath, CACOA = California Coast Range, CAKLA = California Klamath.
Figure 16—Baseline (1994 in California and 1996 in Oregon and Washington) proportion of higher suitability nesting habitat that occurred along edges within 60 m of lower suitability habitat by land allocation and state. Higher suitability habitat includes class 3 (moderately high suitability) plus class 4 (highest suitability). Lower suitability habitat includes class 1 (lowest suitability) plus class 2 (marginal suitability).
36
GENERAL TECHNICAL REPORT PNW-GTR-848
Figure 17—Amounts of higher suitability habitat at the baseline (1994 in California and 1996 in Washington and Oregon) and at the end of the modeling period (2006 in Washington and Oregon and 2007 in California) as estimated from Maxent model results from each time (“bookend”) and from LandTrendr (see text for methods). Higher suitability habitat includes class 3 (moderately high suit-ability) plus class 4 (highest suitability). Values are the means from 10 replicated Maxent runs in each state along with 95 percent confidence intervals.
37
Northwest Forest Plan—the First 15 Years (1994–2008): Status and Trend of Nesting Habitat for the Marbled Murrelet
Tabl
e 8—
Fede
ral l
ands
: Cha
nges
in h
ighe
r su
itabi
lity
pote
ntia
l mar
bled
mur
rele
t nes
ting
habi
tata fr
om b
asel
ine
year
(199
4/96
) to
endi
ng y
ear
(200
6/07
) usi
ng tw
o di
ffer
ent c
ompu
tatio
n m
etho
dsb
L
osse
s and
cau
ses:
bas
ed o
n L
andT
rend
r-ve
rifie
d ap
proa
chb
Lan
dTre
ndr
dist
urba
nce
assi
gnm
ent
Tota
l hab
itat
H
abita
t are
a an
d ch
ange
s bas
ed o
n M
axen
t boo
kend
mod
elsb
for
loss
es
loss
esc
Hab
itat i
n H
abita
t G
ross
G
ross
Los
s as
Phys
iogr
aphi
c H
abita
t-
1994
/96
in
habi
tat
habi
tat
Net
N
et
In
sect
/
No
LT
%
of
prov
ince
ca
pabl
e (b
asel
ine)
20
06/0
7 lo
ss
gain
ch
ange
ch
ange
Fi
re
dise
ase
Har
vest
dis
turb
ance
A
cres
ba
selin
e
Th
ousa
nd a
cres
Pe
rcen
t Th
ousa
nd a
cres
Pe
rcen
tR
eser
ved:
Was
hing
ton—
Oly
mpi
c Pe
nins
ula
1,21
7.8
537.
1 53
2.9
39.8
35
.5
-4.2
-0
.8
0.3
1.1
0.8
37.5
2.
2 0.
4 W
este
rn L
owla
nds
81.0
32
.8
33.5
3.
4 4.
1 0.
8 2.
3 0.
0 0.
2 0.
9 2.
3 1.
1 3.
4 W
este
rn C
asca
des
1,59
0.9
746.
6 70
4.3
69.5
27
.2
-42.
3 -5
.7
0.0
0.9
1.9
66.7
2.
7 0.
4 E
aste
rn C
asca
des
140.
4 71
.2
70.2
5.
8 4.
8 -1
.0
-1.4
0.
0 0.
9 0.
9 4.
1 1.
7 2.
4
Ore
gon—
Coa
st R
ange
1,
005.
8 47
7.5
465.
9 47
.6
36.0
-1
1.6
-2.4
0.
1 0.
2 3.
3 44
.1
3.5
0.7
Will
amet
te V
alle
y 2.
6 0.
5 0.
5 0.
0 0.
1 0.
0 0.
6 0.
0 0.
0 0.
0 0.
0 0.
0 5.
0 W
este
rn C
asca
des
0.8
0.3
0.3
0.0
0.0
-0.0
-6
.3
0.0
0.0
0.0
0.0
0.0
1.9
Kla
mat
h 86
1.5
266.
9 24
9.7
74.5
57
.3
-17.
2 -6
.4
51.2
0.
4 1.
0 22
.0
52.5
19
.7
Cal
iforn
ia—
Coa
st R
ange
23
0.7
26.3
26
.8
1.3
1.8
0.5
1.8
0.0
0.0
0.1
1.1
0.2
0.6
Kla
mat
h 54
4.9
3.8
3.9
0.5
0.6
0.1
2.0
0.0
0.1
0.0
0.3
0.2
4.9
Plan
are
a su
btot
alc
5,67
6.3
2,16
3.1
2,08
8.1
242.
4 16
7.4
-75.
0 -3
.5
51.6
3.
7 8.
8 17
8.2
64.2
3.
0
Non
rese
rved
:
Was
hing
ton—
Oly
mpi
c Pe
nins
ula
122.
4 19
.4
20.1
4.
6 5.
3 0.
7 3.
7 0.
0 0.
0 0.
3 4.
3 0.
3 1.
5 W
este
rn L
owla
nds
0.5
0.0
0.0
0.0
0.0
0.0
0.0
0.0
0.0
0.0
0.0
0.0
0.0
Wes
tern
Cas
cade
s 23
9.0
63.1
5
5.6
11.1
3.
6 -7
.5
-11.
9 0.
0 0.
2 0.
5 10
.4
0.7
1.1
Eas
tern
Cas
cade
s 69
.8
31.3
30
.2
3.1
2.0
-1.2
-3
.7
0.0
0.1
0.2
2.8
0.3
1.1
38
GENERAL TECHNICAL REPORT PNW-GTR-848Ta
ble
8—Fe
dera
l lan
ds: C
hang
es in
hig
her
suita
bilit
y po
tent
ial m
arbl
ed m
urre
let n
estin
g ha
bita
ta from
bas
elin
e ye
ar (1
994/
96) t
o en
ding
yea
r (2
006/
07) u
sing
two
diff
eren
t com
puta
tion
met
hods
b (con
tinue
d)
L
osse
s and
cau
ses:
bas
ed o
n L
andT
rend
r-ve
rifie
d ap
proa
chb
Lan
dTre
ndr
dist
urba
nce
assi
gnm
ent
Tota
l hab
itat
H
abita
t are
a an
d ch
ange
s bas
ed o
n M
axen
t boo
kend
mod
elsb
for
loss
es
loss
esc
Hab
itat i
n H
abita
t G
ross
G
ross
Los
s as
Phys
iogr
aphi
c H
abita
t-
1994
/96
in
habi
tat
habi
tat
Net
N
et
In
sect
/
No
LT
%
of
prov
ince
ca
pabl
e (b
asel
ine)
20
06/0
7 lo
ss
gain
ch
ange
ch
ange
Fi
re
dise
ase
Har
vest
dis
turb
ance
A
cres
ba
selin
e
Th
ousa
nd a
cres
Pe
rcen
t Th
ousa
nd a
cres
Pe
rcen
t
Non
rese
rved
:
Ore
gon—
Coa
st R
ange
35
3.0
84.9
92
.2
14.2
21
.5
7.2
8.5
0.0
0.3
3.4
10.5
3.
7 4.
3 W
illam
ette
Val
ley
1.6
0.4
0.5
0.0
0.1
0.0
5.6
0.0
0.0
0.0
0.0
0.0
3.3
Wes
tern
Cas
cade
s 0.
0 0.
0 0.
0 0.
0 0.
0 0.
0 31
.6
0.0
0.0
0.0
0.0
0.0
0.0
Kla
mat
h 22
0.8
58.7
62
.2
13.8
17
.3
3.5
6.0
5.3
0.2
2.0
6.3
7.4
12.7
Cal
iforn
ia—
Coa
st R
ange
17
.9
3.1
3.2
0.1
0.2
0.1
2.1
0.0
0.0
0.0
0.1
0.0
0.9
Kla
mat
h 20
1.0
1.7
1.7
0.2
0.2
0.0
0.8
0.0
0.1
0.0
0.2
0.1
4.0
Plan
are
a su
btot
alc
1,22
5.9
262.
7 26
5.6
47.1
50
.1
2.9
1.1
5.3
0.8
6.5
34.6
12
.6
4.8
Fede
ral l
and
tota
lsc
Was
hing
ton
tota
l 3,
461.
7 1,
501.
5 1,
446.
9 13
7.2
82.5
-5
4.6
-3.6
0.
3 3.
3 5.
5 12
8.1
9.1
0.6
Ore
gon
tota
l 2,
446.
1 88
9.2
871.
2 15
0.2
132.
2 -1
8.0
-2.0
56
.5
1.0
9.7
83.0
67
.2
7.6
Cal
iforn
ia to
tal
994.
4 35
.0
35.6
2.
1 2.
8 0.
6 1.
8 0.
1 0.
2 0.
2 1.
7 0.
4 1.
3
Plan
are
a to
tal
6,90
2.1
2,42
5.7
2,35
3.7
289.
5 21
7.5
-72.
0 -3
.0
56.9
4.
5 15
.4
212.
8 76
.8
3.2
a Hig
her s
uita
bilit
y ha
bita
t inc
lude
s sui
tabi
lity
clas
s 3 p
lus s
uita
bilit
y cl
ass 4
.b T
he fi
rst m
etho
d is
bas
ed o
n co
mpa
rison
of M
axen
t “bo
oken
d” m
odel
resu
lts fo
r bas
elin
e an
d en
ding
yea
rs a
nd th
e se
cond
app
lies L
andT
rend
r (LT
) dat
a on
dis
turb
ance
s to
gros
s ha
bita
t los
ses i
dent
ified
by
the
first
met
hod,
to e
stim
ate
loss
es a
nd a
ssig
n pr
obab
le c
ause
for l
oss b
y us
ing
LT d
ata.
Gro
ss h
abita
t los
s is t
he a
rea
that
cha
nged
from
hig
her t
o lo
wer
su
itabi
lity
clas
ses w
here
as g
ross
gai
ns re
pres
ent t
he o
ppos
ite. N
et h
abita
t cha
nge
is g
ross
gai
ns m
inus
gro
ss lo
sses
, in
acre
s and
as a
per
cent
age
of b
asel
ine
habi
tat a
rea.
In “
No
LT
dist
urba
nce”
are
as, t
he b
ooke
nd m
odel
s ind
icat
ed lo
ss, b
ut L
andT
rend
r did
not
det
ect a
dis
turb
ance
.c N
umbe
rs ro
unde
d to
nea
rest
100
; tot
als w
ere
com
pute
d pr
ior t
o ro
undi
ng.
39
Northwest Forest Plan—the First 15 Years (1994–2008): Status and Trend of Nesting Habitat for the Marbled Murrelet
Tabl
e 9—
Non
fede
ral l
ands
: Cha
nges
in h
ighe
r su
itabi
lity
pote
ntia
l mar
bled
mur
rele
t nes
ting
habi
tata fr
om b
asel
ine
year
(199
4/96
) to
2006
/07
usin
g tw
o di
ffer
ent c
ompu
tatio
n m
etho
dsb
L
osse
s and
cau
ses:
bas
ed o
n L
andT
rend
r-ve
rifie
d ap
proa
chb
Lan
dTre
ndr
dist
urba
nce
assi
gnm
ent f
or
Tota
l hab
itat
H
abita
t are
a an
d ch
ange
s bas
ed o
n M
axen
t boo
kend
mod
elsb
loss
es
loss
esc
Hab
itat i
n H
abita
t G
ross
G
ross
N
et
Los
s as
Phys
iogr
aphi
c H
abita
t-
1994
/96
in
habi
tat
habi
tat
habi
tat
Net
Inse
ct/
N
o LT
% o
f pr
ovin
ce
capa
ble
(bas
elin
e)
2006
/07
loss
ga
in
chan
ge
chan
ge
Fire
di
seas
e H
arve
st d
istu
rban
ce
Acr
es
base
line
Th
ousa
nd a
cres
Pe
rcen
t Th
ousa
nd a
cres
Pe
rcen
t
Was
hing
ton:
Oly
mpi
c Pe
nins
ula
1,38
1.9
190.
8 15
6.9
76.5
42
.6
-33.
9 -1
7.8
0.0
3.7
48.1
24
.7
51.8
-2
7.2
Wes
tern
Low
land
s 4,
178.
5 42
6.8
348.
8 18
9.9
111.
8 -7
8.1
-18.
3 0.
0 9.
1 14
5.9
34.8
15
5.0
-36.
3 W
este
rn C
asca
des
1,76
5.4
174.
8 13
9.1
61.4
25
.7
-35.
7 -2
0.4
0.3
0.8
33.3
27
.0
34.4
-1
9.7
Eas
tern
Cas
cade
s 63
.6
10.3
8.
3 3.
5 1.
5 -2
.0
-19.
6 0.
0 0.
2 2.
0 1.
3 2.
2 -2
1.4
Sub
tota
lc 7,
389.
4 80
2.8
653.
1 33
1.3
181.
6 -1
49.7
-1
8.6
0.3
13.8
22
9.4
87.8
24
3.5
-30.
3
Ore
gon:
Coa
st R
ange
3,
437.
7 42
1.5
377.
9 18
6.5
142.
9 -4
3.6
-10.
3 0.
2 3.
8 13
9.5
43.0
14
3.5
-34.
0 W
illam
ette
Val
ley
100.
3 12
.3
8.6
6.8
3.0
-3.8
-3
0.7
0.0
0.1
5.7
0.9
5.9
-47.
6 W
este
rn C
asca
des
4.0
0.6
0.3
0.4
0.1
-0.3
-4
6.1
0.0
0.0
0.3
0.0
0.3
-59.
5 K
lam
ath
622.
2 51
.8
52.2
20
.2
20.6
0.
4 0.
8 0.
2 0.
5 12
.0
7.4
12.8
-2
4.7
Sub
tota
lc 4,
164.
3 48
6.2
438
.9
213.
8 16
6.6
-47.
3 -9
.7
0.4
4.4
157.
6 51
.4
162.
5 -3
3.4
Cal
iforn
ia:
Coa
st R
ange
1,
988.
0
96.0
92
.8
16.3
13
.1
-3.1
-3
.2
0.2
0.4
7.1
8.5
7.7
-8.0
Kla
mat
h 26
7.8
1.
6
1.5
0.4
0.2
-0.1
-8
.3
0.0
0.0
0.1
0.2
0.2
-11.
0
Sub
tota
lc 2,
255.
7
97.6
94
.4
16.6
13
.4
-3.2
-3
.3
0.2
0.5
7.3
8.7
7.9
-8.1
Plan
are
a to
talc
13,8
09.5
1,
386.
6
1,18
6.4
561.
8 36
1.6
-200
.2
-14.
4 0.
9 18
.7
394.
3 14
7.9
413.
9 -2
9.8
a Hig
her s
uita
bilit
y ha
bita
t inc
lude
s sui
tabi
lity
clas
s 3 p
lus s
uita
bilit
y cl
ass 4
.b T
he fi
rst m
etho
d is
bas
ed o
n co
mpa
rison
of M
axen
t “bo
oken
d” m
odel
resu
lts fo
r bas
elin
e an
d en
ding
yea
rs a
nd th
e se
cond
app
lies L
andT
rend
r (LT
) dat
a on
dis
turb
ance
s to
gros
s ha
bita
t los
ses i
dent
ified
by
the
first
met
hod,
to e
stim
ate
loss
es a
nd a
ssig
n pr
obab
le c
ause
for l
oss b
y us
ing
LT d
ata.
Gro
ss h
abita
t los
s is t
he a
rea
that
cha
nged
from
hig
her t
o lo
wer
su
itabi
lity
clas
ses w
here
as g
ross
gai
ns re
pres
ent t
he o
ppos
ite. N
et h
abita
t cha
nge
is g
ross
gai
ns m
inus
gro
ss lo
sses
, in
acre
s and
as a
per
cent
age
of b
asel
ine
habi
tat a
rea.
In “
No
LT
dist
urba
nce”
are
as, t
he b
ooke
nd m
odel
s ind
icat
ed lo
ss, b
ut L
andT
rend
r did
not
det
ect a
dis
turb
ance
.c N
umbe
rs ro
unde
d to
nea
rest
100
; tot
als w
ere
com
pute
d pr
ior t
o ro
undi
ng.
40
GENERAL TECHNICAL REPORT PNW-GTR-848
Habitat pattern, as indicated by the proportion of higher suitability habitat in edge, became slightly more fragmented in 2006/07 compared with baseline conditions in Oregon and California, but became slightly less fragmented in Washington (fig. 18).
DiscussionSources of UncertaintyThis work represents a second attempt to create a rangewide map of potential murrelet nesting habitat from consistent baseline vegetation information. We believe the effort has resulted in an improved understanding of the current amount and distribution of nesting habitat compared to the information available at the time of our earlier report (Raphael et al. 2006). As in our previous effort, there are a number of sources of uncertainty that should be recognized.
Vegetation mapping— First, there is uncertainty and error in the underlying GNN vegetation classification. We have previously discussed ac-curacy assessment information for the vegetation data (see
“Methods” section). Error rates in the original vegetation attributes such as tree diameter and canopy cover varied among modeling regions, but we used the average correla-tion of plot covariates and GNN covariates across regions to judge accuracy. Some of our covariates were derived from combinations of GNN covariates (such as PLATFORMS), and we do not have a measure of accuracy of these derived covariates. In general, we can assume that finer scale co-variates (such as the count of stems in diameter classes) will be less accurate than more broadly defined covariates. For example, the accuracy (correlation coefficient) for density of Douglas-fir stems 50 to 75 cm (19.7 to 29.5 in) DBH ranged from 0.38 to 0.52 among GNN modeling regions, whereas the accuracy for the density (trees per hectare [TPH]) of all conifer stems greater than or equal to 50 cm (19.7 in) DBH ranged from 0.54 to 0.72. Another derived covariate is PCTMATURE_50 and although we have an accuracy as-sessment for sites classified as large conifer, we do not know the accuracy of our estimate of the percentage of a 123.6-ac (50-ha) circle that is classified as large conifer.
Figure 18—Change in amount of higher suitability nesting habitat that occurs within edges along (within 60 m of) lower suitability habitat from the baseline (1994 in California and 1996 in Washington and Oregon) to the end of the model period (2007 in California and 2006 in Washington and Oregon). Higher suitability habitat includes class 3 (moderately high suitability) plus class 4 (highest suitability). Lower suitability habitat includes class 1 (lowest suitability) plus class 2 (marginal suitability).
41
Northwest Forest Plan—the First 15 Years (1994–2008): Status and Trend of Nesting Habitat for the Marbled Murrelet
Resolution is also a source of uncertainty. In general, finer resolution data, such as the 30-m (98-ft) resolution GNN data, will show more variation and detail than coarser resolution data. Engler et al. (2004) found that models using higher resolution habitat predictors performed better than models using coarser resolution data (82-ft versus 1,640-ft resolution raster data). The lower model performances they observed at the 1,640-ft resolution (roughly 62-ac pixel size) were probably caused by a loss of information that is inevitable when aggregating environmental maps. This aggregation may, in some cases, hide important combina-tions of habitat predictors, which would be expressed with finer resolution data. Our method of applying a smoothing function to covariates during data preparation helped reduce the effect of errors at the single-pixel scale resulting from imagery noise, while retaining much of the fine-scale richness of the GNN data.
Errors in GNN attribute data also resulted in some model covariate values that did not match the actual vegeta-tion on the ground. For example, we checked GNN attribute data against aerial imagery for murrelet nest and occupied sites used to train the model, and, in some cases, observed mismatches, where aerial photos showed old forest with large trees, but the GNN attributes for the site indicated forest with primarily small trees. This kind of error in the vegetation characteristic data could introduce error into the Maxent models, by training the models on a broader range of ecological conditions at murrelet location sites than actually occurs.
Murrelet locations— We recognize three primary sources of uncertainty in our marbled murrelet database. First, for the occupied detection sample, we assumed there were no false positives, i.e., we assumed murrelets were correctly identified and that their behavior was correctly observed so that sites with occupied detections were not recorded in error. Occupied detections were those that were believed to be associated with nesting (Evans Mack et al. 2003), but it is not clear whether murre-lets were actually nesting at all such detection sites. To the extent that occupied behaviors were observed at unsuitable sites, our models could include undue weight to attributes associated with sites that were not actually used. Second,
our sample of nest sites includes locations where downy young or egg fragments were observed on the ground, and it is possible these signs of nesting were not correctly attrib-uted to the actual nest tree. Thus, these sites may have less spatial accuracy than our sample of confirmed nest trees and this could introduce some bias, although we believe it is small. Third, there is variation in forest attributes among the pixels that we delineated at murrelet locations. Some pixels within areas treated as species sites may not have been the exact locations used by the birds and may not have contrib-uted to site selection by the birds. To the extent that some pixels within the 3- x 3-pixel neighborhood that contributed to the averaged covariate values for presence locations may have included unsuitable habitat, our data for vegetation conditions at presence locations may have greater variance than a more homogeneous site of truly suitable habitat.
The allocation of murrelet location survey effort was not random with respect to the vegetation and physiographic covariates. Murrelet surveys were not conducted according to any planned survey design but rather, some of the surveys in our database were done in advance of timber sales in for-est that was judged likely to be murrelet habitat. As a result, there are likely biases in the distribution of survey effort and hence in the distribution of occupied sites in our data set (Daw et al. 1998, Edwards et al. 2006. Scott et al. 2002).
Because we performed 10 model runs for each model region, we are able to portray some measure of uncertainly in our prediction of habitat suitability (see fig. 17). Doing so represents a major advance in the representation of habitat suitability. The magnitude of variation among model runs, represented by the 95 percent confidence interval around estimates, provides a useful way to judge model perfor-mance and helps interpret estimates of habitat suitability.
Model uncertainty— Projecting model results from one set of environmental data to another set can create uncertainties. We found that the range of values in each of our covariates from the current period fell within the ranges of those covariates in the base-line period, which helps justify our method of projection. However, projecting data in this way assumes that murrelets were selecting habitat conditions in the same way for each
42
GENERAL TECHNICAL REPORT PNW-GTR-848
time period. If murrelets change habitat preferences in rela-tion to changing environments, then our projections could be inaccurate. We have no evidence that habitat selection has changed.
The two approaches to estimating habitat change yielded different estimates of habitat change, although both methods estimated losses that were within the confidence limits of each method’s estimate. The LandTrendr-verified approach estimated higher rates of habitat loss. A primary reason for this is because this method did not include habitat gains. For information on simple habitat loss without consideration of net change owing to combined effects of gains and losses, the LandTrendr-verified estimates have the advantages of providing information on cause of loss, and of counting as losses only areas where two data sources, the bookend models (which identified losses from the higher suitability habitat classes) and LandTrendr (which detected substantial vegetation canopy loss) coincide. However, for expressing net change, the bookend approach alone includes Maxent model results for gains and losses.
The key difference between the two methods is treat-ment of habitat gains. As noted, only the “bookend” method provides data on habitat gains. Some of these gains may be due to the different sources of error and uncertainty we have discussed, just as some of the bookend losses may be due to error. Remote sensing approaches have demonstrated their ability to detect both losses and gains in forest cover (Coops et al. 2010, Hais et al. 2009, Kennedy et al. 2007, Staus et al. 2002), but the ecological characteristics of good murrelet nesting habitat are more complex than simple forest cover. For a similar analysis for northern spotted owls (Davis and Dugger, in press), the authors questioned whether gains identified by bookend models were as reliable as losses, owing to differences in the ability of their models to detect abrupt habitat losses compared to their ability to detect gains from gradual habitat development over the short period of analysis. Although additional error may occur for projecting a model to a new data set, versus the error associated with the original model, we used the exact same habitat models and model input sources for both 1994/96 and 2006/07, and losses and gains were determined by consistent criteria. However, it is possible that for short
analysis periods, there could be more error associated with detecting gains across any suitability threshold value, versus detecting losses across that same threshold, because losses have a stronger signal (greater average loss in suit-ability) than gains. We have assumed that model errors are not biased toward losses or gains, but this may be an area for future research.
Notwithstanding these potential errors, our models all had excellent classification skill (AUC values) as well as being very well calibrated, as evidenced by the P/E (AAF) plots. Even with these errors, the models were very good. The sources of uncertainty we mention should predispose the models to perform worse—not better. Thus, even with the odds against finding good models, we found good ones.
Interpretation of Model OutputWe have presented maps depicting relative suitability of nesting habitat for the murrelet in four levels ranging from low to high at a resolution of 98 ft (30 m). Predicted suitability at a single pixel can be far less reliable than predicted suitability at a larger scale, where small-scale errors are smoothed out by using average suitability over the larger area. Such smoothing can also reduce the ac-curacy of some single pixels, but predictions at this scale more reliably match the larger scale patterns on the ground. Further, the GNN metadata specifically advises users that the most appropriate use of that data is across landscapes, counties, watersheds, or ecoregions (areas larger than stands or patches). For these reasons, we caution users that estimates of the amount of suitable habitat should be based on larger areas, such as a watershed, and not individual sites or stands. In addition, using our maps to locate specific areas of suitable murrelet habitat on a specific ownership is inappropriate when the landscape in question is small (e.g., < 10,000 ac).
Comparison With Previous EstimatesResults presented in this report differ from those reported earlier by Raphael et al. (2006). This should be expected, as many aspects of this analysis differ from the earlier work. First, we are now using a very different set of vegetation data (GNN in this report versus Interagency Vegetation
43
Northwest Forest Plan—the First 15 Years (1994–2008): Status and Trend of Nesting Habitat for the Marbled Murrelet
Mapping Project [IVMP] for Washington and Oregon and CALVEG [California Vegetation mapping] for California in the previous report). The GNN data are an improvement because of more consistent mapping across the three-state range, more available attributes, and improved reliability of mapped attributes. Second, we are using a different type of model (maximum entropy in this report versus ecological niche factor analysis in the previous report). Maxent, as described in the “Methods” section, performs better than Biomapper as a modeling tool. Third, our model regions differ: we excluded Plan murrelet Zone 2 from our previ-ous ecological niche factor model and now include Plan murrelet Zone 2 in Washington in this analysis. Fourth, we are using a different set of environmental covariates in this model compared to our previous model. Fifth, we used a different method of setting a threshold between lower suitability and higher suitability habitat (Biomapper scores > 60 in the previous report versus Maxent scores where the area-adjusted frequency ratio of predicted to expected sites exceeded 1.0 in this model). Lastly, we had a larger set of murrelet locations available with which to train models. Nonetheless, despite these many differences in methods, our baseline estimate (1994/96) of higher suitability habitat over all lands (3.8 million acres) is not drastically different than our previous estimate of 4.0 million acres from the Biomapper model. Comparison within individual provinces and by land allocation will differ to a greater extent; it is only when lands are pooled across a large area that we see similar estimates.
Implications of ResultsAmong its many objectives, the Plan was designed to provide habitat conditions that support a viable and well-distributed population of marbled murrelets. The Plan is a long-term strategy that is expected to reach its full potential after many decades when previously cutover forest stands within federal reserves mature and begin functioning as suitable habitat. In the short term, the objective is to conserve remaining habitat, and to that end the Plan seems successful. Almost 90 percent of the higher suitability habi- tat currently on federal lands is protected under the various reserve allocations. Based on LandTrendr-verified data, the
rate of loss of higher suitability habitat on reserved lands has been about 3.0 percent over the 10-year period we ana- lyzed, (owing mostly to fire, especially in Oregon [table 8]) and slightly higher (4.8 percent) on nonreserved federal lands. However, the rate of loss of higher suitability habitat has been about 10 times greater (29.8 percent) on nonfederal lands, owing mostly to timber harvest.
Given that one-third of the higher suitability habitat is on nonfederal lands, if the amount of suitable habitat for murrelets is to be maintained at its current level, it will require contributions from nonfederal lands. Over time, as federal reserves increase in quality, less reliance on non-federal lands may be warranted. Thus, there are currently limits on the extent to which the Plan can protect remaining suitable habitat and prevent its ongoing loss.
We used two methods to estimate change in habitat from the baseline to current conditions, and under each method we observed a loss. The bookend approach includes both gains and losses in higher suitability habitat. We cannot be certain that all gains are real, as some changes may be due to mapping and other errors and to “noise” in the Landsat-based imagery that would cause erroneous estimates. Although there is some uncertainty about gains and net change, we believe the LandTrendr-verified losses represent the best estimates of the amount of higher suitabil-ity habitat where disturbances impacted habitat suitability sufficiently to be considered a loss.
However, both the bookend and LandTrendr-verified estimates show a loss of habitat. The overall rate of this loss i.e, that is the rate we estimated across all land ownerships, was 12.9 percent using the LandTrendr-verified approach or 7.1 percent using the bookend approach. When error estimates for habitat amounts during the two periods are considered, the magnitudes of loss estimated using either approach fall within the range of uncertainty and for that reason we cannot say that total amount of habitat has changed significantly over this period. If estimates of loss are valid despite the uncertainties we describe, conserva-tion of the threatened murrelet is not possible if such losses continue at this rate into the future.
Our data indicate that about 38 percent of all habitat-capable land in federal reserves was in higher suitability
44
GENERAL TECHNICAL REPORT PNW-GTR-848
condition (classes 3 and 4) in 1994/96. We estimated a loss of about 64,000 acres of higher suitability habitat from federal reserves over the 10 years from 1994/96 to 2006/07 (table 5). If that rate continued for 50 years, the total loss would be 320,000 ac. There were also nearly 2 million acres of federally reserved land in class 2 condi-tion (35 percent of all habitat-capable reserve lands), much of which, given time, has potential to develop into more highly suitable nesting habitat (fig. 19). Although some of this may not develop suitable nesting habitat owing to poor site conditions or other factors, our initial screening for “habitat-capable lands” excluded many such areas, and most areas are in class 2 condition because they are young forest. If 20 percent of the nearly 2 million class 2 acres developed into higher suitability condition over the next 50 years, that would be enough to balance a loss of 320,000 acres. Therefore, over the long run, it is not unreasonable to expect to see a net increase in total amount of higher suitability habitat, particularly if losses are reduced.
The development of stands with old-growth character-istics necessary for murrelets is expected to take at least 100 to 200 years (USFWS 1997). For the many younger stands in the murrelet range that were clearcut harvested in the past century, the benefits of habitat development are well into the future, but if management for late-successional and old-growth forests continues, projections show substantial increases on western federal lands of forest exceeding 150 years age by 2050 (Mills and Zhou 2003). Given declining murrelet population trends, as well as habitat losses, in many areas, it is uncertain whether their populations will persist to benefit from potential future increases in habitat suitability. This underscores the need to arrest the loss of suitable habitat, especially in the relatively near term (three to five decades). Shorter term gains in habitat quality may occur as older forest fills in around existing suitable habitat and reduces edge and fragmentation effects in existing habitat, prior to the older forest developing the large limbs, nest platforms, and other characteristics of murrelet nesting habitat.
Relation to Murrelet Population EstimatesRaphael et al. (2006) showed a very strong association between total murrelet populations and total suitable habitat at the scale of the five marbled murrelet conservation zones and the strata within them, over the Plan area. We repeated this analysis by using our current estimates of higher suitability habitat (this report), and murrelet population estimates from Miller et al. (n.d.). We used a partial correla-tion to account for land area within each stratum. Partial correlation of amounts of higher suitability habitat (classes 3 and 4) within each stratum with murrelet population size in waters adjacent to each stratum was positive and statisti-cally significant (partial r = 0.775, P = 0.024, fig. 20). The partial correlation was even stronger (partial r = 0.885, P = 0.003) considering only class 4 habitat. Furthermore, Miller et al. (n.d.) reported that murrelet populations have declined from 2001 to 2009. This decline is most severe in the northern part of the three-state range, particularly in Zone 1 (Puget Sound and Strait of Juan de Fuca in Washington). Rates of loss of habitat, as estimated from the bookend maps, were also greatest in Washington, which further sug-gests a relationship between murrelet numbers and amounts of habitat. If these correlations indicate a true cause-effect relationship between amount and trend of suitable habitat and size and trend of adjacent murrelet populations, then the implication is that amount of nesting habitat, especially the highest suitability habitat, sets the carrying capacity for murrelets as has been suggested elsewhere (Burger and Waterhouse 2009, Raphael 2006). If that is the case, then conservation and restoration of nesting habitat under the Northwest Forest Plan is an essential piece to murrelet recovery. Maintaining and creating high-quality habitat on nonfederal lands may also be critical for murrelet survival and recovery south of Canada.
45
Northwest Forest Plan—the First 15 Years (1994–2008): Status and Trend of Nesting Habitat for the Marbled Murrelet
Figure 19—Amounts of habitat by suitability class that occur within federal reserved and nonfederal lands. Class 1 = lowest suitability, class 2 = marginal suitability, class 3 = moderately high suitability, and class 4 = highest suitability.
Figure 20—Relationship between mean marbled murrelet population size (2001 to 2006) from Miller et al. (n.d.) and amount of higher suitabil-ity nesting habitat (suitability classes 3 and 4) in 2006/07, adjusted for land area, by stratum within recovery conservation zones. Values depicted are the residuals from regressions of land area and murrelet population or habitat. Strata are identified by zone (first digit) and stratum (decimal digit).
46
GENERAL TECHNICAL REPORT PNW-GTR-848
AcknowledgmentsThis work would not have been possible without the as-sistance of a large number of people who contributed to the murrelet database and who developed the GNN vegetation data sets. Tom Bloxton helped update some of the mur-relet observation databases. Steven Phillips and Ray Davis helped guide us through the use of Maxent software, and Ray provided a sounding board throughout our analyses. Melinda Moeur, Heather Roberts, and Janet Ohmann provided GNN data; Warren Cohen, Robert Kennedy, and Zhiqiang Yang provided the LandTrendr data. Murrelet nest locations in Washington were provided by Tom Bloxton and the Washington Department of Fish and Wildlife (Jane Jenkerson). Nest locations in Oregon were provided by Kim Nelson, the Bureau of Land Management, the U.S. Forest Service Pacific Northwest Region (Region 6), and the Oregon Department of Forestry. Nest locations in California were provided by Richard Golightly, the California Depart-ment of Fish and Game (Esther Burkett), the U.S. Fish and Wildlife Service, and the Pacific Lumber Company (David Bigger and Sal Chinnici). This paper benefited from comments by Jeff Dunk, Alan Burger, and Ashley Steele. Our work was funded by the Pacific Northwest Research Station, the U.S. Fish and Wildlife Service, and the USDA Forest Service, Region 6. The findings and conclusions in this article are those of the authors and do not necessarily represent the views of the U.S. Fish and Wildlife Service.
Metric EquivalentsWhen you know: Multiply by: To get:
Webb, L. 2002. Southwest Oregon Inland Survey Assessment for marbled murrelets. Final report submitted to U.S. Fish and Wildlife Service. 39 p. Unpublished report. On file with: U.S. Fish and Wildlife Service, Oregon Fish and Wildlife Office, 2600 S.E. 98th Ave., Suite 100, Portland, OR 97266.
Baldwin, R.A. 2009. Use of maximum entropy modeling in wildlife research. Entropy. 11: 854–866.
Bloxton, T.D., Jr.; Raphael, M.G. 2009. Breeding ecology of the marbled murrelet in Washington State. 35 p. Unpublished report. On file with: USDA Forest Service, Pacific Northwest Research Station, Forestry Sciences Laboratory, 3625 93rd Ave. SW, Olympia, WA 98512.
Burger, A.E. 2002. Conservation assessment of marbled murrelets in British Columbia, a review of the biology, habitat associations and conservation. Canadian Wildlife Service Technical Report Series 387.
Burger, A.E.; Ronconi, R.A.; Silvergieter, M.P.; Conroy, C.; Bahn, V.; Manley, I.A.; Cober, A.; Lank, D.B. 2010. Factors affecting the availability of thick epiphyte mats and other potential nest platforms for marbled murrelets in British Columbia. Canadian Journal of Forest Research. 40(4): 727–746.
Burger, A.E.; Waterhouse, F.L. 2009. Relationships between habitat area, habitat quality, and populations of nesting marbled murrelets. BC Journal of Ecosystems and Management. 10(1): 101–112.
Cohen, W.B.; Spies, T.A.; Fiorella, M. 1995. Estimating the age and structure of forests in a multi-ownership landscape of western Oregon, U.S.A. International Journal of Remote Sensing. 16(4): 721–746.
47
Northwest Forest Plan—the First 15 Years (1994–2008): Status and Trend of Nesting Habitat for the Marbled Murrelet
Cohen, W.B.; Zhiqiang, Y.; Kennedy, R.E. 2010. Detecting trends in forest disturbance and recovery using yearly Landsat time series: 2. TimeSync—tools for calibration and validation. Remote Sensing of Environment. 114: 2911–2924.
Comer, P.; Faber-langendoen, D.; Evans, R.; Gawler, S.; Josse, C.; Kittel, G.; Menard, S.; Pyne, M.; Reid, M.; Schulz, K.; Snow, K.; Teague, J. 2003. Ecological systems of the United States: a working classification of U.S. terrestrial systems. Arlington, VA: NatureServe. 75 p.
Coops, N.C.; Gillanders, S.N.; Wulder, M.A.; Gergel, S.E.; Nelson, T.; Goodwin, N.R. 2010. Assessing changes in forest fragmentation following infestation using time series Landsat imagery. Forest Ecology and Management. 259: 2355–2365.
Crist, E.P.; Cicone, R.C. 1984. A physically-based transformation of thematic mapper data: the TM tasseled cap. IEEE Transactions on Geoscience and Remote Sensing. GE-22: 256–263.
Daly, C.; Halbleib, M.; Smith, J.I.; Gibson, W.P.; Doggett, M.K.; Taylor, G.H.; Curtis, J.; Pasteris, P.P. 2008. Physiographically sensitive mapping of climatological temperature and precipitation across the conterminous United States. International Journal of Climatology. 2008, DOI: 10.1002/joc.1688. (25 January 2011).
Davis, R.; Lint, J. 2005. Habitat status and trend. In: Lint, J., tech. coord. Northwest Forest Plan—the first 10 years (1994–2003): status and trends of northern spotted owl populations and habitat. Gen. Tech. Rep. PNW-GTR-648. Portland, OR: U.S. Department of Agriculture, Forest Service, Pacific Northwest Research Station. 176 p.
Davis, R.J.; Dugger, K.M. [In press]. Habitat status and trend. In: Davis, R.J.; Dugger, K.M.; Mohoric, S.; Evers, L.; Aney, W.C. tech. coords. Northwest Forest Plan–the first 15 years (1994–2008): status and trends of northern spotted owl populations and habitats. Gen. Tech. Rep. Portland, OR: U.S. Department of Agriculture, Forest Service, Pacific Northwest Research Station.
Daw, S.K.; DeStefano, S.; Steidl, R.J. 1998. Does survey method bias the description of northern goshawk nest-site structure? Journal of Wildlife Management. 62: 1379–1384.
Edwards, T.C.; Cutler, D.R.; Zimmermann, N.E.; Geiser, L.; Moisen, G.G. 2006. Effects of sample survey design on the accuracy of classification tree models in species distribution models. Ecological Modelling. 199: 132–141.
Engler, R.; Guisan, A.; Rechsteiner, L. 2004. An improved approach for predicting the distribution of rare and endangered species from occurrence and pseudo-absence data. Journal of Applied Ecology. 41: 263–274.
Environmental Research Systems Institute, Inc. [ESRI] c1982–2008. ArcInfo Workstation. Version 9.3. Redlands, CA.
Environmental Research Systems Institute, Inc. [ESRI] c1999–2009. ArcGIS Desktop 9.3.1. Redlands, CA.
48
GENERAL TECHNICAL REPORT PNW-GTR-848
Evans Mack, D.; Ritchie, W.P.; Nelson, S.K.; Kuo-Harrison, E.; Harrison, P.; Hamer, T.E. 2003. Methods for surveying marbled murrelets in forests: a revised protocol for land management and research. Pacific Seabird Group Technical Publication Number 2. http://www.pacificseabirdgroup.org. [Date accessed unknown].
Fielding, A.H.; Bell, J.F. 1997. A review of methods for the assessment of prediction errors in conservation presence/absence models. Environmental Conservation. 24: 38–49.
Forest Ecosystem Management Assessment Team [FEMAT]. 1993. Forest ecosystem management: an ecological, economic, and social assessment. Portland, OR: U.S. Department of Agriculture; U.S. Department of the Interior; National Oceanic and Atmospheric Administration; U.S. Environmental Protection Agency. [Irregular pagination].
Hais, M.; Jonášovác, M.; Langhammerd, J.; Kučerac, T. 2009. Comparison of two types of forest disturbance using multitemporal Landsat TM/ETM+ imagery and field vegetation data. Remote Sensing of Environment. 113: 835–845.
Hamer, T.E.; Nelson, S.K. 1995. Characteristics of marbled murrelet nest trees and nesting stands. In: Ralph, C.J.; Hunt, G.L., Jr.; Raphael, M.G.; Piatt, J.F., eds. Ecology and conservation of the marbled murrelet. Gen. Tech. Rep. PSW-GTR-152. Albany, CA: U.S. Department of Agriculture, Forest Service, Pacific Southwest Research Station: 69–82.
Henderson, J.A.; Lesher, R.D.; Peter, D.H.; Ringo, C.D. [In press]. A landscape model for predicting potential natural vegetation of the Olympic Peninsula, USA, using boundary equations and newly developed environmental variables. Res. Pap. Portland, OR: U.S. Department of Agriculture, Forest Service, Pacific Northwest Research Station.
Hernandez, P.A.; Graham, C.H.; Master, L.L.; Albert, D.L. 2006. The effect of sample size and species characteristics on performance of different species distribution modeling methods. Ecography. 29: 773–785.
Hirzel, A.H.; Hausser, J.; Chessel, D.; Perrin, N. 2002. Ecological-niche factor analysis: how to compute habitat-suitability maps without absence data. Ecology. 83: 2007–2036.
Hirzel, A.H.; Le Lay, G.; Helfer, V.; Randin, C.; Guisan, A. 2006. Evaluating the ability of habitat suitability models to predict species presences. Ecological Modelling. 199: 142–152.
Huff, M.H.; Raphael, M.G.; Miller, S.L.; Nelson, S.K.; Baldwin, J., tech. coords. 2006a. Northwest Forest Plan—the first 10 years (1994–2003): status and trends of populations and nesting habitat for the marbled murrelet. Gen. Tech. Rep. PNW-GTR-650. Portland, OR: U.S. Department of Agriculture, Forest Service, Pacific Northwest Research Station. 149 p.
Huff, M.H.; Raphael, M.G.; Miller, S.L.; Nelson, S.K.; Baldwin, J.; Young, R.D.; Brown, M.; Evans-Mack, D. 2006b. Estimating the amount of marbled murrelet nesting habitat on federal lands by using a systematic grid sampling strategy. In: Huff, M.H.; Raphael, M.G.; Miller, S.L.; Nelson, S.K.; Baldwin, J., tech. coords. Northwest Forest Plan—the first 10 years (1994–2003): status and trends of populations and nesting habitat for the marbled murrelet. Gen. Tech. Rep. PNW-GTR-650. Portland, OR: U.S. Department of Agriculture, Forest Service, Pacific Northwest Research Station: 61–95. Chapter 4.
Hunter, J.E.; Schmidt, K.N.; Stauffer, H.B.; Miller, S.L.; Ralph, C.J.; Roberts, L. 1998. Status of the marbled murrelet in the inner North Coast ranges of California. Northwestern Naturalist. 79: 92–103.
Jenness, J. 2003. Mahalanobis distances (mahalanobis.avx) extension for ArcView 3.x, Jenness Enterprises. http://www.jennessent.com/arcview/mahalanobis.htm. (18 December 2010).
49
Northwest Forest Plan—the First 15 Years (1994–2008): Status and Trend of Nesting Habitat for the Marbled Murrelet
Kennedy, R.E. 2010. Personal communication. Postdoctoral research ecologist, U.S. Department of Agriculture, Forest Service, Pacific Northwest Research Station, 3200 SW Jefferson Way, Corvallis, OR 97331.
Kennedy, R.E.; Cohen, W.B.; Schroeder, T.A. 2007. Trajectory-based change detection for automated characterization of forest disturbance dynamics. Remote Sensing of Environment. 110: 370–386.
Kennedy, R.E.; Yang, Z.; Cohen, W.B. 2010. Detecting trends in forest disturbance and recovery using yearly Landsat time series: 1. LandTrendr−temporal segmentation algorithms. Remote Sensing of Environment. 114: 2897–2910.
Madsen, S.; Evans, D.; Hamer, T.; Henson, P.; Miller, S.; Nelson, S.K.; Roby, D.; Stapanian, M. 1999. Marbled murrelet effectiveness monitoring plan for the Northwest Forest Plan. Gen. Tech. Rep. PNW-GTR-439. Portland, OR: U.S. Department of Agriculture, Forest Service, Pacific Northwest Research Station. 51 p.
Malt, J.; Lank, D. 2007. Temporal dynamics of edge effects on nest predation risk for the marbled murrelet. Biological Conservation. 140(1-2): 160–173.
Manley, I.A.; Nelson, S.K. 1999. Habitat characteristics associated with nest success and predation at marbled murrelet nest trees. Pacific Seabirds. 26: 40.
Manly, B.F.J.; McDonald, L.L.; Thomas, D.L.; McDonald, T.L.; Erickson, W.P. 2002. Resource selec-tion by animals: statistical design and analysis for field studies. London: Kluwer Academic Publishers. 223 p.
McComb, W.C.; McGrath, M.T.; Spies, T.A.; Vesely, D. 2002. Models for mapping potential habitat at landscape scales: an example using northern spotted owls. Forest Science. 48: 203–216.
McShane, C.; Hamer, T.; Carter, H.; Swartzman, G.; Friesen, V.; Ainley, D.; Tressler, R.; Nelson, K.; Burger, A.; Spear, L.; Mohagen, T.; Martin, R.; Henkel, L.; Prindle, K.; Strong, S.; Keany, J. 2004. Evaluation report for the 5-year status review of the marbled murrelet in Washington, Oregon, and California. [EDAW, Inc., Seattle, WA]. Unpublished report. One file with: USDI Fish and Wildlife Service, Pacific Region, 911 NE 11th Ave., Portland, OR 97232.
Meyer, C.B.; Miller, S.L. 2002. Use of fragmented landscapes by marbled murrelets for nesting in southern Oregon. Conservation Biology. 16: 755–766.
Meyer, C.B.; Miller, S.L.; Ralph, C.J. 2002. Multi-scale landscape and seascape patterns associated with marbled murrelet areas on the U.S. west coast. Landscape Ecology. 17: 95–115.
Miller, S.L.; Raphael, M.G.; Falxa, G.A.; Strong, C.; Baldwin, J.; Bloxton, T.; Galleher, B.M.; Lance, M.; Lynch, D.; Pearson, S.; Young, R.D. [N.d]. Status and trend of the marbled murrelet population under the Northwest Forest Plan. Manuscript in preparation. On file with: U.S. Department of Agriculture, Forest Service, Pacific Northwest Region, 333 SW First Ave, Portland, OR 97204.
Miller, S.L.; Ralph, C.J.; Raphael, M.G.; Strong, C.; Thompson, C.W.; Baldwin, J.; Huff, M.H.; Falxa, G.A. 2006. At-sea monitoring of marbled murrelet population status and trend in the Northwest Forest Plan area. In: Huff, M.H.; Raphael, M.G.; Miller, S.L.; Nelson, S.K.; Baldwin, J., tech. coords. Northwest Forest Plan—the first 10 years (1994–2003): status and trends of populations and nesting habitat for the marbled murrelet. Gen. Tech. Rep. PNW-GTR-650. Portland, OR: U.S. Department of Agriculture, Forest Service, Pacific Northwest Research Station: 31–60. Chapter 3.
50
GENERAL TECHNICAL REPORT PNW-GTR-848
Mills, J.R.; Zhou, X. 2003. Projecting national forest inventories for the 2000 RPA timber assessment. Gen. Tech. Rep. PNW-GTR-568. Portland, OR: U.S. Department of Agriculture, Forest Service, Pacific Northwest Research Station. 58 p.
Moeur, M.; Spies, T.A.; Hemstrom, M.; Martin, J.R.; Alegria, J.; Browning, J.; Cissel, J.; Cohen, W.B.; Demeo, T.E.; Healey, S.; Warbington, R. 2005. Northwest Forest Plan—the first 10 years (1994–2003): status and trend of late-successional and old-growth forest. Gen. Tech. Rep. PNW-GTR-646. Portland, OR: U.S. Department of Agriculture, Forest Service, Pacific Northwest Research Station. 142 p.
Moeur, M.; Ohmann, J.L.; Kennedy, R.E.; Cohen, W.B.; Gregory, M.J.; Yang, Z.; Roberts, H.M.; Spies, T.A.; Fiorella, M. [In press]. Northwest Forest Plan–the first 15 years (1994–2008): status and trends of late-successional and old-growth forests. Gen. Tech. Rep. Portland, OR: U.S. Department of Agriculture, Forest Service, Pacific Northwest Research Station.
Morrison, P.H. 1988. Old-growth forests in the Pacific Northwest: a status report. Washington, DC: The Wilderness Society. 53 p.
Mulder, B.S.; Noon, B.R.; Spies, T.A.; Raphael, M.G.; Palmer, C.J.; Olsen, A.R.; Reeves, G.H.; Welsh, H.H., tech. cords. 1999. The strategy and design of the effectiveness monitoring program for the Northwest Forest Plan. Gen. Tech. Rep. PNW-GTR-437. Portland, OR: U.S. Department of Agriculture, Forest Service, Pacific Northwest Research Station. 138 p.
Nelson, S.K. 1997. Marbled murrelet (Brachyramphus marmoratus). In: Poole, A.; Gill, F., eds. Birds of North America. No. 276. Philadelphia, PA: Academy of Natural Sciences; Washington, DC: American Ornithologists Union. 32 p.
Nelson, S.K. 2010. Unpublished data and maps of Oregon marbled murrelet nest and occupied site locations. On file with: S. Kim Nelson, Oregon State University, Department of Fisheries and Wildlife, 104 Nash Hall, Corvallis, OR 97331.
Nelson, S.K.; Huff, M.H.; Miller, S.L.; Raphael, M.G. 2006. Marbled murrelet biology: habitat relations and populations. In: Huff, M.H.; Raphael, M.G.; Miller, S.L.; Nelson, S.K.; Baldwin, J., tech. coords. Northwest Forest Plan—the first 10 years (1994–2003): status and trends of populations and nesting habitat for the marbled murrelet. Gen. Tech. Rep. PNW-GTR-650. Portland, OR: U.S. Department of Agriculture, Forest Service, Pacific Northwest Research Station: 9–30. Chapter 2.
Nelson, S.K.; Wilson, A.K. 2002. Marbled murrelet habitat characteristics on state lands in western Oregon. 154 p. Unpublished report. On file with: S. Kim Nelson, Oregon State University, Department of Fisheries and Wildlife, 104 Nash Hall, Corvallis, OR 97331.
Norheim, R.A. 1996. Is there an answer to mapping old growth? An examination of two projects conducted with remote sensing and GIS. Seattle, WA: University of Washington. 150 p. M.S. thesis.
Norheim, R.A. 1997. Dueling databases: examining the differences between two old-growth mapping projects, presented at 13th international symposium on computer-assisted cartography (Auto-Carto 13). Seattle. http://purl.oclc.org/net/norheim/oldgrowth/dueling-db.html. (17 March 2011).
Ohmann, J.L. 2010. Personal communication. Research forest ecologist, U.S. Department of Agriculture, Forest Service, Pacific Northwest Research Station, Resource Monitoring and Assessment Program, 3200 SW Jefferson Way, Corvallis, OR 97331.
Ohmann, J.L.; Gregory, M.J. 2002. Predictive mapping of forest composition and structure with direct gradient analysis and nearest neighbor imputation in coastal Oregon, USA. Canadian Journal of Forest Research. 32: 725–741.
Ohmann, J.L.; Gregory, M.J.; Roberts, H.M. 2010. GNN ‘bookend’ maps of forest vegetation for NWFP effectiveness monitoring. Unpublished report. On file with: USDA Forest Service, Pacific Northwest Region, 333 SW First Ave., Portland, OR 97204.
51
Northwest Forest Plan—the First 15 Years (1994–2008): Status and Trend of Nesting Habitat for the Marbled Murrelet
Phillips, S.J. [N.d.] A brief tutorial on Maxent. http://www.cs.princeton.edu/~schapire/maxent/. (6 May 2009).
Phillips, S.J.; Anderson, R.P.; Schapire, R.E. 2006. Maximum entropy modeling of species geographic distributions. Ecological Modelling. 190: 231–259.
Phillips, S.J.; Dudik, M. 2008. Modeling of species distributions with Maxent: new extensions and a comprehensive evaluation. Ecography. 31: 161–175.
Ralph, C.J.; Hunt, G.L., Jr.; Raphael, M.G.; Piatt, J.F. 1995. Ecology and conservation of the marbled murrelet in North America: an overview. In: Ralph, C.J.; Hunt, G.L., Jr.; Raphael, M.G.; Piatt, J.F., eds. Ecology and conservation of the marbled murrelet. Gen. Tech. Rep. PSW-GTR-152. Albany, CA: U.S. Department of Agriculture, Forest Service, Pacific Southwest Research Station: 3–22.
Raphael, M.G. [N.d.]. Characteristics of marbled murrelet nesting platforms. On file with: USDA Forest Service, Pacific Northwest Research Station, Forestry Sciences Laboratory, 3625 93rd Ave SW, Olympia, WA 98512.
Raphael, M.G. 2006. Conservation of the marbled murrelet under the Northwest Forest Plan. Conservation Biology. 20: 297–305.
Raphael, M.G.; Mack, D.E.; Marzluff, J.M.; Luginbuhl, J.M. 2002. Effects of forest fragmentation on populations of the marbled murrelet. Studies in Avian Biology. 25: 222–236.
Raphael, M.G.; Galleher, B.M.; Huff, M.H.; Miller, S.L.; Nelson, S.K.; Young, R.D. 2006. Spatially-explicit estimates of potential nesting habitat for the marbled murrelet. In: Huff, M.H.; Raphael, M.G.; Miller, S.L.; Nelson, S.K.; Baldwin, J., tech. coords. Northwest Forest Plan—the first 10 years (1994–2003): status and trends of populations and nesting habitat for the marbled murrelet. Gen. Tech. Rep. PNW-GTR-650. Portland, OR: U.S. Department of Agriculture, Forest Service, Pacific Northwest Research Station: 97–146. Chapter 5.
Raphael, M.G.; Baldwin, J.; Falxa, G.A.; Huff, M.H.; Lance, M.; Miller, S.L.; Pearson, S.F.; Ralph, C.J.; Strong, C.; Thompson, C. 2007. Regional population monitoring of the marbled murrelet: field and analytical methods. Gen. Tech. Rep. PNW-GTR-716. Portland, OR: U.S. Department of Agriculture, Forest Service, Pacific Northwest Research Station. 70 p.
Raphael, M.G.; Young, J.A.; Galleher, B.M. 1995. A landscape-level analysis of marbled murrelet habitat in western Washington. In: Ralph, C.J.; Hunt, G.L., Jr.; Raphael, M.G.; Piatt, J., tech. coords. Ecology and conservation of the marbled murrelet. Gen. Tech. Rep. PSW-GTR-152. Albany, CA: U.S. Department of Agriculture, Forest Service, Pacific Southwest Research Station: 177–189.
Ripple, W.J.; Nelson, S.K.; Glenn, E.M. 2003. Forest landscape patterns around marbled murrelet nest sites in the Oregon Coast Range. Northwestern Naturalist. 84: 80–89.
Sawyer, J.O.; Sillett, S.C.; Libby, W.J.; Dawson, T.E.; Popenoe, J.H.; Largent, D.L.; Van Pelt, R.; Veirs, S.D., Jr.; Noss, R.F.; Thornburgh, D.A.; Del Tredici, P. 2000. Redwood trees, communities, and ecosystems: a closer look. In: Noss, R.F., ed. The redwood forest: history, ecology, and conservation of the coast redwoods. Washington, DC: Island Press: 81–118.
Scott, J.M.; Heglund, P.J.; Morrison, M.L.; Haufler, J.B.; Raphael, M.G.; Wall, W.A.; Samson, F.B., eds. 2002. Predicting species occurrences: issues of accuracy and scale. Washington, DC: Island Press. 840 p.
Soille, P.; Vogt, P. 2009. Morphological segmentation of binary patterns. Pattern Recognition Letters 30 (2009). 456–459.
Staus, N.L.; Strittholt, J.R.; DellaSala, D.A.; Robinson, R. 2002. Rate and pattern of forest disturbance in the Klamath-Siskiyou ecoregion, USA, between 1972 and 1992. Landscape Ecology. 17: 455–470.
52
GENERAL TECHNICAL REPORT PNW-GTR-848
U.S. Department of Agriculture, Forest Service; U.S. Department of the Interior, Bureau of Land Management [USDA and USDI]. 1994a. Final supplemental environmental impact statement on management of habitat for late-successional and old-growth forest related species within the range of the northern spotted owl (Northwest Forest Plan). Portland, OR. 2 vol.
U.S. Department of Agriculture, Forest Service; U.S. Department of the Interior, Bureau of Land Management [USDA and USDI]. 1994b. Record of decision for amendments to Forest Service and Bureau of Land Management planning documents within the range of the northern spotted owl. [Place of publication unknown]. 74 p. [plus attachment A: standards and guidelines].
U.S. Fish and Wildlife Service [USFWS]. 1997. Recovery plan for the threatened marbled murrelet (Brachyramphus marmoratus) in Washington, Oregon, and California. Portland, OR. 203 p.
Vogelmann, J.E.; Howard, S.M.; Yang, L.; Larson, C.R.; Wylie, B.K.; Van Driel, J.N. 2001. Completion of the 1990’s national land cover data set for the conterminous United States. Photogrammetric Engineering and Remote Sensing. 67: 650–662.
Pacific Northwest Research Station
Web site http://www.fs.fed.us/pnwTelephone (503) 808-2592Publication requests (503) 808-2138FAX (503) 808-2130E-mail [email protected] address Publications Distribution Pacific Northwest Research Station P.O. Box 3890 Portland, OR 97208-3890
U.S. Department of Agriculture Pacific Northwest Research Station 333 SW First Avenue P.O. Box 3890 Portland, OR 97208-3890