25
Status of Financial Inclusion in Uganda BANK OF UGANDA First Edition- March 2014
i
Status of Financial Inclusion in Uganda
BANK OF UGANDA
First Edition- March 2014
ii
Table of Contents List of Abbreviations and Acronyms ..................................................................................................... iii
Executive Summary ....................................................................................................................................iv
1.0 Introduction ............................................................................................................................................. 1
2.0 Concept of Financial Inclusion ......................................................................................................... 1
3.0 Financial Inclusion Landscape for Uganda .................................................................................. 4
3.1 Data Sources ...................................................................................................................................... 4
3.2 Demand Side Indicators ................................................................................................................. 5
3.3 Supply Side Indicators .................................................................................................................... 7
3.3.1 Financial Access Indicators .................................................................................................... 7
3.3.2 Comparison of Access Indicators across Countries. ...................................................................... 14
3.3.3 Geographic Indicators .................................................................................................................... 15
3.3.4 Other access points ................................................................................................................ 16
4.0 Usage Indicators ................................................................................................................................. 20
4.1 Deposits & Loans ............................................................................................................................. 20
5.0 Conclusion ............................................................................................................................................. 21

iii
List of Abbreviations and Acronyms AFI Alliance for Financial Inclusion BoU Bank of Uganda CNBV Comisión Nacional Bancaria y de Valores CB Commercial Bank FI Financial Institution FIDWG Financial Inclusion Data Working Group FIP Financial Inclusion Project FSDM Financial Services, Data and Measurement GoU Government of Uganda MDI Micro Deposit Taking Institution MFI Micro Finance Institution MNO Mobile Network Operator SACCO Savings and Credit Cooperative Organization SFI Supervised Financial Institution UBOS Uganda Bureau of Statistics UCSCU Uganda Cooperative Savings and Credit Union

iv
Executive Summary The Government of Uganda has taken deliberate steps to build a more inclusive financial system that is responsive to the needs of the Ugandan people as stipulated in its Vision 2040. To support the Vision 2040, BOU in 2011 adopted a new strategy for pushing forward the financial inclusion agenda based on four pillars: financial literacy, financial consumer protection, financial innovations and financial services data and measurement. As BOU continues with its work, it is necessary to take stock of the current status, benchmark on the progress made and chart a well-defined way forward. Using all available information, this maiden report on the status of financial inclusion in Uganda attempts to provide a broad view of the current state of financial inclusion by utilizing measures from both the demand and supply side of financial services and products. The report can be used to identify gaps, establish priorities, and craft evidence-based financial inclusion policies. The report will in future also be used to measure progress made towards achieving financial inclusion objectives. The report uses the internationally accepted lenses of financial inclusion measurement of: access (presence and proximity of financial service providers), usage (adoption, regularity and permanence of services). While the measure of quality (consumer experience) and welfare (consumer impact) shall be covered in the later editions of the report. Given the data limitations at hand, the report focused mainly on financial system’s access points and usage of financial services and products, particularly those that are provided by financial institutions that are supervised and regulated by BOU.

1
1.0 Introduction Bank of Uganda in 2011 adopted a new strategy for financial inclusion based on four pillars: financial literacy, financial consumer protection, financial innovations and financial services data and measurement. The initiatives under each pillar is geared towards building a more inclusive financial system that is responsive to the needs of the Ugandan people especially those who are either underserved or un served. While some significant progress has been made on the measuring front of financial inclusion on the demand-side in Uganda, some work still needs to be done with regard to collection of supply-side data from financial institutions. Thus, there is a need to take stock, fill the data gaps and improve the collection of financial inclusion supply side data. This maiden report provides a snap shot of the current state of financial inclusion in Uganda. It leverages on the existing datasets submitted to BOU by SFIs referred to throughout this report as banks and supplemented by data collected from other sources. The report also serves as an inventory that can be used to identify gaps, establish priorities, and craft evidence-based financial inclusion policies. The rest of the report is organized as follows. Section two reviews the concepts and definitions of financial inclusion by various agencies and scholars; section three presents the financial inclusion landscape for Uganda; section four discusses usage indicators and section five provides conclusion on the report. 2.0 Concept of Financial Inclusion “Developing a contextually relevant definition of financial inclusion up front can provide helpful direction not only by guiding what variables to measure, but also by identifying the benchmarks against which success or failure is measured”1. As interest in financial inclusion surged among policy makers across the universe over the last decade, its definition also evolved but particularly focused around access to particular financial products and services provided by the formal financial service providers.
1 AFI Policy Paper, Financial inclusion measurement for regulators: Survey design and implementation
2
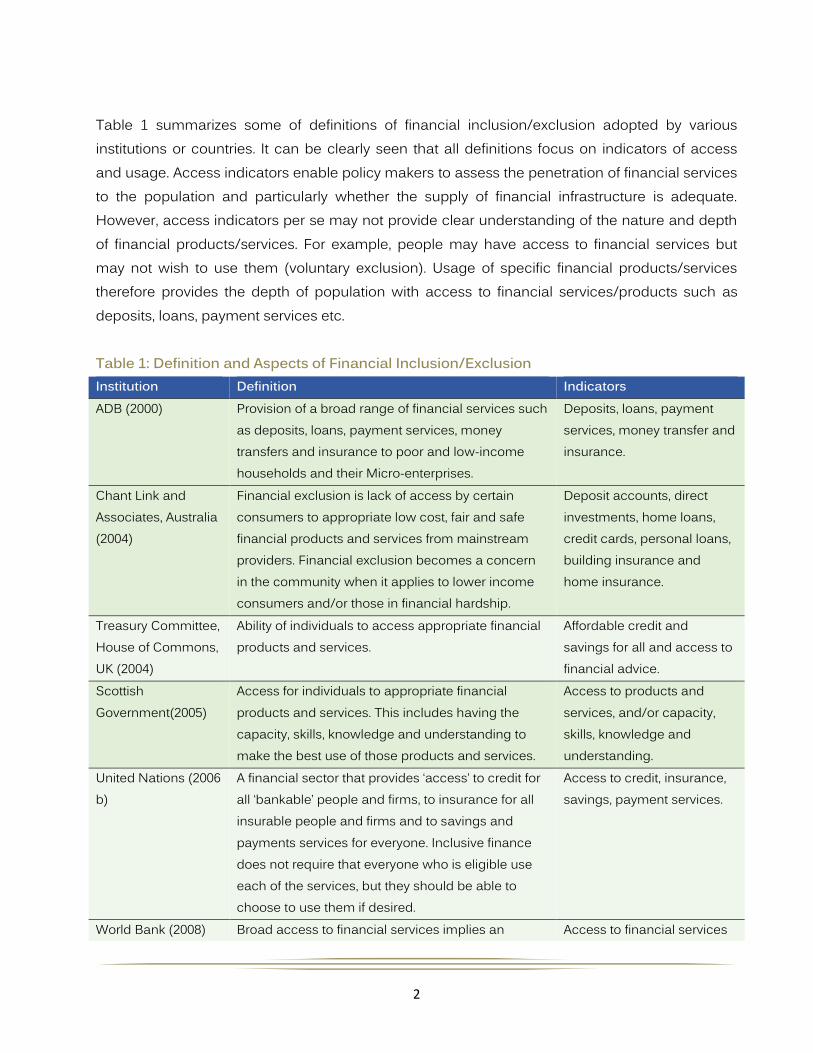
Table 1 summarizes some of definitions of financial inclusion/exclusion adopted by various institutions or countries. It can be clearly seen that all definitions focus on indicators of access and usage. Access indicators enable policy makers to assess the penetration of financial services to the population and particularly whether the supply of financial infrastructure is adequate. However, access indicators per se may not provide clear understanding of the nature and depth of financial products/services. For example, people may have access to financial services but may not wish to use them (voluntary exclusion). Usage of specific financial products/services therefore provides the depth of population with access to financial services/products such as deposits, loans, payment services etc. Table 1: Definition and Aspects of Financial Inclusion/Exclusion Institution Definition Indicators ADB (2000) Provision of a broad range of financial services such
as deposits, loans, payment services, money transfers and insurance to poor and low-income households and their Micro-enterprises.
Deposits, loans, payment services, money transfer and insurance.
Chant Link and Associates, Australia (2004)
Financial exclusion is lack of access by certain consumers to appropriate low cost, fair and safe financial products and services from mainstream providers. Financial exclusion becomes a concern in the community when it applies to lower income consumers and/or those in financial hardship.
Deposit accounts, direct investments, home loans, credit cards, personal loans, building insurance and home insurance.
Treasury Committee, House of Commons, UK (2004)
Ability of individuals to access appropriate financial products and services.
Affordable credit and savings for all and access to financial advice.
Scottish Government(2005)
Access for individuals to appropriate financial products and services. This includes having the capacity, skills, knowledge and understanding to make the best use of those products and services.
Access to products and services, and/or capacity, skills, knowledge and understanding.
United Nations (2006 b)
A financial sector that provides ‘access’ to credit for all ‘bankable’ people and firms, to insurance for all insurable people and firms and to savings and payments services for everyone. Inclusive finance does not require that everyone who is eligible use each of the services, but they should be able to choose to use them if desired.
Access to credit, insurance, savings, payment services.
World Bank (2008) Broad access to financial services implies an Access to financial services

3
Source: Various sources
Uganda and many other African countries conducting FinScope surveys, use the FinMark Trust’s financial access strands/lenses to define financial inclusion. The strands focus on the financial system in its broadest sense and categorize all adults into one of three broad segments namely formally included, informally served or financially excluded. The schematic presentation is shown in Figure 1.
absence of price and non-price barriers in the use of financial services; it is difficult to define and measure because access has many dimensions.
such as deposit, credit, payments, insurance.
Center for Financial Inclusion
A state in which all people who can use them and have access to a full suite of quality financial services, provided at affordable prices, in a convenient manner, and with dignity for the clients.
Usage
FinScope Uganda Financial inclusion means usage of either BOU regulated or other formal or informal institutions.
Access & usage
FinAccess-Kenya Usage of financial services by level of formalization i.e formal, formal other and informal
Access & Usage
CNBV-Mexico Financial inclusion refers to the access and use of a financial product and service portfolio reaching the bulk of the adult population with clear and concise information to satisfy the increasing demand under an adequate regulatory framework.
Access & Usage
Central Bank of Brazil (2010)
Process of effective access and use by the population of financial services that are appropriate to their needs, contributing to their quality of life.
Access & Usage

4
Figure 1: FinScope’s Financial Access Strands
For purposes of measurement of financial Inclusion in Uganda therefore, financial inclusion means usage of either BOU SFIs or other formal or informal institutions. 3.0 Financial Inclusion Landscape for Uganda
3.1 Data Sources
Financial inclusion data are of two main categories namely: supply-side and demand-side data. Supply-side data capture information obtained from financial service providers such as banks and other financial institutions. These typically include data on the number of bank branches, Automated Teller Machines (ATMs), and other financial access (touch) points that are used as proxies for access. Demand-side data, on the other hand, are collected from actual and potential users of financial products and services. They provide insights about the level of usage of financial services, client experience and the needs of non-consumers.
5
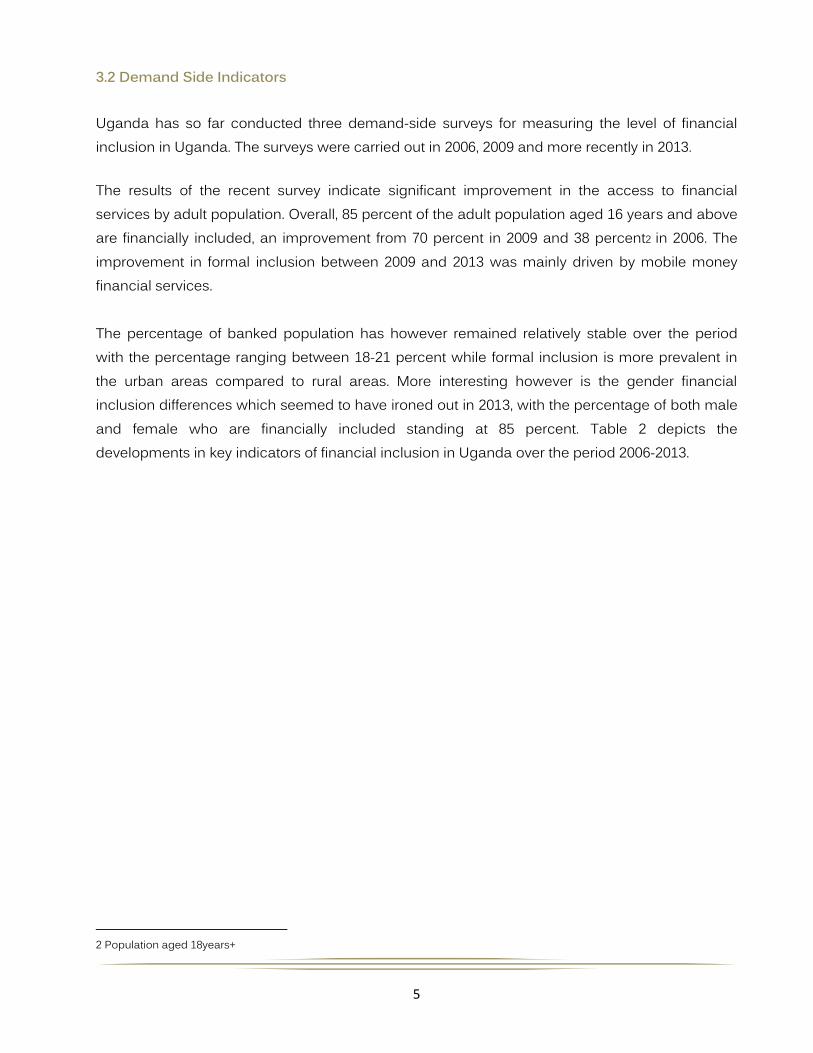
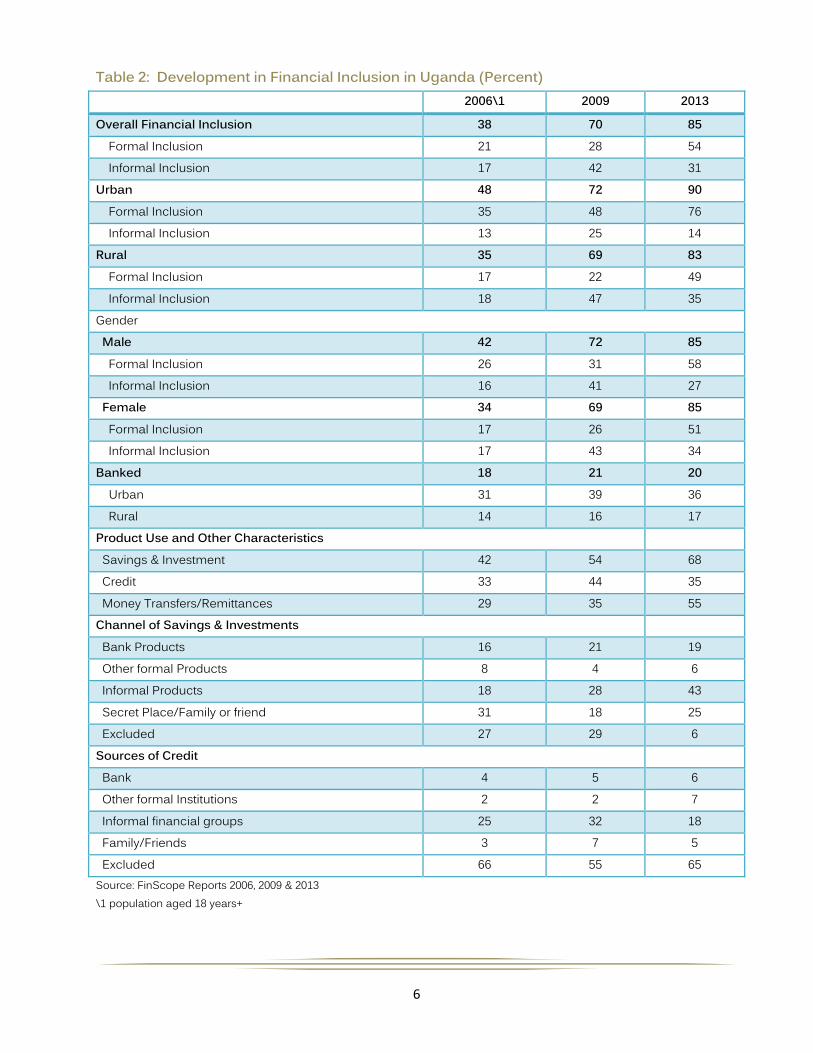
3.2 Demand Side Indicators Uganda has so far conducted three demand-side surveys for measuring the level of financial inclusion in Uganda. The surveys were carried out in 2006, 2009 and more recently in 2013. The results of the recent survey indicate significant improvement in the access to financial services by adult population. Overall, 85 percent of the adult population aged 16 years and above are financially included, an improvement from 70 percent in 2009 and 38 percent2 in 2006. The improvement in formal inclusion between 2009 and 2013 was mainly driven by mobile money financial services. The percentage of banked population has however remained relatively stable over the period with the percentage ranging between 18-21 percent while formal inclusion is more prevalent in the urban areas compared to rural areas. More interesting however is the gender financial inclusion differences which seemed to have ironed out in 2013, with the percentage of both male and female who are financially included standing at 85 percent. Table 2 depicts the developments in key indicators of financial inclusion in Uganda over the period 2006-2013. 2 Population aged 18years+
6
Table 2: Development in Financial Inclusion in Uganda (Percent) 2006\1 2009 2013
Overall Financial Inclusion 38 70 85 Formal Inclusion 21 28 54 Informal Inclusion 17 42 31 Urban 48 72 90 Formal Inclusion 35 48 76 Informal Inclusion 13 25 14 Rural 35 69 83 Formal Inclusion 17 22 49 Informal Inclusion 18 47 35 Gender Male 42 72 85 Formal Inclusion 26 31 58 Informal Inclusion 16 41 27 Female 34 69 85 Formal Inclusion 17 26 51 Informal Inclusion 17 43 34 Banked 18 21 20 Urban 31 39 36 Rural 14 16 17 Product Use and Other Characteristics Savings & Investment 42 54 68 Credit 33 44 35 Money Transfers/Remittances 29 35 55 Channel of Savings & Investments Bank Products 16 21 19 Other formal Products 8 4 6 Informal Products 18 28 43 Secret Place/Family or friend 31 18 25 Excluded 27 29 6 Sources of Credit Bank 4 5 6 Other formal Institutions 2 2 7 Informal financial groups 25 32 18 Family/Friends 3 7 5 Excluded 66 55 65 Source: FinScope Reports 2006, 2009 & 2013 \1 population aged 18 years+

7
3.3 Supply Side Indicators
3.3.1 Financial Access Indicators Financial service access indicators allow policy makers to assess the penetration of the financial system in the country and the segment of population served by each type of financial institution/service. The Alliance for Financial Inclusion (AFI) developed a set of basic core indicators that could be used by member countries as a first step in understanding the status of financial inclusion with respect to data and measurement (Table 3). Table 3: AFI’s Access Indicators
Source: AFI
The indicators in Table 3 measure access to financial products and services that can be compared internationally with other AFI members. The indicator is estimated on every 10,000 adults served by a given access point and is assumed to be better when the number is high. Financial access indicators include all financial institutions providing financial services to the population. Commercial banks and other supervised financial institutions such as credit institutions and MDIs play a leading role in the provision of financial services to Ugandans. However, there are also other financial institutions such as SACCOs, MNOs and other microfinance institutions that provide financial services to a large majority of population in the country particularly in the rural areas. Although financial access indicators should incorporate all financial institutions, due to data limitations, the focus of this report is mainly on financial institutions supervised by BOU. Table 4 below presents access indicators for SFIs.
Indicator Definition 1.Access Points Number of access points per 10,000 adults at national level and
segmented by each type of administrative units 2.Coverage of access points Percentage of administrative units with at least one access point 3.Proximity Percentage of population living in administrative units with at least
one access point

8
Table 4: Financial Services Access Points Year No. of Access Points Access Points per 10,000 adults
Branches ATMs Branches ATMs Total 2008 402 405 0.28 0.27 0.55 2009 485 536 0.31 0.34 0.65 2010 497 628 0.31 0.38 0.70 2011 597 663 0.35 0.39 0.74 2012 631 748 0.36 0.42 0.79 2013 658 835 0.36 0.46 0.82 Source: Bank of Uganda
On a year-on-year basis, Uganda’s banking system’s overall physical network continued to experience sustained expansion as shown in Chart 1. The total number of bank branches in the country increased from 167 branches in 2004 to 658 branches in 2013. The ATM network also expanded and posted even faster growth. There was a substantial increase in the number of ATMs from 152 in 2004 to 835 in 2013(Chart 1). Chart 1: Number of Bank Branches and ATMs
Source: BOU
Despite the significant strides in expanding the number of access points by SFIs, its proportion to population is still low. In fact, both the number of branches for every 10,000 adults and the number of ATMs for every 10,000 adults are still below 1 access point at national level (Table 4).

9
In 2013, the density of bank branches stood at 5.9 banks per district which is an improvement from 4.5 banks per district, two years earlier. Despites this improvement, evidence of uneven distribution is still eminent across the country (Map 1). Map 1: Bank Branches by District
4411 ppeerrcceenntt ooff ddiissttrriiccttss iinn UUggaannddaa llaacckk aacccceessss ttoo aannyy bbaannkk bbrraanncchh

10
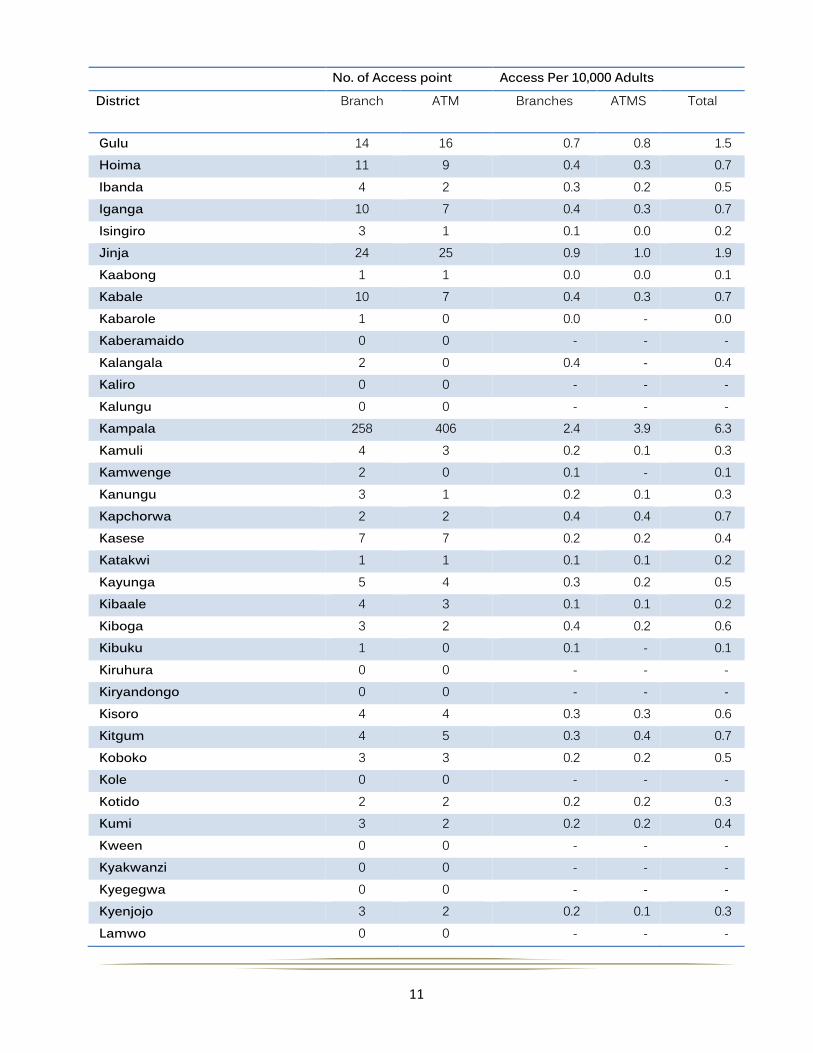
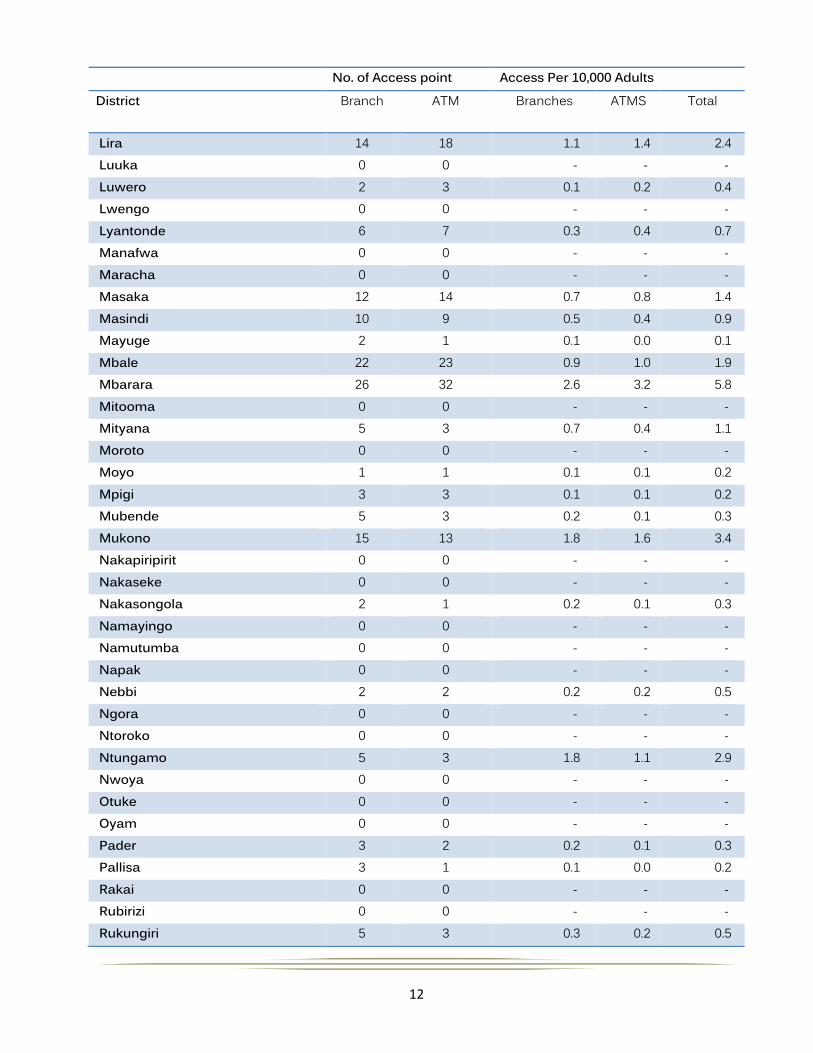
In addition, access to bank branches remained concentrated in a few districts particularly in the Central region. Kampala, Ntungamo, Mukono, Mbarara, Lira and Wakiso have more than 2 access points per 10,000 adults while, 41 percent and 48 percent of districts out of the 112 districts in Uganda lack access to any bank branch and ATM, respectively (Table 5). The bulk of the districts without access are those that were created in the last decade. Table 5: Financial Access Indicators by District No. of Access point Access Per 10,000 Adults District Branch ATM Branches ATMS Total
Abim 2 3 0.6 1.0 1.6 Adjumani 2 1 0.1 0.1 0.2 Agago 3 3 0.2 0.2 0.4 Alebtong 0 0 - - - Amolatar 0 0 - - - Amudat 0 0 - - - Amuria 0 0 - - - Amuru 0 0 - - - Apac 2 1 0.1 0.1 0.2 Arua 16 12 0.4 0.3 0.7 Budaka 0 0 - - - Bududa 0 0 - - - Bugiri 3 1 0.1 0.0 0.2 Buhweju 0 0 - - - Buikwe 2 0 0.1 - 0.1 Bukedea 0 0 - - - Bukomansimbi 0 0 - - - Bukwa 0 0 - - - Bulambuli 0 0 - - - Buliisa 1 1 0.2 0.2 0.5 Bundibugyo 1 1 0.1 0.1 0.1 Bushenyi 5 1 0.4 0.1 0.5 Busia 7 5 0.5 0.3 0.8 Butaleja 1 0 0.1 - 0.1 Butambala 0 0 - - - Buvuma 0 0 - - - Buyende 0 0 - - - Dokolo 2 2 0.2 0.2 0.5 Gomba 0 0 - - -
11
No. of Access point Access Per 10,000 Adults District Branch ATM Branches ATMS Total
Gulu 14 16 0.7 0.8 1.5 Hoima 11 9 0.4 0.3 0.7 Ibanda 4 2 0.3 0.2 0.5 Iganga 10 7 0.4 0.3 0.7 Isingiro 3 1 0.1 0.0 0.2 Jinja 24 25 0.9 1.0 1.9 Kaabong 1 1 0.0 0.0 0.1 Kabale 10 7 0.4 0.3 0.7 Kabarole 1 0 0.0 - 0.0 Kaberamaido 0 0 - - - Kalangala 2 0 0.4 - 0.4 Kaliro 0 0 - - - Kalungu 0 0 - - - Kampala 258 406 2.4 3.9 6.3 Kamuli 4 3 0.2 0.1 0.3 Kamwenge 2 0 0.1 - 0.1 Kanungu 3 1 0.2 0.1 0.3 Kapchorwa 2 2 0.4 0.4 0.7 Kasese 7 7 0.2 0.2 0.4 Katakwi 1 1 0.1 0.1 0.2 Kayunga 5 4 0.3 0.2 0.5 Kibaale 4 3 0.1 0.1 0.2 Kiboga 3 2 0.4 0.2 0.6 Kibuku 1 0 0.1 - 0.1 Kiruhura 0 0 - - - Kiryandongo 0 0 - - - Kisoro 4 4 0.3 0.3 0.6 Kitgum 4 5 0.3 0.4 0.7 Koboko 3 3 0.2 0.2 0.5 Kole 0 0 - - - Kotido 2 2 0.2 0.2 0.3 Kumi 3 2 0.2 0.2 0.4 Kween 0 0 - - - Kyakwanzi 0 0 - - - Kyegegwa 0 0 - - - Kyenjojo 3 2 0.2 0.1 0.3 Lamwo 0 0 - - -
12
No. of Access point Access Per 10,000 Adults District Branch ATM Branches ATMS Total
Lira 14 18 1.1 1.4 2.4 Luuka 0 0 - - - Luwero 2 3 0.1 0.2 0.4 Lwengo 0 0 - - - Lyantonde 6 7 0.3 0.4 0.7 Manafwa 0 0 - - - Maracha 0 0 - - - Masaka 12 14 0.7 0.8 1.4 Masindi 10 9 0.5 0.4 0.9 Mayuge 2 1 0.1 0.0 0.1 Mbale 22 23 0.9 1.0 1.9 Mbarara 26 32 2.6 3.2 5.8 Mitooma 0 0 - - - Mityana 5 3 0.7 0.4 1.1 Moroto 0 0 - - - Moyo 1 1 0.1 0.1 0.2 Mpigi 3 3 0.1 0.1 0.2 Mubende 5 3 0.2 0.1 0.3 Mukono 15 13 1.8 1.6 3.4 Nakapiripirit 0 0 - - - Nakaseke 0 0 - - - Nakasongola 2 1 0.2 0.1 0.3 Namayingo 0 0 - - - Namutumba 0 0 - - - Napak 0 0 - - - Nebbi 2 2 0.2 0.2 0.5 Ngora 0 0 - - - Ntoroko 0 0 - - - Ntungamo 5 3 1.8 1.1 2.9 Nwoya 0 0 - - - Otuke 0 0 - - - Oyam 0 0 - - - Pader 3 2 0.2 0.1 0.3 Pallisa 3 1 0.1 0.0 0.2 Rakai 0 0 - - - Rubirizi 0 0 - - - Rukungiri 5 3 0.3 0.2 0.5

13
No. of Access point Access Per 10,000 Adults District Branch ATM Branches ATMS Total
Serere 0 0 - - - Sheema 1 0 0.1 - 0.1 Sironko 1 2 0.1 0.1 0.2 Soroti 8 7 0.7 0.6 1.4 Ssembabule 1 0 0.0 - 0.0 Tororo 8 7 0.1 0.1 0.2 Wakiso 30 35 1.1 1.3 2.4 Yumbe 1 1 0.1 0.1 0.2 Zombo 0 0 - - - National 629 740 0.4 0.4 0.8 National Excluding Kampala 371 334 0.2 0.2 0.4
Min - - - Max 2.6 3.9 6.3 No. of districts with no Access point 46 54
46.0
Percentage of Districts with no Access point 41 48
41
Source: BOU and UBOS, 2012 On a regional basis, the Central region leads in the number of districts with at least one formal access point while the northern region has the lowest number of access points (Table 6). The low number of access points in the northern region could be attributed to previous civil war experienced for over a decade in the region as the distribution of banks is determined by business decisions such as cost, profitability, and business opportunities among others. Table 6: Distribution of Access Points by Region 2010 2012 Region Number Percentage Number Percentage North 122 11 145 11 Central 682 60 839 61 East 168 15 187 14 West 169 15 198 14 Total 1141 100 1369 100 Source: Bank of Uganda
14
3.3.2 Comparison of Access Indicators across Countries.
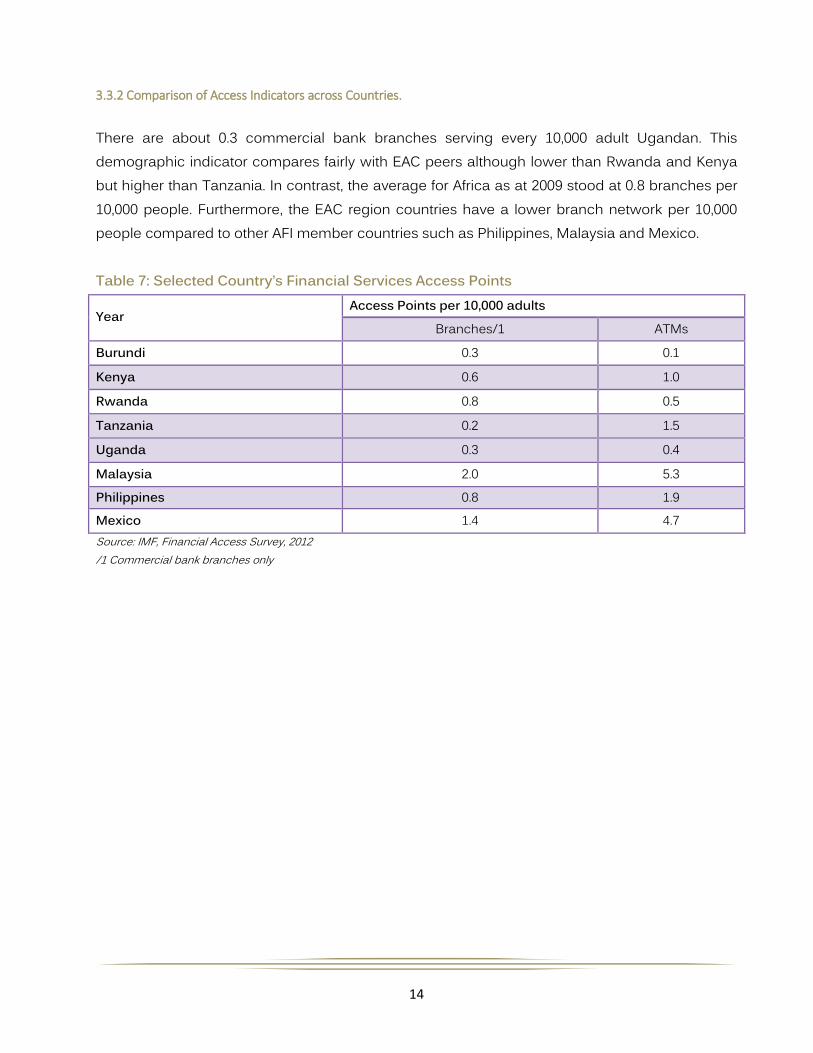
There are about 0.3 commercial bank branches serving every 10,000 adult Ugandan. This demographic indicator compares fairly with EAC peers although lower than Rwanda and Kenya but higher than Tanzania. In contrast, the average for Africa as at 2009 stood at 0.8 branches per 10,000 people. Furthermore, the EAC region countries have a lower branch network per 10,000 people compared to other AFI member countries such as Philippines, Malaysia and Mexico. Table 7: Selected Country’s Financial Services Access Points
Year Access Points per 10,000 adults
Branches/1 ATMs
Burundi 0.3 0.1
Kenya 0.6 1.0
Rwanda 0.8 0.5
Tanzania 0.2 1.5
Uganda 0.3 0.4
Malaysia 2.0 5.3 Philippines 0.8 1.9 Mexico 1.4 4.7 Source: IMF, Financial Access Survey, 2012 /1 Commercial bank branches only

15
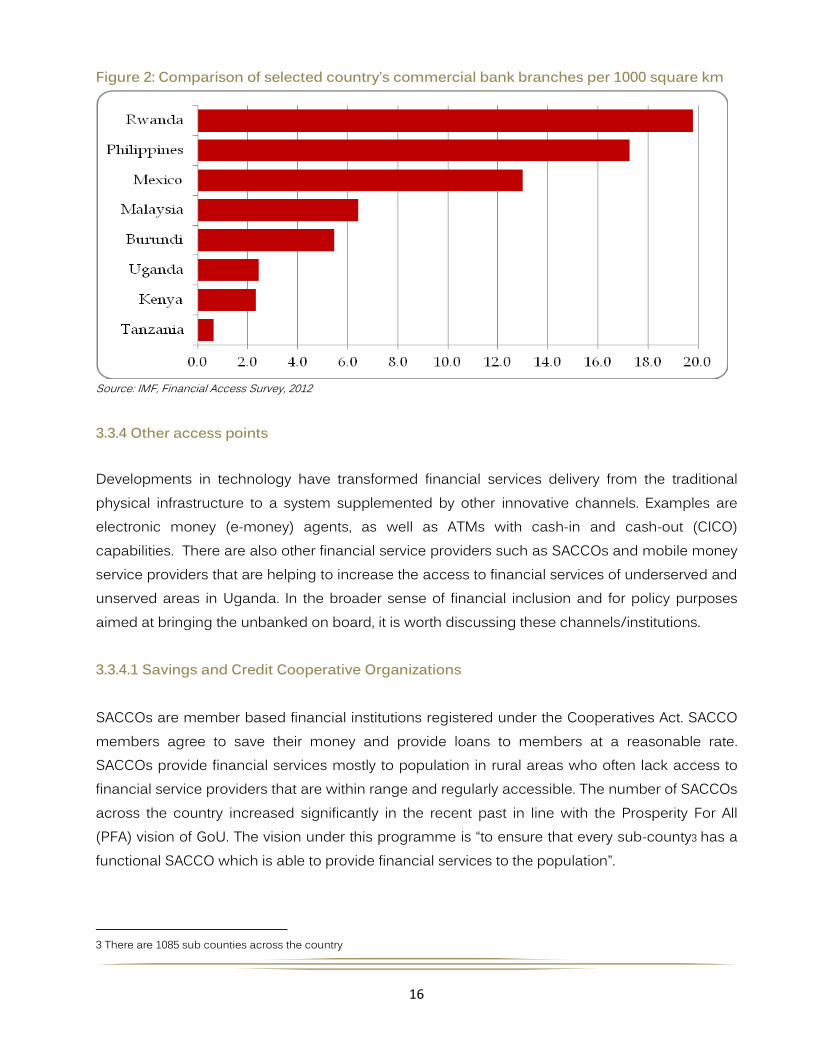
3.3.3 Geographic Indicators
Geographic indicators are estimated based on the number of access points for every 1,000 square kilometers. The higher the geographic penetration indicator is, the lower is the distance, and therefore the ease of access to the infrastructure. The limitation with this however is that it assumes uniform distribution across the geographical area. Table 8 shows geographic indicators in Uganda while Figure 2 shows a comparison with a select group of countries. Table 8: Financial Services Access Points by Distance
Source: Bank of Uganda
Year
Access Points per 1000 Square km Branches ATMs
2008 2.0 2.1 2009 2.5 2.7 2010 2.5 3.2 2011 3.0 3.4 2012 3.2 3.8 2013 3.3 4.2
16
Figure 2: Comparison of selected country’s commercial bank branches per 1000 square km
Source: IMF, Financial Access Survey, 2012 3.3.4 Other access points Developments in technology have transformed financial services delivery from the traditional physical infrastructure to a system supplemented by other innovative channels. Examples are electronic money (e-money) agents, as well as ATMs with cash-in and cash-out (CICO) capabilities. There are also other financial service providers such as SACCOs and mobile money service providers that are helping to increase the access to financial services of underserved and unserved areas in Uganda. In the broader sense of financial inclusion and for policy purposes aimed at bringing the unbanked on board, it is worth discussing these channels/institutions. 3.3.4.1 Savings and Credit Cooperative Organizations SACCOs are member based financial institutions registered under the Cooperatives Act. SACCO members agree to save their money and provide loans to members at a reasonable rate. SACCOs provide financial services mostly to population in rural areas who often lack access to financial service providers that are within range and regularly accessible. The number of SACCOs across the country increased significantly in the recent past in line with the Prosperity For All (PFA) vision of GoU. The vision under this programme is “to ensure that every sub-county3 has a functional SACCO which is able to provide financial services to the population”.
3 There are 1085 sub counties across the country
17
Table 9: Regional distribution of SACCOs-2011 Region Number Percentage North 349 17 Central 519 25 East 675 32 West 551 26 Total 2094 100 Source: UCSCU
Using the available data from the 2011 SACCO census, there were about 2094 SACCO branches representing 1.3 branches per every 10,000 adult Ugandans. Unlike SFIs, the regional distribution of SACCOs is higher in the eastern part of the country (Table 9).

18
Map 2: SACCO Distribution by District
3.3.4.2 Mobile Money Services The presence of alternative channels helps significantly in reaching the areas with limited or no banking presence. Since the inception of mobile money services in Uganda in March 2009, the number of registered subscribers has increased from 10,010 in March 2009 to 14.2 million in December 2013, representing over 80 percent of adult population with access to mobile money financial services. The number of access points as measured by agent network has equally skyrocketed to serve the users of mobile money services. By December 2013, there were over 50,000 mobile money agents (Figure 3) spread across the country. This represents about 27.8 access points per every 10,000 adults, higher than the outreach for other channels. Map 3 shows the geographical distribution of mobile money agents across Uganda.

19
Figure 3: Developments in Number of Agents and Registered Customers
Source: Bank of Uganda
Map 3: Distribution of Mobile Money Agents4
Source: Brand Fusion Ltd & Gates Foundation
4 Based on 17,889 agents

20
4.0 Usage Indicators Effective access forms a precondition for usage. The AFI developed core set of usage indicators in terms of deposit and credit account i.e. percentage of adults with at least one type of regulated deposit account and percentage of adults with at least one type of regulated credit account. The amount of basic information on usage from the supply-side however, remains limited to the number and amount of deposits and amount of loans outstanding. As such, the proposed proxies for usage are:
(i) Number of regulated deposit accounts per 10,000 adults (ii)Number of regulated credit accounts per 10,000 adults
4.1 Deposits & Loans The number of deposit accounts held with SFIs more than tripled over the last eight years from 1,471,146 accounts in 2004 to 5,367,512 accounts in 2013. Similarly, the shilling volume of deposits followed an increasing trend. The total amount of deposits for non financial enterprises and households held by SFIs increased from Shs 1,965.3 billion in 2004 to Shs 9,498.7 billion in 2013(Figure 5). Similarly, the number of borrowers at SFIs stood at 560,446 by end 2012 while total outstanding stood at Shs.8095.1 billion at end 2012. Figure 5: Number of Deposit Accounts and Total Amount of Deposits (2004 – 2013)
Source: BOU
21
5.0 Conclusion This report provides a snap shot of the current state of financial inclusion in Uganda using existing datasets submitted to BOU by SFIs and supplemented by data collected from other sources. On the demand-side, the report notes an overall improvement in financial inclusion from 38 percent in 2006 to 85 percent in 2013, particularly supported by the emergence of mobile money over the last four years. On the supply-side, the report also observes significant expansion in branch and ATM networks albeit with high concentration in urban areas. The emergence of SACCOs has also helped in providing access to unbanked population particularly in the rural areas. The report serves as an inventory that can be used to identify gaps, establish priorities, and craft evidence-based financial inclusion policies. In future, the report will also be used to measure progress made towards achieving financial inclusion objectives.


![Role of Mobile Money services - Bank of Uganda - bou.or.ug · 1 THE ROLE OF MOBILE MONEY SERVICES IN ENHANCING FINANCIAL INCLUSION IN UGANDA [1] George Wilson SSONKO [2] ABSTRACT](https://static.documents.pub/doc/80x56/5ac15ae77f8b9a1c768cb63a/role-of-mobile-money-services-bank-of-uganda-bouorug-the-role-of-mobile-money.jpg)


