Organic Agriculture Status of in Minnesota 2015 A Report to the Minnesota Legislature Contact Meg Moynihan, 651-201-6012 625 Robert St. N., St. Paul, MN 55155 www.mda.state.mn.us April, 2016
Transcript
OrganicAgriculture
Status of
in Minnesota 2015A Report to the Minnesota Legislature
ContactMeg Moynihan, 651-201-6012625 Robert St. N., St. Paul, MN 55155www.mda.state.mn.usApril, 2016
Thank you to the University of Minnesota (including intern Shannon Suehr) and to the USDA Farm Service Agency, Natural Resources Conservation
Service, and Risk Management Agency for their contributions to this report.
Pursuant to Minn. Stat. §3.197, the cost of preparing this report was approximately $10,000.
In accordance with the Americans with Disabilities Act, this information is available in alternative forms of communication upon request by calling 651-201-6000. TTY users can call the Minnesota Relay Service at 711. The MDA is an equal opportunity employer and provider.
File Name: Status of Organic Agriculture in Minnesota 2015 Legislature Report.indd
3
Executive Summary
The U.S. and global organic markets continue to grow and expand, providing increasing opportunity for Minnesota organic farmers of all kinds. Data on organic adoption by farmers and consumers is increasingly available. The U.S. organic food market reached an estimated $39 billion in 2015, with Minnesota organic farm production and sales ranking in the top 10 for nearly 20 types of crops and livestock (including livestock products like milk). Organic farmers are concerned that organic food is experiencing competition from competing label claims like “natural,” and “non-GMO.”
The number of organic farms in Minnesota grew by about 13% between 2011 and 2015 to an estimated 627. Minnesota’s organic farming expansion was slower than the national adoption rate during this time, likely because Minnesota farmers were early adopters of organic production, with many transitioning to organic in the 1970s, 1980s and 1990s. More than 200 certified organic handlers have facilities in Minnesota, adding additional value to raw organic product through processing, packaging, and/or distribution.
Organic farms are widely distributed across the state and their type of production typically resembles that of their non-organic counterparts in our various agro-ecoregions. Most Minnesota organic crop and dairy farmers converted to organic from conventional production, but most organic fruit and vegetable farmers started their farming careers as organic growers. While they acknowledge production challenges and concerns, most organic farmers appear to feel positive about their decision to farm organic. More than half believe organic production costs are lower and profitability is higher. More than two-thirds believe they or a family member will be farming in 20 years. The challenges they cite include: public confusion about the organic label; the cost of inputs such as seed, fuel, feed, extreme weather; the cost of health care; and weed management. They want more research on weed management, seed breeding, and variety development for use in organic systems, soil health, biology, and fertility, GMO pollen drift, consumer issues, and nutritional characteristics of organic food.
The Minnesota Department of Agriculture, University of Minnesota, and United States Department of Agriculture agencies in Minnesota cooperate to offer a wide array of support to organic farmers, including information, education, and networking, research, conservation assistance, financial support, and crop insurance.
This document reports on progress toward goals that were enumerated in the 2010 Status of Organic Agriculture report. It presents a set of new recommendations that were informed by input from the Minnesota Organic Advisory Task Force, surveys of Minnesota organic farmers, agency partners, MDA staff experiences, and other direct input from the organic community.
State programs that should be continued or enhanced include education, information, and networking, financial assistance for transition and organic certification, pesticide drift investigation, and outreach to organic producers regarding state and federal programs.
Policy recommendations include monitoring competing label claims, reviewing insurance liabilities for pesticide applicators and increasing penalties for drift incidents, and enabling organic farmers to opt out of pesticide application, provided that a plan for management of noxious weeds is in place.
Research recommendations include continued support for long and short-term cropping system research, applied research efforts that address current and emerging organic producer and handler priorities (including soil, weed, insect pest, GMO drift, food safety, nutrition, and topics related to the economics and sociology of organic transition and production), and ensuring that investigators at the U of M and elsewhere are aware of legislatively-funded research opportunities administered by MDA.
4
Introduction
The Minnesota Department of Agriculture (MDA) prepared this report for the Minnesota Legislature in order to meet its statutory obligation in M.S. §31.94 (5)(b), which requires the department to report available data on organic acreage and production, available data on the sales or market performance of organic products, and recommendations regarding programs, policies, and research efforts that will benefit Minnesota’s organic agriculture sector. This is the fifth Status of Organic Agriculture in Minnesota report that has been prepared since 2001.
Background
Organic is a labeling claim that describes how an agricultural product was grown and handled before it reached the consumer. “Organic” was defined by Congress in the Organic Foods Production Act of 1990. After 10 years of rule making and two public comment periods, The National Organic Program (NOP) Final Rule was published in the Federal Register on December 21, 2000 and went into effect on October 21, 2002.
The Final Rule established uniform national organic standards for the production and handling of organic food and established the National Organic Program as the regulatory authority for organic. The NOP is responsible for the oversight and enforcement of national organic standards, accrediting certifying agencies, and facilitating domestic and international marketing of organic products. The NOP is housed within the Agricultural Marketing Service (AMS) at the United States Department of Agriculture (USDA). The Minnesota Legislature adopted the national organic standards by reference in 2003.
While some of organic’s value is intrinsic, some is also extrinsic and depends on the transparency and consumer confidence in the organic certification process. At the farm level, organic agriculture is a management-intensive system of farming that relies on biology, timing, and ecological cycling to create vigorous crops and livestock, and to manage insect pests, weeds, and disease (Fig. 1). Organic is also third-party verified. A USDA-approved organization called a certifying agency reviews farm records and conducts an on-farm inspection at least once per year (Fig. 2).
Figure 2. Examples of logos for four accredited certifying agents active in Minnesota.
• Use biologically-based weed and pest control (synthetic commercial herbicides, insecticides and fungicides are prohibited – with very few exceptions)
• Use only naturally- occurring fertilizers (manure, compost, mined minerals)
• Use no GMO seed or other GMO materials
• Protect soil and water
• Plant buffers and barriers to prevent GMO and chemical drift from neighbors
• Provide animals with clean, comfortable living conditions and access to outdoors.
• Use extended crop rotation and other practices that enhance biodiversity
• Maintain production, input, harvest, storage and sales records that demonstrate compliance with organic standards
• Undergo monitoring by an approved 3rd party agency, including annual and unannounced farm inspections
5
For a product to retain its organic status, any additional processing (or “handling,” as USDA calls it) must also be done under certified organic conditions. All ingredients, processing aids, pest management in the facility, and labeling must follow the National Organic Standards. There must be no opportunity for organic products to mix, or commingle, with similar non-organic products or to come into contact with unapproved substances. Organic handlers must also be inspected at least once a year.
Primary Data SourcesThere are a growing number of data sources that report organic information on state, national, and international bases, but they vary in accuracy, completeness, and timeliness. In this report, we draw upon the following:
• MDA: We maintain a list of farms we believe to be certified organic. It is based on information we collect periodically from certifying agencies and on participation in programs that require applicants to document their certification status. There is some churn as farmers exit and enter organic, and we believe our list is likely to slightly overestimate the number of Minnesota certified organic farms and handlers.
The MDA also surveys Minnesota organic farmers every 2-3 years, focusing on farmer opinions and experiences.
• USDA National Organic Program (NOP): The NOP, which is part of USDA’s Agricultural Marketing Service (AMS), collects and publishes information provided by accredited certifying agencies (ACAs) in a database called the Organic INTEGRITY Database. This resource has steadily improved over the past several years and is now probably the most reliable source of organic operation numbers.
• USDA Economic Research Service (ERS): This agency has collaborated with accredited certifiers to collect and publish organic farm numbers, acreage, and production data since 1995. We consider the most accurate acreage estimates to be those published by ERS. Unfortunately, they are not the most up-to-date; the agency has not published acreage data since 2011.
• USDA National Agricultural Statistics Service (NASS): NASS started conducting organic farmer surveys in 2008. While responding is legally mandatory, in practice there is wide variability in the number of farmers that respond, and NASS estimates are consistently lower than NOP and ERS data, which are both based on certifier records. NASS does, however, report acreage and production data in a consistent manner.
• FINBIN: The Center for Farm Financial Management (CFFM) located at the University of Minnesota (U of M) is a publicly available database that contains detailed, privacy-protected production and financial information from farms in Minnesota and 10 other states. Users can customize detailed reports on whole farm performance as well as individual crop and livestock enterprises. From 2006-2012, the MDA led an organic farm business management education effort that generated more Minnesota organic farm data for FINBIN.
Organic Farm and Market Trends
Organic Adoption and ProductionThe number of organic operations continues to grow in Minnesota and throughout the United States (Table 1). The rate of growth in organic farm numbers and acreage slowed and sometimes dipped in the wake of the 2008 financial crisis and during the subsequent recession, but are on the rise again. NOP data indicate the number of certified organic farms in Minnesota grew by 13 percent during the past five years, while the number of organic farms in the U.S. grew by nearly 22 percent. We believe this discrepancy is partly due to the fact that Minnesota farmers were early adopters of organic in the 1970s, 80s, and 90s, and other states are now beginning to catch up.
6
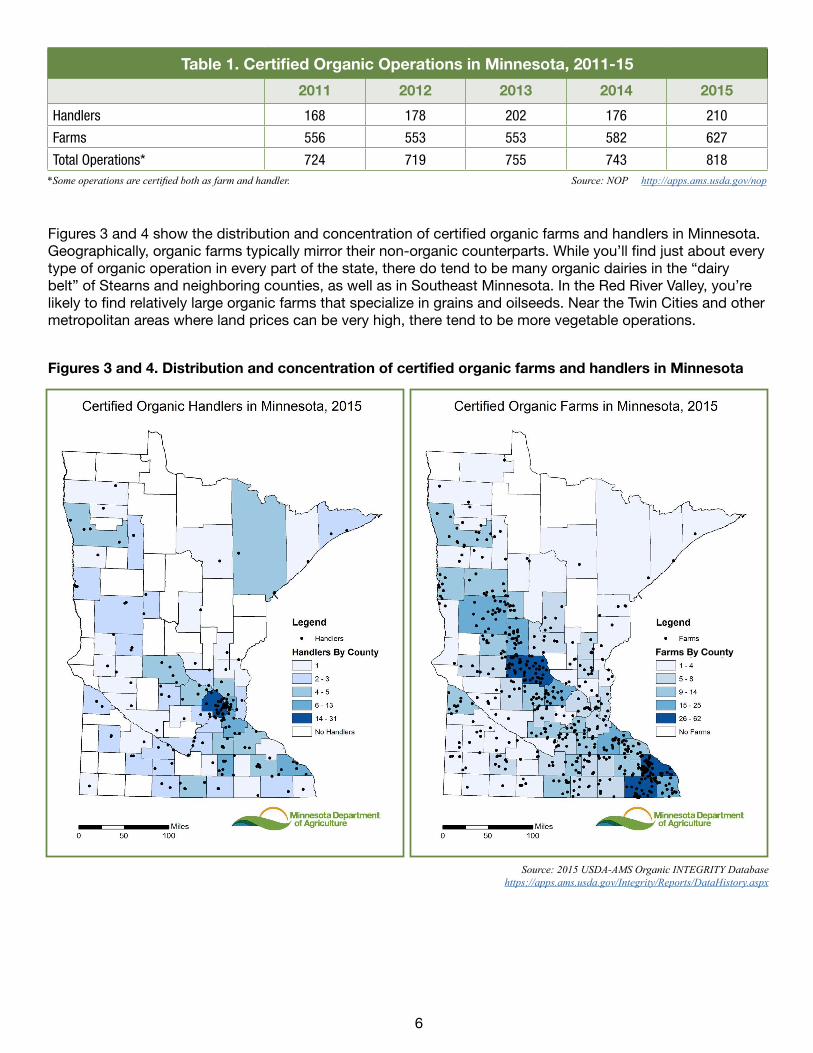
Table 1. Certified Organic Operations in Minnesota, 2011-15
2011 2012 2013 2014 2015
Handlers 168 178 202 176 210
Farms 556 553 553 582 627
Total Operations* 724 719 755 743 818*Some operations are certified both as farm and handler. Source: NOP http://apps.ams.usda.gov/nop
Figures 3 and 4 show the distribution and concentration of certified organic farms and handlers in Minnesota. Geographically, organic farms typically mirror their non-organic counterparts. While you’ll find just about every type of organic operation in every part of the state, there do tend to be many organic dairies in the “dairy belt” of Stearns and neighboring counties, as well as in Southeast Minnesota. In the Red River Valley, you’re likely to find relatively large organic farms that specialize in grains and oilseeds. Near the Twin Cities and other metropolitan areas where land prices can be very high, there tend to be more vegetable operations.
Figures 3 and 4. Distribution and concentration of certified organic farms and handlers in Minnesota
We have high confidence in the accuracy of ERS organic acreage and livestock data, and are disappointed that they have not released estimates since 2011. Here, we report acreage, production and ranking data from the 2014 NASS Organic Survey, which is self-reported by farmers who elect to participate in the survey. While there are some omissions and inconsistencies, they are the most comprehensive acreage, production, and farm sales estimates available at present. Minnesota remains a top 10 producer of a wide array of organic crops and livestock (Tables 2 and 3).
Table 2. Minnesota Organic Acres, Sales, and Rankings for Selected Organic Crops, 2014
Acres Acre rank Sales Sales rank
Apples 105 9 $344,395 7
Barley 3,258 5 $653,711 6
Beans (dry edible) 732 8 $961,990 3
Buckwheat 285 2 $55,786 3
Corn (grain) 18,734* 3* $16,724,090 2
Corn (silage) 2,882 5 $146,790 8
Hay (alfalfa & alfalfa mixtures) 14,799 6 $4,976,234 6
All vegetables, potatoes & melons (field grown) 1,896 9 $5,530,010 not in top 10
Table 3. Minnesota Head, Sales and Rankings for Selected Organic Livestock, 2014
Head Head rank Sales Sales rank
Beef cows * * $477,838 7
Broiler chickens 5,750 6 $51,527† 8†
Goats and kids 759 3 $64,687 2
Milk cows 10,152 4 $37,367,391‡ 5‡
Sheep and lambs 986 2 $100,138 1
Turkeys 70,900 1 $2,036,005 1
*Estimate. According to NASS, MN acres for organic corn (grain) harvested from 276 farms are not reportable due to data anomalies and statistical procedures. Here we estimate acreage using MN bushels sold and the national average production per acre.
Source: NASS, 2015
Source: NASS, 2015*Not reported and impossible to estimate from other MN data provided.
†Estimate. The value of Minnesota broiler chickens was not reported due to NASS data anomalies and statistical procedures. Here we estimate value, based on MN birds sold and national average price.
‡Value of organic milk sold under marketing contract.
8
Organic PricesOrganic price data has also become more available in the past five years. The Livestock, Poultry, and Grain Market News Division within AMS has been collecting spot (cash) market prices from buyers and publishing it bi-weekly since 2007 1. They will soon add bid and contract prices to the reports they offer (AMS, 2016; Heath Dewey, personal communication). Figures 5 through 8 show average quarterly prices for corn, soybeans, and several small grains between 2011 and 2015. 2 Figure 9 shows the Midwest mailbox milk price (with average components and quality premiums) paid by CROPP an organic cooperative based in southwest Wisconsin that has members in 34 states, Canada, and Australia, and markets its dairy products under the “Organic Valley” brand. 3 Figure 9 also shows the average Minnesota milk price reported by NASS, along with the average price per hundredweight reported by Minnesota organic farmers who participated in farm business management education programs and provided their farm data for inclusion in the FINBIN database. CFFM, which manages the database, ensures that reporting farms’ privacy is protected and that no individual farm can be identified. In the past five years, the premium for organic milk has been as little as $5.89 and as much as $16.68 per hundredweight.
1 The firms that report these prices to USDA do so voluntarily.2 Gaps in the accompanying figures mean that no sales were reported during that period, or that the number of sales reported was so low that AMS withheld the data in order to protect buyer/seller confidentiality. 3 We contacted three other organic dairy buyers that source milk in Minnesota. One declined to provide historical price information and two others did not respond to the request.
$10$12$14$16$18$20$22$24$26$28$30
Q111
Q211
Q311
Q411
Q112
Q212
Q312
Q412
Q113
Q213
Q313
Q413
Q114
Q214
Q314
Q414
Q115
Q215
Q315
Q415
$/bu
Quarter
Figure 6. Organic Soybean Prices, 2011-15
Food Grade Feed grade
Source: AMS, 2016
$0$2$4$6$8
$10$12$14$16$18$20
Q111
Q211
Q311
Q411
Q112
Q212
Q312
Q412
Q113
Q213
Q313
Q413
Q114
Q214
Q314
Q414
Q115
Q215
Q315
Q415
$/bu
Quarter
Figure 5. Organic Corn Prices, 2011-15
Food grade Feed grade
Source: AMS, 2016
9
$0$2$4$6$8
$10$12$14$16$18$20
Q111
Q211
Q311
Q411
Q112
Q212
Q312
Q412
Q113
Q213
Q313
Q413
Q114
Q214
Q314
Q414
Q115
Q215
Q315
Q415
$/bu
Quarter
Figure 7. Organic Barley & Oat Prices, 2011-15
Barley Oats
Source: AMS, 2016
$0
$5
$10
$15
$20
$25
Q111
Q211
Q411
Q112
Q212
Q312
Q412
Q113
Q213
Q313
Q413
Q114
Q214
Q314
Q414
Q115
Q215
$/bu
Quarter
Figure 8. Organic Wheat Prices, 2011-15
Hard Red Spring (food grade) Hard Red Winter (food grade)
Hard Red Winter (feed grade)
Source: USDA AMS, 2016b
$15
$20
$25
$30
$35
$40
2011 2012 2013 2014 2015
$/cw
t
Year
Figure 9. Organic and Conventional Milk Prices, 2011-15
Organic - OV Organic - FINBIN Conventional
Sources: FINBIN, 2016; NASS, 2016; Organic Valley, 2016Other buyers declined to provide data or did not respond to request.
10
Market Demand
The United States is a dominant player in a growing global organic market. As of 2013, the U.S. organic market was the largest in the world, (accounting for approximately 43 percent of the total global organic market), followed by the European Union and China. The highest per capita organic consumption rates, however, belonged not to these “big three,” but to Switzerland, Denmark and Luxembourg (Willer and Lernroud, 2015).
Export and import data are somewhat problematic. Beginning in 2011, classification codes were established to allow tracking for a limited set of organic products (mostly fruits and vegetables, as well as coffee). Consequently, import/export data reported by the USDA Foreign Agricultural Service (FAS) paint an incomplete picture of U.S. organic trade, particularly for states like Minnesota; since our major organic production (grains, beans, oilseeds) is not currently coded, they are not represented in the import/export figures. The existing FAS data show an imbalance for each of the last five years, with imports topping exports by more than $1 billion in 2015 (FAS, 2016 at http://apps.fas.usda.gov/gats).
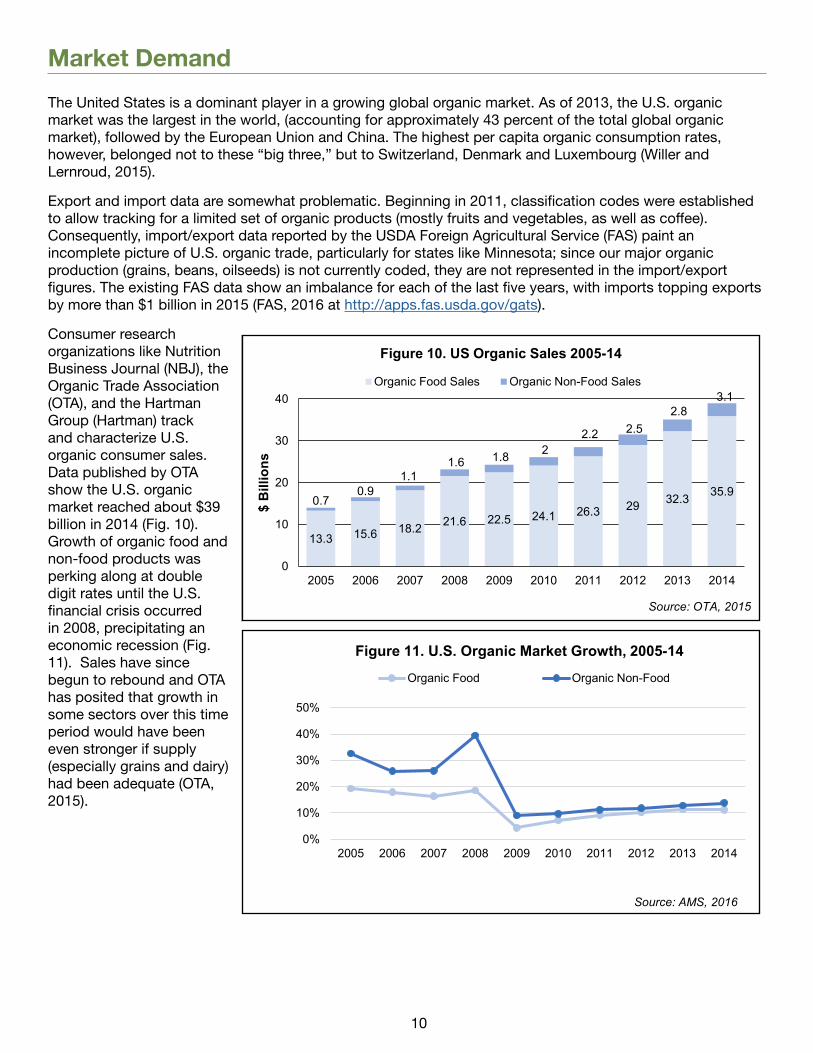
Consumer research organizations like Nutrition Business Journal (NBJ), the Organic Trade Association (OTA), and the Hartman Group (Hartman) track and characterize U.S. organic consumer sales. Data published by OTA show the U.S. organic market reached about $39 billion in 2014 (Fig. 10). Growth of organic food and non-food products was perking along at double digit rates until the U.S. financial crisis occurred in 2008, precipitating an economic recession (Fig. 11). Sales have since begun to rebound and OTA has posited that growth in some sectors over this time period would have been even stronger if supply (especially grains and dairy) had been adequate (OTA, 2015).
Organic food and beverage sales continue to account for the majority (92 percent) of the U.S. organic market, but the non-food organic sector is growing slightly faster, especially the textiles and personal care sectors, and reached $3.1 billion in 2014 (OTA, 2015).
Organic food now accounts for 5 percent of all U.S. foods sales. Produce is still far and away the bestselling organic food category with 2015 sales estimated at $14.9 billion, followed by dairy and packaged/prepared foods following at $5.42 and $4.54 billion, respectively (Fig. 12) (NBJ, 2014).
Organic Consumer Insights Consumer research groups report that as many as 75-85 percent of households buy organic products at least occasionally. Hartman found 36 percent of consumers bought or consumed organic products monthly, while a Consumer Reports survey put that number at 45 percent (Hartman, 2014b; Hartman, 2015; Consumer Reports, 2014). OTA says organic purchasing is on the rise, with 51 percent of families buying more organic in 2015 than the year before (OTA, 2015b). In 2014, Hartman reported Millennials were the most dedicated organic food buyers, with 12 percent of them buying organic food daily. The Boomer and Gen X generations trailed, with 7 and 8 percent consuming organic food on a daily basis, respectively (Hartman, 2014b). Data from Mintel indicate that households with children under age 18 were 27 percent more likely to purchase organic food than households without them (Mintel, 2015). Food Navigator reported on an OTA study that found that race and ethnicity of organic consumers reflect the racial and ethnic breakdown of the U.S. population as a whole. The study determined that 14 percent of Black households, 16 percent of Hispanic households, and 73 percent of White families buy organic on a regular basis. This compares to a U.S. population that is 13 percent Black, 16 percent Hispanic, and 72 percent White (Crawford, 2015).
Consumer research groups have also investigated consumer motivations for buying organic. Hartman found consumers’ main reasons for choosing organic were, “safer for me” and avoiding pesticides, GMOs and growth hormones (Hartman, 2014). According to a 2014 Mintel survey, health and nutrition were the top drivers for purchasing organic, at 72 percent, followed by environment/ethical concerns at 69 percent. Economists at ERS have reviewed a number of studies and also concluded that consumers who prefer organic are motivated by health, environment, and animal welfare concerns (ERS, 2014; Hartman, 2014; Mintel 2015).
Source: Nutrition Business Journal, Chart 22, 2014
12
Organic products are increasingly available; ERS reported in 2014 that organic food was sold in three out of four conventional grocery stores. In fact, many larger chains now offer their own store brand organic lines (also called “private label”), such as Cub’s “Wild Harvest,” Whole Foods’s “365 Everyday Value,” and “Wild Oats” at Wal-Mart, (ERS, 2014).
Consumer confusion about the practices behind and characteristics of organic farming and food is a recurring trend in the literature. In addition to advocates, organic also has active detractors, who use both traditional and social media. While there are specific criteria that organic farmers (and products) must meet before they can bear the USDA Organic Seal, consumer confusion and doubts about veracity of organic claims persist. Mintel has documented that some consumers think organic is a marketing term with no real value or definition, or is an excuse to charge more. They also report that only 30-40 percent of consumers believe that products labeled “organic” really are (Mintel, 2015). In addition, the three “levels” of organic labeling sanctioned by USDA (“100% Organic,” “Organic,” and “Made with Organic [ingredient/s]” may add to consumer confusion and mistrust.
“Non-GMO” is one of the most recent best known new eco-labels. Some retail experts [and a number of Minnesota Organic Advisory Task Force (OATF) members] are concerned that it competes with the organic label. Others think the two are complimentary. Consumer response to “Non-GMO” has been strongly positive; according to The Organic & Non-GMO Report, SPINS data has tracked growth of Non-GMO sales at 70 percent a year since 2013. One retailer interviewed by The Organic & Non-GMO Report observed that non-GMO’s simple, single claim (no GMOs) may be why it’s so successful. By contrast, organic encompasses a suite of characteristics (including and in addition to “no GMOs”), which may be beyond many consumers’ attention spans (Bunge & Gasparro, 2015; OATF, 2013, 2014, 2015; Roseboro, 2013; Roseboro, 2015).
Some in the organic community, including Minnesota organic farming survey respondents and members of the OATF, are concerned that when consumers see “non-GMO”, they assume that all other products – including organic – contain GMOs. Others worry that since they generally cost less than organic, shoppers will choose non-GMO instead of organic because it’s “almost as good.” The largely unregulated “natural” label claim has generated similar concerns – as well as an increasing number of consumer lawsuits (Food Navigator, 2016).
Promotional Check-off EffortIn or about 2012, the OTA proposed that an organic research and promotion check-off be established, and in May 2015 they formally petitioned the USDA to do so. During this time, many strong voices have been heard both in favor of and against the idea.
Interestingly enough, the MDA included a check-off question way back on the 2007 Minnesota Organic Farmer Survey, in response to a suggestion made by the OATF. Approximately 58 percent of survey respondents said they would support a voluntary check-off if they knew the funds would be used specifically for organic research and promotion.
Seven years later, the MDA asked organic farmers their opinion about the OTA-led check-off effort that was underway. At that time, 6 percent said they strongly supported it, 36 percent strongly opposed it, 20 percent didn’t support or oppose and 38 percent said they weren’t aware of the effort or had no opinion about it. USDA has formally invited other organizations to submit proposals and is currently in the process of reviewing all of the proposals (B. Rakola, personal communication, March 8, 2016). Additional steps in the process, which include public comment period(s) and a referendum, are outlined by the AMS at www.ams.usda.gov/rules-regulations/research-promotion (AMS, 2016b).
Minnesota Organic Farmer Experiences and Perspectives
The MDA pays close attention to the experience, ideas, and needs of organic farmers by occasionally surveying them and by listening to feedback from the OATF mandated in M.S. §31.94 (c), which includes representatives from the organic farm, processing, retail, and consumer sectors. The MDA surveyed organic farmers in the state in 2011 and again in 2014. 4 The results provide a snapshot of organic farm and farmer characteristics, motivations, challenges, interests, and experiences. We mailed the surveys to our list of organic farmers and enclosed a postage paid return envelope in order to encourage returns. Our response rate in both years was greater than 30 percent.
While we focus on the most recent results in this report, we do include some of the data from the 2011 survey when the comparisons seem interesting.
Many organic farms are diversified, but we asked respondents to identify their primary organic enterprise and analyzed the data accordingly. Crop farmers returned the greatest number of surveys (108 in 2011; 125 in 2014) followed by dairy (63/63). In 2011 we treated fruit and vegetable as a single category (20 returns), but in 2014 we structured the survey so that we could differentiate between “fruit” (13) and “vegetable” (21) growers. In both years, we included a category for “other livestock”. Since the type of production in that category is so varied and can include beef, poultry, sheep, and goats, and since many organic meat producers choose not to certify their livestock, we are not reporting “other livestock” results here.
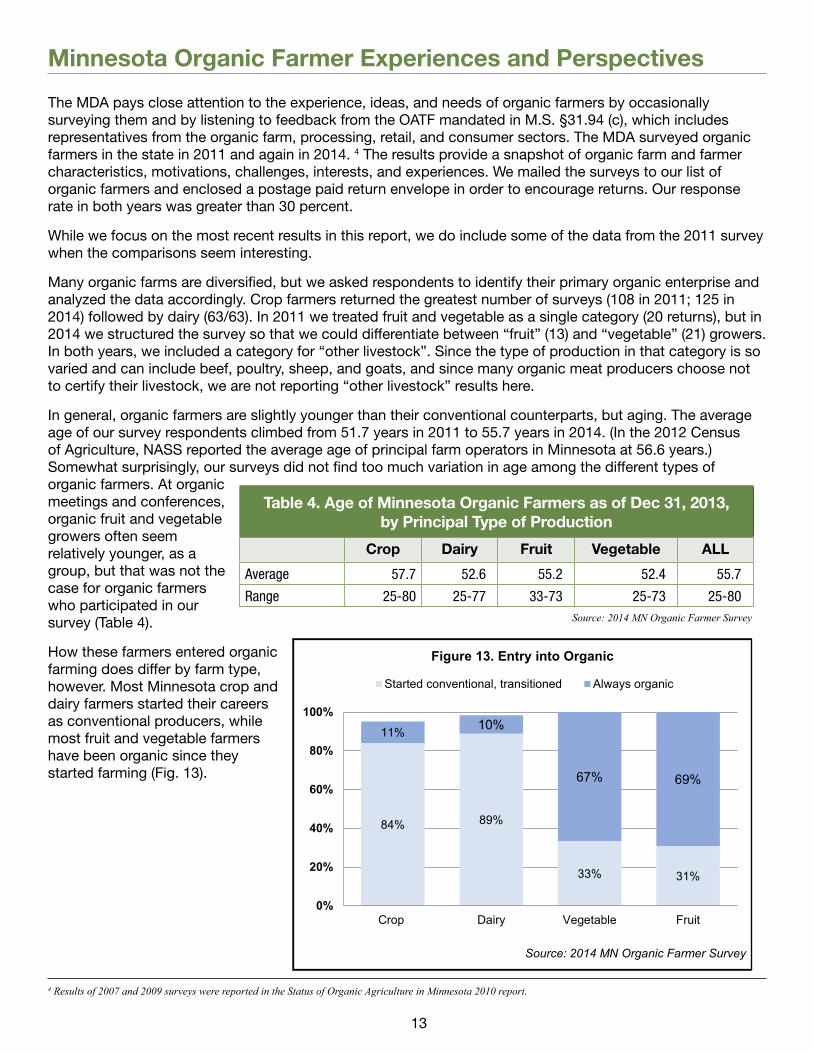
In general, organic farmers are slightly younger than their conventional counterparts, but aging. The average age of our survey respondents climbed from 51.7 years in 2011 to 55.7 years in 2014. (In the 2012 Census of Agriculture, NASS reported the average age of principal farm operators in Minnesota at 56.6 years.) Somewhat surprisingly, our surveys did not find too much variation in age among the different types of organic farmers. At organic meetings and conferences, organic fruit and vegetable growers often seem relatively younger, as a group, but that was not the case for organic farmers who participated in our survey (Table 4).
How these farmers entered organic farming does differ by farm type, however. Most Minnesota crop and dairy farmers started their careers as conventional producers, while most fruit and vegetable farmers have been organic since they started farming (Fig. 13).
Table 4. Age of Minnesota Organic Farmers as of Dec 31, 2013, by Principal Type of Production
4 Results of 2007 and 2009 surveys were reported in the Status of Organic Agriculture in Minnesota 2010 report.
84% 89%
33% 31%
11% 10%
67% 69%
0%
20%
40%
60%
80%
100%
Crop Dairy Vegetable Fruit
Figure 13. Entry into Organic
Started conventional, transitioned Always organic
Source: 2014 MN Organic Farmer Survey
14
Operation size varied by type as well. Fruit and vegetable farms tended to be smaller than crop and dairy farms in terms of gross farm revenue, with most operations reporting gross revenue under $50,000. The revenue distribution for crop and dairy operations was more widely distributed (Fig. 14-17).
<$50K31%
$50-100K17%
$100-250K24%
$250-500K16%
$500K-1M9%
$1M+3%
Figure 14. 2013 Gross Annual Income Cropping Operations
Source: 2014 MN Organic Farmer Survey
<$50K8%
$50-100K10%
$100-250K32%
$250-500K27%
$500K-1M18%
$1M+5%
Figure 15. 2013 Gross Annual Income Dairy Operations
Source: 2014 MN Organic Farmer Survey
<$50K77%
$100-250K15%
$250-500K8%
Figure 16. 2013 Gross Annual Income Fruit Operations
Source: 2014 MN Organic Farmer Survey
<$50K69%
$50-100K5%
$100-250K21%
$250-500K5%
Figure 17. 2013 Gross Annual Income Vegetable Operations
Source: 2014 MN Organic Farmer Survey
Organic farmers are generally optimistic about the future of their farms. While 2013 (the year our 2014 survey asked farmers to reflect on) was one of high conventional prices and modest organic premiums, well over two-thirds said they believed their farm will still be in operation twenty years into the future (Fig. 18).
91% 89%75%
97%90%
71%
0%10%20%30%40%50%60%70%80%90%
100%
5 years 10 years 20 years
Figure 18. Thinks self or family member will be farming in…
2011
2014
15
As a whole, 42 percent of survey respondents in 2014 said they thought organic production costs were higher than conventional, but more (65 percent) said they thought organic farming was more profitable. It’s interesting to compare their perspectives with actual organic farm data in the FINBIN database. Figures 19 and 20 show expenses and returns for the conventional and organic corn and dairy farmers who reported their data for inclusion (averaged over the five years between 2010 and 2014). The cost of production on organic farms was lower in both cases. And while production was lower on these farms (107 bu corn/acre on organic farms compared to 165 bu on conventional farms and 12,991 lb milk/cow on organic farms compared to 22,824 lb milk/cow on conventional dairies), at that time, average prices received were $5.55 higher per bushel of organic corn and $8.52 higher per hundredweight of milk, so net returns for the organic enterprises were higher.5
5 The 5-year average prices for corn that Minnesota farmers realized between 2010-2014 was $10.62/bu for organic and $5.10/bu for conventional, according to FINBIN data. For dairy, they were $28.57/cwt for organic milk compared to $20.05/cwt for conventional.
$898.30
$699.15
$199.15
$1,262.04
$609.36 $652.69
$0
$250
$500
$750
$1,000
$1,250
$1,500
Gross return Total expenses* Net return
Figure 19. Minnesota Average Conventional and Organic Corn Expenses and Returns
per Acre, 2010-2014Conventional (n=8,250) Organic (n=147)
*excludes labor/mgmt. charge and govt. pymtsSource: FINBIN
$4,349.73
$3,838.02
$511.71
$3,453.88
$2,842.40
$611.48
$0
$1,000
$2,000
$3,000
$4,000
$5,000
Gross margin Total expenses* Net return
Figure 20. Minnesota Average Conventional and Organic Dairy Returns and Expenses
per Cow, 2010-2014Conventional (n=2,103) Organic (n=129)
*excludes labor/mgmt. charge and govt. pymtsSource: FINBIN
16
In both 2011 and 2014, well over half of farmers said that premium prices were a major factor in their decision to farm organic, but their responses showed that other factors, such as health/safety, environment/conservation, philosophy/ethics, and personal satisfaction (“I enjoy farming this way”) were even more important to them (Fig. 21).
Organic farming has a reputation for being labor intensive. Table 5 shows the average number of full and part-time employees by type of operation. Crop farms used the least amount of labor. Dairy farms tended to employ more full-time employees, whereas fruit and vegetable operations used more part-time help.
Our surveys also asked farmers about the production challenges they face. In 2014, at least 50 percent of all respondents said the following had been “medium” or “big” problems for them in 2013: extreme weather (80 percent); public confusion about “organic” and/or competition from labels like “natural” (77 percent); cost of fuel (74 percent); weed control (67 percent); cost of health insurance (63 percent); and cost of land – to buy or rent (52 percent).
Table 6 offers more detail, showing the five biggest production challenges each type of farmer reported in both 2011 and in 2014. Some topics, like price of feed for dairy producers and cost of labor for fruit and vegetable producers, remained consistent over time. Many—like extreme weather, the cost of health insurance and weed control—were common to more than one type of organic farm.
Table 5. Organic Farm Labor Use, 2013 (Average number of people who work on the farm, including self, family, hired)
Crop Dairy Fruit Vegetable ALL
Full-time 1.5 2.3 1.2 1.9 1.7
Part-time 1.8 1.7 2.7 3.1 1.9
66%
51%
82%77% 78% 81%
66%68%
52%
86% 85%79% 81%
74%
0%
20%
40%
60%
80%
100%
Price premiums Production costs Health/safety Think organicfood healthier or
higher quality
Environment/conservation
Personalsatisfaction
Philosophy/ethics
Figure 21. Ranked "very important" in decision to farm organic 2011 2014
Source: 2014 MN Organic Farmer Survey
Source: 2014 MN Organic Farmer Surveys
17
Source: 2014 & 2015 MN Organic Farmer Surveys
Table 6. Respondents’ Top 5 Production Challenges (unordered)
Crop Farmers Dairy FarmersFruit & Veg
FarmersVegetableFarmers
Fruit Farmers
2011 2014 2011 2014 2011 2014 2014
Availability of organic seed
Cost of health insurance
Cost of organic seed
Cost of health insurance
Availability or cost of health insurance
Cost of purchased
inputs other than seed and fuel
Extreme weather
Cost of purchased inputs (other than seed
and fuel)
Extreme weather
Competition from imports
Extreme weather
Cost of fuelLand cost
(purchase or rental)
Cost of fuelLand cost
(purchase or rental)
Public confusion about what “organic” means or competition
from labels like “natural”Cost of fuel
Competition from
imports
Public confusion about “organic” & competition
from labels like “natural”
Price of organic feedInsect pests other than
soybean aphidLabor cost
Weed control Weed control
Public confusion about
“organic”/competition
from labels like “natural”
Weed controlInsect pests other than
soybean aphid
Our survey also asked farmers what research topics are most important to organic agriculture in Minnesota (not just to their own operations). In 2014, 90 percent or more said they considered the following topics “moderately” or “very” important: consumer attitudes and behavior (93 percent); economics of organic farming (92 percent); weed management (91 percent); soil health/biology (90 percent); GMO pollen drift (90 percent); yields (90 percent); organic food nutrition (90 percent); and soil fertility (90 percent).
Table 7 provides more detail and shows the top five research topics they rated “very important” in both 2011 and 2014. Soil health, soil fertility, weed management, and GMO pollen drift, were cited over and over again.
Table 7. Respondents’ 5 “Most Important” Research Topics for Minnesota Organic Agriculture (unordered)
Current State and Federal Programs Directed Toward Organic Agriculture
Minnesota Department of Agriculture The MDA has provided dedicated support to organic and prospective organic farmers and handlers since the 1980s. Recent and ongoing offerings and activities include the following. We highlight some of the programs below.
• Minnesota Organic Conference (annual)
• Minnesota Organic Network Listserv
• Organic Certification Cost Share
• Transition to Organic Cost Share
• Directory of Minnesota Organic Farms
• Intro to Organic Processing workshops
• List of USDA-Accredited Certifiers that serve Minnesota
• Organic (farm) Hive Hosts list for Commercial Beekeepers
• DriftwatchTM sensitive crops registry*
• Organic Farm Please Do Not Spray signs
• Sustainable Agriculture Demonstration Grants*
• Value Added Grants*
• Livestock Investment Grants*
• Market Development Assistance*
*Not exclusive to organic, but available to and used by organic operations
Minnesota Organic Conference
Since 2003, MDA staff have coordinated an annual 2-day Minnesota Organic Conference that occurs in early January in St. Cloud. The conference is farmer-focused and includes topics for prospective, beginning, intermediate, and seasoned organic producers. An 80-vendor trade show compliments an educational program with 36 breakout sessions. A list of breakout topics the conference has offered since 2012 is provided in Appendix B. Attendance grew from about 200 attendees in 2003 to 613 in 2016, and there is typically a waiting list for vendors who want booths in the trade show. We require the conference caterer to source organic and Minnesota-grown ingredients, and we tap local, regional, and nationally known presenters, including farmers, university and Extension personnel, nonprofit leaders, and experts from private industry.
Minnesota Organic Network Listserv
The MDA sponsors and administers the Minnesota Organic Network listserv, a 320 member e-mail forum where farmers and others involved in organic production can share information.
Organic Certification Cost Share Program (OCCSP)
In 2000, Minnesota pioneered a program to refund farmers a portion of the cost to obtain organic certification. The idea was picked up at the national level, and was subsequently implemented nationwide. The OCCSP has been funded through the Federal Farm Bill since 2002, with the exception of 2013-14.
The program provides financial relief from the cost of the certification that is required by USDA. Certified organic farmers and handlers can be reimbursed for 75 percent of their certification costs, with a cap of $750 per certificate. This means that a farm certified to produce crops, or a handler certified to process organic products can receive a maximum reimbursement of $750 each year. A farm certified for both crops and livestock can receive up to $1,500. State departments of agriculture administer the funds under written agreements with USDA. MDA staff puts a great deal of effort into publicizing the cost share opportunity in Minnesota and works directly with certifying agencies to make the application process as simple and streamlined for applicants as possible. Participation in Minnesota’s program has increased annually, as shown in Table 8.
In May 2015, we conducted a mail survey of organic farmers in Minnesota to try to determine why more do not apply. We sent a colorful postage-paid tear off reply card survey to 299 farms that had received application materials in the prior year but did not return them. We received 45 responses (15 percent response rate): 2 percent forgot; 29 percent were not certified operations; 9 percent said too much paperwork/not worth the bother; 31 percent said religious/cultural reasons (Amish, for example); 40 percent said they do not accept government payments; 18 percent said they find organic farming profitable, so the payment was not necessary or appropriate. (Note: percentages exceed 100 because respondents were asked to check as many reasons as apply.)
Transition to Organic Cost Share
In 2013, on the advice of the OATF, MDA started a similar cost share program for farmers in transition to organic. The program is designed to encourage transitioning farmers to start working with a certifying agency early in their transition. This way, they have a reliable source of information regarding practices and inputs that are (and are not) allowed, and they can go through one or more “practice” on-farm inspections. The MDA reimburses 75 percent of the cost of hiring the certifying agency, soil testing, and attending an organic conference in Minnesota or a neighboring state. Participation has been low, and we are considering new outreach strategies to increase the number of farmers it serves. We find that it’s difficult to identify farmers who are in transition – they are really not on anybody’s radar screen until they contact a certifying agency and declare their intention to certify. In addition, these farmers may not perceive a benefit to working with (and paying for) a certifier until they are ready to actually certify -- even if 75 percent of the cost is covered.
Several other states have heard about the transition program and contacted our staff to learn more about the program, and North Dakota has replicated it.
Organic Activities by Partner Organizations
University of Minnesota
The U of M has active teaching, research, and extension programs related to organic food and agriculture. The U of M is one of only six land grant universities to receive a perfect rating in the Organic Farming Research Foundation’s 2012 Organic Land Grant Assessment.
The U of M was also identified as a leader in Organic Research and Outreach in the North Central Region published by CERES Trust in February 2015. That report noted that:
Table 8. Organic Cost Share Participation in Minnesota
With more than 1,000 acres used for organic research, a 110-cow certified organic research dairy herd, and two new organic food system undergraduate majors, the University of Minnesota has made a major investment in organic research capacity. The U of M organic research and outreach program involves faculty from agronomy, horticulture, economics, entomology, animal science, veterinary medicine, and food science. The U of M hosts annual organic crop and dairy field days and provides a wide variety of Extension publications, refereed articles, and web resources. The U of M Library has established an innovative database where published organic research papers are archived, described and linked.
The following is a brief overview of University research, extension, and teaching activities related to organic food and agriculture.
Research and Extension
The U of M currently has more than 20 ongoing research and extension projects that focus on organic food and agriculture. Many involve collaboration across disciplines and locations, and most are externally funded.
• Cropping Systems: Current projects focus on a wide range of issues including weed control, cover crops, plant breeding, soil health, insect pest control tillage systems, and a comprehensive extension program on transition to organic production.
• Economics: A recently completed project analyzed enterprise and whole-farm performance of transitioning and recently certified field crop and dairy farms and developed educational materials for transitioning farmers. Enterprise and whole farm financial performance data for organic farms is available from FINBIN.
• Horticultural Systems: Current projects focus on the use of high tunnel systems for season extension in fruit, pepper and berry production; strip tillage for improved soil quality in squash; and biological insect control strategies to improve the production of organic vegetables and fruit.
• Livestock Systems: An active research and extension program at the West Central Research and Outreach Center in Morris, MN focuses on winter housing systems, fly control, grain supplementation strategies, and forage production systems in organic dairy production.
A complete list of current projects is available at www.organicag.umn.edu/research/.
The Southwest Research and Outreach Center in Lamberton, MN hosts two annual field days: Season Extension Day in March and Organic Field Day in July. The West Central Research and Outreach Center in Morris, MN hosts WCROC Organic Dairy Day each August.
Education
The U of M offers two undergraduate majors that give students an opportunity to focus on organic food production: Food Systems and Plant Science. The Food Systems major specifically includes a track on “Organic and Local Food Production.” The University offers two undergraduate minors that give students in other majors a chance to explore aspects of organic food and agriculture: Sustainable Agriculture and Sustainability Studies. The University also offers a graduate minor in Sustainable Agricultural Systems that requires both coursework and an internship specifically related to sustainable agriculture.
Cornercopia, the University’s 2.4 acre student organic farm, gives students opportunities to learn firsthand what it takes to plan, grow, and market organic food through coursework, internships, volunteer work, and other activities. Each year, students produce more than 100 varieties of fruits and vegetables and market them on the Twin Cities campus. While a Student Organic Farm: Planning, Growing, and Marketing course offers students specific training in farm planning for organic production, organic soil management approaches, and adding value to organic produce, students who are not enrolled in this course can work at Cornercopia, too.
A more detailed description of educational programs a listing of course offerings, and additional information on Cornercopia are available at www.organicag.umn.edu/teaching
USDA Natural Resources Conservation Service (NRCS)
The NRCS is the USDA’s principal agency for providing conservation technical assistance to private landowners, conservation districts, Tribes, and other organizations. NRCS draws on a long history of helping people help the land. For 80 years, NRCS and its predecessor agencies have worked in close partnerships with farmers and ranchers, local and state governments, and other federal agencies to maintain healthy and productive working landscapes.
NRCS offers voluntary programs to eligible landowners and agricultural producers to provide financial and technical assistance to help manage natural resources in a sustainable manner. Through these programs the agency provides financial assistance for planning and implementing conservation practices that address natural resource concerns or opportunities to help save energy, improve soil, water, plant, air, animal and related resources on agricultural lands and non-industrial private forestland.
The following NRCS programs offer financial assistance for organic or transitioning producers: The Conservation Stewardship Program (CSP) helps agricultural producers maintain and improve their existing conservation systems and adopt additional conservation activities to address priority resource concerns. Participants earn CSP payments for conservation performance—the higher the performance, the higher the payment. Through CSP, participants can take additional steps to improve the resource conditions on their land including soil, air and habitat quality, water quality and quantity, and energy conservation.
The Environmental Quality Incentives Program (EQIP) provides financial and technical assistance to agricultural producers in order to address natural resource concerns and deliver environmental benefits such as improved water and air quality, conserved ground and surface water, reduced soil erosion and sedimentation, or improved or created wildlife habitat. The EQIP Organic Initiative provides financial assistance to help organic producers address conservation and resource concerns. NRCS encourages organic producers to apply in either the Certified Organic or the Transition to Organic program, but they may apply to any of the agency’s funding categories. Tables 9 and 10 show the EQIP Organic and Transitional funds awarded in Minnesota since 2011.
Tables 9 and 10. NRCS-EQIP Organic Farmer Participation and Funding in Minnesota, 2011-15.
Each year, FSA attends the Minnesota Organic Conference and provides an educational exhibitor booth about FSA services and staff, visiting with attendees about who FSA is and how the agency can help organic producers. For the past two years, FSA has also sent selected staff to attend the regional MOSES Organic Conference in Wisconsin to share information, and to learn as well.
FSA staff have undergone a USDA internal “Organic 101” training. Several staff from county offices and the state office have received additional training on organic from USDA Organic Policy Advisor Betsy Rakola, gaining knowledge and skills that will help them improve the services they provide to organic producers.
FSA has played a vital role in transitioning the next generation of farmers into farming through the loan programs they offer. FSA makes direct and guaranteed operating and farm ownership loans to eligible farmers and ranchers. The number of FSA Direct Farm Ownership loans has dramatically increased over the last three years. The FSA in Minnesota has made 605 Direct Farm Ownership Loans over this period, and more than three quarters of these were to beginning and underserved producers.
Three years ago, FSA introduced a new Direct Operating Microloan program, which is designed for small and beginning farmers. It requires less paperwork and offers expanded eligibility requirements compared to other loans. The program has been very successful and is now being expanded further to include Direct Farm Ownership loans. The FSA in Minnesota made over 440 microloans in the past three years, increasing lending to small and niche farm operations.
The Farm Storage Facility Loan Program (FSFL) provides low interest financing producers can use to build or upgrade storage or handling facilities. In 2015 additional FSFL commodities were added that expand the options for producers. In addition, the Noninsured Crop Disaster Assistance Program (NAP) provides financial assistance to producers of organic and conventionally grown crops that do not qualify for coverage under traditional crop insurance plans. Beginning in 2015, buy-up coverage levels were made available in addition to the basic coverage offered. There is an organic price option available when securing NAP coverage.
USDA Risk Management Agency (RMA)
USDA’s Risk Management Agency (RMA) recognizes organic methods as good farming practices and continues to move forward in improving crop insurance coverage for organic producers and producers transitioning to organic production to make viable and effective risk management options available.
RMA has expanded crop insurance options for organic producers through new and innovative programs, including the Whole-Farm Revenue Protection policy, the contract price option, and price elections that allow farms to protect the market value of their crops more accurately. The cumulative effect of these efforts is a stronger farm safety net for producers and greater options for consumers. On September 9, 2015, RMA announced expansion of the availability of premium price elections for organic crops, now available for 47 crops nationwide, up from 4 crops in 2011 crop year. In 2011, 60 percent of crop farmers reported buying insurance for their organic crops. By 2014, that number had increased to 75 percent. (MDA, 2011; MDA, 2014)
RMA provides educational opportunities through its Risk Management Education & Outreach program (RME). Many of these groups that receive cooperative agreement funds are focused toward organic crop production. In recent years, the program has provided approximately $2 million annually to educational programs nationwide, with $380,000 of that in 2014-2015 going to recipients through the St. Paul RMA Regional Office, which serves Minnesota, Iowa, and Wisconsin. For more information on the RME program, please visit: www.rma.usda.gov/aboutrma/who/aboutrme.html
Each year, RMA employees routinely attend trainings and conferences to both further their knowledge of organic production and to present about current RMA programs that may benefit the organic community. Conferences and training that RMA personnel have attended include:
• Minnesota Organic Conference
• MOSES Organic Conference
• Upper Midwest Fruit & Vegetable Growers Conference
• Wisconsin FAC Organic Meeting
• Minnesota Organic Advisory Task Force
• Organic Field Day at U of M Southwest Research and Outreach Center, Lamberton, MN
• Organic/Whole Farm Revenue Protection Presentation, Iowa City, IA.
• MOSES-sponsored field days
For more information on risk management tools available for organic farmers, see the RMA Organic Crops website at: www.rma.usda.gov/news/currentissues/organics/. Crop insurance is sold and delivered solely through private crop insurance agents. To learn more about RMA, crop insurance and the modern farm safety net, please visit the RMA website at: www.rma.usda.gov
Recommendations
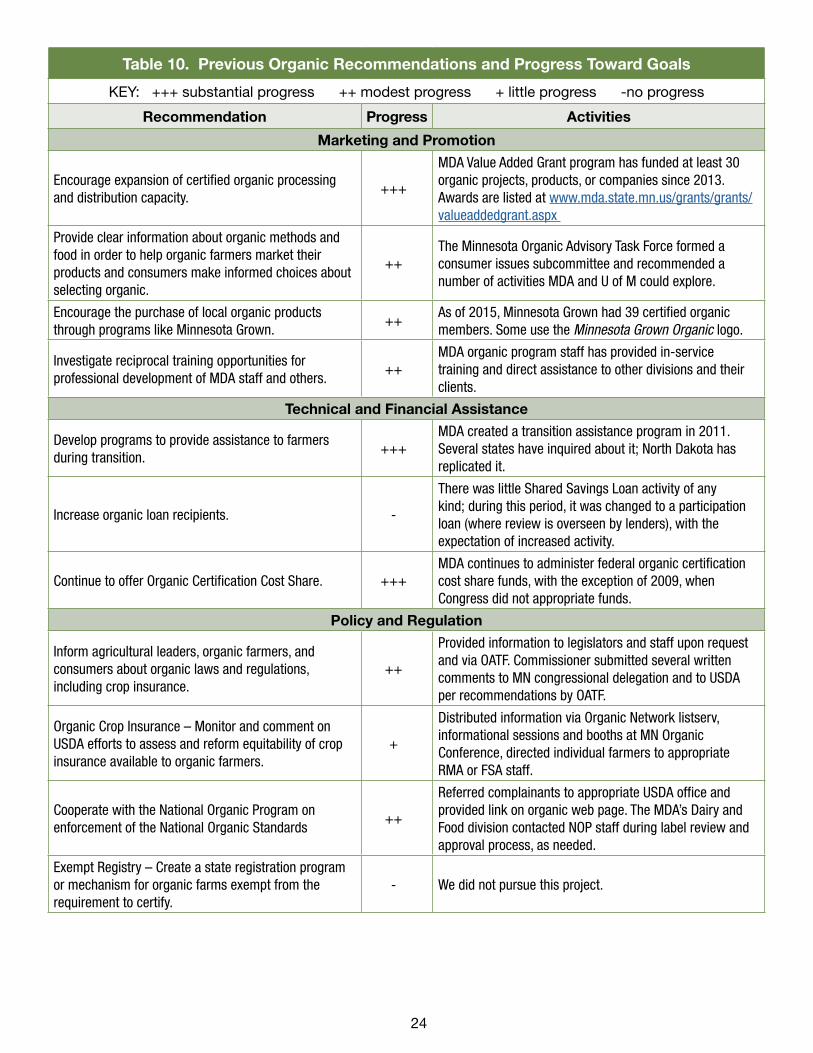
Previous Recommendations – Progress Toward GoalsThe table below reflects activity and progress on recommendations contained in the 2010 Status of Organic Agriculture in Minnesota report.
Table 10. Previous Organic Recommendations and Progress Toward Goals
Continue MN Organic Conference, farmer and buyer directories.
++
Minnesota Organic Conference (MOC) attendance increases each year. The MDA publishes Directory of MN Organic Farms bi-annually. U of M has not updated 2010 Organic Buyers Directory.
Continue Organic Farm Business Management Program.
+Federal funding ended several years ago. Some organic farmers still participate in FBM and report data to FINBIN database (www.finbin.umn.edu)
Investigate and quantify environmental consequences of organic farming. Develop management practices that mitigate negative consequences; promote environmentally sustainable organic practices.
++MDA funded 12 or more Sustainable Agriculture Demonstration Grant projects on organic farms between 2011 and 2015.
Increase outreach to nontraditional farmers. +
MDA Ag Marketing and Development Division has increased its outreach to and interaction with nontraditional, (including immigrant) farmers. Most assistance has been in the areas of beginning farmer issues, land access, and integrated pest management.
Encourage expansion of certified organic processing and distribution capacity.
+++
MDA Value Added Grant program has funded at least 30 organic projects, products, or companies since 2013. Awards are listed at www.mda.state.mn.us/grants/grants/valueaddedgrant.aspx
Provide clear information about organic methods and food in order to help organic farmers market their products and consumers make informed choices about selecting organic.
++The Minnesota Organic Advisory Task Force formed a consumer issues subcommittee and recommended a number of activities MDA and U of M could explore.
Encourage the purchase of local organic products through programs like Minnesota Grown.
++As of 2015, Minnesota Grown had 39 certified organic members. Some use the Minnesota Grown Organic logo.
Investigate reciprocal training opportunities for professional development of MDA staff and others.
++MDA organic program staff has provided in-service training and direct assistance to other divisions and their clients.
Technical and Financial Assistance
Develop programs to provide assistance to farmers during transition.
+++MDA created a transition assistance program in 2011. Several states have inquired about it; North Dakota has replicated it.
Increase organic loan recipients. -
There was little Shared Savings Loan activity of any kind; during this period, it was changed to a participation loan (where review is overseen by lenders), with the expectation of increased activity.
Continue to offer Organic Certification Cost Share. +++MDA continues to administer federal organic certification cost share funds, with the exception of 2009, when Congress did not appropriate funds.
Policy and Regulation
Inform agricultural leaders, organic farmers, and consumers about organic laws and regulations, including crop insurance.
++
Provided information to legislators and staff upon request and via OATF. Commissioner submitted several written comments to MN congressional delegation and to USDA per recommendations by OATF.
Organic Crop Insurance – Monitor and comment on USDA efforts to assess and reform equitability of crop insurance available to organic farmers.
+
Distributed information via Organic Network listserv, informational sessions and booths at MN Organic Conference, directed individual farmers to appropriate RMA or FSA staff.
Cooperate with the National Organic Program on enforcement of the National Organic Standards
++
Referred complainants to appropriate USDA office and provided link on organic web page. The MDA’s Dairy and Food division contacted NOP staff during label review and approval process, as needed.
Exempt Registry – Create a state registration program or mechanism for organic farms exempt from the requirement to certify.
Help organic farmers protect the integrity of organic crops and livestock with regard to spray drift. Offer no-spray signs, a sensitive crops registry, and clear avenues for reporting drift.
+++
Distributed 800+ organic signs. Implemented DriftwatchTM sensitive crops registry www.driftwatch.org. Provided educational sessions about drift law and reporting at MOC. Reminded growers seasonally of pesticide drift hotline.
Research
Identify and share organic farmers’ research needs. ++Conducted organic farmer surveys. Shared information with U of M faculty through OATF and to others, like ERS, upon request.
Investigate research questions germane to organic production and handling, guided by stakeholder interests, needs, and priorities.
+++
U of M obtained state, federal, and private funding for numerous organic research/outreach projects involving crops, soils, horticulture, animal and veterinary science, entomology, economics, and food science. See: www.organicag.umn.edu/research.
Current RecommendationsThe MDA recommends that we, the U of M, and other partners in the state undertake a number of efforts to support and expand the growth of Minnesota’s organic agriculture sector and the interests of producers, value added businesses, consumers and associated services it comprises. These recommendations are based on input contributed by the Minnesota OATF, survey responses by organic farmer stakeholders, the experiences of organizational partners, and other direct input to MDA from the organic community.
Programs
Continue to provide reliable, unbiased information to organic and prospective organic producers and handlers, consumers, and other stakeholders, referring them to other partners as appropriate.
In collaboration with partners, monitor organic/prospective organic producers’ information needs and deliver programs like the Minnesota Organic Conference, stand-alone workshops, and field days.
Facilitate connections between organic farmers and organic food companies. Help both identify and pursue domestic and international marketing opportunities.
Continue to administer federal organic certification cost share funds and expand transition to organic cost share program (NOTE: will require additional funding).
Continue statutory responsibility to investigate and respond to pesticide drift complaints. Provide collateral materials like Please Do Not Spray signs and services such as the DriftwatchTM registry that help organic producers make applicators aware of their status.
Ensure that organic producers and organic companies know about their eligibility for MDA programs like the Value Added Grant Program, Livestock Investment Grant Program, Sustainable Agriculture Demonstration Grant Program, Specialty Crop Block Grant Program, and loans.
Promote networking within the organic community by maintaining the MDA Organic Network Listserv.
Encourage colleges in the Minnesota State and Colleges & Universities system to include organic topics in their applied agriculture curricula.
Enhance undergraduate and graduate organic curricula at the U of M – both in and beyond the Colleges of Food, Agriculture, and Natural Resource Science and Veterinary Medicine. Continue to offer hands-on organic learning opportunities such the U of M student organic farm and graduate assistantships.
Policy & Regulatory Support
Keep Minnesota agricultural leaders, organic farmers, and consumers informed about proposed changes to organic laws and regulations that could affect them, and comment as appropriate.
Monitor labeling claims such as “Non-GMO” and “Natural,” considering organic producer, processor, and consumer interests.
Review adequacy of liability insurance requirements for pesticide applicators.
Consider prohibiting pesticide application on roadsides and rights of way that adjoin certified organic land when requested by the organic farm operator, provided that a noxious weed management plan is in place.
Research
Continue support for both long-term and short-term organic cropping systems research at the U of M Southwest Research and Outreach Center and for organic dairy research at the West Central Research and Outreach Center.
Pursue applied research in areas that are high priority for organic producers, including: crop and livestock breeding for organic systems; soil health and fertility; weed management; insect pest management; physical and economic implications of GMO pollen drift; food safety protocols that comply with organic standards; nutritional composition of organic foods; barriers to adoption (transition); and organic farm profitability.
Regularly interact with MN OATF members, organic farmers, and organic handlers to learn about emerging research and information needs. Actively engage organic farmers (or handlers, as appropriate) in designing and carrying out experiments and outreach.
Ensure that researchers who have organic interests know about legislatively-funded research opportunities administered by the MDA (e.g., Crop Research Grants, Agriculture Research, Education, Extension and Technology Transfer Program, and Sustainable Agriculture Demonstration Grants).
Glean information on organic trends within and outside Minnesota from public and private data sources, and share this information and opportunities with stakeholders and partners.
References
Agricultural Marketing Service. 2016. National organic grain and feedstuffs - bi-weekly. USDA. Greeley, CO. www.ams.usda.gov/market-news/organic-market-news-reports
Agricultural Marketing Service. 2016b. Research and Promotion. USDA. Washington, DC. www.ams.usda.gov/rules-regulations/research-promotion
Bunge, Jacob and Annie Gasparro. 2015. Organic vs non-GMO labels. Who’s Winning? Organic and non-GMO companies push for prominence – and meaning for their labels. Wall Street Journal, Dec. 8. New York, NY.
The Ceres Trust. 2015. Organic research and outreach in the north central region – Feb. 2015. Chicago, IL. http://cerestrust.org/organic-research-outreach-north-central-feb-2015/
Crawford, Elizabeth. 2014. Who buys organic and where they buy it is evolving. Food Navigator. William Reed
Food Navigator. 2016. Natural claims. William Reed Business Media, Montpelier, France. http://www.foodnavigator-usa.com/Trends/Natural-claims
Foreign Agricultural Service. 2016. Global Agricultural Trade System Online. USDA. Washington, D.C. http://apps.fas.usda.gov/gats
The Hartman Group. 2014. Organic usage: will the numbers change in 2014? http://www.hartman-group.com/acumenPdfs/organic-usage-infographic-2014-05-08.pdf
The Hartman Group. 2014b. Who buys organic? http://www.hartman-group.com/hartbeat-acumen/76/who-buys-organic
The Hartman Group. 2015. Profile of organic users. http://hartbeat.hartman-group.com/acumenPdfs/organic-consumer-profile-2015-08-30.pdf
Minnesota Organic Advisory Task Force. 2013, 2014, 2015. Meeting minutes. Minnesota Department of Agriculture. St. Paul, MN. www.mda.state.mn.us/organic
Mintel, 2015. Organic food and beverage shoppers - US - March 2015. Chicago, IL. www.mintel.com
National Agriculture Statistics Service. 2012. 2011 certified organic production survey. USDA. Washington, DC. http://sustainableagriculture.net/wp-content/uploads/2012/10/USDA-2011-Organic-Production-Survey.pdf
National Organic Program. 2016. 2015 count of United States certified organic operations by state or territory. Agricultural Marketing Service. USDA. Washington, D.C. www.ams.usda.gov/sites/default/files/media/USDA_Certified_Organic_Operations_by_State.pdf
National Organic Program. 2016. Data history. Organic INTEGRITY database. Agricultural Marketing Service. USDA. Washington, DC. https://apps.ams.usda.gov/Integrity/Reports/DataHistory.aspx
Organic Farming Research Foundation. 2012. 2012 Organic land grant university assessment. Santa Cruz, CA. http://ofrf.org/sites/ofrf.org/files/docs/pdf/2012-LandGrantAssessment-forscreen.pdf
Organic Trade Association. 2015b.There’s more to organic than meets the eye. Washington, D.C. http://ota.com/sites/default/files/indexed_files/StateOfOrganicIndustry_0.pdf
Roseboro, Ken. 2013. Will non-GMO compete with or complement organic? The Organic & Non-GMO Report. May 31. Evergreen Publishing, Inc. Fairfield, IA.
Roseboro, Ken. 2015. Is non-GMO hurting organic? The Organic & Non-GMO Report. May 31. Evergreen Publishing, Inc. Fairfield, IA.
Willer, Helga and Julia Lernoud. 2015. The world of organic agriculture 2015: Summary. In The world of organic agriculture - statistics & emerging trends 2015. Research Institute of Organic Agriculture (FiBL). Frick, Switzerland and International Federation of Organic Agriculture Movements. Bonn, Germany. www.organic-world.net/yearbook-2015.html
Appendix B. Minnesota Organic Conference Educational Breakout Sessions 2012-16
Appendix C. Minnesota Organic Legislative History
29
2014 Minnesota Organic Farmer Survey March 2014
Dear Organic Grower:
Every couple of years, the Minnesota Department of Agriculture surveys organic farmers to learn about how organic agriculture is developing in Minnesota and what organic farmers need. You can see results of recent surveys at www.mda.state.mn.us/organic.
This year, we are asking 27 questions about you, your operation, and your opinions. Please return one survey per farm in the enclosed envelope before April 15, 2014. If a question does not apply, just leave it blank. If you have questions or you are not a certified organic grower and want to be removed from our mailing list, please call Meg at 651-201-6616. The survey is voluntary and all individual responses will remain confidential. Thanks for your help.
1. How old were you on December 31, 2013? ______ years
2. Mark which applies:
� a. Entire operation certified organic � b. Some certified organic, some in transition � c. Split operation: certified organic & conventional
� d. Organic, exempt from certification � e. Does not apply: I am not/no longer organic
3. How many years have you operated a farm? ______
4. How many years have you farmed certified organic? ______
5. Name of current certifying agency(ies):______________________________________
6. How did you start farming organic?
� a. Started out as conventional and transitioned to organic � b. Have always farmed organically � c. Other ____________________________________________________
7. What was your primary organic farming enterprise in 2013? (mark only ONE)
� a. Cash crop (grains, oilseeds, and/or hay, etc.) i. Food grade ii. Feed grade iii. Both � b. Dairy � c. Other livestock (including beef, poultry, sheep, goats, etc.) � d. Vegetables � e. Fruit � f. Other: ___________________________________________________________________________
8. Last year (2013) did you:
� a. Increase organic acreage or livestock numbers � b. Decrease organic acreage or livestock numbers � c. Maintain current organic acreage or livestock numbers
9. During the next five years, do you intend to:
� a. Increase organic acreage or livestock numbers � b. Decrease organic acreage or livestock numbers � c. Maintain current organic acreage or livestock numbers
625 Robert Street North, St. Paul, MN 55155-2538www.mda.state.mn.us
10. In your experience, how do the production costs of organic farming compare with conventional?
� a. Organic costs are higher b. They are about the same c. Organic costs are lower
11. In your experience, how does the profitability of organic farming compare with conventional?
� a. Organic is more profitable b. They are about the same c. Organic is less profitable
12. Do you buy crop insurance for your organic production? Yes No
13. How many people (incl. self, family, hired labor) work on the farm? a. Full-time: ______ b. Part-time: ______
14. Do you think you or a family member will be farming… a. In 5 years? Yes No
b. In 10 years? Yes No
c. In 20 years? Yes No
15. How important are the following in YOUR decision to farm organically? Not Slightly Very Important Important Important
a. Price premiums .............................................................................. ...................... ......................
b. Production costs ............................................................................ ...................... ......................
c. Health/safety (self, family, farm employees) ................................... ...................... ......................
d. Think organic food is healthier or higher quality ............................. ...................... ......................
e. Environmental/conservation reasons ............................................. ...................... ......................
f. Personal satisfaction - I enjoy farming this way ............................. ...................... ......................
g. Philosophical/ethical reasons ........................................................ ...................... ......................
h. Other (explain) __________________________________________________________________
16. How important are the following research topics to organic agriculture in Minnesota? Not Slightly Moderately Very No Important Important Important Important Opinion
a. Consumer attitudes/behavior ................................................ .................. .................. ...............
b. Economics of organic farming ............................................... .................. .................. ...............
c. GMO pollen drift .................................................................... .................. .................. ...............
d. Insect pests and pest management ...................................... .................. .................. ...............
e. Livestock health ..................................................................... .................. .................. ...............
f. Milk quality ............................................................................ .................. .................. ...............
g. Organic crop/livestock marketing.......................................... .................. .................. ...............
h. Organic food quality/safety studies ....................................... .................. .................. ...............
i. Organic food nutrition studies ............................................... .................. .................. ...............
j. Organic seed breeding/variety development ........................ .................. .................. ...............
k. Organic variety trials .............................................................. .................. .................. ...............
l. Plant diseases ....................................................................... .................. .................. ...............
m. Soil fertility ............................................................................. .................. .................. ...............
n. Soil health/biology ................................................................. .................. .................. ...............
o. Strategies for adapting to climate change ............................ .................. .................. ...............
p. Transition to organic (best practices) ................................... .................. .................. ...............
r. Yields/production .................................................................. .................. .................. ...............
s. Other (explain) _____________________________________________________________________
31
17. Last year (2013), how big a challenge were the following issues for you? Not a Slightly Medium Big Doesn’t Problem Problem Problem Problem Apply
a. Organic seed availability ........................................................ .................. .................. ...............
b. Organic seed price ................................................................ .................. .................. ...............
c. Organic feed availability ......................................................... .................. .................. ...............
d. Organic feed price ................................................................. .................. .................. ...............
e. Cost of fuel............................................................................. .................. .................. ...............
f. GMO pollen drift .................................................................... .................. .................. ...............
g. Herbicide/pesticide drift ....................................................... .................. .................. ...............
h. Soybean aphid ....................................................................... .................. .................. ...............
i. Other insect pests (other than soybean aphid) ...................... .................. .................. ...............
j. Weed control .......................................................................... .................. .................. ...............
k. Extreme weather .................................................................... .................. .................. ...............
l. Labor availability .................................................................... .................. .................. ...............
m. Labor cost .............................................................................. .................. .................. ...............
n. Land cost (purchase price or rental rates) ............................. .................. .................. ...............
o. Availability of organic processing ......................................... .................. .................. ...............
p. Transportation for organic crops or livestock ....................... .................. .................. ...............
q. Cost of health insurance ........................................................ .................. .................. ...............
r. Cost of organic certification .................................................. .................. .................. ...............
s. Competition from organic imports ........................................ .................. .................. ...............
t. Public confusion about what “organic” means ..................... .................. .................. ...............
or competition from labels like “natural”
u. Other: __________________________________________________________________________
18. In 2013, what was your total gross annual income from all farming?
� a. Less than $50,000 � b. $50,001-$100,000
� c. $100,001-$250,000 � d. $250,001-$500,000
� e. $500,001-$1,000,000 � f. Over $1,000,000
19. In 2013, what % of this gross annual farm income came from the sale of organic products? _______%
20. Did you sell any certified organic product as conventional or non-GMO in 2013?
� a. Yes, sold some certified organic production as conventional � b. Yes, sold some certified organic production as non-GMO � c. No, sold all certified organic as organic
21. What kind of marketing help do you or would you find most useful? (check all that apply)
� a. Grower directories � b. Buyer directories � c. Seminars to improve marketing skills
� d. Business planning/business development � e. Local or state events where I can meet buyers � f. International trade missions
� g. Other _______________________________________________________________________
32
22. How interested are you in using the following markets for your organic production during the next 5 years?
Already Not Slightly Moderately Very Use this Market Interested Interested Interested Interested
• Authorizes the commissioner to designate organizations located in the state to certify organic products in the state.
• Authorizes the commissioner to set certification fees charged to organic producers.
• Requires certification organization to provide certification to a person whose production meets certification standards and who has paid membership dues and certification fees.
• Allows certification organizations to draft rules for implementation of the organic certification program for submission to the commissioner.
• Appropriates $100,000 for a grant to a certification organization for start-up and initial administrative costs.
• Appropriates $50,000 to the Department to administer and enforce the organic food law.
• Appropriates $100,000 for a grant to a certification organization to continue the certification process authorized above.
1990 Minnesota Session Laws Chapter 547 §§ 3-4
• Allows the commissioner to designate certification organizations outside Minnesota to certify organic products in the state.
• Removes the commissioner’s authority to set certification fees.
• Removes the requirement to pay membership dues as a certification requirement.
• Requires that Minnesota grown organic products must be certified by a designated certification organization in order to be labeled “certified.”
• Requires that certified organic products sold in the state must be certified by a designated certification organization or by a certification organization approved by the commissioner
• Establishes the Minnesota Organic Advisory Task Force.
• Requires the commissioner to seek evaluation and recommendation of the task force before approving certification organizations.
• Appropriates $50,000 per year to the Department for annual organic certification cost share payments to farmers and for organic market and program development.
• Adds two organic farmers to both the sustainable agriculture grant review panel and the shared savings loan review panel.
• Expands the duties of the commissioner to promote opportunities for organic agriculture by surveying producers to assess research and information needs, demonstrate organic practices, coordinate department organic activities with other state agencies and the University, and report on the status of organic agriculture on a biennial basis.
• Specifies membership categories for the commissioner’s Organic Advisory Task Force and extends the task force expiration date to June 30, 2003.
2003 Minnesota Session Laws Chapter 107 §§ 15-19
• Adopts federal organic standards and rules as the organic food production law and rules of Minnesota.
• Brings state organic statutes into conformity with federal law by repealing any existing state laws that conflict with federal law.
• Retains current agency duties and strengthens the agency’s ability to provide technical, financial, and marketing services to support organic farmers and the organic industry.
• Requires the agency to report on economic and health aspects of organic farming.
• Authorizes the agency to register state organic production and handling operations, and certification agents operating in the state.
• Expands the commissioner’s Organic Advisory Task Force to better reflect the organic food industry by adding one more organic food processor representative, one more representative of the organic food wholesaler/retailer/distributor sector, and a representative of the USDA
• Reauthorizes the Organic Advisory Task Force until June 30, 2005.
2005 Minnesota Session Laws 2005, First Special Session, Chapter 1 § 61
• Reauthorizes the Organic Advisory Task Force until June 30, 2009.
2007 Minnesota Session Laws 2007, Chapter 45 § 3
• Appropriates $100,000 per year to the Department for annual organic certification cost share payments to farmers and processors with a payment rate of 2/3 of the cost of certification, not to exceed $350, with any excess appropriation for organic market and program development.
• Limits eligibility to receive state organic cost share reimbursement to five years.
• Appropriates $100,000 per year to the Department for annual organic certification cost share payments to farmers and processors with a payment rate of 2/3 of the cost of certification, not to exceed $350, with $15,000 for organic market and program development.
• Limits eligibility to receive state organic cost share reimbursement to five years.
2009 Minnesota Session Laws 2009, Chapter 94 § 3
• Appropriates $10,000 per year to the Department for annual organic certification cost share payments to farmers and processors who do not receive federal cost share payments. Specifies a payment rate of 2/3 of the cost of certification, not to exceed $350, with any excess appropriation for organic market and program development.
• Limits eligibility to receive state organic cost share reimbursement to five years.
38
• Authorizes the use of vouchers for the purchase of cost-neutral organic WIC allowable food.
• Expands the Organic Advisory Task Force’s charge to advise the U of M
• Revises the composition of the Organic Advisory Task Force with a total of 15 members to serve staggered terms.
• Reauthorizes the Organic Advisory Task Force until June 30, 2013.
• Appropriates funds for the U of M College of Food, Agricultural, and Natural Resource Sciences to establish and lead organic research, education and outreach in a number of areas and identifies organic crop and livestock research as a priority research area.
• Appropriates $10,000 per year to the Department for annual organic certification cost share payments to farmers and processors who do not receive federal cost share payments. Specifies a payment rate of 2/3 of the cost of certification, not to exceed $350, with a limit of five years. Allows any excess appropriation to be spent for organic market and program development, producer education, transition support, or sustainable agriculture demonstration grants.
• Amends Minn. Stat. 2010, § 12A.04 to specify that state appropriations for disaster assistance to producers may be used for organic certification assistance.
• Amends the required contents and changes frequency of reporting to the Legislature on the status of organic agriculture in Minnesota.
• Appropriates funds for the U of M College of Food, Agricultural, and Natural Resource Sciences to establish and lead organic research, education and outreach in a number of areas and identifies organic crop and livestock research as a priority research area.
• Authorizes the commissioner to use funds appropriated in this subdivision for annual organic certification cost share payments of 75 percent of the cost of certification or $750, whichever is less.
• Authorizes commissioner to allocate funds appropriated in this subdivision for organic market and program development, including organic producer education efforts, assistance for persons transitioning from conventional to organic agriculture, or sustainable agriculture demonstration grants.
• Establishes three year terms for Organic Advisory Task Force Members.
• Reauthorizes the Organic Advisory Task Force until June 30, 2016.
2015 Minnesota Session Laws Chapter 4 §2 Subd. 3 and §56, Subd. 2 and Chapter 69 §5 Subd. 4 (a)(3) and Subd. 4 (a)(4)(xiii)
• Authorizes the commissioner to use funds appropriated in this subdivision for annual organic certification cost share payments to resident farmers and handlers or to assist people transitioning from conventional to organic agriculture.
• Requires the commissioner to consult with an advisory panel that includes a person representing organic or sustainable agriculture when awarding grants as part of the Agriculture Research, Education, Extension, and Technology Transfer Program.
• Appropriates funds for the U of M College of Food, Agricultural, and Natural Resource Sciences to establish and lead organic research, education and outreach in a number of areas and identifies organic crop and livestock research as a priority research area.