27
Stay informed 2012 Financial Reporting Survey Energy industry current trends in SEC reporting February 2013 cover
| Date post: | 20-Aug-2015 |
| Category: |
Economy & Finance |
| Upload: | pwc |
| View: | 241 times |
| Download: | 0 times |

Stay informed 2012 Financial Reporting SurveyEnergy industry current trends in SEC reportingFebruary 2013
cover
Stay informed | 2012 Financial Reporting Survey
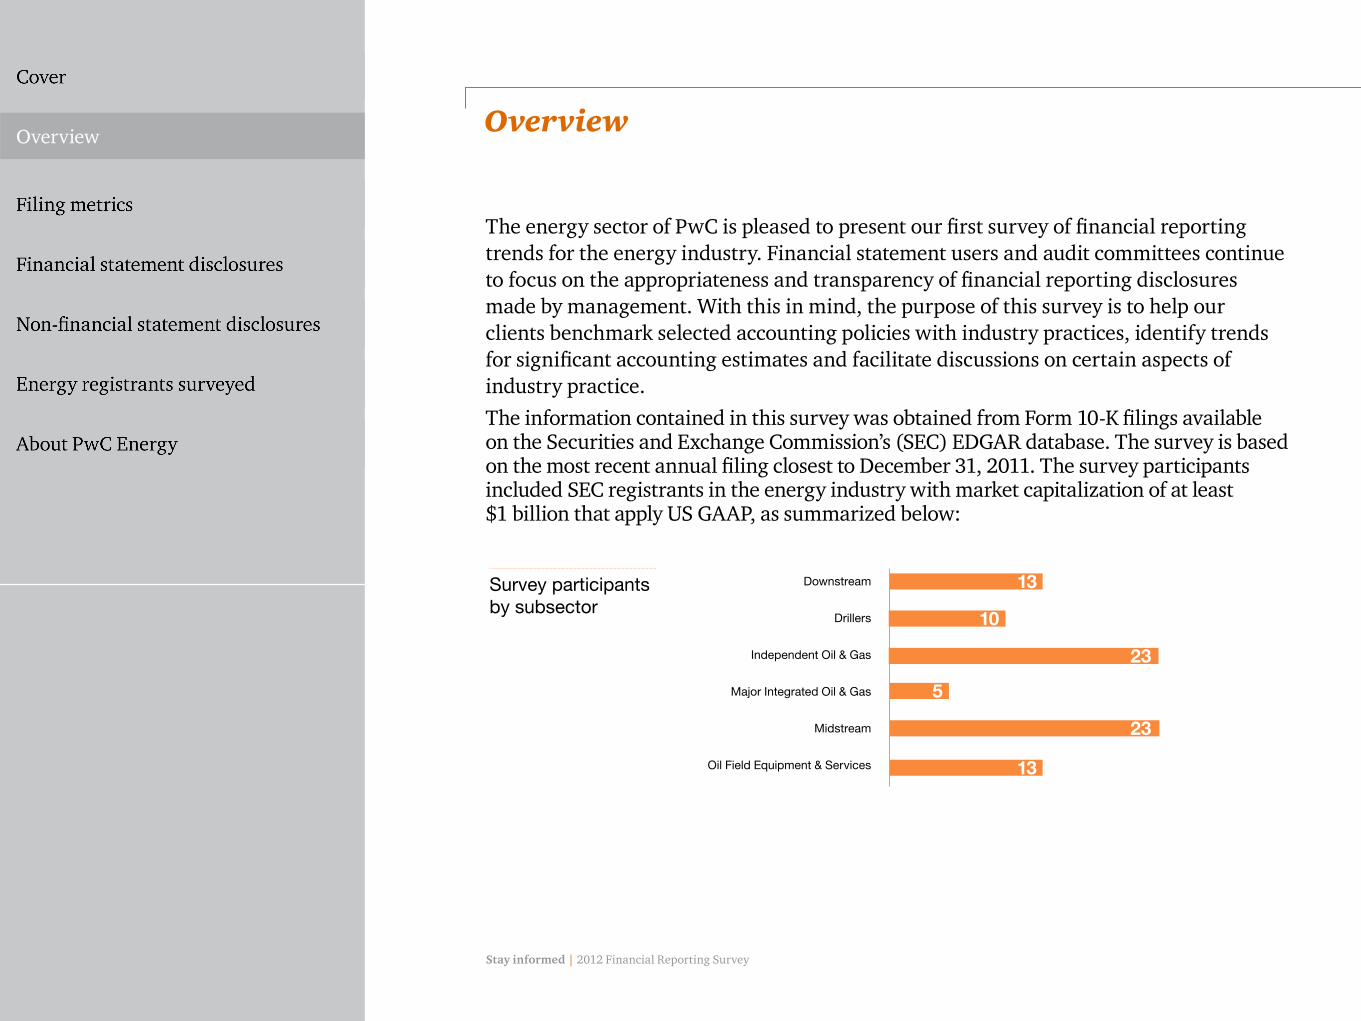
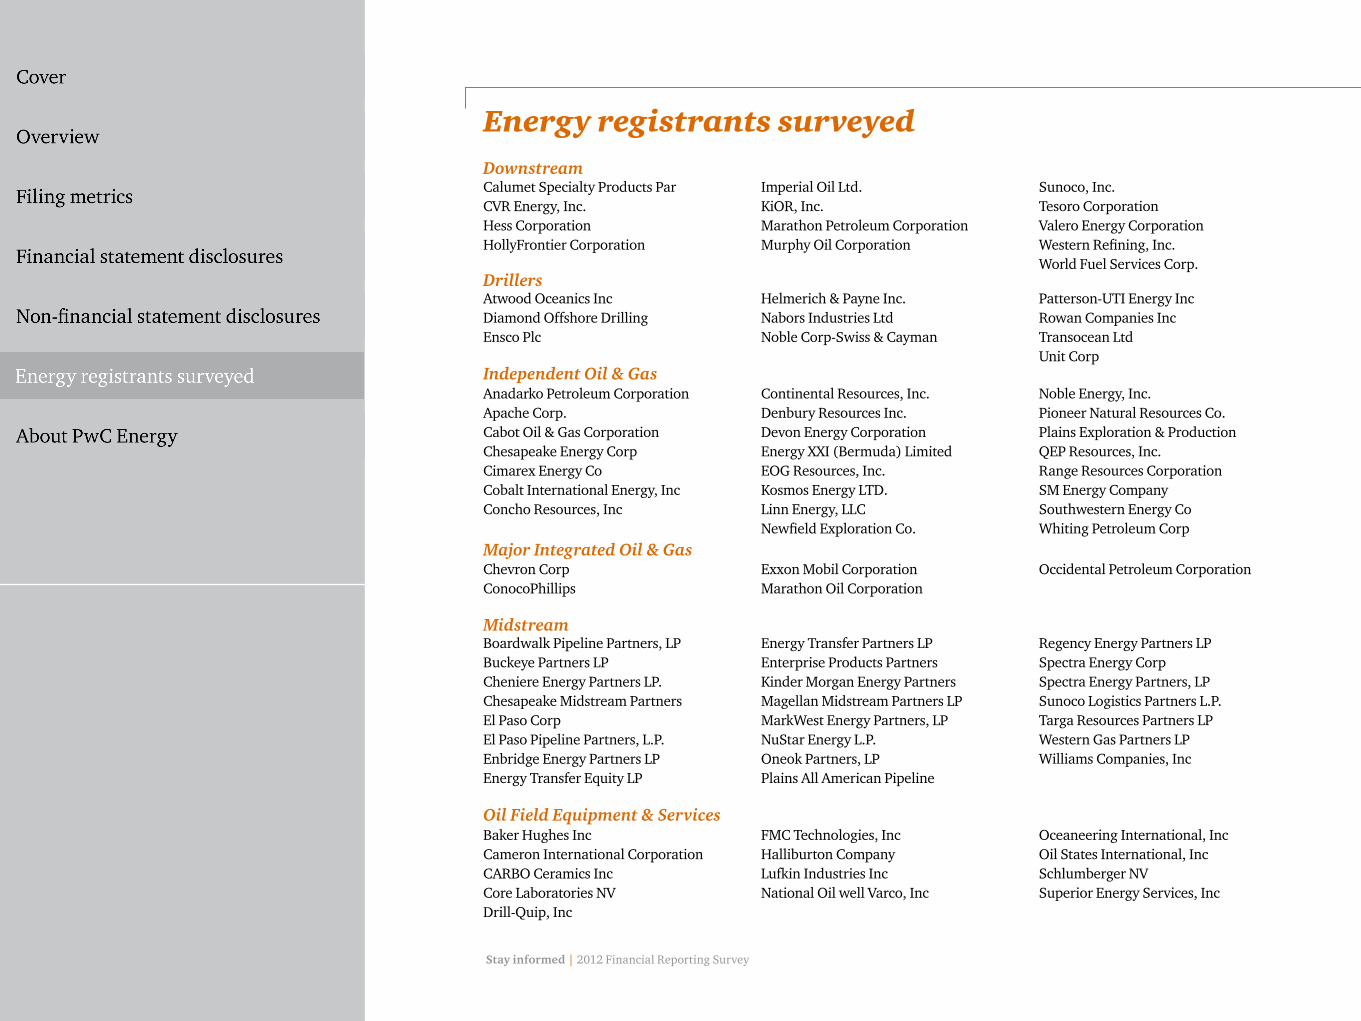
The energy sector of PwC is pleased to present our first survey of financial reporting trends for the energy industry. Financial statement users and audit committees continue to focus on the appropriateness and transparency of financial reporting disclosures made by management. With this in mind, the purpose of this survey is to help our clients benchmark selected accounting policies with industry practices, identify trends for significant accounting estimates and facilitate discussions on certain aspects of industry practice. The information contained in this survey was obtained from Form 10-K filings available on the Securities and Exchange Commission’s (SEC) EDGAR database. The survey is based on the most recent annual filing closest to December 31, 2011. The survey participants included SEC registrants in the energy industry with market capitalization of at least $1 billion that apply US GAAP, as summarized below:
Overview
overview 1
Overview
Survey participants by subsector
Downstream
Drillers
Independent Oil & Gas
Major Integrated Oil & Gas
Midstream
Oil Field Equipment & Services
13
13
23
23
5
10

Stay informed | 2012 Financial Reporting Survey
Days to fileThe deadlines for filing the Form 10-K depend on a registrant’s filing status and days to file can be a key metric for registrants to evaluate their financial reporting process and timing against peers. The number of days to file was also impacted by the requirement for all domestic regis-trants to implement XBRL tagging for 2011 annual financial reporting. Many filers
experienced difficulties and delays with current XBRL tagging requirements, includ-ing the need to finalize annual filings 48 hours prior to the planned EDGAR filing to allow time for third-party service providers to complete tagging. Of the registrants in-cluded in our survey, two, both independent oil and gas registrants, elected a hardship exemption under Rules 201 and 202 of Regulation S-T for XBRL tagging.
Filing metrics
Days to file 2011 annual filings
2011 Annual filings-days to file
Maximum
Average
Minimum
Downstream
Acc
eler
ated
filer
Larg
e ac
cele
rate
d f
iler
No
n-ac
cele
rate
dfil
er
Downstream
Drillers
Independent Oil & Gas
Major IntegratedOil & Gas
Midstream
Downstream
Independent Oil & Gas
Oil Field Equipment& Services
Midstream
606060
6058
55
6058
54
6054
41
6054
40
6055
52
7357
48
6053
32
86
61
6161
8686
*
*Registrant filed a Form 12b-25, Notification of Late Filing
Stay informed | 2012 Financial Reporting Survey
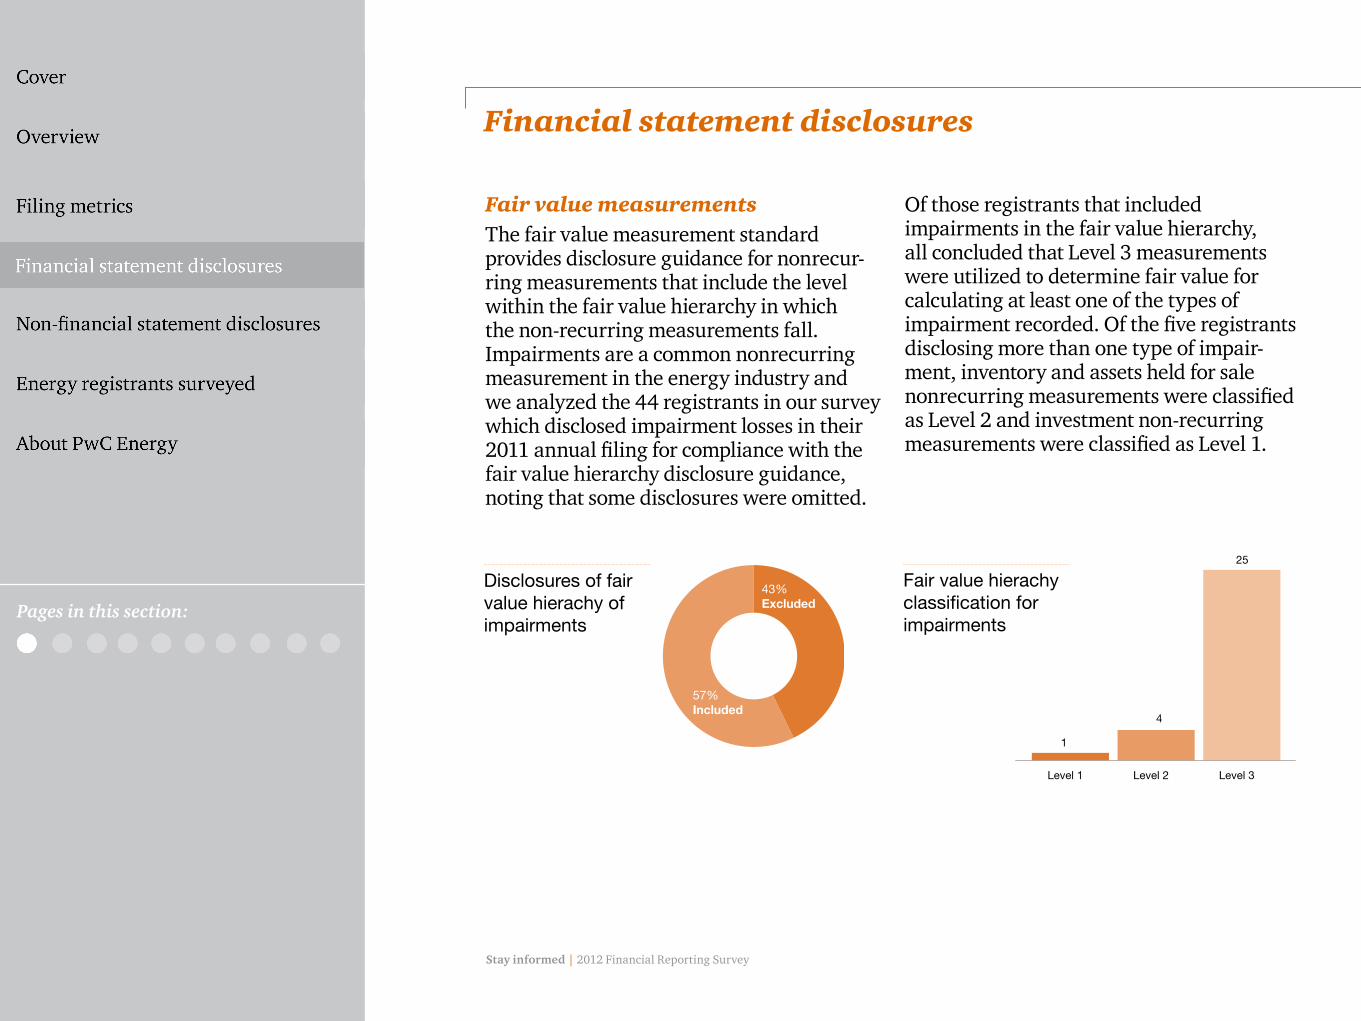
Fair value measurementsThe fair value measurement standard provides disclosure guidance for nonrecur-ring measurements that include the level within the fair value hierarchy in which the non-recurring measurements fall. Impairments are a common nonrecurring measurement in the energy industry and we analyzed the 44 registrants in our survey which disclosed impairment losses in their 2011 annual filing for compliance with the fair value hierarchy disclosure guidance, noting that some disclosures were omitted.
Of those registrants that included impairments in the fair value hierarchy, all concluded that Level 3 measurements were utilized to determine fair value for calculating at least one of the types of impairment recorded. Of the five registrants disclosing more than one type of impair-ment, inventory and assets held for sale nonrecurring measurements were classified as Level 2 and investment non-recurring measurements were classified as Level 1.
Financial statement disclosures
Disclosures of fair value hierachy of impairments
Pages in this section:
About PwC Energy
Energy registrants surveyed
Non-financial statement disclosures
Filing metrics
Disclosure of fair value hierarchy for impairments
43%Excluded
57%Included
Fair value hierachy classification for impairments
Fair value hierarchy classification-impairments
Level 1 Level 2 Level 3
1
4
25
Stay informed | 2012 Financial Reporting Survey
Pages in this section:
About PwC Energy
Energy registrants surveyed
Non-financial statement disclosures
Filing metrics
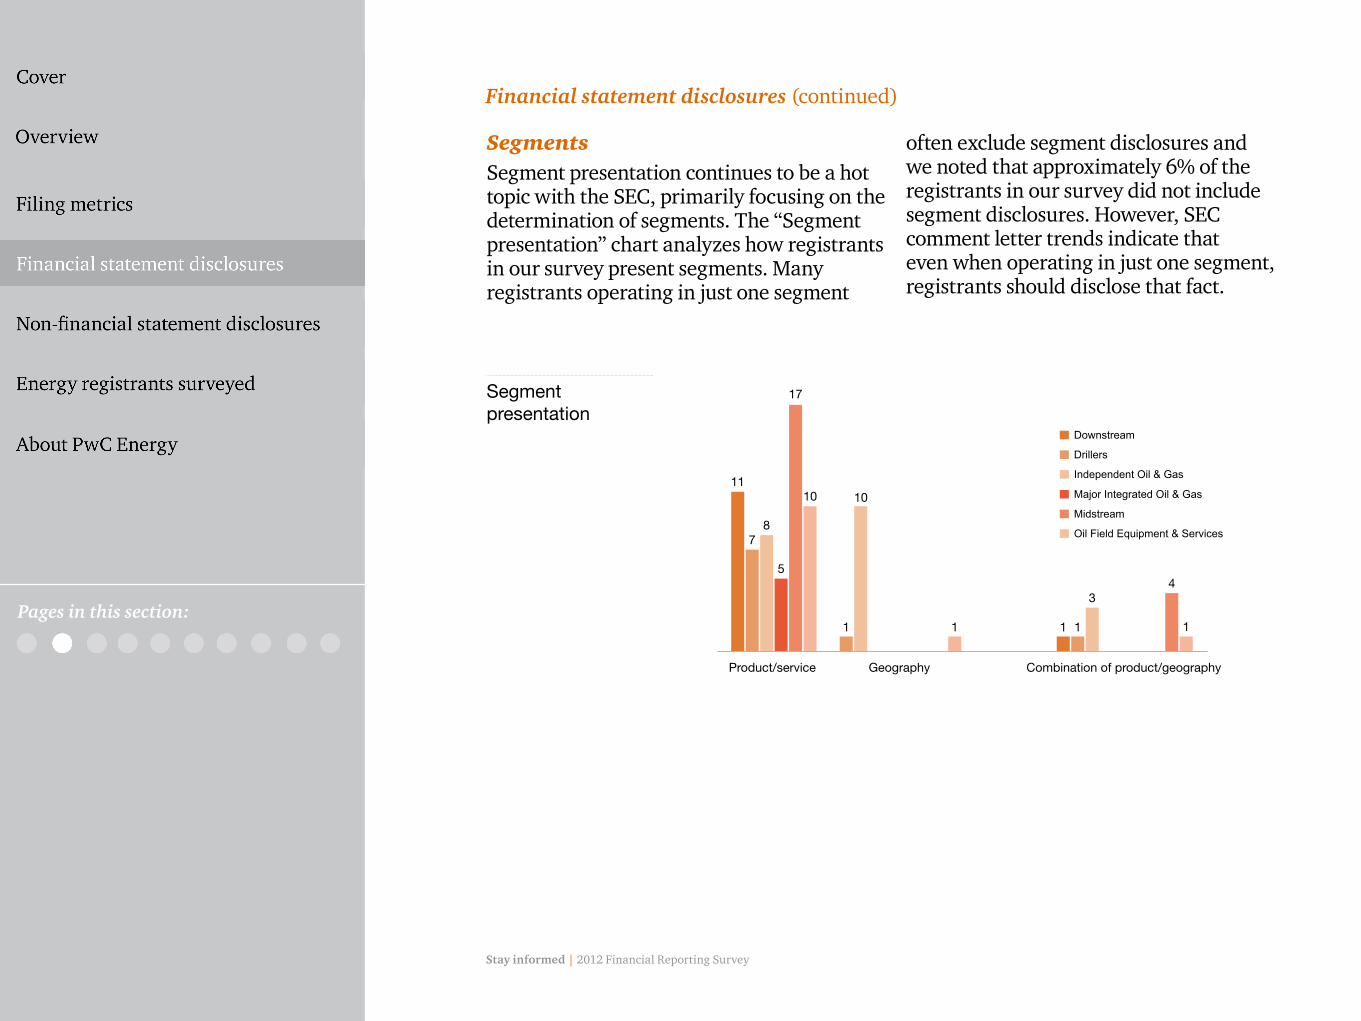
SegmentsSegment presentation continues to be a hot topic with the SEC, primarily focusing on the determination of segments. The “Segment presentation” chart analyzes how registrants in our survey present segments. Many registrants operating in just one segment
often exclude segment disclosures and we noted that approximately 6% of the registrants in our survey did not include segment disclosures. However, SEC comment letter trends indicate that even when operating in just one segment, registrants should disclose that fact.
Financial statement disclosures (continued)
Segment presentation
Segment presentation
Product/service Geography Combination of product/geography
11
78
Downstream
Drillers
Independent Oil & Gas
Major Integrated Oil & Gas
Midstream
Oil Field Equipment & Services
5
17
10 10
1 1 1 1
34
1

Stay informed | 2012 Financial Reporting Survey
Downstream Drillers IndependentOil & Gas
Major IntegratedOil & Gas
Midstream Oil Field Equipment & Services
77% 60% 43% 80% 74% 92%
Percentage of registrants surveyed that recorded goodwill
Goodwill
Accounting for goodwill is an area that requires significant judgment and has consistently garnered the attention of the SEC in filing reviews. The “Goodwill” chart analyzes the prevalence of goodwill recorded by registrants surveyed in each subsector.
The issuance of Accounting Standards Update No. 2011-08, Testing Goodwill for Impairment, in 2011 gave registrants the
option to perform a qualitative assessment to determine whether further impairment testing is necessary. While the revised s tandard was effective for fiscal years beginning after December 15, 2011, registrants were allowed under certain circumstances to early adopt the standard in 2011. The “Early adopted quanitative assessment” table reflects the percentage of registrants surveyed, by subsector, that chose to early adopt the revised standard.
About PwC Energy
Energy registrants surveyed
Non-financial statement disclosures
Filing metrics
Financial statement disclosures (continued)
Goodwill
Pages in this section:

Stay informed | 2012 Financial Reporting Survey
About PwC Energy
Energy registrants surveyed
Non-financial statement disclosures
Filing metrics
Financial statement disclosures (continued)
Early adopted qualitative assessment
In evaluating goodwill for impairment, registrants must also consider whether there are any reporting units that are at risk of failing step one of the impairment test. When an at risk reporting unit is identified, registrants should consider additional disclosures outlined in SEC Financial Reporting Manual section 9510.3, including percentage by which the fair value exceeded
carrying value as of the most recent test and a discussion of the degree of uncertainty associated with key assump-tions. The “Goodwill-at risk reporting units” chart reflects the number of registrants surveyed with goodwill that disclosed an evaluation of at risk reporting units and of those, the number that disclosed a reporting unit that had goodwill considered at risk.
Pages in this section:
Downstream Drillers IndependentOil & Gas
Major IntegratedOil & Gas
Midstream Oil Field Equipment & Services
50% 50% 20% 0% 47% 33%
Percentage of registrants surveyed that chose to early adopt the revised standard
Goodwill−at risk reporting units
Downstream Drillers IndependentOil & Gas
Major IntegratedOil & Gas
Midstream Oil Field Equipment & Services
1 1 3
Disclosed evaluation of at risk reporting units Disclosed existence of at risk reporting units
1 20 0 0 0 0 00

Stay informed | 2012 Financial Reporting Survey
About PwC Energy
Energy registrants surveyed
Non-financial statement disclosures
Filing metrics
AcquisitionsThe energy sector historically has been acquisitive, seeking opportunities to grow business through acquisitions. ASC 805 establishes the disclosure requirements for material business combinations, which includes disclosure of the fair value of the total consideration transferred, the fair value of each major class of consideration (i.e., purchase price allocation) and the revenue and earnings of the combined entity
as though the business combination that occurred during the current year had occurred as of the beginning of the comparable prior annual reporting period (supplemental pro forma information). Of those registrants surveyed with acquisitions during 2011, the “Purchase price allocation” and “ASC 805 supplemental pro forma financial information” charts analyze how the registrants complied with these two disclosure requirements.
Financial statement disclosures (continued)
Purchase price allocation
Pages in this section:
Purchase price allocation
42%
9%
49%Not disclosed(no disclosure of rationale for omission)
Not disclosed due to immateriality or other reasons
Disclosed
ASC 805 Supplemental pro forma financial information
Not disclosed(no disclosure of rationale for omission)
Not disclosed due to immateriality or other reasons
Disclosed
ASC 805 Supplemental pro forma financial information
50%
25%
25%
Stay informed | 2012 Financial Reporting Survey
About PwC Energy
Energy registrants surveyed
Non-financial statement disclosures
Filing metrics
Financial statement disclosures (continued)
Pages in this section:
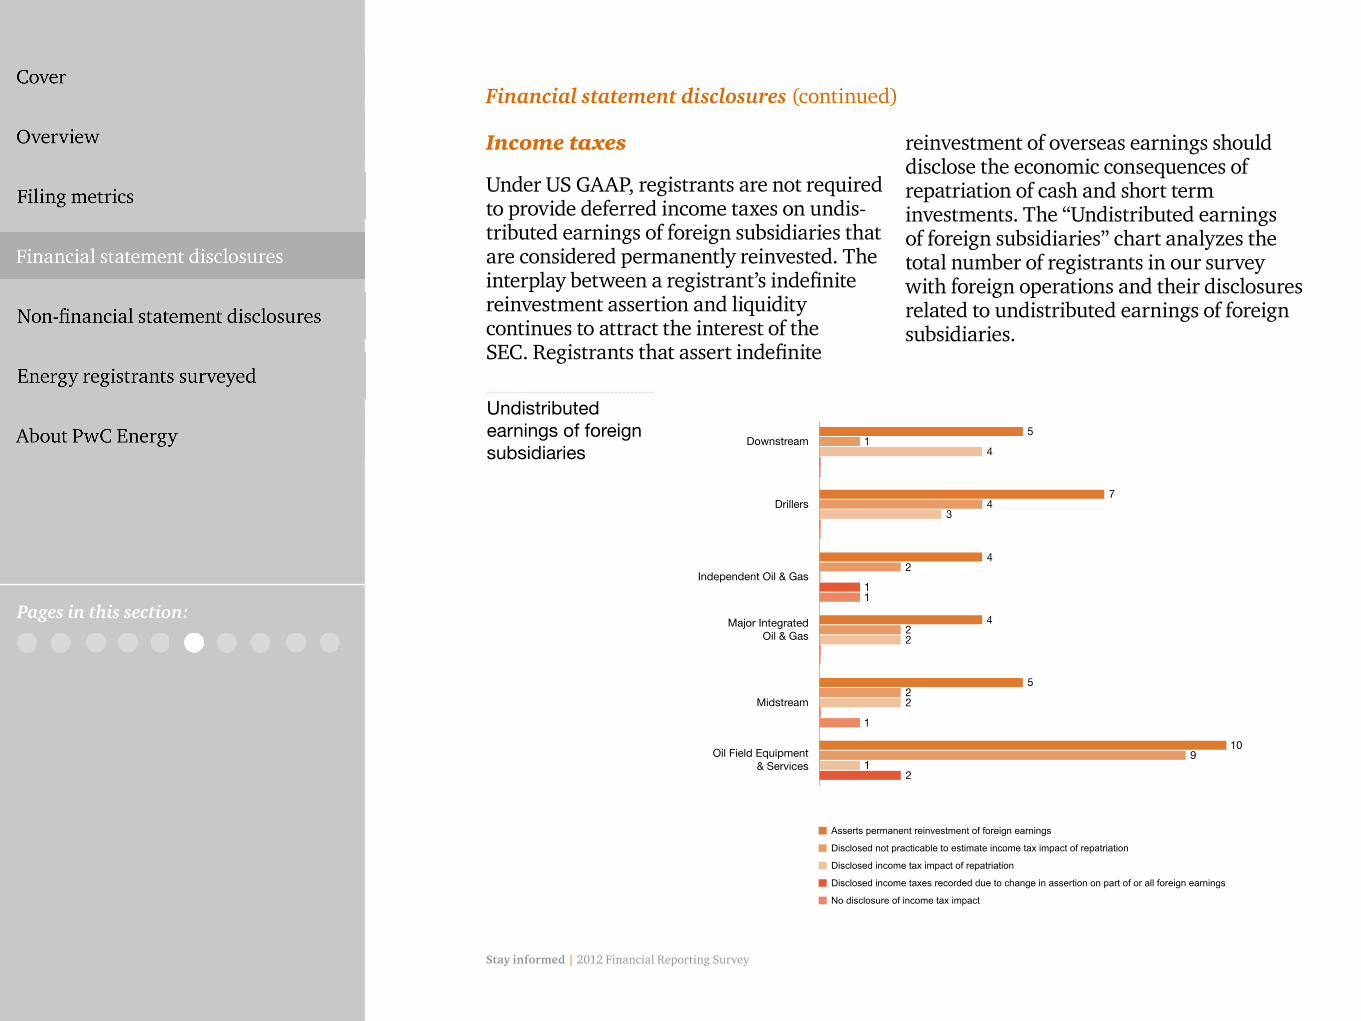
Undistributed earnings of foreign subsidiaries
Undistributed earnings of foreign subsidiaries
Asserts permanent reinvestment of foreign earnings
Disclosed not practicable to estimate income tax impact of repatriation
Disclosed income tax impact of repatriation
Disclosed income taxes recorded due to change in assertion on part of or all foreign earnings
No disclosure of income tax impact
Downstream
Independent Oil & Gas
Major IntegratedOil & Gas
Midstream
Oil Field Equipment& Services
Drillers
51
4
74
3
42
11
422
522
1
109
12
Income taxes
Under US GAAP, registrants are not required to provide deferred income taxes on undis-tributed earnings of foreign subsidiaries that are considered permanently reinvested. The interplay between a registrant’s indefinite reinvestment assertion and liquidity continues to attract the interest of the SEC. Registrants that assert indefinite
reinvestment of overseas earnings should disclose the economic consequences of repatriation of cash and short term investments. The “Undistributed earnings of foreign subsidiaries” chart analyzes the total number of registrants in our survey with foreign operations and their disclosures related to undistributed earnings of foreign subsidiaries.

Stay informed | 2012 Financial Reporting Survey
About PwC Energy
Energy registrants surveyed
Non-financial statement disclosures
Filing metrics
Financial statement disclosures (continued)
Pages in this section:
Impairments
ImpairmentsIn light of the volatility in oil prices and decline in natural gas prices over the past few years, many energy registrants contin-ued to record impairments in 2011. The SEC also continues to issue comments relating to registrants’ considerations surrounding impairments of assets and registrants are
expected to complete a thorough analysis of potential impairments and clearly disclose the assumptions used in impairment asssess-ments. The “Impairments” and “Impairments recorded by type” charts highlight the percentage of energy registrants surveyed that recorded impairments in 2011 as well as the most common areas where impairments were recorded.
Downstream Drillers IndependentOil & Gas
Major IntegratedOil & Gas
Midstream Oil Field Equipment & Services
38% 50% 65% 100% 43% 31%
Percentage of registrants surveyed recording impairments in 2011
Impairments recorded by type
45%
Oil & Gas properties
Long-lived assets Dry holes Assets held for sale
Cost method investments
Goodwill
Equity method investments
45% 41% 18% 16%
9%

Stay informed | 2012 Financial Reporting Survey
About PwC Energy
Energy registrants surveyed
Non-financial statement disclosures
Filing metrics
Financial statement disclosures (continued)
Pages in this section:
Accounting for oil and gas operationsIncluded in our survey are 34 registrants with oil and gas operations material for disclosure. While 27 of these represent major integrated or independent oil and gas regis-trants, the remaining seven represent Drillers, Midstream and Downstream registrants with significant oil and gas operations in addition to their core operations. One independent oil and gas
registrant was excluded from the analysis as it is a development stage enterprise with no revenues or proved reserves. The SEC allows for two methods of accounting for oil and gas operations: suc-cessful efforts and full-cost. The “Method of accounting for oil and gas operations” chart highlights the accounting policy elections by registrants in our survey with oil and gas operations material for disclosure.
Method of accounting for oil and gas operations
513
Downstream Drillers IndependentOil & Gas
Major IntegratedOil & Gas
Midstream Oil Field Equipment & Services
3 2 1
Successful efforts Full cost
190 0 0 0 0
Stay informed | 2012 Financial Reporting Survey
Financial statement disclosures (continued)
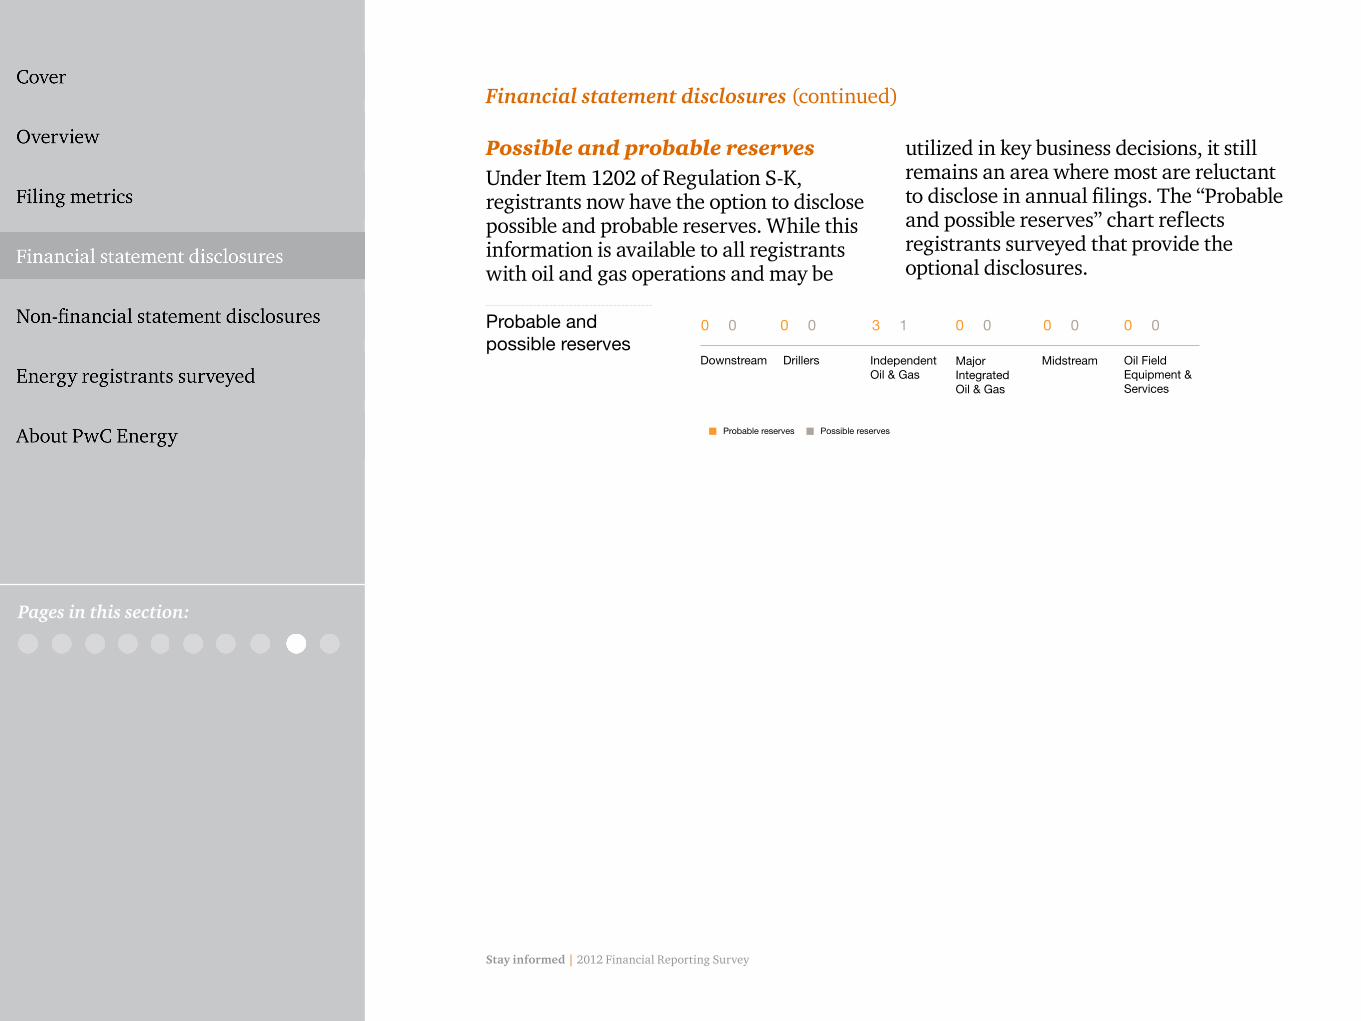
Possible and probable reservesUnder Item 1202 of Regulation S-K, registrants now have the option to disclose possible and probable reserves. While this information is available to all registrants with oil and gas operations and may be
utilized in key business decisions, it still remains an area where most are reluctant to disclose in annual filings. The “Probable and possible reserves” chart reflects registrants surveyed that provide the optional disclosures.
Probable and possible reserves
3
Downstream Drillers IndependentOil & Gas
Major IntegratedOil & Gas
Midstream Oil Field Equipment & Services
Probable reserves Possible reserves
10 0 0 0 0 0 0 0 0 0
About PwC Energy
Energy registrants surveyed
Non-financial statement disclosures
Filing metrics
Pages in this section:

Stay informed | 2012 Financial Reporting Survey
Financial statement disclosures (continued)
Proved undeveloped (PUD) reservesSEC rules specify that undrilled locations can be classified as having undeveloped reserves only if a development plan has been adopted indicating that the undeveloped reserves are scheduled to be drilled within five years, unless specific circumstances justify a longer time. When there are locations scheduled for development beyond five years from initially being recorded, registrants should include specific disclosure of material locations and the PUD reserves attributable to them. Of the 34 registrants included in our survey with oil and gas operations material for disclosure, 47% disclose that their PUD reserves include properties that will not be developed within five years of initial booking. The chart “Disclosures for PUD reserves not developed in 5 years” further analyzes the nature of the disclosures by these registrants related to these PUD reserves.
Disclosures for PUD reserves not developed in 5 years
About PwC Energy
Energy registrants surveyed
Non-financial statement disclosures
Filing metrics
Pages in this section:
Disclosed amount was de minimus/not material
19%
56%
63%
63%Percentage with disclosure
Disclosed quanity (number of properties and/or amount of PUD reserves)
Disclosed factors contributing to inability to develop
Disclosed locations/properties

Stay informed | 2012 Financial Reporting Survey
About PwC Energy
Energy registrants surveyed
Financial statement disclosures
Filing metrics Critical accounting policiesThe SEC has issued guidance on critical accounting policies, including FRR 60: Cautionary Advice Regarding Disclosure About Critical Accounting Policies” which highlights the need for more robust and more transparent discussion in MD&A of critical accounting policies, preparer judgments and risks and uncertainties. In recent years, the Staff has also discussed several recom-mendations to registrants on improving the
disclosures of critical accounting policies. We analyzed the number of critical account-ing policies by subsector as well as the more common critical accounting policies within the energy sector and determined that the amount and nature of policies disclosed were fairly consistent across the energy subsectors, where over half of the registrants surveyed included critical accounting policies on income tax/tax contingencies, goodwill and property, plant and equipment impairments.
Non-financial statement disclosures
Critical accounting policies
Pages in this section:
“
Critical accounting policies
Maximum
Average
Minimum
Downstream
Drillers
Independent Oil & Gas
Major IntegratedOil & Gas
Midstream
Oil Field Equipment& Services
10
10
6
6
64
21
3
3
3
3
71
710
8
128

Stay informed | 2012 Financial Reporting Survey
Non-financial statement disclosures (continued)
Pages in this section:
The top 10 critical accounting policies disclosed by registrants in our survey are highlighted below.
Top 10 critical accounting policies
Critical accounting policies
Oil and gas reserves 21
PPE capitalization
Asset retirement obligations 26
Environmental contingencies 28
Pensions 33
Depletion/depreciation/amortization 36
Revenue recognition
Derivatives 38
Goodwill/goodwill impairment 48
PPE impairment 49
Income taxes/tax contingencies
21
36
49
Number of registrants disclosing policy
Stay informed | 2012 Financial Reporting Survey
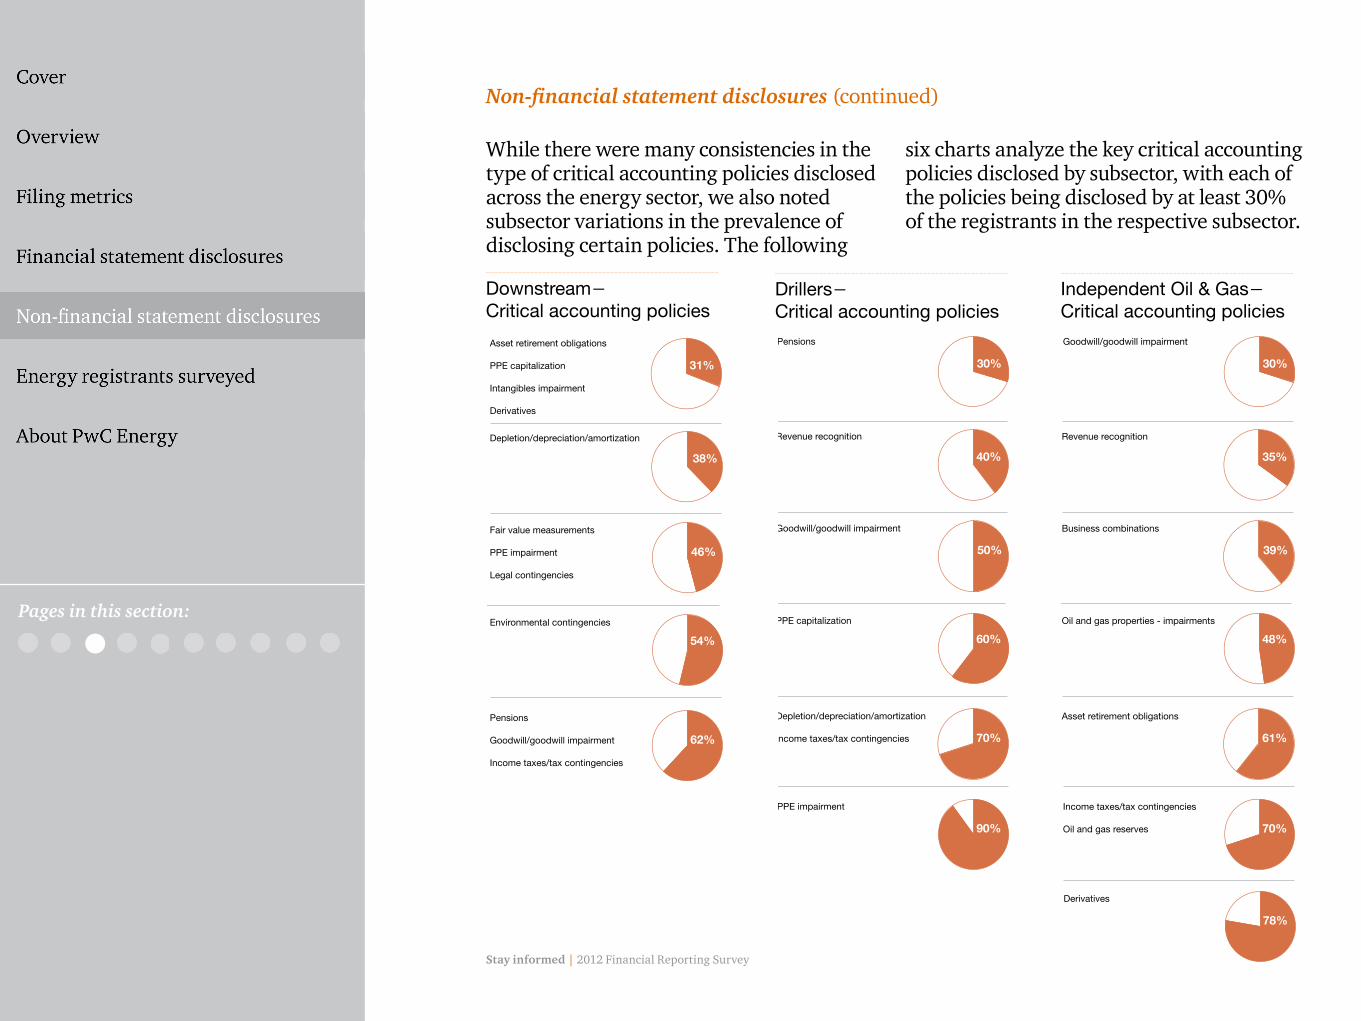
While there were many consistencies in the type of critical accounting policies disclosed across the energy sector, we also noted subsector variations in the prevalence of disclosing certain policies. The following
six charts analyze the key critical accounting policies disclosed by subsector, with each of the policies being disclosed by at least 30% of the registrants in the respective subsector.
Non-financial statement disclosures (continued)
Pages in this section:
Downstream− Critical accounting policies
Asset retirement obligations
PPE capitalization
Intangibles impairment
Derivatives
31%
38%
Depletion/depreciation/amortization
46%
Fair value measurements
PPE impairment
Legal contingencies
54%
Environmental contingencies
62%
Pensions
Goodwill/goodwill impairment
Income taxes/tax contingencies
Pensions
30%
40%
Revenue recognition
50%
Goodwill/goodwill impairment
60%
PPE capitalization
70%
Depletion/depreciation/amortization
Income taxes/tax contingencies
90%
PPE impairment
Drillers− Critical accounting policies
Goodwill/goodwill impairment
30%
35%
Revenue recognition
39%
Business combinations
48%
Oil and gas properties - impairments
61%
Asset retirement obligations
70%
Income taxes/tax contingencies
Oil and gas reserves
78%
Derivatives
Independent Oil & Gas− Critical accounting policies
Stay informed | 2012 Financial Reporting Survey
Non-financial statement disclosures (continued)
Pages in this section:
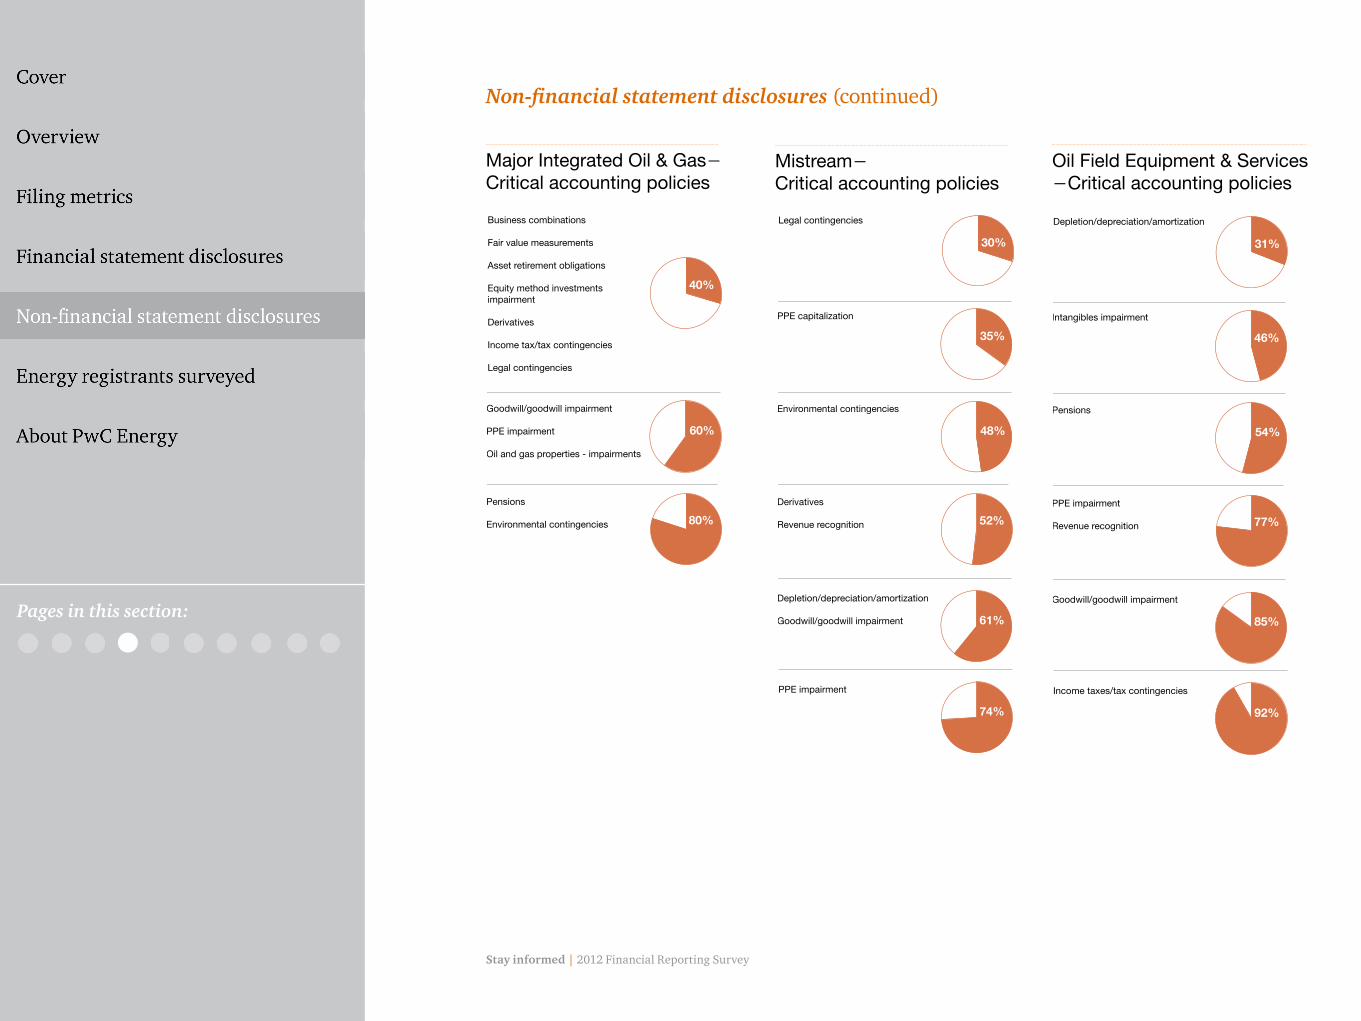
Major Integrated Oil & Gas− Critical accounting policies
Goodwill/goodwill impairment
PPE impairment
Oil and gas properties - impairments
40%
Business combinations
Fair value measurements
Asset retirement obligations
Equity method investments impairment
Derivatives
Income tax/tax contingencies
Legal contingencies
60%
80%
Pensions
Environmental contingencies
35%
30%
Legal contingencies
PPE capitalization
48%
Environmental contingencies
52%
Derivatives
Revenue recognition
61%
Depletion/depreciation/amortization
Goodwill/goodwill impairment
74%
PPE impairment
Mistream− Critical accounting policies
Depletion/depreciation/amortization
31%
Intangibles impairment
54%
Pensions
77%
PPE impairment
Revenue recognition
85%
Goodwill/goodwill impairment
92%
Income taxes/tax contingencies
46%
Oil Field Equipment & Services −Critical accounting policies

Stay informed | 2012 Financial Reporting Survey
Risk factorsItem 503(c) of Regulation S-K outlines the re-quirements for risk factor disclosures in SEC filings. The SEC adopted the requirements for inclusion of risk factors in annual filings to further enhance the contents of Exchange Act reports and provide value to investors and the markets. It is common for risk factors
to also be the focus of SEC comment letters as the Staff identifies risk areas that are perceived to require more transparency in reporting and disclosures. We analyzed the number of risk factors by subsector, noting significant differences in the average number of risk factors disclosed.
Non-financial statement disclosures (continued)
Pages in this section:
Risk factors
Risk factors
Downstream Drillers MidstreamIndependentOil & Gas
Major Integrated Oil & Gas
Oil Field Equipment& Services
Maximum
Average
Minimum68
28
9
33
2317
54
29
1117
128
95
51
17
39
19
11

Stay informed | 2012 Financial Reporting Survey
As discussed in our energy industry 2012 SEC comment letter trends, the SEC continues to be focused on the areas of hydraulic fracturing and environmental liabilities, with many comments in this area resulting in the addition or expansion of risk factor disclosures. The Division of Corpora-tion Finance of the SEC also released
disclosure guidance on cybersecurity in 2011 and European sovereign debt disclosures in 2012, both of which resulted in additional risk factor disclosures across domestic registrants. Our survey of registrants included an analysis of the prevalence of risk factors on these four hot topics in the energy industry.
Non-financial statement disclosures (continued)
Pages in this section:
Risk factors
Risk factors
Downstream Drillers MidstreamIndependentOil & Gas
Major Integrated Oil & Gas
Oil Field Equipment& Services
Total surveyed
Environmental liabilities
Hydraulic fracturing
Cybersecurity
European debt risk
13 13
2
65
10 10
4
12
23 23
20
910
5 5
34
1
23 23
17
10
2
13 13
9
65

Stay informed | 2012 Financial Reporting Survey
Non-GAAP measuresNon-GAAP measures are used frequently by registrants in the energy industry and are often subject to SEC comment letters when they do not align with the guidance in Regulation G and Item 10(e) of Regulation S-K.
Registrants in our survey that disclosed non-GAAP measures in filings presented on average two different measures, with the maximum of six non-GAAP measures being disclosed by a registrant in the downstream sector. The most commonly reported non-GAAP measure is EBITDA or adjusted EBITDA.
Non-financial statement disclosures (continued)
Pages in this section:
Non-GAAP measures
Downstream Drillers IndependentOil & Gas
Major IntegratedOil & Gas
Midstream Oil Field Equipment & Services
62% 20% 61% 20% 78% 23%
Percentage of registrants surveyed disclosing non-GAAP measures
Types of non-GAAP measures disclosed
Revenue by segment
Segment operating margin5
Gross margin
Segment operating income
Gross operating margin by segment
Distributable cash flow
EBITDA/adjusted EBITDA
PV-10
6
8
9
21Number of registrants surveyed disclosing measure
Stay informed | 2012 Financial Reporting Survey
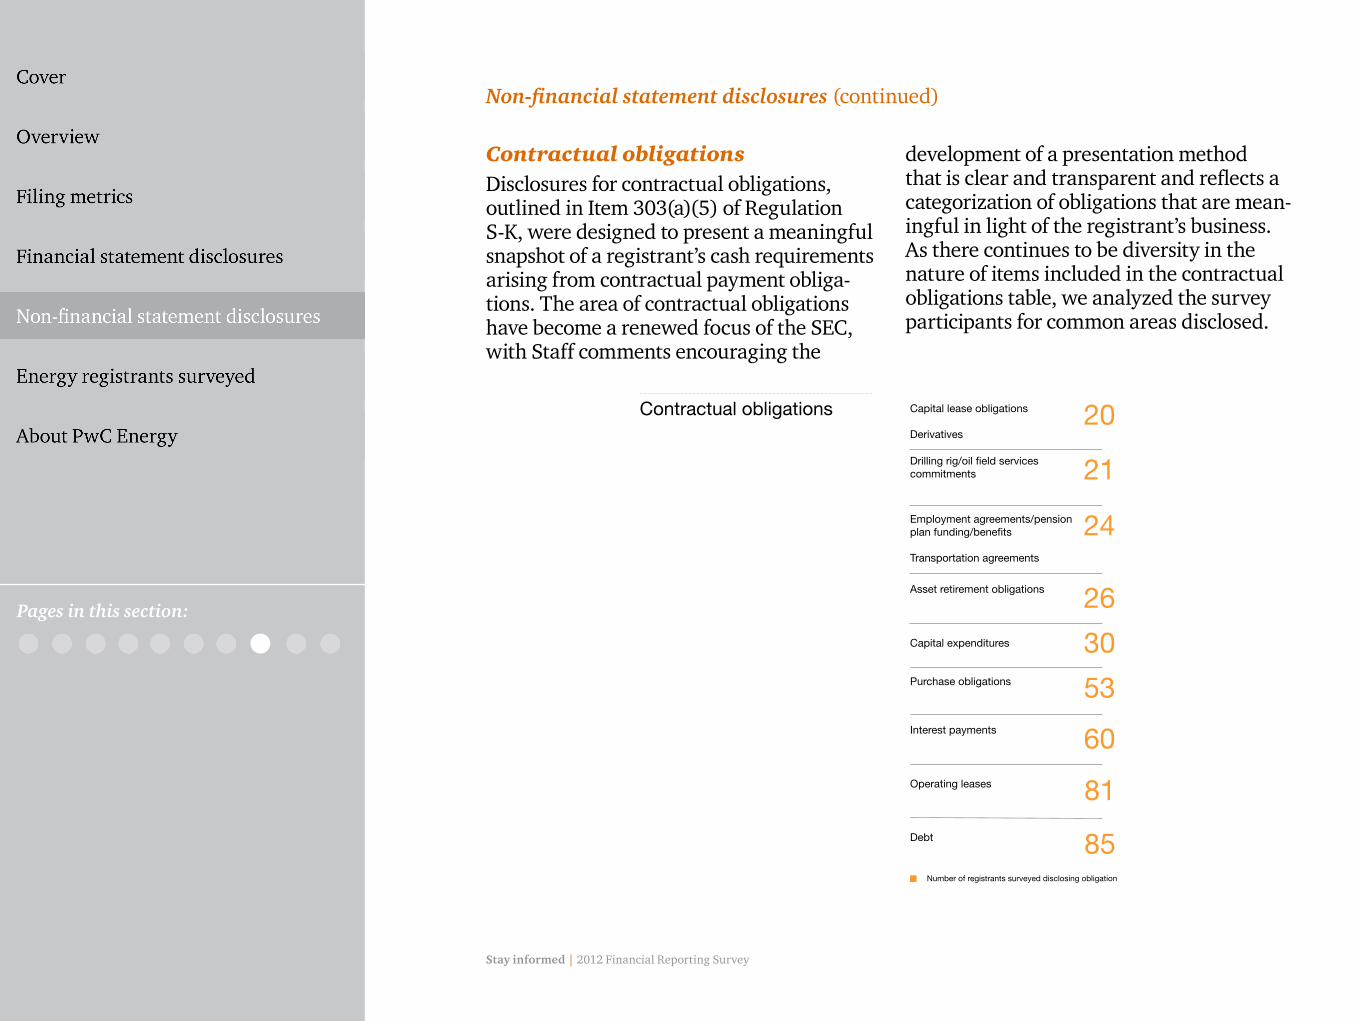
Contractual obligationsDisclosures for contractual obligations, outlined in Item 303(a)(5) of Regulation S-K, were designed to present a meaningful snapshot of a registrant’s cash requirements arising from contractual payment obliga-tions. The area of contractual obligations have become a renewed focus of the SEC, with Staff comments encouraging the
development of a presentation method that is clear and transparent and reflects a categorization of obligations that are mean-ingful in light of the registrant’s business. As there continues to be diversity in the nature of items included in the contractual obligations table, we analyzed the survey participants for common areas disclosed.
Non-financial statement disclosures (continued)
Pages in this section:
Contractual obligations Capital lease obligations
Derivatives20
Drilling rig/oil field services commitments
Employment agreements/pension plan funding/benefits
Transportation agreements
Capital expenditures
Asset retirement obligations
21
24
26
Number of registrants surveyed disclosing obligation
Purchase obligations
Operating leases
Interest payments
53
60
30
81Debt 85

Stay informed | 2012 Financial Reporting Survey
The following six charts analyze the contractual obligations disclosed by subsector, with each of the obligations
being disclosed by at least 30% of the registrants in the respective subsector.
Non-financial statement disclosures (continued)
Pages in this section:
Downstream− Contractual obligations
54%
Employment agreements/pension plan funding/benefits
Capital expenditures
Transportation agreements
31%
38%
Capital lease obligations
Interest payments
Purchase obligations
100%
Debt
Operating leases
92%
70%
Employment agreements/pension plan funding/benefits
30%
60%
Purchase obligations
Capital expenditures
Interest payments
Operating leases
100%
Debt
90%
Drillers− Contractual obligations
78%
Derivatives
Transportation agreements
Interest payments
57%
74%
Drilling rig/oil field services commitments
83%
87%
Asset retirement obligations
96%
Operating leases
Debt
Independent Oil & Gas− Contractual obligations

Stay informed | 2012 Financial Reporting Survey
Non-financial statement disclosures (continued)
Pages in this section:
Major Integrated Oil & Gas− Contractual obligations
Purchase obligations
40%
Take-or-pay contracts
Asset retirement obligations
Employment agreements/pension plan funding/benefits
Drilling rig/oil field services commitments
Interest payments
60%
80%
Capital lease obligations
Debt
Operating leases 100%
Purchase obligations
40%
Take-or-pay contracts
Asset retirement obligations
Employment agreements/pension plan funding/benefits
Drilling rig/oil field services commitments
Interest payments
60%
80%
Capital lease obligations
Debt
Operating leases 100%
Mistream− Contractual obligations
46%
Employment agreements/pension plan funding/benefits
31%
38%
Capital lease obligations
62%
92%
Interest payments
100%
Debt
Operating leases
Purchase obligations
Oil Field Equipment & Services −Contractual obligations
Stay informed | 2012 Financial Reporting Survey
About PwC Energy
Non-financial statement disclosures
Financial statement disclosures
Filing metrics
Energy registrants surveyed
Calumet Specialty Products ParCVR Energy, Inc.Hess CorporationHollyFrontier Corporation
Imperial Oil Ltd. KiOR, Inc. Marathon Petroleum CorporationMurphy Oil Corporation
Sunoco, Inc.Tesoro CorporationValero Energy CorporationWestern Refining, Inc.World Fuel Services Corp.
Downstream
Atwood Oceanics IncDiamond Offshore DrillingEnsco Plc
Helmerich & Payne Inc.Nabors Industries LtdNoble Corp-Swiss & Cayman
Patterson-UTI Energy IncRowan Companies IncTransocean LtdUnit Corp
Drillers
Anadarko Petroleum CorporationApache Corp.Cabot Oil & Gas CorporationChesapeake Energy CorpCimarex Energy CoCobalt International Energy, IncConcho Resources, Inc
Continental Resources, Inc.Denbury Resources Inc.Devon Energy CorporationEnergy XXI (Bermuda) LimitedEOG Resources, Inc.Kosmos Energy LTD.Linn Energy, LLCNewfield Exploration Co.
Noble Energy, Inc.Pioneer Natural Resources Co.Plains Exploration & ProductionQEP Resources, Inc.Range Resources CorporationSM Energy CompanySouthwestern Energy CoWhiting Petroleum Corp
Chevron CorpConocoPhillips
Exxon Mobil CorporationMarathon Oil Corporation
Occidental Petroleum Corporation
Major Integrated Oil & Gas
Boardwalk Pipeline Partners, LPBuckeye Partners LPCheniere Energy Partners LP.Chesapeake Midstream PartnersEl Paso CorpEl Paso Pipeline Partners, L.P.Enbridge Energy Partners LPEnergy Transfer Equity LP
Energy Transfer Partners LPEnterprise Products PartnersKinder Morgan Energy PartnersMagellan Midstream Partners LPMarkWest Energy Partners, LPNuStar Energy L.P.Oneok Partners, LPPlains All American Pipeline
Regency Energy Partners LPSpectra Energy CorpSpectra Energy Partners, LPSunoco Logistics Partners L.P.Targa Resources Partners LPWestern Gas Partners LPWilliams Companies, Inc
Midstream
Baker Hughes IncCameron International CorporationCARBO Ceramics IncCore Laboratories NVDrill-Quip, Inc
FMC Technologies, IncHalliburton CompanyLufkin Industries IncNational Oil well Varco, Inc
Oceaneering International, IncOil States International, IncSchlumberger NVSuperior Energy Services, Inc
Oil Field Equipment & Services
Independent Oil & Gas

Stay informed | 2012 Financial Reporting Survey
Energy registrants surveyed
Non-financial statement disclosures
Financial statement disclosures
Filing metrics
With more than 5,300 industry-dedicated professionals located in strategic energy centers, we can help companies everywhere they operate. PwC has energy centers in countries throughout the world including Houston (US headquarters), Calgary, Rio de Janeiro, Doha, Dubai, Moscow, Stavanger, London, Jakarta, Beijing and elsewhere. Our energy practice also includes more than 350 partners focused on the industry’s needs and priorities. PwC has more than 100 years of experience serving energy companies, including some of the world’s largest national oil companies and international oil companies. PwC provides a full range of assurance, tax and advisory team members who under- stand the industry and the issues that oil companies face. Our professionals specialize in accounting and auditing, rate regulation, financial risk management, revenue assur-ance, taxation, transaction services, environmental regulation, Sarbanes-Oxley compliance and other key areas for the industry. We take pride in our global approach supported by our local knowledge.
A leading global network of professional services firms, PwC delivers quality and excellence in audit and assurance, tax, and advisory services. The network has close to 180,000 people in member firms located in 158 countries who make a difference for all of its stakeholders—clients, people, the capital markets and the communities our member firms service —by unlocking potential and creating lasting value.
For more information, please contact:
Niloufar MolaviUS Energy and Mining Leader [email protected] (713) 356 6002
Chuck ChangUS Energy Assurance Leader [email protected] (713) 356 5214
About PwC Energy
Pages in this section:

Stay informed | 2012 Financial Reporting Survey
AcknowlegementsThis publication represents the efforts and ideas of many individuals within PwC, including members of the US Energy Sector and the National Professional Services Group. The following PwC personnel contributed to the contents or served as technical reviewers of this publication:
Ricardo Moreno Angelique V. Woods Brian Korbesmeyer
Sarah Reed
Special ThanksSpecial thanks to all the other resources in the National Professional Services Group, Energy Sector, Marketing and Graphics Departments who contributed substantially to the final editing, production and overall quality of this technical publication.
Pages in this section:

This publication has been prepared for general information on matters of interest only, and does not constitute professional advice on facts and circumstances specific to any person or entity.
You should not act upon the information contained in this publication without obtaining specific professional advice. No representation or warranty (express or implied) is given as to the accuracy or completeness of the information contained in this publication. The information contained in this material was not intended or written to be used, and cannot be used, for purposes of avoiding penalties or sanctions imposed by any government or other regulatory body. PricewaterhouseCoopers LLP, its members, employees and agents shall not be responsible for any loss sustained by any person or entity who relies on this publication.
The content of this publication is based on information available as of September 30, 2012. Accordingly, certain aspects of this publication may be superseded as new guidance or interpretations emerge. Financial statement preparers and other users of this publication are therefore cautioned to stay abreast of and carefully evaluate subsequent authoritative and interpretive guidance that is issued.
© 2013 PricewaterhouseCoopers LLP, a Delaware limited liability partnership. All rights reserved. PwC refers to the US member firm, and may sometimes refer to the PwC network. Each member firm is a separate legal entity. Please see www.pwc.com/structure for further details.
This content is for general information purposes only, and should not be used as a substitute for consultation with professional advisors. PwC US helps organizations and individuals create the value they’re looking for. We’re a member of the PwC network of firms with 169,000 people in more than 158 countries. We’re committed to delivering quality in assurance, tax and advisory services. Tell us what matters to you and find out more by visiting us at www.pwc.com/us.
DH-13-0091.th
www.pwc.com
Pages in this section:


