39
CORPORATE PRESENTATION June 2019 1Q 2019
CORPORATE PRESENTATIONJ u n e 2 0 1 9
1Q 2019
D I S C L A I M E R
The information contained in this presentation (the "Presentation") is for informationpurposes only. The Presentation does not constitute or form part of any offer orinvitation to sell or the solicitation of an offer or invitation to purchase or subscribe for,or any offer to underwrite or otherwise acquire any securities of The Straits TradingCompany Limited (the “Company”) or any other securities, nor shall any part of thePresentation or the fact of its presentation or communication form the basis of, or berelied on in connection with, any contract, commitment or investment decision inrelation thereto.
The information in this Presentation is based on the views of and certain assumptionsheld by the management of the Company. While the Company has made reasonableefforts to ensure the accuracy of the information, the Company has not independentlyverified such information. In addition, the Company does not make any representationor warranty as to the accuracy or completeness of the information contained in thisPresentation or the reasonableness of any assumptions contained herein and any liabilityin respect therefore is expressly disclaimed.
The information in this Presentation has been provided by the Company as of 31 March2019 except as otherwise indicated, and are subject to change without notice or update.The Company does not make any representation or warranty that there have beenchanges in the affairs of the Company after such date.
This Presentation may contain forward-looking statements. All statements that addressexpectations or projections about the future, including, but not limited to, statementsabout the strategy for growth, expected performance, trends, anticipated developmentsin the Company’s industries, market position, expenditures, and financial results, areforward-looking statements. Forward-looking statements are based on certainassumptions and expectations of future events. The Company does not guarantee thatthese assumptions and expectations are accurate or will be realized. Actual futureperformance, outcomes and results may differ materially from those expressed inforward-looking statements as a result of a number of risks, uncertainties andassumptions. Although the Company believes that such forward-looking statements arebased on reasonable assumptions, it can give no assurance that such expectations will bemet.
These factors include, but are not limited to, (i) general global, regional and localpolitical, social and economic conditions (including, but not limited to, factors such as thepolitical landscape, environmental conditions and viral epidemics such as human avianflu and severe acute respiratory syndrome) that may result in reduced occupancy ratesand room rates for the hospitality investments of the Company or affect the otherinvestments of the Company, (ii) the cyclical nature of the property market and tourismindustry in the countries in which the Company operates and fluctuations in tin prices,(iii) the Company not being successful in the implementation of its business strategies orin managing its growth, (iv) regulatory developments and changes in the industries inwhich the Company operates, the general economic condition of, and changes in, theeconomy in Asia-Pacific and Europe, (v) competition in the hospitality industry and thehospitality-related industry in the Asia-Pacific and Europe region, (vi) hostilities (includingfuture terrorist attacks) or fear of hostilities that affect travel in general, within or to theAsia-Pacific region or any other countries in which the hospitality investments of theCompany are located or have operations, (viii) changes in the supply and demand for tinmetal, (vii) changes in the price of tin as a result of speculation, (viii) changes in interestrates or inflation rates, (ix) wars or acts of international or domestic terrorism, (x)occurrences of catastrophic events, natural disasters and acts of God that affect thebusiness or properties of the Company, and (xi) other factors beyond the control of theCompany. You are cautioned not to place undue reliance on these forward-lookingstatements, which are based on current view of the Company's management on futureevents.
This Presentation includes statistical data provided by us and various third parties andcites third party projections regarding growth and performances of the industry andmarkets in which we operate. Such data is taken or derived from information publishedby industry sources, various third parties and from our internal data. In each such case,the sources are identified in this Presentation.
This Presentation is directed only at persons which are not “U.S. persons” as definedunder Regulation S of the U.S. Securities Act of 1933 and, in addition, which are lawfullyable to receive this document under the laws of the jurisdictions in which they arelocated or other applicable laws.
2
© Copyright 2019. The Straits Trading Company Limited.
All rights reserved.

© Copyright 2019. The Straits Trading Company Limited.
All rights reserved.
3
CO N T E N TSCO N T E N TSCO N T E N TSCO N T E N TS
• 1Q 2019 HIGHLIGHTS1Q 2019 HIGHLIGHTS1Q 2019 HIGHLIGHTS1Q 2019 HIGHLIGHTS 04040404
• BUSINESS BUSINESS BUSINESS BUSINESS HIGHLIGHTSHIGHLIGHTSHIGHLIGHTSHIGHLIGHTS
Real Estate Ecosystem 08080808
Resources 23232323
• FINANCIAL FINANCIAL FINANCIAL FINANCIAL HIGHLIGHTSHIGHLIGHTSHIGHLIGHTSHIGHLIGHTS 26262626
• APPENDIXAPPENDIXAPPENDIXAPPENDIX 36363636

F Y 2 0 1 8 & 1 Q 2 0 1 9 H I G H L I G H T S
4
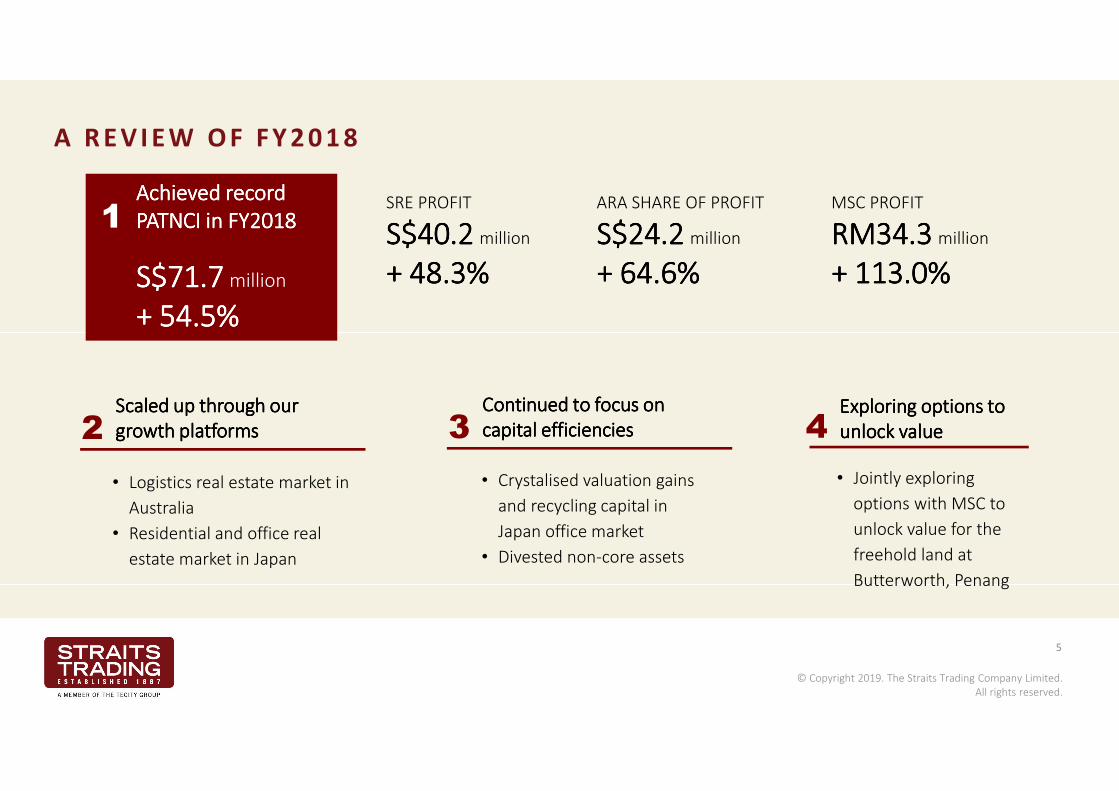
A R E V I E W O F F Y 2 0 1 8
5
Achieved record Achieved record Achieved record Achieved record
PATNCI in FY2018PATNCI in FY2018PATNCI in FY2018PATNCI in FY2018
S$71.7S$71.7S$71.7S$71.7 million
++++ 54.5% 54.5% 54.5% 54.5%
SRE PROFIT
S$40.2S$40.2S$40.2S$40.2 million
++++ 48.3% 48.3% 48.3% 48.3%
ARA SHARE OF PROFIT
S$24.2S$24.2S$24.2S$24.2 million
++++ 64.6% 64.6% 64.6% 64.6%
MSC PROFIT
RM34.3RM34.3RM34.3RM34.3 million
++++ 113.0% 113.0% 113.0% 113.0%
© Copyright 2019. The Straits Trading Company Limited.
All rights reserved.
Scaled up through our Scaled up through our Scaled up through our Scaled up through our
growth platformsgrowth platformsgrowth platformsgrowth platforms2
• Logistics real estate market in
Australia
• Residential and office real
estate market in Japan
Continued to Continued to Continued to Continued to ffffocus on ocus on ocus on ocus on
capital efficienciescapital efficienciescapital efficienciescapital efficiencies3
• Crystalised valuation gains
and recycling capital in
Japan office market
• Divested non-core assets
• Jointly exploring
options with MSC to
unlock value for the
freehold land at
Butterworth, Penang
Exploring options to Exploring options to Exploring options to Exploring options to
unlock valueunlock valueunlock valueunlock value4
1
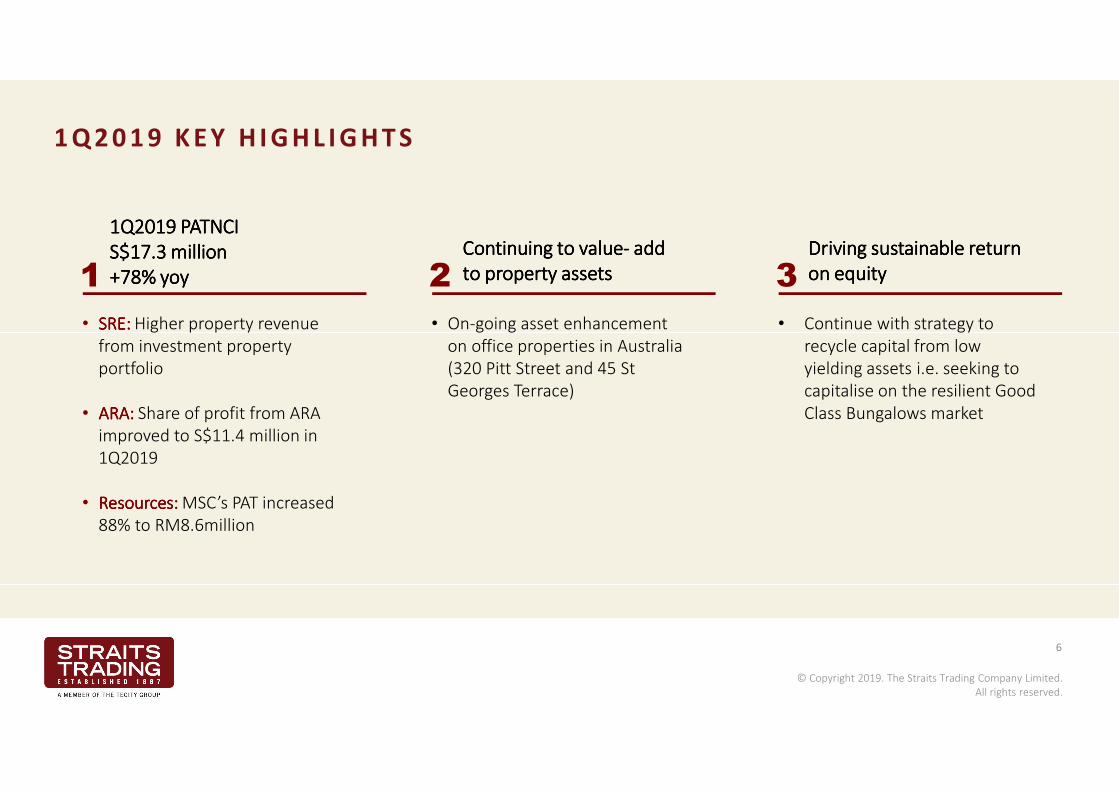
1 Q 2 0 1 9 K E Y H I G H L I G H T S
6
© Copyright 2019. The Straits Trading Company Limited.
All rights reserved.
• SRE: SRE: SRE: SRE: Higher property revenue
from investment property
portfolio
• ARA: ARA: ARA: ARA: Share of profit from ARA
improved to S$11.4 million in
1Q2019
• Resources: Resources: Resources: Resources: MSC’s PAT increased
88% to RM8.6million
1Q2019 PATNCI 1Q2019 PATNCI 1Q2019 PATNCI 1Q2019 PATNCI
S$17.3 millionS$17.3 millionS$17.3 millionS$17.3 million
+78% +78% +78% +78% yoyyoyyoyyoy1
• On-going asset enhancement
on office properties in Australia
(320 Pitt Street and 45 St
Georges Terrace)
Continuing to valueContinuing to valueContinuing to valueContinuing to value---- add add add add
to property assetsto property assetsto property assetsto property assets2
• Continue with strategy to
recycle capital from low
yielding assets i.e. seeking to
capitalise on the resilient Good
Class Bungalows market
Driving sustainable Driving sustainable Driving sustainable Driving sustainable return return return return
on equityon equityon equityon equity3
B U S I N ES S H I G H L I G H T S
REAL ESTATE ECOSYSTEM7
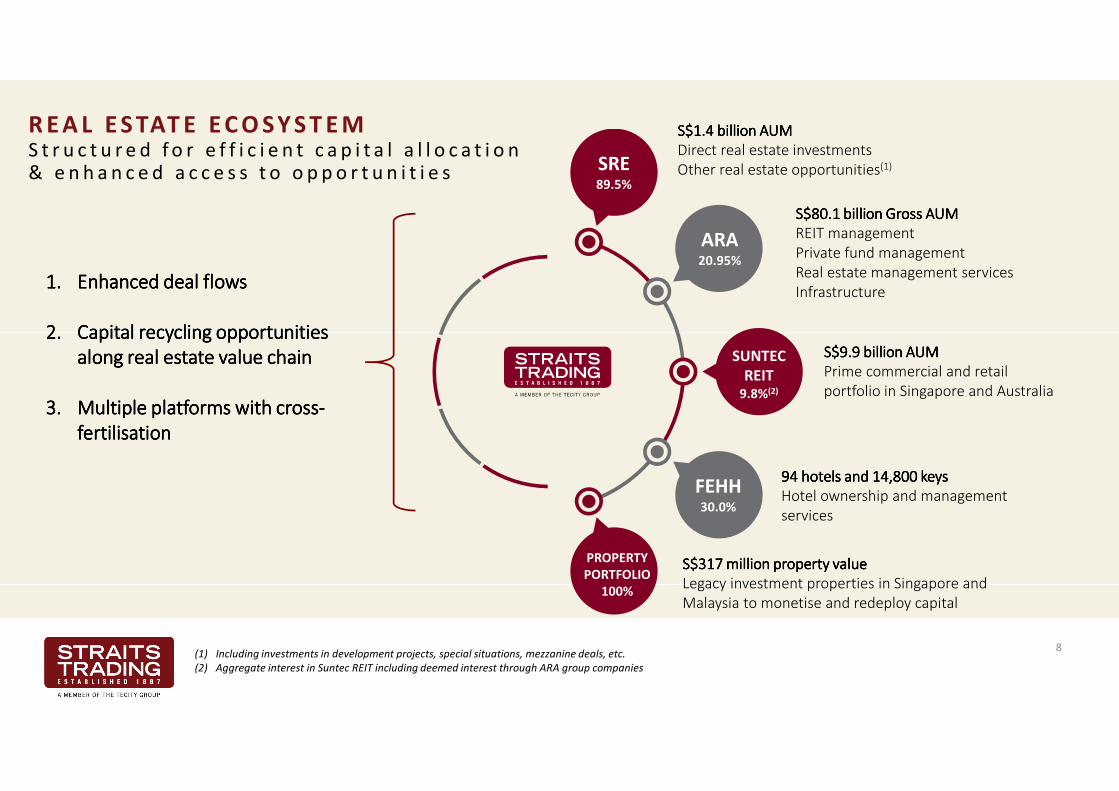
R E A L E S TAT E E C O S Y S T E MS t r u c t u r e d f o r e f f i c i e n t c a p i t a l a l l o c a t i o n & e n h a n c e d a c c e s s t o o p p o r t u n i t i e s SRE
89.5%
ARA20.95%
SUNTEC
REIT9.8%(2)
FEHH30.0%
PROPERTY
PORTFOLIO
100%
S$1.4 billion AUMS$1.4 billion AUMS$1.4 billion AUMS$1.4 billion AUM
Direct real estate investments
Other real estate opportunities(1)
S$80.1 S$80.1 S$80.1 S$80.1 billion billion billion billion Gross AUM Gross AUM Gross AUM Gross AUM
REIT management
Private fund management
Real estate management services
Infrastructure
S$9.9 billion AUM S$9.9 billion AUM S$9.9 billion AUM S$9.9 billion AUM
Prime commercial and retail
portfolio in Singapore and Australia
94 hotels and 14,800 keys 94 hotels and 14,800 keys 94 hotels and 14,800 keys 94 hotels and 14,800 keys
Hotel ownership and management
services
S$317 million property valueS$317 million property valueS$317 million property valueS$317 million property value
Legacy investment properties in Singapore and
Malaysia to monetise and redeploy capital
1.1.1.1. Enhanced deal flowsEnhanced deal flowsEnhanced deal flowsEnhanced deal flows
2.2.2.2. Capital recycling opportunities Capital recycling opportunities Capital recycling opportunities Capital recycling opportunities
along real estate value along real estate value along real estate value along real estate value chainchainchainchain
3.3.3.3. Multiple platforms with Multiple platforms with Multiple platforms with Multiple platforms with crosscrosscrosscross----
fertilisationfertilisationfertilisationfertilisation
(1) Including investments in development projects, special situations, mezzanine deals, etc.
(2) Aggregate interest in Suntec REIT including deemed interest through ARA group companies
8
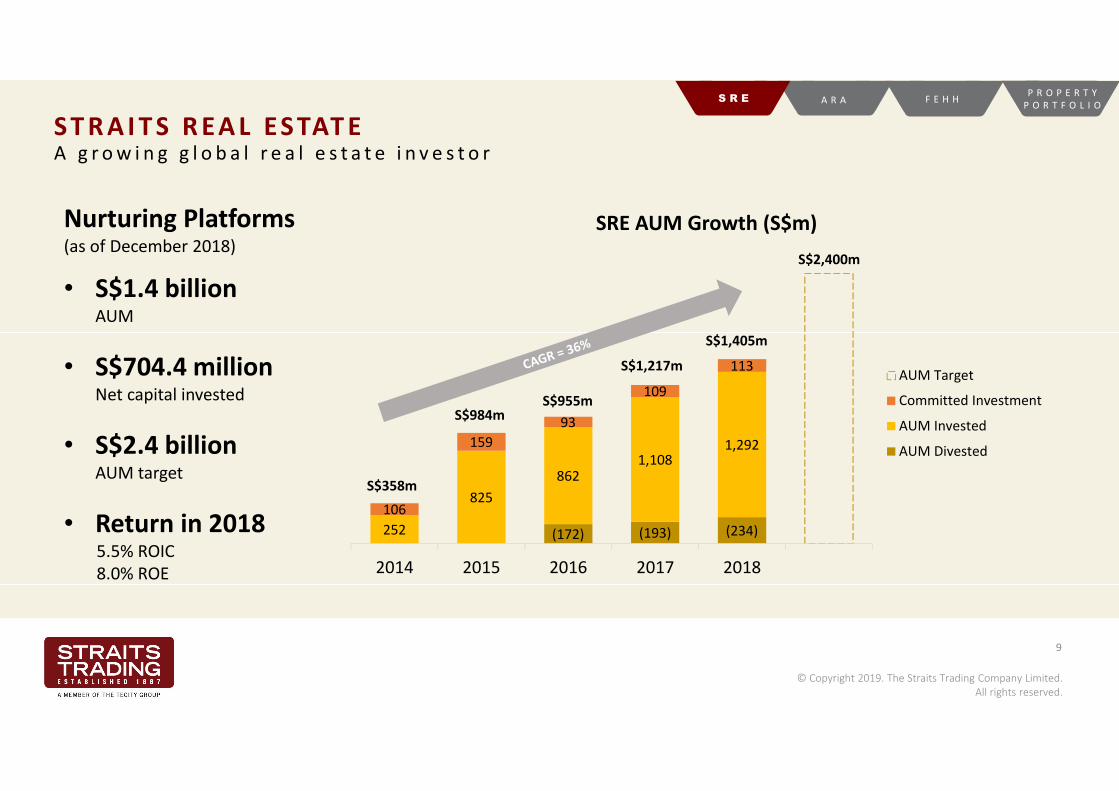
S T R A I T S R EA L ES TAT EA g r o w i n g g l o b a l r e a l e s t a t e i n v e s t o r
© Copyright 2019. The Straits Trading Company Limited.
All rights reserved.
Nurturing Platforms (as of December 2018)
• S$1.4 billion AUM
• S$704.4 million Net capital invested
• S$2.4 billion AUM target
• Return in 20185.5% ROIC
8.0% ROE
9
(172) (193) (234)252
825
8621,108
1,292
106
159
93
109
113
2014 2015 2016 2017 2018
SRE AUM Growth (S$m)
AUM Target
Committed Investment
AUM Invested
AUM Divested
S$1,405m
S$1,217m
S$955mS$984m
S$358m
S$2,400m
P R O P E R T Y
P O R T F O L I OF E H HS R E A R A

10
© Copyright 2019. The Straits Trading Company Limited.
All rights reserved.
S T R A I T S R EA L ES TAT EA c c e s s t o a n d i d e n t i f y o p p o r t u n i t i e s w i t h u n r e a l i s e d l a t e n t v a l u e
OfficeOfficeOfficeOffice LogisticsLogisticsLogisticsLogistics ResidentialResidentialResidentialResidential RetailRetailRetailRetail
AustraliaAustraliaAustraliaAustraliaTapping on local asset
managers’ ability
Nurturing platform with
Commercial & General
KoreaKoreaKoreaKoreaNurturing platform with
IGIS Asset Management
JapanJapanJapanJapan
Anchor partnership with
Savills Investment
Management
Anchor partnership with
Savills Investment
Management
ChinaChinaChinaChinaEstablished a scalable
beachhead
MalaysiaMalaysiaMalaysiaMalaysia Partnership with ARA
• Leverage strong shareholders’ network for wide opportunity set
• Investment strategy focus – Value-add space; anchored on prudent underwriting, optimal deal structuring and
platform partnership
• Enhance asset value via active asset & property management
R EP R O P E R T Y
P O R T F O L I OF E H HS R E A R A

© Copyright 2019. The Straits Trading Company Limited.
All rights reserved.
S T R A I T S R EA L ES TAT EF o c u s e d d i v e r s i f i c a t i o n w i t h i n t h e v a l u e - a d d s p a c e
Note: Figures represent SRE’s pro-rata share of property value as of 31 December 2018
11
320 Pitt Street, Sydney
S$252.0m
45 St Georges, Perth
S$55.9m
Logistic Portfolio, Adelaide
S$106.6m
• Seeking strong recurring cash flow with
value-adding opportunities
• Building an operating platform focusing
on the growing logistics sector
AUSTRALIAAUSTRALIAAUSTRALIAAUSTRALIA
Greater Tokyo Office Fund
(fully divested)
Japan Residential Portfolio
S$268.2m
Japan Value Fund II
S$92.3m
• Two-fold investment focus leveraging on
local access and favourable market trends
• Aggregating a larger income-producing
portfolio with exit optionality
JAPANJAPANJAPANJAPAN
Malaysia Retail Portfolio
S$231.4m
Chongqing
Tokyo
Australia
Malaysia
Osaka
Chongqing Retail Mall
S$161.8m
P R O P E R T Y
P O R T F O L I OF E H HS R E A R A
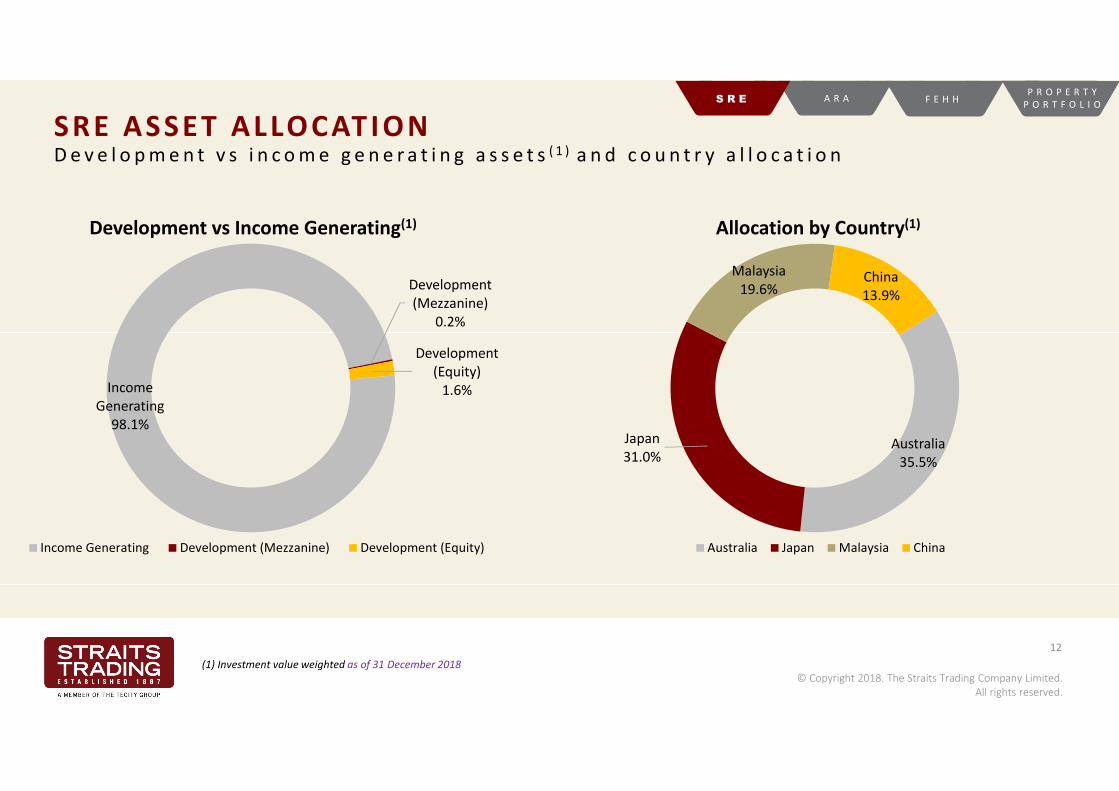
SRE ASSET ALLOCAT I OND e v e l o p m e n t v s i n c o m e g e n e r a t i n g a s s e t s ( 1 ) a n d c o u n t r y a l l o c a t i o n
12
© Copyright 2018. The Straits Trading Company Limited.
All rights reserved.
Income
Generating
98.1%
Development
(Mezzanine)
0.2%
Development
(Equity)
1.6%
Development vs Income Generating(1)
Income Generating Development (Mezzanine) Development (Equity)
Australia
35.5%
Japan
31.0%
Malaysia
19.6%China
13.9%
Allocation by Country(1)
Australia Japan Malaysia China
(1) Investment value weighted as of 31 December 2018
P R O P E R T Y
P O R T F O L I OF E H HS R E A R A
JA PA N S T R AT EGYR e c y c l e c a p i t a l i n t o a s s e t s w i t h h i g h e r g a i n s p o t e n t i a l
13
© Copyright 2019. The Straits Trading Company Limited.
All rights reserved.
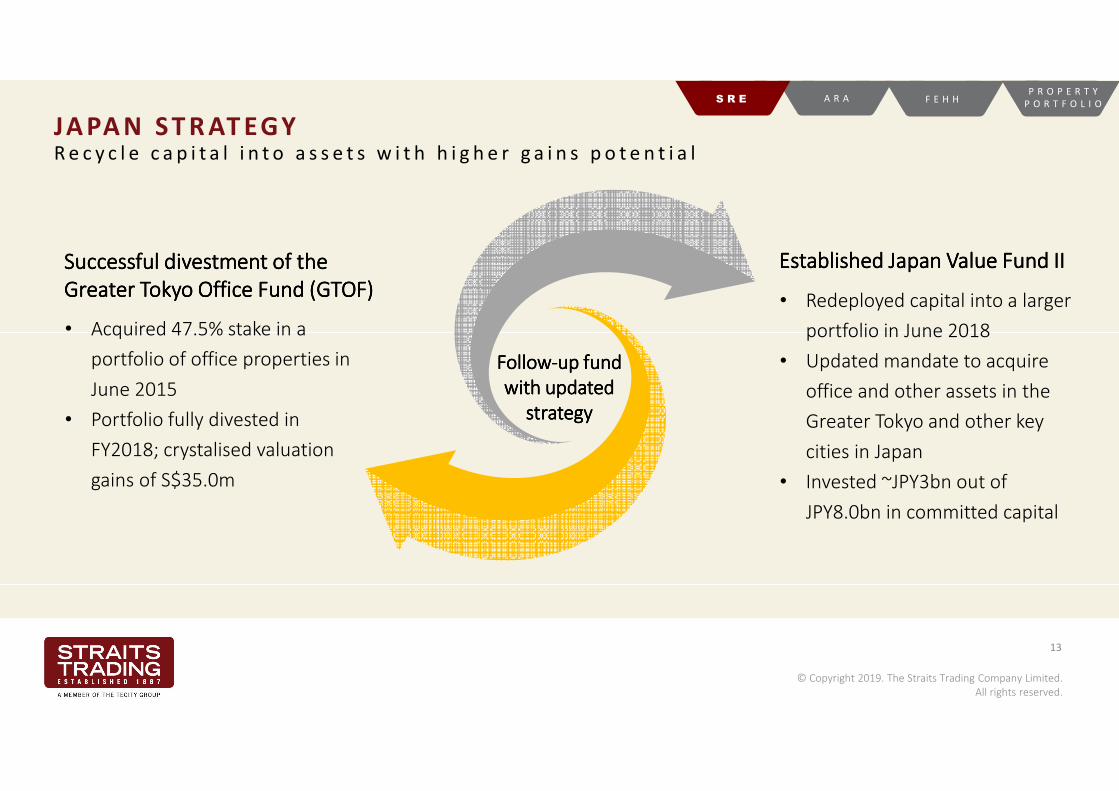
Successful divestment of the Successful divestment of the Successful divestment of the Successful divestment of the
Greater Greater Greater Greater Tokyo Office Fund (GTOFTokyo Office Fund (GTOFTokyo Office Fund (GTOFTokyo Office Fund (GTOF) ) ) )
• Acquired 47.5% stake in a
portfolio of office properties in
June 2015
• Portfolio fully divested in
FY2018; crystalised valuation
gains of S$35.0m
Established Japan Established Japan Established Japan Established Japan Value Fund IIValue Fund IIValue Fund IIValue Fund II
• Redeployed capital into a larger
portfolio in June 2018
• Updated mandate to acquire
office and other assets in the
Greater Tokyo and other key
cities in Japan
• Invested ~JPY3bn out of
JPY8.0bn in committed capital
FollowFollowFollowFollow----up fund up fund up fund up fund
with updated with updated with updated with updated
strategy strategy strategy strategy
P R O P E R T Y
P O R T F O L I OF E H HS R E A R A

JA PA N S T R AT EGY G r o w i n g i n c o m e - p r o d u c i n g r e s i d e n t i a l a s s e t s t o a g g r e g a t e i n t o a l a r g e r p o r t f o l i o
14
© Copyright 2019. The Straits Trading Company Limited.
All rights reserved.
Portfolio of 1,016 units and
growing
• Quality assets located near transport
nodes and key amenities in Greater
Tokyo and Osaka
• Occupancies around 95%
• Cash yield of ~8% (on stabilised basis) 3
5
10
396
612
1,016
0
2
4
6
8
10
12
14
2016 2017 2018
-
200
400
600
800
1,000
1,200
Properties (No.) Units (No.)
P R O P E R T Y
P O R T F O L I OF E H HS R E A R A

AU S T R A L I A S T R AT EGYS e e k i n g a s s e t s w i t h s t r o n g i m m e d i a t e c a s h f l o w a n d v a l u e - a d d i n g o p p o r t u n i t i e s
15
© Copyright 2019. The Straits Trading Company Limited.
All rights reserved.
P R O P E R T Y
P O R T F O L I OF E H HS R E A R A
Added prime located assets in
Sydney & Perth CBD in 2017
320 Pitt Street
(Sydney CBD)
• Ongoing asset
enhancement
works
• Valuation gain of
S$30.0 million
45 St Georges Terrace
(Perth CBD)
• Leveraging on
recovering office
sector
• Occupancies over
90%
Entry into Australia’s vibrant logistics segment• Joint venture with Commercial & General (C&G)
• 80% interest in the initial portfolio of 5 logistics properties; total value AUD137.5m
• Acquiring a build-to-suit project in the “Technology Park” precinct of Mawson Lakes,
South Australia, which will be 100% occupied by a blue-chip tenant on a long term lease
Port Adelaide Property (Incitec Pivot Centre) Salisbury Property (Coca-Cola Amatil)
PropertyPropertyPropertyProperty TenantTenantTenantTenant Area (Area (Area (Area (sqmsqmsqmsqm))))
Port Adelaide Property Incitec Pivot Centre 17,251
Kilkenny Property OI Glass 50,277 (land area)
Bayswater Property Siemens (anchor tenant) 30,555
Salisbury Property Coca-Cola Amatil 46,469
Land Parcel (Salisbury) To be developed 151,900 (land area)

New I nvestment“ B u i l d - t o - c o r e ” s t r a t e g y f o r K o r e a n L o g i s t i c s
16
© Copyright 2019. The Straits Trading Company Limited.
All rights reserved.
P R O P E R T Y
P O R T F O L I OF E H HS R E A R A
Maiden entry into Korea’s vibrant logistics segment• Investment platform agreement with IGIS Asset Management (“IGISIGISIGISIGIS”), one of the largest asset managers in Korea with AUM of ~USD22 billion
• Strong appetite for core logistics assets with transactions at ~5.5% - 6.0% yield
• 94.7% interest in the Investment Vehicle (“REFREFREFREF”) with an initial commitment of ~KRW104.2 billion (~S$120 million)
• Expected portfolio size of up to KRW400 billionKRW400 billionKRW400 billionKRW400 billion (~S$462 million) once capital is fully deployed
Artist’s impression of Seed Asset
SeedSeedSeedSeed AssetAssetAssetAsset FreeholdFreeholdFreeholdFreehold land to develop into a modern 5land to develop into a modern 5land to develop into a modern 5land to develop into a modern 5----storey ramp up logistics facility storey ramp up logistics facility storey ramp up logistics facility storey ramp up logistics facility
OwnershipOwnershipOwnershipOwnership 50% by REF
DescriptionDescriptionDescriptionDescription Located in Incheon, South Korea, approx. 8 km from the air cargo terminal of
Incheon International Airport and accessible via Expressway
LandLandLandLand DetailsDetailsDetailsDetails ~ 62,000 m2; freehold
Land CostLand CostLand CostLand Cost KRW 64.2 billion
GFAGFAGFAGFA ~190,000 m2
ConstructionConstructionConstructionConstruction CostCostCostCost De-risked with guaranteed maximum price with main contractor
Target Completion/TOPTarget Completion/TOPTarget Completion/TOPTarget Completion/TOP Construction to commence in July 2019 and is targeted to complete in FY2021
Aims to develop a scalable logistics portfolio with combined initial capital commitment of S$220 million (together
with logistics platform in Australia)
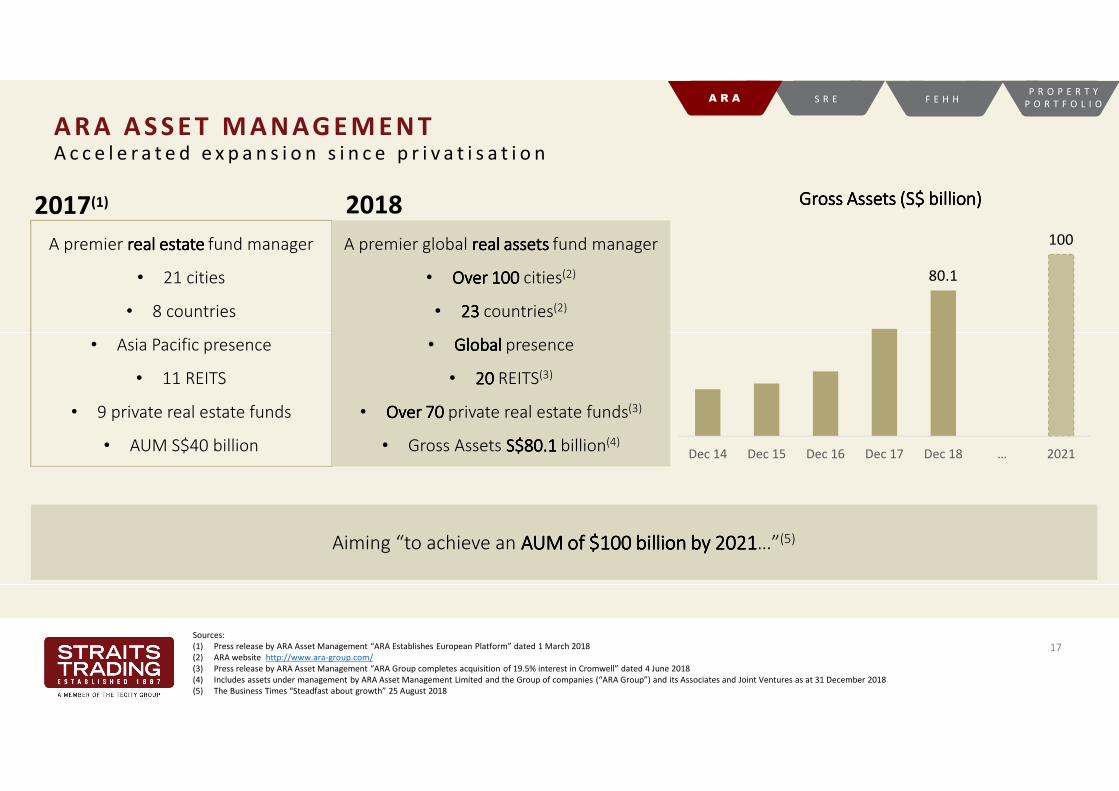
80.1
100
Dec 14 Dec 15 Dec 16 Dec 17 Dec 18 … 2021
A R A A S S E T M A N A G E M E N TA c c e l e r a t e d e x p a n s i o n s i n c e p r i v a t i s a t i o n
Sources:
(1) Press release by ARA Asset Management “ARA Establishes European Platform” dated 1 March 2018
(2) ARA website http://www.ara-group.com/
(3) Press release by ARA Asset Management “ARA Group completes acquisition of 19.5% interest in Cromwell” dated 4 June 2018
(4) Includes assets under management by ARA Asset Management Limited and the Group of companies (“ARA Group”) and its Associates and Joint Ventures as at 31 December 2018
(5) The Business Times “Steadfast about growth” 25 August 2018
Aiming “to achieve an AUM of $100 billion by 2021AUM of $100 billion by 2021AUM of $100 billion by 2021AUM of $100 billion by 2021…”(5)
A premier real estate real estate real estate real estate fund manager
• 21 cities
• 8 countries
• Asia Pacific presence
• 11 REITS
• 9 private real estate funds
• AUM S$40 billion
A premier global real assets real assets real assets real assets fund manager
• Over 100Over 100Over 100Over 100 cities(2)
• 23232323 countries(2)
• GlobalGlobalGlobalGlobal presence
• 20202020 REITS(3)
• Over 70 Over 70 Over 70 Over 70 private real estate funds(3)
• Gross Assets S$80.1S$80.1S$80.1S$80.1 billion(4)
2017(1) 2018 Gross Assets (S$ billion)Gross Assets (S$ billion)Gross Assets (S$ billion)Gross Assets (S$ billion)
P R O P E R T Y
P O R T F O L I OF E H HA R A S R E
17
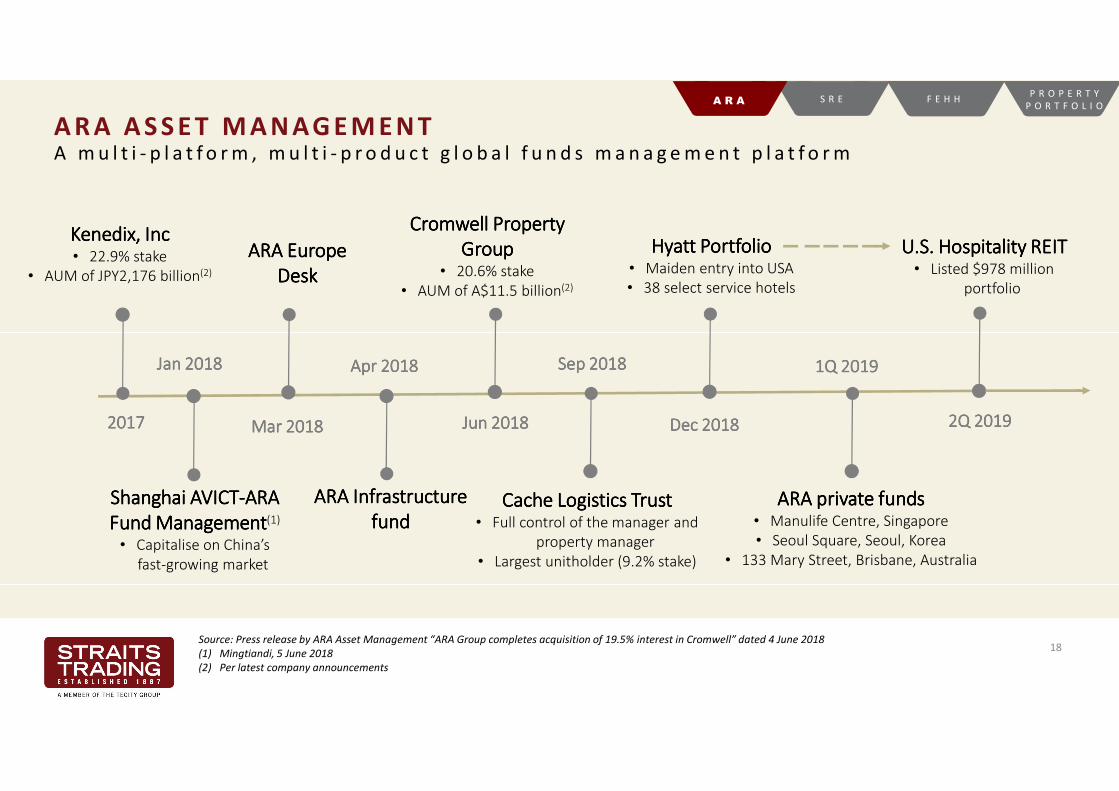
A R A A S S E T M A N A G E M E N TA m u l t i - p l a t f o r m , m u l t i - p r o d u c t g l o b a l f u n d s m a n a g e m e n t p l a t f o r m
Source: Press release by ARA Asset Management “ARA Group completes acquisition of 19.5% interest in Cromwell” dated 4 June 2018
(1) Mingtiandi, 5 June 2018
(2) Per latest company announcements
ARA ARA ARA ARA Infrastructure Infrastructure Infrastructure Infrastructure
fundfundfundfund
ARA Europe ARA Europe ARA Europe ARA Europe
DeskDeskDeskDesk
Cromwell Cromwell Cromwell Cromwell Property Property Property Property
GroupGroupGroupGroup• 20.6% stake
• AUM of A$11.5 billion(2)
Mar 2018Mar 2018Mar 2018Mar 2018 Jun 2018Jun 2018Jun 2018Jun 2018
Shanghai AVICTShanghai AVICTShanghai AVICTShanghai AVICT----ARA ARA ARA ARA
Fund ManagementFund ManagementFund ManagementFund Management(1)
• Capitalise on China’s
fast-growing market
Apr 2018Apr 2018Apr 2018Apr 2018Jan 2018Jan 2018Jan 2018Jan 2018
Hyatt PortfolioHyatt PortfolioHyatt PortfolioHyatt Portfolio• Maiden entry into USA
• 38 select service hotels
Dec 2018Dec 2018Dec 2018Dec 2018
Cache Logistics TrustCache Logistics TrustCache Logistics TrustCache Logistics Trust• Full control of the manager and
property manager
• Largest unitholder (9.2% stake)
Sep 2018Sep 2018Sep 2018Sep 2018
KenedixKenedixKenedixKenedix, , , , IncIncIncInc• 22.9% stake
• AUM of JPY2,176 billion(2)
ARA private fundsARA private fundsARA private fundsARA private funds• Manulife Centre, Singapore
• Seoul Square, Seoul, Korea
• 133 Mary Street, Brisbane, Australia
1Q 20191Q 20191Q 20191Q 2019
2017201720172017 2222Q 2019Q 2019Q 2019Q 2019
U.S. Hospitality REITU.S. Hospitality REITU.S. Hospitality REITU.S. Hospitality REIT• Listed $978 million
portfolio
A R A S R EP R O P E R T Y
P O R T F O L I OF E H H
18

FA R EA S T H O S P I TA L I T Y H O L D I N G SA s c a l a b l e p l a t f o r m t h a t a l l o w s u s t o t a p i n t o g r o w t h i n t h e h o s p i t a l i t y i n d u s t r y
19
© Copyright 2018. The Straits Trading Company Limited.
All rights reserved.
• 70-30 JV between Far East Orchard
Limited and STC
• A premier hotel owner and operator
• Hospitality partnership with Toga Group
• 9 brands across 7 countries and 25 cities
-----------------------------------------------------------
• Launched in FY2018: 4 hotels & serviced
apartments in Australia
• 94 properties with over 14,700 rooms (as
at December 2018)
• Secured contracts for ~2,600 rooms,
including 3 hotels in Sentosa with 839 keys
• Maiden foray into Japan: development of
a 306-key hotel in Ariake, Tokyo
Source: Far East Orchard Limited Investor Presentation, 3 October 2018
P R O P E R T Y
P O R T F O L I OS R EF E H H A R A

FA R EA S T H O S P I TA L I T Y H O L D I N G SB u i l d i n g a s t r o n g e r p i p e l i n e
20
© Copyright 2018. The Straits Trading Company Limited.
All rights reserved.
• 150 properties or
30,000 rooms• 115 properties
• >18,500 rooms
2020(2) 2023 TARGETStrong hospitality Strong hospitality Strong hospitality Strong hospitality
pipeline up to pipeline up to pipeline up to pipeline up to
2020 2020 2020 2020
& beyond& beyond& beyond& beyond(1)(1)(1)(1)
(1) Source: Far East Orchard Limited – Investor presentation posted on SGX on 3 October 2018
(2) Based on signed management contracts as at September 2018
• >94 properties
• >14,700 rooms
2018
Adina Apartment Hotel
Melbourne West End
Australia
Vibe Hotel Darling Harbour
Australia
Adina Apartment Hotel
Freiburg, Germany
Adina Apartment Hotel
Munich, Germany
Village Hotel at Sentosa
Singapore
P R O P E R T Y
P O R T F O L I OS R EF E H H A R A

P R O P E R T Y P O R T F O L I OS i n g a p o r e & M a l a y s i a P r o p e r t y P o r t f o l i o – To m o n e t i s e a n d r e d e p l o y c a p i t a l
© Copyright 2019. The Straits Trading Company Limited.
All rights reserved.
21
• Singapore bungalows and apartments:
S$272.2 million
• Malaysia properties(1): S$44.9 million
• Divested three Gallop Green units in
2018; three more divested during 1st
half of 2019
• Average Good Class Bungalow (GCB)
transacted at S$1,515 psf in 2018,
14% above the S$1,330 psf registered
in 2017(2)
(1) Including STC’s land parcels at Butterworth, Penang
(2) Estimation by RealStar and List Sotheby’s (Source: URA, Business Time articles)
S R EA R AP R O P E R T Y
P O R T F O L I OF E H H
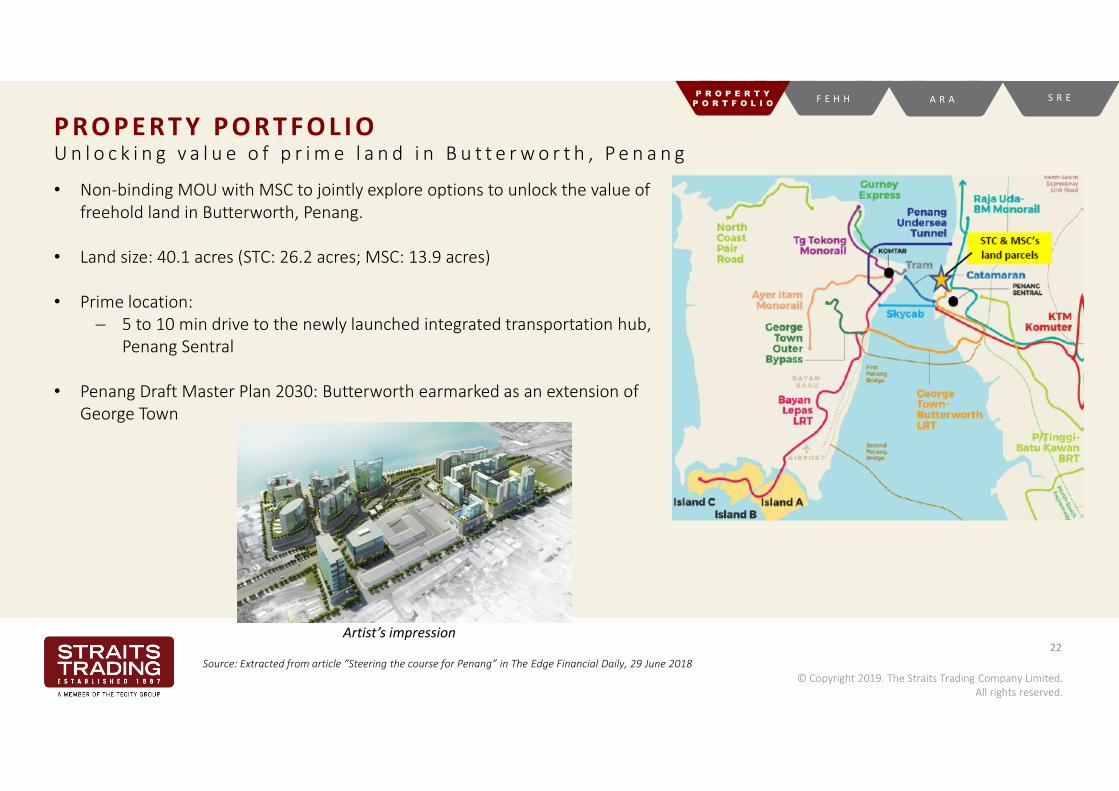
P R O P E R T Y P O R T F O L I OU n l o c k i n g v a l u e o f p r i m e l a n d i n B u t t e r w o r t h , P e n a n g
© Copyright 2019. The Straits Trading Company Limited.
All rights reserved.
22
Source: Extracted from article “Steering the course for Penang” in The Edge Financial Daily, 29 June 2018
• Non-binding MOU with MSC to jointly explore options to unlock the value of
freehold land in Butterworth, Penang.
• Land size: 40.1 acres (STC: 26.2 acres; MSC: 13.9 acres)
• Prime location:
─ 5 to 10 min drive to the newly launched integrated transportation hub,
Penang Sentral
• Penang Draft Master Plan 2030: Butterworth earmarked as an extension of
George Town
S R EA R AP R O P E R T Y
P O R T F O L I OF E H H
Artist’s impression
B U S I N E S S H I G H L I G H T S
RESOURCES23

M A L AYS I A S M E LT I N G C O R P O R AT I O N
Largest Independent Custom Tin SmelterLargest Independent Custom Tin SmelterLargest Independent Custom Tin SmelterLargest Independent Custom Tin SmelterProduction of 27,085 tonnes of tin in 2018,
approximately 7.5% of total global supply(1)
Malaysia’s Malaysia’s Malaysia’s Malaysia’s Largest Tin MineLargest Tin MineLargest Tin MineLargest Tin MineMine production up 6% to 2,355 tonnes at Rahman
Hydraulic Tin mine (RHT) in 2018, accounting for >60%
of Malaysia’s output(1)
© Copyright 2019. The Straits Trading Company Limited.
All rights reserved.
24
Stronger Financial Performance in FY2018 and 1Q2019Stronger Financial Performance in FY2018 and 1Q2019Stronger Financial Performance in FY2018 and 1Q2019Stronger Financial Performance in FY2018 and 1Q2019• FY2018 net profit more than doubled to RM34.3 million from improved
operating efficiencies of tin smelting segment
• Net profit for 1Q2019 rose by 88% to RM8.6 million, due largely to sustained
yield improvement
(1) Source: International Tin Association (ITA)
Source: The Business Times, 31 Dec 2018
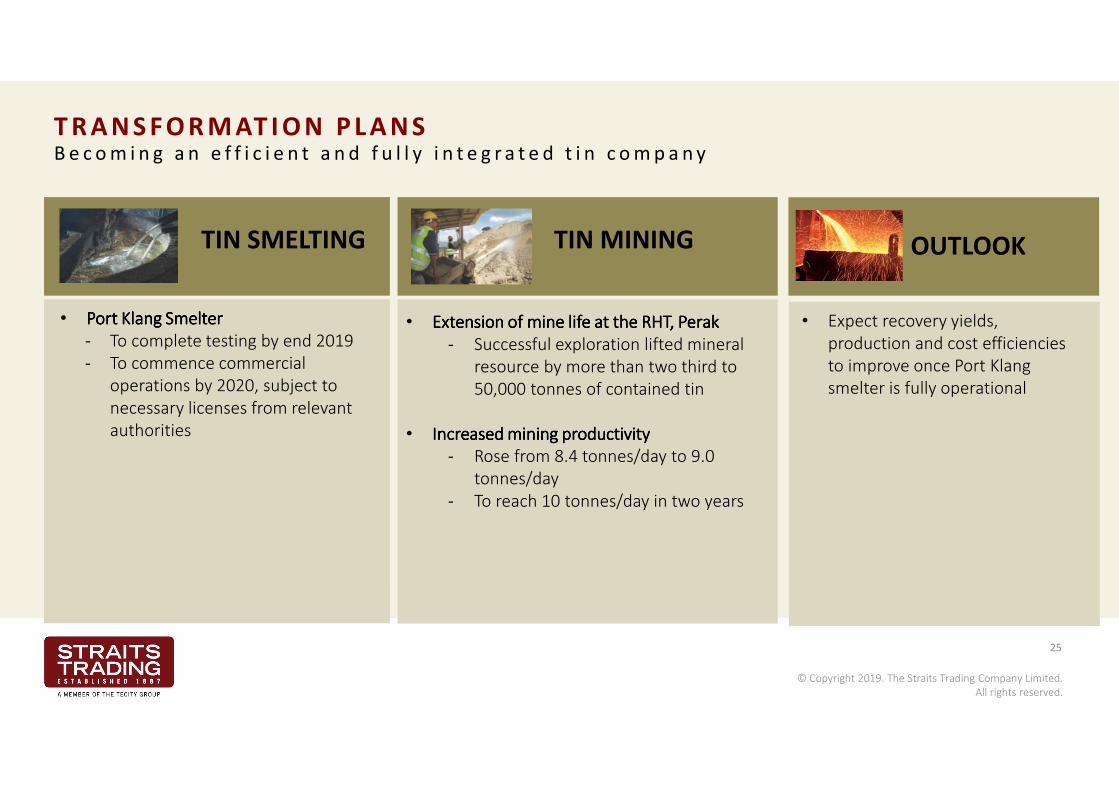
T R A N S F O R M AT I O N P L A N S B e c o m i n g a n e f f i c i e n t a n d f u l l y i n t e g r a t e d t i n c o m p a n y
25
© Copyright 2019. The Straits Trading Company Limited.
All rights reserved.
• Port Port Port Port KlangKlangKlangKlang SmelterSmelterSmelterSmelter
- To complete testing by end 2019
- To commence commercial
operations by 2020, subject to
necessary licenses from relevant
authorities
TIN SMELTING
• Extension of mine life at the RHT, Perak Extension of mine life at the RHT, Perak Extension of mine life at the RHT, Perak Extension of mine life at the RHT, Perak
- Successful exploration lifted mineral
resource by more than two third to
50,000 tonnes of contained tin
• Increased mining productivityIncreased mining productivityIncreased mining productivityIncreased mining productivity
- Rose from 8.4 tonnes/day to 9.0
tonnes/day
- To reach 10 tonnes/day in two years
TIN MINING OUTLOOK
• Expect recovery yields,
production and cost efficiencies
to improve once Port Klang
smelter is fully operational

F I N A N C I A L H I G H L I G H T S1 Q 2 0 1 9 a n d F Y 2 0 1 8
26

5 - Y EA R G R O U P F I N A N C I A L H I G H L I G H T S
27
S$’mS$’mS$’mS$’mFY 2018FY 2018FY 2018FY 2018 FY 2017 FY 2017 FY 2017 FY 2017
(Restated)*(Restated)*(Restated)*(Restated)*
FY 2016FY 2016FY 2016FY 2016 FY 2015FY 2015FY 2015FY 2015 FY 2014FY 2014FY 2014FY 2014
EBITDA 133.4 85.8 119.1 30.5 58.8
EBIT 126.8 80.2 114.4 26.6 55.1
Profit before tax 99.6 57.5 94.9 10.9 25.4
PATNCI 71.7 46.4 67.3 8.5 18.6
EPS (cents) 17.6 11.4 16.5 2.1 4.6
Net gearing (%) 38.8 25.9 22.5 22.8 Net cash
*Restated following adoption of new financial reporting framework, Singapore Financial Reporting Standards (International)

G R O U P F I N A N C I A L H I G H L I G H T S
© Copyright 2019. The Straits Trading Company Limited.
All rights reserved.
28*Restated following adoption of new financial reporting framework, Singapore Financial Reporting Standards (International)
S$’mS$’mS$’mS$’m 1111Q 2019Q 2019Q 2019Q 2019 1111QQQQ 2018201820182018 % change% change% change% change FY 2018FY 2018FY 2018FY 2018FY FY FY FY 2017 2017 2017 2017
(Restated)(Restated)(Restated)(Restated)****% change% change% change% change
EBITDA 30.930.930.930.9 21.3 45.0% 133.4133.4133.4133.4 85.8 55.4
EBIT 29.229.229.229.2 19.6 49.1% 126.8126.8126.8126.8 80.2 58.1
Profit before tax 22.322.322.322.3 13.1 69.5% 99.699.699.699.6 57.5 73.4
PATNCI 17.317.317.317.3 9.7 78.1% 71.771.771.771.7 46.4 54.5
EPS (cents) 4.24.24.24.2 2.4 75.0% 17.617.617.617.6 11.4 54.4
• PATNCI rose 78% to S$17.3 million for the first quarter PATNCI rose 78% to S$17.3 million for the first quarter PATNCI rose 78% to S$17.3 million for the first quarter PATNCI rose 78% to S$17.3 million for the first quarter of of of of 2019 2019 2019 2019
• PATNCI PATNCI PATNCI PATNCI of S$71.7 million for of S$71.7 million for of S$71.7 million for of S$71.7 million for full year 2018 is the highest full year 2018 is the highest full year 2018 is the highest full year 2018 is the highest since since since since 2014201420142014

G R O U P F I N A N C I A L H I G H L I G H T SS t r o n g f i n a n c i a l p o s i t i o n a n d p r u d e n t f i n a n c i a l m e t r i c s
29
© Copyright 2019. The Straits Trading Company Limited.
All rights reserved.
S$mS$mS$mS$m 31313131 MarMarMarMar 2019201920192019 31 Dec 2018
Cash and short-term deposits 309.3309.3309.3309.3 244.9
Total assets 2,645.62,645.62,645.62,645.6 2,576.3
Total borrowings 898.6898.6898.6898.6 864.5
Total liabilities 1,037.51,037.51,037.51,037.5 977.7
Total equity 1,608.11,608.11,608.11,608.1 1,598.6
NAV/share (S$) 3.623.623.623.62 3.60
Net debt/Total equity 36.6%36.6%36.6%36.6% 38.8%
EBITDA/Interest expenses 4.454.454.454.45 4.91

PAT N C I BY B U S I N ES S S EG M E N T SM a i n d r i v e r s o f p r o f i t a b i l i t y - R e a l E s t a t e s e g m e n t a n d S R E
30
© Copyright 2018. The Straits Trading Company Limited.
All rights reserved.
Resources Real Estate Hospitality Corporate cum
Treasury
Expenses
Total
2.1
44.9
3.2
(3.9)
46.4
6.7
69.2
0.4
(4.6)
71.7
FULL YEAR PATNCI (S$ million)FULL YEAR PATNCI (S$ million)FULL YEAR PATNCI (S$ million)FULL YEAR PATNCI (S$ million)
FY2017 FY2018
Resources Real Estate Hospitality Corporate cum
Treasury
(Expenses)/Income
Total
0.8
8.8
0.8
(0.7)
9.7
1.3
12.4
1.9 1.7
17.3
1111Q Q Q Q PATNCI (S$ million)PATNCI (S$ million)PATNCI (S$ million)PATNCI (S$ million)
1Q2018 1Q2019

PAT B R EA K D OW N : R EA L ES TAT E S EG M E N TT h e d r i v e r s o f p r o f i t a b i l i t y
31* Others comprise mainly Group-level finance costs and overheads
© Copyright 2019. The Straits Trading Company Limited.
All rights reserved.
• The Real Estate Segment will continue to be the drivers of profitability including that from ARA
0.0
20.0
SRE ARA Suntec STC‘s
Property
Portfolio
Others* Total
2.2
11.4
2.1 (0.1 )
(2.8)
12.8 12.8 12.8 12.8
1Q2019 1Q2019 1Q2019 1Q2019 (S(S(S(S$ million)$ million)$ million)$ million)
0.0
20.0
SRE ARA Suntec STC's
Property
Portfolio
Others* Total
3.0
3.4
2.6
2.0 (1.6)
9.4 9.4 9.4 9.4
1Q2018 (S$ million)1Q2018 (S$ million)1Q2018 (S$ million)1Q2018 (S$ million)

$1,911.7 m,
72%
$311.0 m,
12%
$184.1 m,
7%
$238.7 m,
9%
Real Estate Resources Hospitality Others*
TOTA L A S S E T SS $ 2 . 6 5 b i l l i o n i n t o t a l a s s e t s a s o f M a r 2 0 1 9 ( D e c 2 0 1 8 : S $ 2 . 5 8 b i l l i o n ) 7 9 % f r o m r e a l e s t a t e a n d h o s p i t a l i t y s e g m e n t s
32
* Others comprise mainly Group-level cash, separate account portfolio
© Copyright 2019. The Straits Trading Company Limited.
All rights reserved.
As at
31 March 2019
SRE ARA STC's Property
Portfolio
Suntec Other Liquid
Assets
261.5
629.7
153.1
366.5 317.1156.4 27.4
1,044.3
Real Estate Assets Breakdown (S$ million)Real Estate Assets Breakdown (S$ million)Real Estate Assets Breakdown (S$ million)Real Estate Assets Breakdown (S$ million)
� Cash & others
� Chongqing Mall, 45 St Georges Terrace, logistics assets & Japan residential properties
� Harmony III, GTOF, JVF II, SDF & 320 Pitt St

N E T A S S E T VA LU E P E R S H A R ES t o c k p r i c e i s c u r r e n t l y t r a d i n g a t a d i s c o u n t t o o u r i n t r i n s i c v a l u e
© Copyright 2018. The Straits Trading Company Limited.
All rights reserved.
33* Closing price as at the last trading day of the financial year / period
5.19
5.95 6.06 6.15 6.096.37 6.50 6.40 6.54
6.94 6.98 7.06
3.67 3.43 3.52
3.59
3.493.23
3.32 3.18 3.343.62 3.60 3.62
4.26 4.15 4.09
3.48
3.70 3.57
2.91 2.04 1.952.34
2.04 2.22
0.0
1.0
2.0
3.0
4.0
5.0
6.0
7.0
8.0
FY2008 FY2009 FY2010 FY2011 FY2012 FY2013 FY2014 FY2015 FY2016 FY2017 FY2018 1Q2019
NAV (including cumulative dividends paid)/Share (S$) NAV/Share (S$) Share Price (S$)*

D I V I D E N D R EC O R DR i s i n g d i v i d e n d s r e f l e c t s i m p r o v e m e n t i n o u r b u s i n e s s
150.0 100.0 50.0
2.0 2.0 2.0
4.0 4.0 4.0 4.0 4.0
6.0 6.0 6.0
0.0
1.0
2.0
3.0
4.0
5.0
6.0
7.0
0.0
20.0
40.0
60.0
80.0
100.0
120.0
140.0
160.0
FY08 FY09 FY10 FY11 FY12 FY13 FY14 FY15 FY16 FY17 FY18
INT
ER
IM (
Ce
nts
)IN
TE
RIM
(C
en
ts)
INT
ER
IM (
Ce
nts
)IN
TE
RIM
(C
en
ts)
SPE
CIA
L (C
en
ts)
SPE
CIA
L (C
en
ts)
SPE
CIA
L (C
en
ts)
SPE
CIA
L (C
en
ts)
Dividend Per Share Dividend Per Share Dividend Per Share Dividend Per Share
Special Interim
Divested WBL
Sale of investments and marketable
securities post strategic review
Divested non-core
residential properties
34
© Copyright 2018. The Straits Trading Company Limited.
All rights reserved.
35
© Copyright 2019. The Straits Trading Company Limited.
All rights reserved.
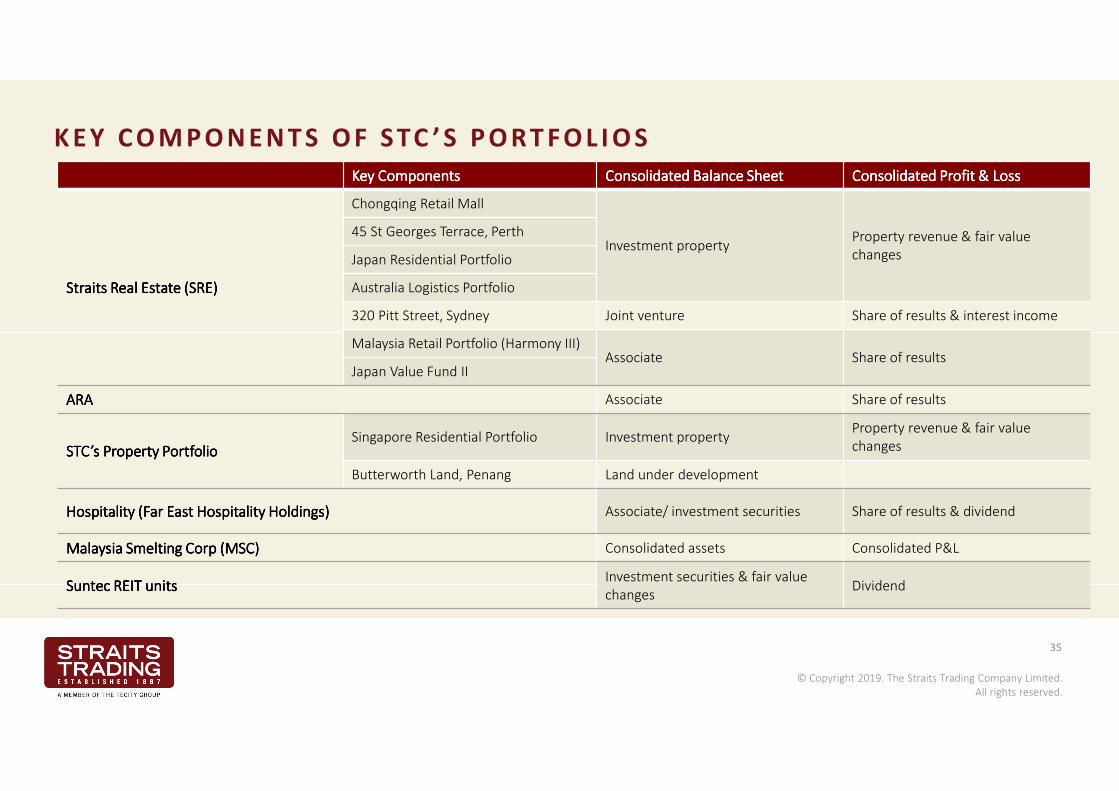
K E Y C O M P O N E N T S O F S TC ’ S P O R T F O L I O S
Key ComponentsKey ComponentsKey ComponentsKey Components Consolidated BalanceConsolidated BalanceConsolidated BalanceConsolidated Balance SheetSheetSheetSheet ConsolidatedConsolidatedConsolidatedConsolidated Profit & LossProfit & LossProfit & LossProfit & Loss
Straits Real Estate (SRE)Straits Real Estate (SRE)Straits Real Estate (SRE)Straits Real Estate (SRE)
Chongqing Retail Mall
Investment propertyProperty revenue & fair value
changes
45 St Georges Terrace, Perth
Japan Residential Portfolio
Australia Logistics Portfolio
320 Pitt Street, Sydney Joint venture Share of results & interest income
Malaysia Retail Portfolio (Harmony III)Associate Share of results
Japan Value Fund II
ARAARAARAARA Associate Share of results
STC’s Property PortfolioSTC’s Property PortfolioSTC’s Property PortfolioSTC’s Property PortfolioSingapore Residential Portfolio Investment property
Property revenue & fair value
changes
Butterworth Land, Penang Land under development
Hospitality (Far East Hospitality Holdings)Hospitality (Far East Hospitality Holdings)Hospitality (Far East Hospitality Holdings)Hospitality (Far East Hospitality Holdings) Associate/ investment securities Share of results & dividend
Malaysia Smelting Corp (MSC)Malaysia Smelting Corp (MSC)Malaysia Smelting Corp (MSC)Malaysia Smelting Corp (MSC) Consolidated assets Consolidated P&L
SuntecSuntecSuntecSuntec REIT unitsREIT unitsREIT unitsREIT unitsInvestment securities & fair value
changesDividend
A P P E N D I X
36

C O R P O R AT E S T R U C T U R EStructured to implement our strategy as a capital allocator
37* Aggregate interest in Suntec REIT including deemed interest through ARA group companies
The Tecity Group
ARA Asset Management
Limited (“ARA”) Suntec REIT
Far East Hospitality Holdings
Pte. Ltd. (“FEHH”)Malaysia Smelting
Corporation Bhd. (“MSC”)
89.5%89.5%89.5%89.5% 21.021.021.021.0%%%% 9.8%*9.8%*9.8%*9.8%* 30.0%30.0%30.0%30.0% 54.8%54.8%54.8%54.8%
70.0%70.0%70.0%70.0%
REAL ESTATEREAL ESTATEREAL ESTATEREAL ESTATE HOSPITALITYHOSPITALITYHOSPITALITYHOSPITALITY RESOURCESRESOURCESRESOURCESRESOURCES
One of the largest REITs in
SingaporeA global real estate and real
asset fund manager
A co-investment vehicle with John
Lim family office to seek out real
estate related investments and
opportunities globally
An established international
hospitality owner and operator Largest independent custom
tin smelter in the world
Straits Real Estate Pte. Ltd.
(“SRE”)
© Copyright 2019. The Straits Trading Company Limited.
All rights reserved.

B U S I N ES S T R A N S F O R M AT I O N S I N C E 2 0 0 8R e d e f i n i n g f o c u s a n d m a k i n g n e w i n v e s t m e n t s
38
2011
• Divested low-yielding residential
properties
• Divested non-tin assets to refocus
on core tin business
• Secondary listing of MSCMSCMSCMSC on SGX
2013
• FEHHFEHHFEHHFEHH was formed via a JV with Far
East Orchard
• Acquires 20.1% stake in ARAARAARAARA
• SRESRESRESRE established with John Lim
• Sold c. 41% stake in WBL realizing
S$508m in cash proceeds
2010
Repositioned MSCMSCMSCMSC as a
vertically integrated tin
company
2014
• Sold Straits Trading Building for S$450m
• SRESRESRESRE committed US$80m towards ARA Summit
Development Fund I
• FEHHFEHHFEHHFEHH entered Europe
• MSCMSCMSCMSC bought 80% of SL Tin (a 15-yr mining lease in
Pahang, Malaysia)
• SRESRESRESRE acquired My Place (悅地) mall in Chongqing, China
2015
• SRESRESRESRE acquired 47.5% stake in Cordea
Savills Greater Tokyo Office Fund
• SRESRESRESRE committed S$72.8m to ARA
Harmony Fund III (retail assets in
Malaysia)
• SRESRESRESRE bought 114 William St (114WS)
in Melbourne
2016
• SRESRESRESRE harvested its first
investment 114WS and
recycles the capital
• SRESRESRESRE begins acquiring
residential properties in Japan
• MSCMSCMSCMSC acquired Port Klang
smelter
2017
• ARAARAARAARA privatised and accelerates
expansion
• Launched NikkoAM-Straits Trading REIT
ETF
• SRESRESRESRE added to its Japanese residential
portfolio
• SRESRESRESRE bought 320 Pitt Street in Sydney and
45 St Georges Terrace in Perth
2018
• SRESRESRESRE continues to accumulate
Japan residential portfolio
• SRESRESRESRE subscribed into Savills Japan
Value Fund II (committed capital of
JPY8B)
• SRESRESRESRE acquired logistics assets in
Australia; JV with Commercial &
General
• Exploring options to unlock value
Butterworth land
2012
Acquired
Rendezvous Grand
Hotel Melbourne

THANK YOU


