STCE Newsletter 6 Jan 2014 - 12 Jan 2014 Page 1 of 17 STCE Newsletter 6 Jan 2014 - 12 Jan 2014 Published by the STCE - this issue : 16 Jan 2014. Available online at http://www.stce.be/newsletter/ . The Solar-Terrestrial Centre of Excellence (STCE) is a collaborative network of the Belgian Institute for Space Aeronomy, the Royal Observatory of Belgium and the Royal Meteorological Institute of Belgium. Content Page 1. Stupendous NOAA 1944! (6 Jan 2014 - 12 Jan 2014) 2 2. PROBA2 Observations (6 Jan 2014 - 12 Jan 2014) 6 3. Review of solar activity (6 Jan 2014 - 12 Jan 2014) 9 4. Noticeable Solar Events (6 Jan 2014 - 12 Jan 2014) 12 5. Review of geomagnetic activity (6 Jan 2014 - 12 Jan 2014) 13 6. Geomagnetic Observations at Dourbes (6 Jan 2014 - 12 Jan 2014) 16 7. Review of ionospheric activity (6 Jan 2014 - 12 Jan 2014) 16 Final Editor : Petra Vanlommel Contact : R. Van der Linden, General Coordinator STCE, Ringlaan - 3 - Avenue Circulaire, 1180 Brussels, Belgium
Transcript
STCE Newsletter 6 Jan 2014 - 12 Jan 2014 Page 1 of 17
STCE Newsletter
6 Jan 2014 - 12 Jan 2014
Published by the STCE - this issue : 16 Jan 2014. Available onlineat http://www.stce.be/newsletter/ .
The Solar-Terrestrial Centre of Excellence (STCE) is acollaborative network of the Belgian Institute for SpaceAeronomy, the Royal Observatory of Belgium and the RoyalMeteorological Institute of Belgium.
Content Page
1. Stupendous NOAA 1944! (6 Jan 2014 - 12 Jan 2014) 2
2. PROBA2 Observations (6 Jan 2014 - 12 Jan 2014) 6
3. Review of solar activity (6 Jan 2014 - 12 Jan 2014) 9
4. Noticeable Solar Events (6 Jan 2014 - 12 Jan 2014) 12
5. Review of geomagnetic activity (6 Jan 2014 - 12 Jan 2014) 13
6. Geomagnetic Observations at Dourbes (6 Jan 2014 - 12 Jan 2014) 16
7. Review of ionospheric activity (6 Jan 2014 - 12 Jan 2014) 16
Final Editor : Petra VanlommelContact : R. Van der Linden, General Coordinator STCE,
STCE Newsletter 6 Jan 2014 - 12 Jan 2014 Page 2 of 17
1. Stupendous NOAA 1944! (6 Jan 2014 - 12 Jan 2014)
Without a doubt, the big and complex sunspot group NOAA 1944 was the talk of the week. During itstransit over the solar disk (1-14 January), it produced 1 X- and 7 M-class solar flares. Here we will dealwith some of the more enigmatic aspects of the group's size and the X-class flare it produced.
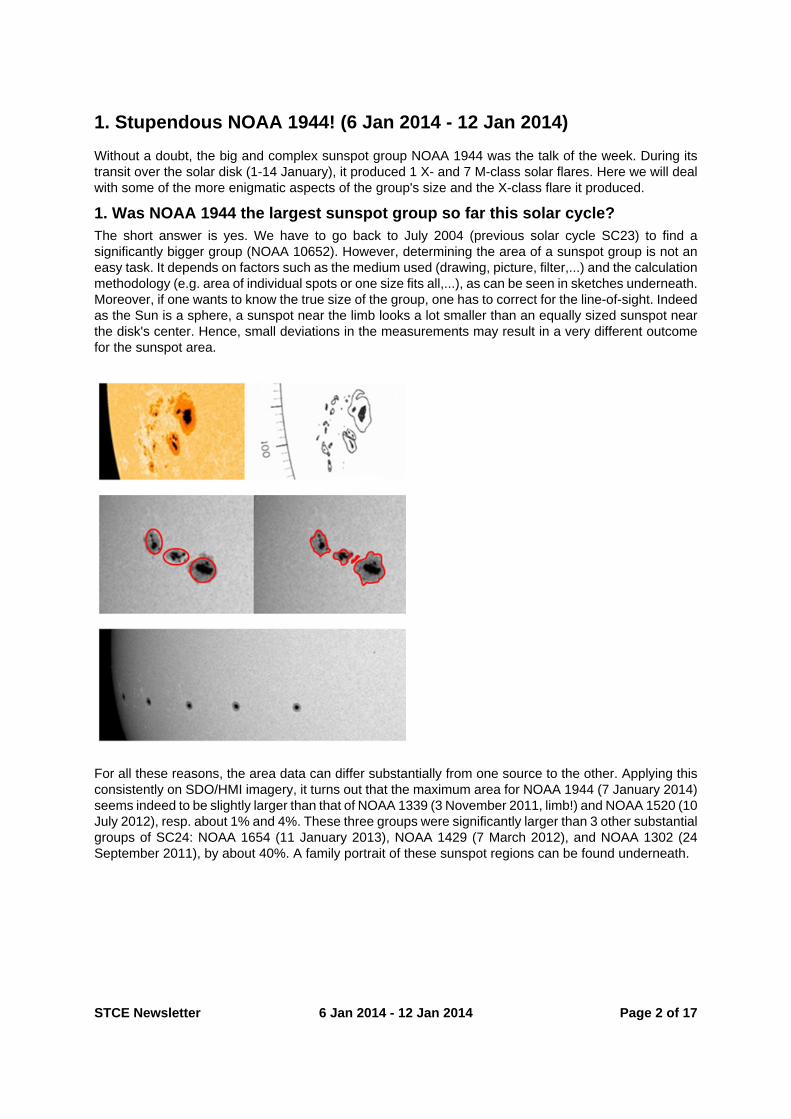
1. Was NOAA 1944 the largest sunspot group so far this solar cycle?The short answer is yes. We have to go back to July 2004 (previous solar cycle SC23) to find asignificantly bigger group (NOAA 10652). However, determining the area of a sunspot group is not aneasy task. It depends on factors such as the medium used (drawing, picture, filter,...) and the calculationmethodology (e.g. area of individual spots or one size fits all,...), as can be seen in sketches underneath.Moreover, if one wants to know the true size of the group, one has to correct for the line-of-sight. Indeedas the Sun is a sphere, a sunspot near the limb looks a lot smaller than an equally sized sunspot nearthe disk's center. Hence, small deviations in the measurements may result in a very different outcomefor the sunspot area.
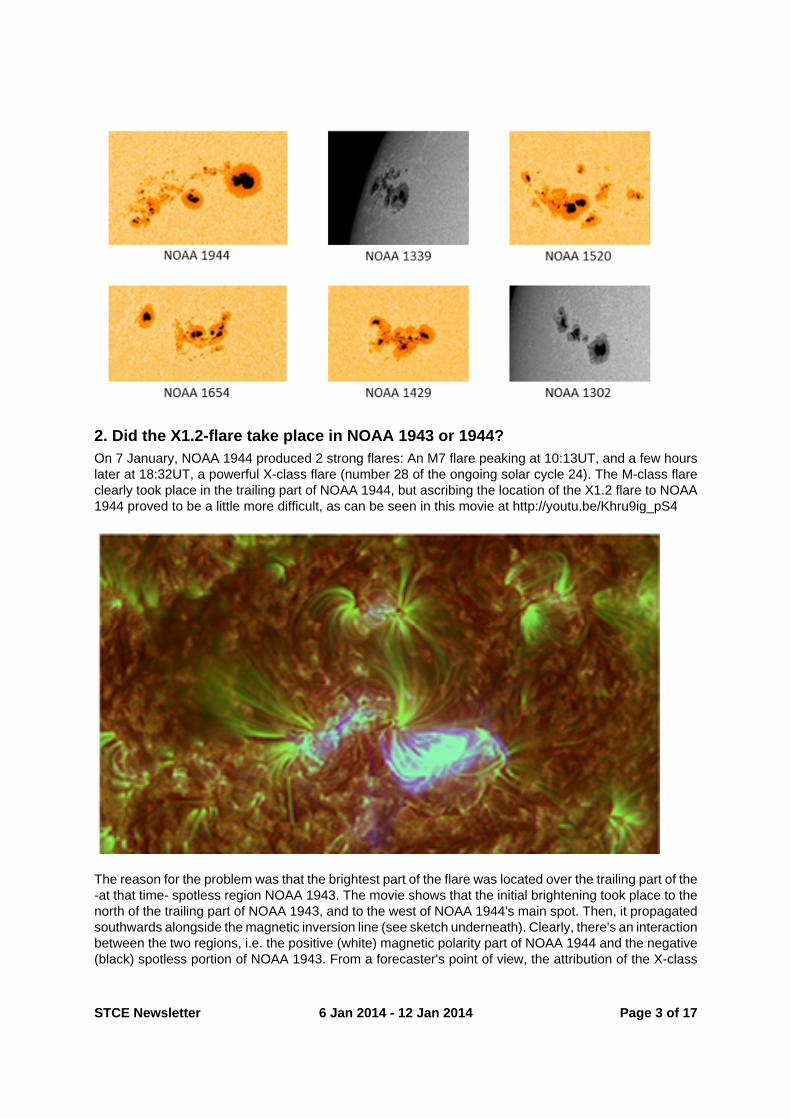
For all these reasons, the area data can differ substantially from one source to the other. Applying thisconsistently on SDO/HMI imagery, it turns out that the maximum area for NOAA 1944 (7 January 2014)seems indeed to be slightly larger than that of NOAA 1339 (3 November 2011, limb!) and NOAA 1520 (10July 2012), resp. about 1% and 4%. These three groups were significantly larger than 3 other substantialgroups of SC24: NOAA 1654 (11 January 2013), NOAA 1429 (7 March 2012), and NOAA 1302 (24September 2011), by about 40%. A family portrait of these sunspot regions can be found underneath.
STCE Newsletter 6 Jan 2014 - 12 Jan 2014 Page 3 of 17
2. Did the X1.2-flare take place in NOAA 1943 or 1944?On 7 January, NOAA 1944 produced 2 strong flares: An M7 flare peaking at 10:13UT, and a few hourslater at 18:32UT, a powerful X-class flare (number 28 of the ongoing solar cycle 24). The M-class flareclearly took place in the trailing part of NOAA 1944, but ascribing the location of the X1.2 flare to NOAA1944 proved to be a little more difficult, as can be seen in this movie at http://youtu.be/Khru9ig_pS4
The reason for the problem was that the brightest part of the flare was located over the trailing part of the-at that time- spotless region NOAA 1943. The movie shows that the initial brightening took place to thenorth of the trailing part of NOAA 1943, and to the west of NOAA 1944's main spot. Then, it propagatedsouthwards alongside the magnetic inversion line (see sketch underneath). Clearly, there's an interactionbetween the two regions, i.e. the positive (white) magnetic polarity part of NOAA 1944 and the negative(black) spotless portion of NOAA 1943. From a forecaster's point of view, the attribution of the X-class
STCE Newsletter 6 Jan 2014 - 12 Jan 2014 Page 4 of 17
flare to NOAA 1944 is certainly a great decision. Indeed, it avoids exceedingly high probabilities on X-class flares for future spotless active regions! But on what exactly happened during the 7 January eventin the solar corona, the jury is still out.
3. Is the X1.2 proton flare considered as a separate proton event?The issue here is that proton flares are not considered as separate events if the proton flux (particleenergies larger than 10 MeV) at the time of the event is still above the threshold of 10 protons per fluxunit (pfu). A nice example is the sunspot group NOAA 10720 from January 2005 (very similar in size asNOAA 1944): There was one single proton event covering 3 strong X-class solar flares (all from NOAA10720) that kept the proton flux well above the 10-pfu-threshold for nearly a week (16-22 January 2005)!
STCE Newsletter 6 Jan 2014 - 12 Jan 2014 Page 5 of 17
In the case of the 7 January X1-flare, the proton flux was already elevated due to a flare from NOAA1936 which had rounded the west solar limb 2 days before (so not visible anymore from Earth!). Asa result, this flare did not leave an x-ray signature, but the protons started to increase the flux on 6January at 08:20UT. The flux peaked already at 42 pfu in the afternoon of the same day. The flux onlygradually decreased, and by the time it started to increase again due to the X1-flare (around 19:00UTthe next day), it was still slightly above the event threshold. However, at one data-point (16:30UT), it haddipped just below the threshold. So technically, this can be considered as a separate proton flare. Theproton events are currently listed as separate items on the NOAA's Solar Energetic Particle page (http://umbra.nascom.nasa.gov/SEP/ ). In the end, the proton flux rose to 1033 pfu, making it the strongestevent since 22-25 May 2013.
Credits - Data and imagery were taken from SDO (http://sdo.gsfc.nasa.gov/), SOHO(http://sohowww.nascom.nasa.gov/ ), Kanzelhohe (http://cesar.kso.ac.at/), NOAA/GOES (http://
STCE Newsletter 6 Jan 2014 - 12 Jan 2014 Page 6 of 17
www.swpc.noaa.gov/ftpdir/lists/particle/), and NOAA/SESC (http://umbra.nascom.nasa.gov/SEP/).Tools used were STAFF (http://www.staff.oma.be/#) and (J)Helioviewer (http://www.helioviewer.org/).
2. PROBA2 Observations (6 Jan 2014 - 12 Jan 2014)
Solar ActivitySolar flare activity fluctuated between low and high during the week.In order to view the activity of this week in more detail, we suggest to go to the following website fromwhich all the daily (normal and difference) movies can be accessed: http://proba2.oma.be/ssaThis page also lists the recorded flaring events.A weekly overview movie can be found here (SWAP week 198).http://proba2.oma.be/swap/data/mpg/movies/WeeklyReportMovies/WR198_Jan06_Jan12/weekly_movie_2014_01_06.mp4Details about some of this week's events, can be found further below.
Monday Jan 06:
Eruption on the north east limb @ 06:23 SWAP difference imageFind a movie of the events here (SWAP difference movie)http://proba2.oma.be/swap/data/mpg/movies/WeeklyReportMovies/WR198_Jan06_Jan12/Events/20140106_Eruption_NortEastLimb_0623_swap_diff.mp4Find a movie of the events here (SWAP movie)http://proba2.oma.be/swap/data/mpg/movies/WeeklyReportMovies/WR198_Jan06_Jan12/Events/20140106_Eruption_NortEastLimb_0623_swap_movie.mp4
STCE Newsletter 6 Jan 2014 - 12 Jan 2014 Page 7 of 17
Eruption on the west limb @ 07:52 SWAP difference imageFind a movie of the events here (SWAP difference movie)http://proba2.oma.be/swap/data/mpg/movies/WeeklyReportMovies/WR198_Jan06_Jan12/Events/20140106_Eruption_WestLimb_0752_swap_diff.mp4Find a movie of the events here (SWAP movie)http://proba2.oma.be/swap/data/mpg/movies/WeeklyReportMovies/WR198_Jan06_Jan12/Events/20140106_Eruption_WestLimb_0752_swap_movie.mp4
STCE Newsletter 6 Jan 2014 - 12 Jan 2014 Page 8 of 17
Tuesday Jan 07:
Xflare and eitwave on the south half @ 18:11 SWAP difference imageFind a movie of the events here (SWAP difference movie)http://proba2.oma.be/swap/data/mpg/movies/WeeklyReportMovies/WR198_Jan06_Jan12/Events/20140107_XflareEitwave_SouthHalf_1811_swap_diff.mp4Find a movie of the events here (SWAP movie)http://proba2.oma.be/swap/data/mpg/movies/WeeklyReportMovies/WR198_Jan06_Jan12/Events/20140107_XflareEitwave_SouthHalf_1811_swap_movie.mp4
STCE Newsletter 6 Jan 2014 - 12 Jan 2014 Page 9 of 17
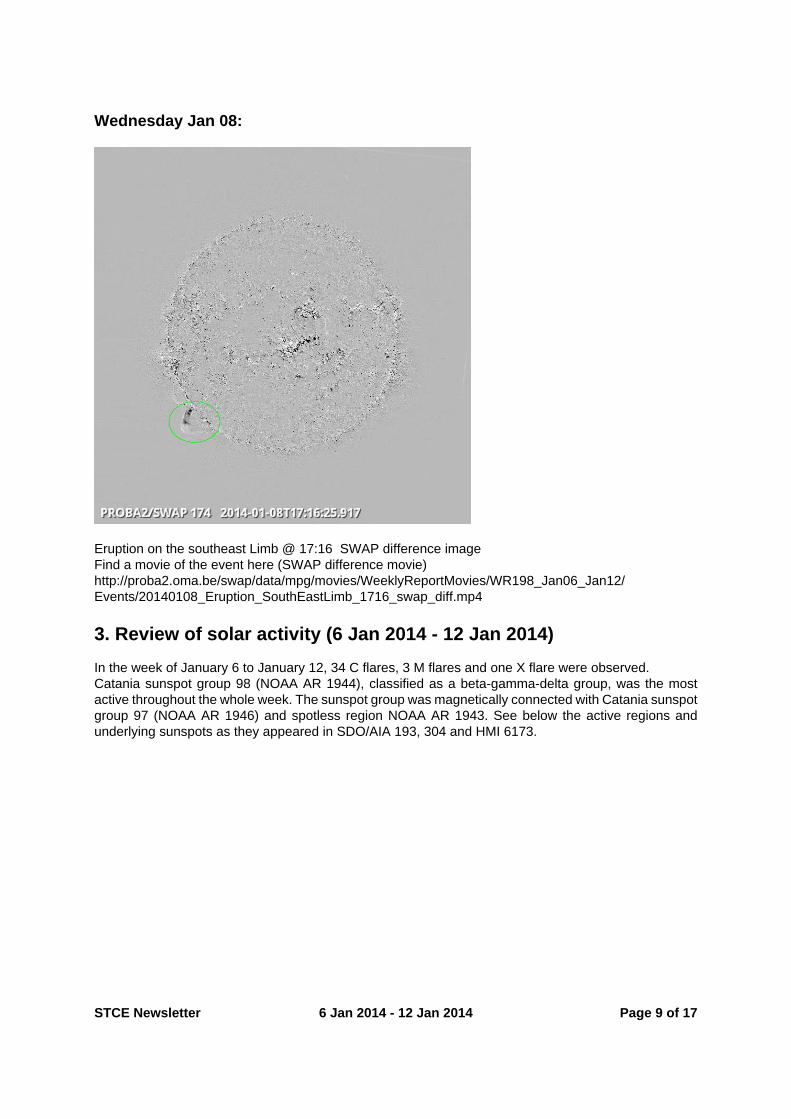
Wednesday Jan 08:
Eruption on the southeast Limb @ 17:16 SWAP difference imageFind a movie of the event here (SWAP difference movie)http://proba2.oma.be/swap/data/mpg/movies/WeeklyReportMovies/WR198_Jan06_Jan12/Events/20140108_Eruption_SouthEastLimb_1716_swap_diff.mp4
3. Review of solar activity (6 Jan 2014 - 12 Jan 2014)
In the week of January 6 to January 12, 34 C flares, 3 M flares and one X flare were observed.Catania sunspot group 98 (NOAA AR 1944), classified as a beta-gamma-delta group, was the mostactive throughout the whole week. The sunspot group was magnetically connected with Catania sunspotgroup 97 (NOAA AR 1946) and spotless region NOAA AR 1943. See below the active regions andunderlying sunspots as they appeared in SDO/AIA 193, 304 and HMI 6173.
STCE Newsletter 6 Jan 2014 - 12 Jan 2014 Page 10 of 17
The X1.2 flare, erupting on January 7, peak time 18h32 UTC, originated from the western edge of Cataniasunspot 98 and the trailing part of NOAA AR 1943. The event was associated with an asymmetric haloCME, metric type II radio burst, EUV wave and a large dimming region.The area from where plasma is ejected, is left black. A dimming is an on disk indicator of coronal massejection. It flows radially out with the flare source as middle point. The pictures below show the dimming
STCE Newsletter 6 Jan 2014 - 12 Jan 2014 Page 11 of 17
area which increases as the event progresses. More on http://solardemon.oma.be/dimmings.php?did=311
The CME was travelling to the southwest with an estimated speed of 1500 to 2300 km/s (depending onthe model and data used).
STCE Newsletter 6 Jan 2014 - 12 Jan 2014 Page 12 of 17
Two proton events occurred; one starting on January 6, passing the event threshold (10pfu) at 9h15UTC for >10MeV energy levels and another one starting on January 7. The first proton event was dueto a strong flare erupting from NOAA AR 1936, which had already turned around the west limb. Thesecond proton event was related to the X flare from Catania sunspot group 98 and started during thedeclining phase of the proton flux of the first event. The proton flux reached a maximum value of 1030 pfuduring the second proton event. Both a CME front as a flare are able to accelerate particles to relativisticspeeds. When the curve peaks suddenly, it is mainly the flare that gave its energy to the particles. Whenthe curve increases more gradually, it is a CME front that accelerated the particles. Both mechanismscan be at work of course at the same time.
Most other flares originated from Catania sunspot group 98, but Catania sunspot groups 97 and 94(NOAA AR 1946 and 1947) were also responsible for several flares.
4. Noticeable Solar Events (6 Jan 2014 - 12 Jan 2014)
DAY BEGIN MAX END LOC XRAY OP 10CM TYPE Cat NOAA07 0349 0353 0356 N7E8 M1.0 1N 97 194607 1007 1013 1037 S13E11 M7.2 2B 480 98 194407 1804 1832 1858 S15W11 X1.2 2N 8300 II/2 98 194408 0339 0347 0354 N11W81 M3.6 SF 100 III/2II/2 1947
LOC: approximate heliographic location TYPE: radio burst typeXRAY: X-ray flare class Cat: Catania sunspot group numberOP: optical flare class NOAA: NOAA active region number10CM: peak 10 cm radio flux
STCE Newsletter 6 Jan 2014 - 12 Jan 2014 Page 13 of 17
5. Review of geomagnetic activity (6 Jan 2014 - 12 Jan 2014)
A shock in the solar wind data was observed on January 7 at 14:20 UTC. The shock was related to thearrival of the CME erupting on January 4 which came according into the LASCO/C2 FOV at 21:48 UTC(check http://sidc.oma.be/cactus/catalog/LASCO/2_5_0/qkl/2014/01/latestCMEs.html)
A second shock was observed on January 9 at 19:30 UTC, related to the CME of January 7 which cameinto the LASCO/C2 FOV at 18:24 UTC. You can check it at the same link as above.
STCE Newsletter 6 Jan 2014 - 12 Jan 2014 Page 14 of 17
The magnitude of the interplanetary magnetic field reached a maximum value of 17 nT. The Bz-component was mainly positive and ranged from -8 to +8 nT. Solar wind speed stayed between 300 and400 km/s at the begin of the week.
At the end of January 11, the arrival of a coronal hole high speed stream (CH HSS) was observed. Itwas the northern coronal hole that reached the central meridian on January 8. The CH HSS resulted inan increase of the solar wind speed to about 700 km/s.
STCE Newsletter 6 Jan 2014 - 12 Jan 2014 Page 15 of 17
The local K index at Dourbes and Izmiran and the estimated NOAA planetary Kp index reached quiet tounsettled levels for most of the week: check the newsletter tab Geomagnetic Observations at Dourbes.NOAA Kp had a K=4 for one single time slot (January 12 at 21-24 UTC).
STCE Newsletter 6 Jan 2014 - 12 Jan 2014 Page 16 of 17
6. Geomagnetic Observations at Dourbes (6 Jan 2014 - 12 Jan 2014)
7. Review of ionospheric activity (6 Jan 2014 - 12 Jan 2014)
The figure shows the time evolution of the Vertical Total Electron Content (VTEC) (in red) during thelast week at three locations:a) in the northern part of Europe(N61°, 5°E)b) above Brussels(N50.5°, 4.5°E)c) in the southern part of Europe(N36°, 5°E)
STCE Newsletter 6 Jan 2014 - 12 Jan 2014 Page 17 of 17
This figure also shows (in grey) the normal ionospheric behaviour expected based on the median VTECfrom the 15 previous days.
The VTEC is expressed in TECu (with TECu=10^16 electrons per square meter) and is directly relatedto the signal propagation delay due to the ionosphere (in figure: delay on GPS L1 frequency).The Sun's radiation ionizes the Earth's upper atmosphere, the ionosphere, located from about 60kmto 1000km above the Earth's surface.The ionization process in the ionosphere produces ions and freeelectrons. These electrons perturb the propagation of the GNSS (Global Navigation Satellite System)signals by inducing a so-called ionospheric delay.
See http://stce.be/newsletter/GNSS_final.pdf for some more explanations ; for detailed information, seehttp://gnss.be/ionosphere_tutorial.php