50
Stealthy Fast Food: Phase 2 Evaluation Report Submitted to Tower Hamlets Council, July 2017

Stealthy Fast Food: Phase 2 Evaluation
Report
Submitted to Tower Hamlets Council, July 2017
COVER OPTION 03_Block colour background

Stealthy Fast Food: Phase 2 Evaluation Report
Submitted to Tower Hamlets Council July 2017
Contents
1. Introduction…………………………………………………………………………….…p.2 2. Aims of the Stealthy Fast Food project……………………………………………...p.5 3. Overview of the intervention process……………………………………………......p.6 4. Outlet engagement and recruitment……………………………………………….....p.8 5. Intervention development and implementation…………………………………...p.14 6. Evaluation aims and method………………………………………………………....p.21 7. Evaluation of findings………………………………………………………………....p.26 8. Conclusion and next steps…………………………………………………………...p.42
Appendix 1: ‘Pitch’ document………………………………………………………..p.44
1

1. Introduction
Background and context Childhood obesity levels in Tower Hamlets are high. Figures from the 2015-2016 National Child Measurement Programme show that children in Tower Hamlets have worse than average levels of obesity . 11.6% of children aged 4-5 years and 27.1% of children aged 10-11 years are classified 1
as obese . 2
Although there is clear evidence that the health impacts of fast food outlets are negative , their 3
popularity with young people shows that they are fulfilling a need - for cheap, tasty and quick food. Additionally many fast food outlets are local business, providing a source of employment for local residents. While previous efforts to change the food environment have focused on restricting the number of new fast food outlets and the areas where they can operate (for example near schools), their role in the community suggests that there is a need to develop a radically different approach. Furthermore in Tower Hamlet there is a historical over-concentration of fast food outlets and the council needs to work with the local businesses as prohibition is neither viable nor advisable. The first stage of this project, which involved mapping the borough’s fast food environment, identified a high prevalence of independent fast food outlets. This presents an additional challenge as unlike in chains such as McDonalds and KFC, where the sector has already implemented some changes to their practices (such as displaying nutritional data on their menus), progress in the independent sector is lagging. Influencing the independent fast food sector, while challenging, represents a significant opportunity for improving the borough’s food environment. Therefore, rather than work in opposition to independent fast food outlets, Tower Hamlets and Shift are exploring working within the current fast food culture to make feasible adaptations in outlets to increase sales of healthier items and reduce the calorie density of existing meals, with the long-term aim of reducing the levels of youth obesity.
1 National Child Measurement Programme 2015-2016 2 National Child Measurement Programme 2015-2016 data for Tower Hamlets is accessible here 3 CEDAR (2015), ‘Area deprivation and the food environment over time: a repeated cross-sectional study on takeaway outlet density and supermarket presence in Norfolk, UK, 1990 – 2008’
2

This approach is in line with the GLA’s position that “engaging positively with takeaways to help them improve their business competitiveness as well as the healthiness of their food is as important as developing clear planning guidance and new regulation” . 4
Local authorities have a responsibility to address local public health concerns and are able to implement initiatives that address the harmful effects of fast food in their areas. Tower Hamlets was one of the first councils in London to launch a healthier catering initiative (the Food for Health Awards launched in 2010). The Food for Health Awards is led and managed by staff from environmental health, who are able to build on their established relationships with local outlets. In recent years an increasing number of local councils have developed other healthier catering initiatives in recent years, such as the London wide Healthier Catering Commitment. However many local authorities are struggling to engage outlets in healthier catering initiatives. This is because outlets perceive health improvements to be costly, and likely to affect the taste of their food and deter customers. Outlet operators do often understand the low nutritional value of the meals they serve and want to improve, but financial security issues get in the way. As an independent, external charity, Shift is able to play a different - and research focused - role when it comes to helping improve the food environment and engaging with businesses. Therefore the challenge that Tower Hamlets and Shift have jointly taken on, to make feasible adaptations that are acceptable to outlets, is of relevance to other local authorities and to the public health sector more generally.
The challenge Is it possible for takeaway outlets to make a more positive contribution to the food environment, and for these changes to be cost-neutral or even beneficial to the business’ bottom line? The fast food sector has grown in recent years and takeaway and delivery markets are expected to continue growing over the next decade as a result of consumer trends around convenience, smartphone enabled ordering and the growth of food delivery platforms like Just Eat, Deliveroo and Uber Eats . Working with this trend, rather than pushing against it, is likely to be a more 5
feasible approach. Healthier, more nutritious, fast food does exist. Chains like Leon, Chipotle and Pod, along with their independent counterparts, offer more nutritious food within a successful business model. However, these chains operate at the mid to upper end of the takeaway market, and use their perceived “healthiness” to differentiate themselves against the competition, and justify charging a premium price to their customers. At the value end of the market, healthier and affordable options are more limited. Food outlets in low income areas can face particular barriers to offering healthier food and drink choices, such as
4 GLA (2012), Takeaway Toolkit 5 Euromonitor (2017), Consumer Foodservice in the UK
3

highly competitive, price-sensitive markets, and a real or perceived lack of demand for healthier food and drink. The hypothesis informing this feasibility study is that there is currently a gap between what is important to businesses (their sales, costs and customer satisfaction) and what is important to healthier catering initiatives (reduction in calories and promotion of healthier options). The challenge is therefore to identify interventions that are cost neutral to businesses to implement, that do not negatively impact on sales (or indeed help increase sales), that do not negatively impact on customer satisfaction (i.e. unnoticed by customers), and that reduce the calories of meals. Or to put it in other words, the goal of the Stealthy Fast Food project is to find the adaptations that can be made to the food environment at the ‘sweet spot’ of the venn diagram below. Diagram: The key areas of focus for the Stealthy Fast Food project
4

2. Aims of the Stealthy Fast Food
project In the face of this challenge, Tower Hamlets commissioned Shift in 2015 to conduct an experimental feasibility study. The aim of the study, which is still ongoing, is to test a variety of realistic adaptations to fast food business and evaluate these adaptations to understand their relative effectiveness in relation to sales, costs, customer satisfaction and health. This feasibility study is composed of three stages: Stage 1 – The planning phase during which we reviewed current research around the issues of young people’s attitudes to fast food and fast food outlets and looked at evaluations carried out on current LBTH programmes such as the Food for Health Awards. Stage 2 – The intervention phase when different adaptations were tested and measured. Stage 3 – The production of a validated business engagement model that can be used across Tower Hamlets. Stage 1 was completed last autumn. The output of that stage was a literature review and shortlist of possible interventions to test in Stage 2, and initial outlet engagement to identify potential outlets to take part in the intervention tests. Burdett Road was selected as the test location because it had a high concentration of fast food outlets which were representative of the range found in the borough, and for its location near two schools. This report presents the findings from Stage 2, and takes the form of an evaluation of the process and impact of the interventions tested in the fast food outlets recruited to the study. The purpose of this report is to inform Stage 3, the key deliverable of which a validated model which can be promoted across the borough supporting the council’s priority around Healthy High Streets. This final deliverable will be used to support Tower Hamlet’s policy development and implementation around fast food takeaways.
5

3. Overview of the intervention
process
What we did The intervention study consisted of three primary activities, running from December 2016 to the beginning of June 2017. 1. Outlet engagement and recruitment December to January Shift worked with a community partner to do early engagement with fast food outlets on Burdett Road, which helped us better understand business’ priorities and anticipate potential barriers to recruitment. This was followed by a three-step recruitment process:
● Pre-engagement survey with outlet owners to identify concerns. ● Drop-in ‘installation’ to share engagement findings and collect outlet feedback on
intervention ideas. ● Meetings with outlet owners to discuss project aims and practicalities in-depth.
Four outlets were recruited to take part in the study: a kebab shop, a fried chicken shop and two greasy spoon cafes. 2. Intervention development and implementation February to April Options for creatively executing the interventions shortlisted in Phase 1 were developed by Shift, and feedback from outlet owners sought as part of the engagement process. Outlet feedback was used to select the four final intervention concepts to test in the recruited outlets:
1. ‘Flavour & Shake’ - redesigning packaging to make unnoticeable reductions to chip portion sizes (tested in the fried chicken shop).
2. ‘Boss Meal’ and ‘Meds Meal’ - promotional posters to increase sales of grilled chicken meals (tested in the fried chicken shop and one of the greasy spoon cafes).
3. ‘Muscle Meal’ - new menu item developed to optimise a grilled chicken meal for post-gym consumption (tested in the kebab shop).
6

4. ‘Explicitly healthy’ and ‘social signal’ menu labels - small icons printed on menus next to healthier menu options to nudge unconscious customer decisions (both versions tested in one of the greasy spoon cafes).
Shift worked with a graphic designer, a food photographer, a local print shop and a packaging manufacturer to develop the final intervention designs. The interventions were implemented in the outlets by Shift in May. 3. Testing and evaluation April to May A baseline data collection period ran for one month in April and the test period ran throughout May, finishing just before Ramadan began. Interventions were tested sequentially for two weeks, with the exception of the Muscle Meal which was implemented for the entire one month test period. The measures used to evaluate the impact of the interventions were:
● Rates of sale - recorded by electronic point of sale (Epos) software and tallies kept by outlet owners of intervention meal sales.
● Health - meals targeted by interventions were sent to a lab for nutritional testing. ● Customer satisfaction - recorded by customer intercept surveys conducted by Tower
Hamlets. ● Feasibility - assessed through a mix of formal and informal conversations with outlets,
and observations of customer interaction with the interventions.
7

4. Outlet engagement and
recruitment A three-step recruitment process was used to recruit outlets to the study,
which we developed based on early feedback from outlets Recruitment process The original plan for recruiting outlets Recruiting outlets to the study began in December 2016. Originally we planned to recruit outlets by inviting all outlet owners on Burdett Road to a meeting, where we would share the aims of the project, outline the benefits of taking part, discuss any concerns and get feedback on the proposed interventions. This was to then be followed by a series of follow up recruitment visits in January to individual outlets. Early feedback from outlets led us to adapt our engagement processes We worked with Nurull Islam, a specialist in community engagement at Mile End Community Project (MCP), to help engage outlets to take part in the study. Nurull had several informal conversations with outlet owners that he knew personally on Burdett Road, to test their initial reactions to the project before Shift started the recruitment process. These initial conversations identified a number of unexpected potential barriers to recruitment, including:
● Existing engagement with outlets for the Food for Health Awards meant that outlets participating in the award scheme felt that they had already ‘done their bit’ to make health improvements.
● Some outlets felt that the project was unfairly targeting independent outlets when in their perspective big chains like KFC and McDonald's made a greater contribution to obesity.
● Outlet owners did not wish to expose certain practices in the operation of their businesses to outsiders, particularly in relation to the sharing of sales data.
The high prevalence of independent local fast food businesses on Burdett Road meant that it was important to build trust with these outlets first, otherwise it would be extremely challenging to influence them. Based on the feedback from MCP, we therefore realised that in order to gain the trust of outlets we needed to engage them on their terms and position the project in a way that puts their needs first. We therefore adapted our approach and devised a three-step engagement and recruitment process.
8

The three-step recruitment process
Step 1 - Pre-engagement survey We visited all outlets on Burdett Road in January to arrange times to speak to outlet owners. When it was possible to arrange a meeting with the owner, Nurull accompanied Shift to the meeting and helped facilitate a conversation to find out what the outlet had done already to make health improvements (e.g. what actions they have taken as part of the Food for Health Awards, or on their own initiative), their priorities as business owners were and their concerns about the project. These conversations were used as an opportunity to learn more about the businesses and the owners. Before we undertook these conversations with outlets, we received useful background information about the outlets from Isabella Daniel, the Environmental Health Officer leading the Food for Health Awards. She helped us understand which outlets might be most likely to participate, based on her recent experiences of working on the street. Step 2 - Installation at MCP At the end of January, we held a drop-in ‘installation’ at MCP’s office over the course of one week, promoted by flyers given to outlet owners. Outlets were incentivised to come through the provision of free product (a case of diet coke). The aim of the installation was to feedback what we had heard from our conversations with outlet owners. It consisted of posters celebrating outlets’ existing achievements around health, a summary of business priorities and their concerns of participating in the study. The intention was to communicate that we were listening to their concerns and recognising that health improvements can feel like they compete with business priorities. We also displayed posters of the intervention ideas and asked business owners to interact with these by voting for their preferred ideas using sticky dots, with space to add their own ideas. Step 3 - One-to-one meetings We arranged one-to-one meetings with all outlet owners who came to the installation, offering to either meet at their shop or at MCP’s office. Meetings lasted between 30 and 45 minutes and were led by Shift’s Healthy Fast Food director. A ‘pitch’ document was presented to the owners outlining the aims of the project, why the study was important, what the research would involve and details about the incentives (see Appendix 1). This was a successful way of engaging the business owners, as a pitch is a familiar type of interaction that the business owners are used to (they quite frequently have suppliers coming into their businesses ‘pitching’ for their custom).
9

Over the course of the three-step recruitment process between January and February we made over 60 visits to outlets, averaging around 4 visits to each of the 14 outlets we approached. Table: Number of outlets approached during recruitment process vs. number who engaged
Step Number of outlets approached to take part
Number of outlets successfully engaged
Pre-engagement survey 14 8
Installation at MCP 14 4
One-to-one meetings 8 4
Images: The four posters displayed at the ‘installation’ at MCP
Incentives Outlets were offered £800 for participating in the two month study. This amount was decided through consultation with colleagues at Shift experienced in incentivising businesses to take part in research. This incentive was conditional on it being spent on business supplies or improvements that related to healthier food. The incentive was set at quite a generous level
10
because this was the first time we were running this kind of study with outlets, and wanted to ensure we had enough outlets signing up.
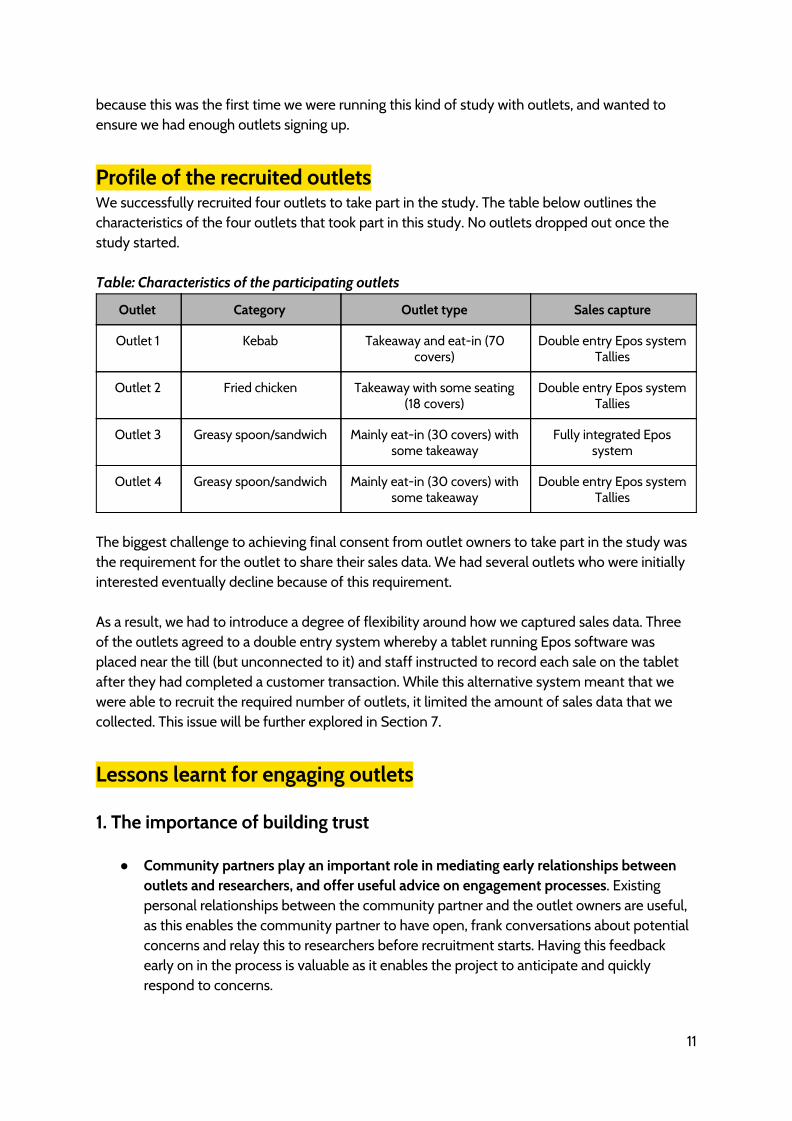
Profile of the recruited outlets We successfully recruited four outlets to take part in the study. The table below outlines the characteristics of the four outlets that took part in this study. No outlets dropped out once the study started. Table: Characteristics of the participating outlets
Outlet Category Outlet type Sales capture
Outlet 1 Kebab Takeaway and eat-in (70 covers)
Double entry Epos system Tallies
Outlet 2 Fried chicken Takeaway with some seating (18 covers)
Double entry Epos system Tallies
Outlet 3 Greasy spoon/sandwich Mainly eat-in (30 covers) with some takeaway
Fully integrated Epos system
Outlet 4 Greasy spoon/sandwich Mainly eat-in (30 covers) with some takeaway
Double entry Epos system Tallies
The biggest challenge to achieving final consent from outlet owners to take part in the study was the requirement for the outlet to share their sales data. We had several outlets who were initially interested eventually decline because of this requirement. As a result, we had to introduce a degree of flexibility around how we captured sales data. Three of the outlets agreed to a double entry system whereby a tablet running Epos software was placed near the till (but unconnected to it) and staff instructed to record each sale on the tablet after they had completed a customer transaction. While this alternative system meant that we were able to recruit the required number of outlets, it limited the amount of sales data that we collected. This issue will be further explored in Section 7.
Lessons learnt for engaging outlets 1. The importance of building trust
● Community partners play an important role in mediating early relationships between outlets and researchers, and offer useful advice on engagement processes. Existing personal relationships between the community partner and the outlet owners are useful, as this enables the community partner to have open, frank conversations about potential concerns and relay this to researchers before recruitment starts. Having this feedback early on in the process is valuable as it enables the project to anticipate and quickly respond to concerns.
11

● Community partners need to protect their relationships with the local community, as these relationships are a valuable asset for their work. We therefore ensured that outlets knew Nurull was independent to Shift, and that his role was to help us engage local businesses and understand the community’s point of view.
● Identifying and building relationships with respected members of the local business
community is valuable as these people can help researchers understand the priorities of local business owners. For example we built a relationship with the owner of a convenience store on Burdett Road, a founding member of the Burdett Road Business Association. He shared useful background information about the Burdett Road, such as the decline of footfall following the closure of the street market, which helped contextualise owner concerns.
● Outlets are reluctant to share their sales data. When recruiting outlets to take part in the
study, the issue of sales data capture was a barrier to getting outlets to sign-up. While the double entry Epos system enabled us to recruit outlets, the resulting data from this system proved to be patchy. As Shift now has a good relationship with the outlets and the business owners trust us, it is likely that were we to run this research again it would be easier to get owner permission to run the fully integrated Epos system as the owners have greater trust in us.
2. Building relationships with outlets is resource intensive but worth the investment
● Owners and their business partners are the key decision-makers and resource should be targeted at building relationships with them directly. When we first started engaging outlets, we spent a lot of time building relationships with staff as they are more often in the shop than the owners. We hoped that by developing relationships with staff and getting them excited about the project, the staff might then influence the owner. However, we found that most outlets have a strict hierarchy, and staff appear to have little influence on the owner’s decision-making. We produced flyers explaining the project and who we were and left these with staff to give to outlet owners if they were not in the shop when we visited.
● One-to-one meetings are more successful than trying to set-up group meetings. Outlet
owners have very different working patterns which means it is unlikely they will be able to attend a meeting at the same time as each other. In addition, outlet owners may have negative relationships with other owners (e.g. if they feel that another outlet has copied them, or is deliberately undercutting them). As a result, we found that outlet owners were more likely to respond if we offered to have a one-to-one meeting at a time and place of their own choosing. Meetings should be set-up in advance as owners are often busy when they are in the shop, and therefore cannot speak for long during unscheduled visits. Some owners prefer to meet in their shop, while others prefer to meet in a neutral space.
12

● It is easier recruiting outlets where the owner has high levels of involvement in the business. The amount of time needed to recruit outlets should not be underestimated, and much of this time is spent repeatedly visiting outlets trying to find the owner. From our engagement with a variety of outlets, an outlet segmentation emerged where outlets were either ‘community outlets’ owned by people with links to the local community who are more likely to be regularly present in the shop, and ‘anonymous outlets’ where the owner is more distant and has more than one business so is less often in the shop. We spent a lot of time trying to engage with these ‘anonymous’ outlets and were not able to recruit any of them within the timescales.
3. Owners need to see a clear opportunity for business development
● Outlet owners’ biggest priorities are increasing their sales, minimising their costs and keeping their regular customers happy. They are concerned that health improvements may negatively impact on these three areas, and therefore it was important to position the project in relation to these needs. Owners were keen for reassurance as to what would happen if it became clear that interventions were negatively impacting on these areas, particularly in relation to customer satisfaction. Outlets that have joined online platforms such as Just Eat are particularly sensitive to the risk of interventions prompting negative customer complaints online, as their online reviews are a valuable business asset.
● Outlets do not want to be the first to sign-up to a project. It became easier to recruit
outlets once we had one signed up. Until we had the first outlet confirmed, owners were typically quite risk-averse and wanted reassurance that others had already signed up before they agreed to participate. Once they knew we had other outlets on board, then their attitude shifted towards one of greater interest. The benefits that the ‘social proof’ of having at least one outlet recruited means that it is worthwhile focusing early recruitment effort on the outlets that seem most likely to participate and staggering recruitment so that the least willing outlets are engaged last.
● Outlet owners are motivated to participate because they want access to new ideas that
could give them competitive advantage. We had assumed that outlets signed up to the project due to the £800 incentive offer. However during the exit interviews with owners, all owners said that one of their primary motivations was to gain access to new ideas such as new marketing techniques, or learn about new products that would appeal to customers. The fact that we absorbed some of the risk of trying out a new idea (such as paying for promotion materials etc.) was particularly attractive to owners.
13

5. Intervention development and
implementation
The most promising interventions identified in Phase 1 were developed with input from outlet owners. Interventions were designed to be ‘stealthy’;
in that they either would not be noticed by customers or would not be explicitly recognised as health interventions.
The interventions tested on Burdett Road Interventions shortlisted in Phase 1 The literature review conducted in Phase 1 identified a number of potential interventions which were shortlisted on the basis of their likely feasibility and effectiveness within the context of fast food. The shortlisted interventions were:
1. Reducing chip portion sizes a. Collaboration of chip portion sizes b. Packaging to reduce chip portion sizes
2. Menu information on healthier menu options a. Explicitly health related menu labels b. Menu labels with subtler signals of social approval
3. Promotion on grilled food 4. Introduction of a new healthier menu item 5. Airfrying
Intervention design Development process The shortlisted interventions outlined the underpinning mechanics of the intervention (e.g. a promotion on grilled food), but not their creative execution (e.g. how would grilled food be promoted). Shift generated 16 ideas based on the shortlisted intervention mechanics. These were visualised by a professional illustrator to help better communicate the ideas to outlet owners and displayed at MCP’s offices as part of the installation. The owners who attended the installation were asked
14

to sticker their preferred ideas. Any other ideas generated by the owners during the discussions were captured on post-it notes. We then used this feedback to develop the final interventions. A graphic designer, food photographer, local print shop and packaging manufacturer were commissioned to develop the final intervention materials. Image: the illustrated intervention concepts shown to outlet owners
Feedback from outlets on shortlisted interventions Several ideas were popular with the outlet owners who visited the installation. The three top ideas were:
● ‘Flavour and shake’ (chip packaging) - in which a smaller portion of chips are served with a sachet of spice, and the box shaken by the customer to distribute the flavour.
● Muscle Meal (new menu item) - a meal with protein/carbohydrate ratios optimised for muscle replenishment following a gym workout
● Boss Meal (grilled promotion) - renaming a grilled chicken meal as the ‘boss meal’ after ‘bossman’, the slang name of respect for a fried chicken owner.
These ideas were taken forward for further development, including the menu labels as they were considered acceptable by the outlet owners due to their easy implementation.
15

The collaboration on chip portion sizes was rejected by all outlet owners. This was due to a perception that some owners would ‘cheat’ and increase their portion sizes to the detriment of the other businesses. Owners also felt that it would be difficult to enforce. This intervention was therefore dropped, and we focused on the alternative packaging as the main mechanism through which to achieve a reduction in chip portion size. The airfryer intervention also proved to be unfeasible. The airfryer market is currently dominated by small appliances intended for domestic use. We located a manufacturer who makes industrial sized airfryers based in the US and after conversations with them came to the conclusion that the commercial airfryer market is not yet at the stage where is economically viable for outlets, due to the high costs of the equipment.
The final intervention designs 1. Redesigned chip packaging Intervention mechanic: Stealthy reduction in portion size Previous research conducted by LBTH found that even ‘small’ chip portion sizes are often considerably larger than the FSA’s guidelines , and our own customer survey research found that 6
chips were served in 70% of the meals purchased by respondents. The purpose of the redesigned chip box test was therefore to see whether it was possible to reduce chip portions by 20% and for it to be unnoticed by customers. There are two approaches this intervention could have taken: 1) making small incremental reductions to the standard box over a long period time and 2) make big changes to the design (and to the broader proposition of the chip eating ‘experience’) in ways that would distract customers from the reduced portion size, for example by changing the ways customers interact with the product. The first approach was not possible within the timescales of the study. Therefore the second approach was taken. The intention of the Flavour & Shake concept was to use a spice sachet and shaking mechanism as distracting elements, and make the experience of ‘unboxing’ more fun. We collected a range of packaging examples from fast food outlets to see whether there were any existing designs we could tweak to create the Flavour & Shake box. The most promising example was the box used by Domino’s Pizza for their sides. This box was flatter than the standard chip box used in chicken shops and was constructed to hold a dip pot. The manufacturers of the Domino’s box agreed to tweak the design and produce us a similar version that was a bit deeper and closer in appearance to the standard chip box. We then searched for manufacturers/distributors selling spice mixes in single serve pots or sachets. However we were told this kind of produce was not available on the market due to high levels of customer theft/wastage. We therefore explored the feasibility of producing our own small spice pots. However we were not able to source appropriate pots within the budget
6 Phelan, A., Daniel, I., Alek, R. & Sandelson, M. (2016), Not All Chips are Created Equal - Project Phase 1
16

available and did not have enough time to commission the design of a specially made spice sprinkler. This meant that in end we had to use dip holders which were filled with ketchup. The final prototype was therefore a cardboard box with a larger overall surface area than the standard chip box so as to hold the dip pot, but with smaller volume in the area where the chips are served. Image: The redesigned chip box (right) and the standard box
2. Boss Meal and Meds Meal Intervention mechanic: Promotion of a healthier grilled meal to increase attractiveness of meal The intention of the Boss Meal and Meds Meal was to increase sales of an existing lower calorie grilled item on an outlet’s menu by simply giving the meal a more appealing/noticeable name unrelated to its health benefits, and to promote the meal via posters on the outlet’s window and in-store. The name Boss Meal was selected as it referenced the relationship between customer and outlets inherent in the slang term ‘bossman’. The target for the intervention implemented in Outlet 2 was young people aged 14 to 21, who would generally be going into chicken shops to buy a fried chicken meal. The intended audience meant that the graphic designer commissioned to produce the Boss Meal posters used bright colours, playful/humorous imagery and made reference to the popular Chicken Connoisseur YouTube video series called the ‘Pengest Munch’ (peng being urban slang for good/tasty). We originally intended to use similar promotional materials in Outlet 4, the greasy spoon cafe where this intervention was also tested. However the outlet owner did not like the name of Boss Meal as he felt it did not reflect his shop’s brand or culture, noting that customers were more likely to call him ‘chef’ than boss man. We therefore renamed the grilled chicken wrap on his menu to ‘Meds Meal of the the month’, promoting it as a seasonal offer.
17

Because this outlet is popular with students from the local university for its halal Full English breakfast, the target audience for the Meds Meals were university aged young adults. The promotional posters were designed to be ‘trendier’ and more aspirational, reflecting the ‘food porn’ imagery taken by young people on their mobiles and shared on social networks such as Instagram. 3. Muscle Meal Intervention mechanic: New healthier menu item to expand range of healthy options, but not explicitly marketed as healthy The intention of the Muscle Meal was to introduce a new healthier item onto an outlet’s menu. There is a gym on Burdett Road and young men will often grab a meal after they have finished working out. Anecdotally we were told that this would often be a fried chicken meal. The Muscle Meal therefore tried to compete with fried chicken by offering a protein/carbohydrate ratio optimised for post-gym consumption and muscle growth. We consulted two fitness experts - a personal trainer and a former boxing champion - to show them the menu of the outlet where we were going to run the intervention and get their feedback on what we could do within the style of their existing menu choices. As the outlet was a kebab shop, we were advised by the experts to create a chicken shish meal which had a protein/carbohydrate ratio of 1:2, using a fast release carbohydrate like white rice. Other options suggested included meals incorporating grilled fish, eggs or pulses. The outlet already had a chicken shish and white rice meal on their menu, and when we weighed the different elements it worked out perfectly as already having a 1:2 ratio of protein/carbohydrate, so in the end we just asked the outlet to remove the bread from the meal. The graphic design of the Muscle Meal promotional materials aimed to appeal to a young male audience of gym goers. To help make the meal relevant to this category we used advertising cues from the protein shake category, a product often marketed to a similar target audience. We identified these cues from a review of bodybuilding and fitness magazines. Cues included use of performance statistics, metallic textures, dark background colours and impactful fonts. 4. ‘Explicitly healthy’ and ‘social signal’ menu labels Intervention mechanic: menu stickers to nudge customers unconsciously towards labelled items It is fairly common practice for restaurants to put little icons next to certain menu items; sometimes these icons communicate information (e.g. that the meal is vegetarian), other times it is because the outlet wants to promote these items (e.g. labelling them as
18

‘house specials’). The purpose of the menu labels was to act as nudges on customer purchase decisions, unconsciously drawing their eyes towards these healthier options. This intervention required the least design input. The two outlets where we planned to test this intervention were both greasy spoon cafes, where customers are given a menu when they sit down at a table. At first we looked at printing little stickers that could be stuck onto the menus, but it was not possible to print stickers small enough to fit on the menus. We ended up reprinting the outlets’ menus with the icons, using the local print shop where both outlets normally go to get their menus reprinted to add on the icons onto the menu pdf file. The menu size meant that there were limitations as to the size of the icons we could use and how much information the icons could communicate. To communicate the certain menu items were healthier (the explicitly healthy menu label), a heart icon was used. The icon used to communicate social approval (the subtler social signal label) was a thumbs up, in the style of the Facebook ‘like’ symbol. The same menu items were labelled in the outlet where both labels versions were tested. The outlets used these menus for the duration of the test.
Lessons learnt for developing interventions 1. Involve outlet owners in the design process
● Involving outlet owners throughout the design process helps secure their buy-in when it comes to implementation. We found that a simple exercise such as asking outlet owners to sticker their preferred ideas meant that they were more likely to accept these ideas, and because they had publicly committed to the idea through the stickering process, agree to try implementing them in their shop.
● Outlet owners know their customers well and can use this insight to help improve the
quality of an intervention’s execution. The outlet owners were shown early designs of the interventions we planned to test in their shop and asked for their feedback. This was a useful process as the owners had a good understanding of what their customers like and expect, which they could use to appraise the intervention design (particularly in relation to the redesigned chip box and promotional posters).
● Sometimes outlet owners want to control the design process and this needs to be
sensitively managed. While owners have a lot of valuable insight into their customers and are able to give useful feedback on intervention designs, there can occasionally be tension between what the owner wants and what the creative designers advise. For example, when doing the food photography for the Meds Meal, the owner wanted to do the photo shoot in his cafe and photograph the food on the large white plates that the cafe uses. However the food photographer advised against this, preferring to use props such as wooden platters to help showcase the meal.
19

2. Interventions are more acceptable to outlets if they are personalised
● It is not always possible to implement interventions consistently across different types of outlet. We originally hoped that the same intervention designs could be implemented in different outlets, as this would not only streamline the design process but also demonstrate the potential for scalability. However it was hard to keep the promotional posters consistent between outlets. The Boss Meal for example had to be renamed so that it was acceptable - and appropriate - to Outlet 4. However, independent outlets often use a mix of promotional materials including ones that they have made themselves and ones that suppliers have given them (or that they have purchased from a wholesaler). This suggests it may be possible to develop generic branding that can work across different outlets.
● It is likely easier to scale interventions across outlets that belong the same food
category. One of the challenges of the intervention development process was designing interventions across different food categories as we were testing intervention in a kebab shop, a fried chicken shop and two greasy spoon cafes. Not only is the food different, but also customer expectations differ by category and there are also practical differences. For example fried chicken shops will serve takeaway fries in printed cardboard box, whereas kebab shops and greasy spoon cafes tend to use plain polystyrene boxes. This means that it would have likely been unacceptable to the kebab shop and greasy spoon outlet owners if we had tried to implement the same chip box that we used in the fried chicken shop, as they (and their customers) associate cardboard boxes with fried chicken.
3. The creative execution of interventions is important
● The imagery used to depict promoted meals should take centre stage and look attractive and filling. Customers buy with their eyes, and the photo of the meal will be the first (and perhaps the only) thing they look at. The main feedback we got from outlet owners as to how the promotional posters could be improved is to focus more on the presentation of the food (e.g. particularly in terms of making portions look bigger and adding more elements into the photo such as drink). It is very easy to take photos of food that look unappetising so investing in professional food photography is therefore useful. However if these interventions are to be scaled up, then accessing good stock imagery is likely to be more feasible.
● The way an intervention is creatively expressed may influence the effectiveness of the
intervention, and so it is important to test different versions. One of the most significant challenges we experienced was testing the different ways the same intervention could be expressed, so as to understand which version would be most effective. This was particularly difficult in relation to the chip box, as the manufacturer was only able to produce a limited number of prototypes, and their large minimum order sizes meant that a final design had to be committed before being fully tested. If we were to do this again we would be keen to work with a specialist packaging designer to test different designs
20

with customers before the test begins, to be sure that we were testing the most effective version.
21

6. Evaluation aims and method
Aims This evaluation had two aims. The first aim was to evaluate the process of altering the food environment in fast food outlets. This included learning what worked and what worked less well in engaging with businesses to make health improvement changes. The second aim was to evaluate the impact of interventions on 1) outlet sales and costs, 2) customer satisfaction 3) nutritional profile of meals and 4) feasibility of implementation.
Method We collected data from a number of different sources to undertake this evaluation:
● We collected sales and financial data from all the outlets to track the impact of the interventions on their sale rates and costs.
● Tower Hamlet’s public health team conducted customer intercept surveys in each outlet on a weekly basis throughout the baseline and test period to the track the impact of interventions on customer satisfaction.
● We sent meal samples of the key menu items targeted by the interventions to a laboratory for nutritional testing, to assess the health impact of the interventions.
● We had regular, informal conversations with all the outlets during the baseline and test periods to get feedback on their experience of the project, and conducted exit interviews with each outlet owner after the testing had finished.
● The Shift project team maintained an engagement diary throughout the study to record observations and notes of conversations with outlets.
Table: Data sources mapped onto evaluation metrics
Evaluation metric Data source
Sales and costs ● Rates of sale data ● Wholesaler invoices
Customer satisfaction ● Customer intercept surveys
Health ● Nutritional test data
Feasibility ● Informal conversations with outlets during test period ● Exit interviews with owners ● In-store observations
22

Interventions tested in outlets The table below shows the intervention testing schedule across the four recruited outlets. The new menu item was tested for one month as we were told by outlets that it often takes at least month (usually 2 to 3 months) for a new menu item to get picked up on by customers. Table: Intervention testing schedule
Weeks 1 - 2 w.c. 3 April
Weeks 3 - 4 w.c. 17 April
Weeks 5 - 6 w.c. 1 May
Weeks 7 - 8 w.c. 15 May
Outlet 1
Baseline data collection
New menu item (Muscle Meal)
Outlet 2 Grilled promotion Alternative chip packaging
Outlet 3
Menu stickers (Health)
Menu stickers (Social)
Outlet 4
Grilled promotion Menu stickers (Social)
Evidence base The table below presents the evidence base collected across the different data source types, both as a total across the four participating outlets and for each individual outlet. Table: Evidence collected across the different data types
Outlet Sales Customer satisfaction
surveys
Nutritional profile Feasibility
ALL OUTLETS 6,574 item sales recorded (£28,439) Baseline: 4,368 item sales recorded (£20,260) Intervention: 2,206 item sales recorded (£8,179)
134 surveys completed. Baseline: 73 surveys completed Intervention: 61 surveys completed
21 nutritional tests conducted
4 exit interviews completed with owners Numerous visits to outlets (twice weekly visits on average during baseline/ intervention) Engagement diary Cost/expense receipts
Outlet 1 Muscle Meal
Double entry Epos system used. Cannot be sure of sales data accuracy.
Baseline: 20 surveys completed Intervention: 16 surveys
4 nutritional tests conducted (Full chicken shish, chicken shish meal
1 exit interview Informal chats and observations
23

Baseline: 1091 sales recorded (£9007) Intervention: 279 sales recorded (£2174)
completed sides, Muscle Meal, uncooked marinated chicken)
Outlet 2 Boss Meal and chip box
Double entry Epos system used. Cannot be sure of sales data accuracy. Baseline: 158 sales recorded (£356) Intervention: No sales recorded
Baseline: 13 surveys completed Intervention: 15 surveys completed
10 nutritional tests conducted (5 x 6 wing meal to assess daily variability, Boss Meal, fries, uncooked chicken in batter, uncooked fries)
1 exit interview Informal chats and observations
Outlet 3 Menu labels
Integrated Epos system used. 100% accurate sales data for 2 month period. Baseline: 2636 sales recorded (£7997) Intervention: 1801 sales recorded (£5177)
Baseline: 20 surveys completed Intervention: 15 surveys completed
7 nutritional tests conducted (Uncooked full english breakfast, cooked full english, waffle breakfast, chicken mushroom omelette, chicken tikka panini, tuna cucumber panini, jacket potato & beans)
1 exit interview Informal chats and observations
Outlet 4 Meds Meal and menu labels
Double entry Epos system used. Cannot be sure of sales data accuracy. Baseline: 483 sales recorded (£2,900) Intervention: 126 sales recorded (£828)
Baseline: 20 surveys completed Intervention: 15 surveys completed
0 nutritional tests conducted
1 exit interview Informal chats and observations
Lessons learnt for data collection 1. Sales data is only accurate if tracked automatically
● Of the two systems of sales data collection tested in this study (integrated vs. double entry), the integrated system yielded much more accurate data. We had originally intended to use electronic point of sale (Epos) software to automatically capture outlet
24

sales. If the Epos software is integrated with the cash till, then the transaction is automatically recorded whenever a staff member uses the till. However, because outlets’ concern about sharing sales data turned out to be a major barrier to recruitment, we decided to test a more flexible ‘double entry’ system of sales data collection as well as the original integrated system. These two systems worked as follows:
○ Fully integrated system - The till has Epos software fully integrated, so that transactions only need to be inputted once, meaning that all sales are automatically tracked. A fully integrated till solution was purchased for one outlet whose owner was keen to try the till and use its reporting functions to improve his business intelligence.
○ ‘Double entry’ system - Epos software runs on a tablet placed next to the cash till, but is not integrated with the till. Staff were instructed to carry out the customer transaction as usual on the cash till and then record the sale on the tablet immediately afterwards. This system was implemented in the 3 outlets where there was initial concern about sharing sales data.
● Future studies should only use the automatic, integrated system to track sales. The
‘double entry’ system turned out not to feasible and as a result the sales data we collected from the three outlets that used this system is not complete. If we were to repeat this study, then we would strongly advise only using the fully integrated system to measure an outlet’s sales, although this may prove problematic for outlet recruitment.
2. Staff compliance and motivation are issues for accurate sales capture
● Staff compliance during busy periods and maintaining staff motivation were the main issues with the double entry system that made it unfeasible for the outlets. Staff were not used to using Epos and although they received training, the fact that it was not integrated with the till meant that during busy periods they would often fail to record the transactions on the software. In addition because staff were not individually incentivised to use the software, and when the owners were not around, compliance levels fell.
● Outlet owners find the sales data useful. The owners who used the double entry system
reported in the exit interviews that actually they had found the data useful, as it meant that they could easily check what their sales were over different time periods and look at the performance of different products. As a result, they noted that were we to repeat the study they would have been more comfortable using the fully integrated Epos system.
3. Customer surveys are resource intensive
● The number of outlets and number of interventions means it is challenging to build up big enough sample sizes to evaluation impact of interventions of customer satisfaction. We aimed to achieve a sample size of 20 intercept surveys per outlet during the baseline and 20 during the test period. Interviews were done during lunchtimes, due to higher footfall during this period, with a target of 5 interviews completed per outlet each week. This meant visiting the street twice a week. However resource challenges meant that we
25

lowered our target sample size to 15 surveys per outlet during the test period. While we achieved 134 completed survey responses in total - a not inconsiderable number - at the level of individual outlet/intervention, sample sizes are relatively small.
4. Customer surveys are easier in fast turnover takeaway environments
● It is easier to do customer intercepts in takeaways than in sit-down cafes. Outlet owners were keen that their customers were minimally disrupted by the intercept surveys. In takeaways it was relatively easy to do interviews while customers were waiting for their food to be prepared, and the high customer turnover meant that there were new customers coming in so the target number of surveys could be achieved relatively efficiently. It was found to be harder in the sit-down cafes, as outlet owners only wanted the surveys to be done when customers had finished eating their food to avoid disrupting their meal. This meant that it took longer to achieve the target number of interviews.
26

7. Evaluation of findings
This chapter outlines the key findings of the impact evaluation in terms of changes made to the food environment.
What change did the project make to the food environment? Overview On the basis of the available data, the project appears to have succeeded in helping takeaway businesses make modest increases to their sales of healthier menu items targeted by the interventions, despite the habitual nature of customer purchasing behaviours. This is likely to have had a positive impact on health as the meals targeted by the interventions had fewer calories than the best-selling items they were competing with. Table: Summary of intervention effectiveness across key impact measures
Intervention
Impact measures
Sales Customer satisfaction
Health Feasibility
Menu labels Sales of labelled menu items declined less than non-labelled items
Customers did not notice menu labels
1% reduction in sales of Full English in breakfast category (corresponding 1% increase in waffle breakfast sales), leading to a saving of 4,063 calories across total sales.
Easy to implement
Grilled promotion
Sales of the ‘Boss Meal’ and ‘Meds Meal’ increased compared to baseline sales
Mixed reaction to promotional posters
Boss Meal has 19% calories than comparator fried chicken meal.
Easy to implement
New menu item
Sales of the Muscle Meal picked up after two weeks
Mixed reaction to promotional posters
Muscle Meal has 486 calories, a 67% reduction on the larger chicken shish meal.
Easy to implement
Redesigned chip box
n/a Customers noticed portion reduction - unacceptable to customers
Redesigned chip box reduced chip portions by 15%, leading to a reduction of 90 calories per portion.
Difficult to implement in its current design - would benefit from a second
27

iteration
1. Impact on sales Based on the evidence available, the three interventions promoting healthier alternatives (grilled promotion, new menu item and menu labels) appear to have achieved a modest positive impact on sales during the intervention month. However we cannot say whether this change is statistically significant due to data quality and sample size issues. The lack of accurate, automatically captured sales data in three of the four test outlets (Outlet 1, Outlet 2 and Outlet 4) means that we are reliant on business owner feedback and their tally sheets to evidence sales change. While there is nothing to suggest that the business owners would have reason to inflate their sales figures to us, this data should still be treated with some caution. Table: Baseline vs test period sales of interventions (excluding chip box as intervention not intended to increase sales)
Outlet Intervention Description Baseline sales of intervention meal
Test period sales of intervention
meal
Outlet 2 Grilled promotion (Boss Meal)
5 grilled wings + fries 25 75
Outlet 4 Grilled promotion (Meds Meal)
Grilled chicken and pepper wrap + fries
35 89
Outler 1 New menu item (Muscle Meal)
Chicken shish meal 0 125
Outlet 3 Menu labels Menu labels next to 8 menu items
54 45 (note that there was decline in
overall sales for all menu items during
the intervention period)
The grilled promotions appear to have helped increase sales According to the outlet tally sheets and verbal feedback from owners, the biggest change was recorded at Outlet 2. Sales of their grilled wing ‘Boss Meal’ increased from an average of 1 sale a day (7 sales a week) during the baseline period to 3 sales a day (21 sales a week) during the test period. This represents a 200% sales increase. Similarly, sales of Outlet 4’s grilled chicken and pepper wrap ‘Meds Meal’ increased from an average of 10 sales a week during the baseline month to between 25 to 30 sales a week in the first two weeks of the intervention period (representing a 150% increase), falling to 15 a week in the last week of testing.
28

Sales of the new menu item took longer to take off Sales of the ‘Muscle Meal’ at Outlet 1 were slow during the first two weeks of intervention testing, with no change on baseline sales of the equivalent chicken shish lunchtime offer (of which there were approximately 5 sales a day - 35 sales a week). However, during the last two weeks of the intervention month sales increased to 7 sales a day (49 sales a week). Sales of non-labelled menu items declined more than the meals targeted with labels The strongest evidence we have of the positive impact of the interventions on sales of healthier items is for the menu labels implemented at Outlet 3. As Outlet 3 agreed to the installation of the fully integrated EPOS till system, we can be confident in the accuracy of their sales data. Here we find that sales of labelled and non-labelled menu items both actually declined in the test period, but that sales of the non-labelled items appeared to have declined more. The test period month of May appears to have been a bad month for Outlet 3, with total sales down by £2,300 compared to the baseline month of April (total food sales were £6,380 in April and £4,039 in May). However while quantities sold of the non-labelled menu items decreased by 42%, labelled items fell by only 17%. Table: Quantities menu items sold at Outlet 3
Total quantities menu items sold
Baseline Test Percentage change
Non-labelled 1,268 740 -42%
Labelled 54 45 -17%
In order to have achieved a large enough sample size to test for statistical significance, the statistics expert we consulted advised that we would have needed to run the baseline and tests over a period of eight months. This is because the volume of sales of the healthier, labelled items are considerably lower than sales of the unhealthier, non-labelled items. For example, Outlet 3’s best selling meal is its Full English halal breakfast, which accounted for 71% of total sales in the baseline month and 70% in the test month. In comparison, sales of all eight labelled menu items accounted for just 4% of total sales in the baseline month, and 6% in the test month. The table below shows the quantities sold of the outlet’s two best-sellers (Full English and chicken tikka panini) during the baseline and test periods versus sales of the labelled menu items that we targeted to compete with the best sellers. It highlights just how much Outlet 3’s sales are dominated by the Full English breakfast, and the relatively low volume of quantities sold of all other meals in comparison. Table: Quantities sold of labelled menu items vs. best sellers in same category
Meal Labelled Baseline period Test period % change
Full English Non-labelled 896 524 -42%
29

Waffle breakfast Labelled 19 15 -21%
Chicken tikka panini Non-labelled 106 56 -47%
Tuna cucumber panini Labelled 11 9 -18%
The low volume of sales of labelled items compared to the Full English breakfast means that it is difficult to achieve a big enough sample of labelled menu item sales, which is why a study period of eight months would be required in order to record enough of these sales. While the observed differences between sales of labelled items during the baseline and test months are not statistically significant, the emerging direction of travel is encouraging. The owner of Outlet 3 has agreed to share his Epos data with us for a further 6 months, and to carry on using the labelled menu during this period, so that we can collect a large enough sample on which to run statistical significance tests. The effect of the intervention of menu labels is dependent on customers looking at menus. However, we found that only 4 of the 15 customers surveyed at Outlet 3 during the test period actually looked at the menu, with the majority not looking at the menu because they already knew what they wanted to order. This suggests that encouraging more customers to actively look at menus may increase the effect size of this intervention. 2. Impact on health The interventions have potential to positively impact health, as measured by calorie reduction. The table below presents the calorie change for each intervention meal promoted versus its ‘competitor’ meal. This table shows only the difference in calories by meal, without taking rate of sales into account. Table: Calories of intervention meals vs.comparator meals
Intervention Baseline vs. test
Description Portion size (weight g)
Calories per portion
% change
Redesigned chip box
Comparator Fries in standard box 219g 598 kcal -
Test Fries in Intervention box 186g 508 kcal -15%
Boss Meal Comparator 6 fried wings + fries 465g 1333 kcal -
Test 5 grilled wings + fries 450g 1076 kcal -19%
Muscle Meal
Comparator 7 pc chicken shish + rice + salad + bread
717g 1,494 kcal -
Test 4pc chicken shish + rice + salad 402g 486 kcal -67%
Menu labels
Comparator Full English 667g 1287 kcal -
Test Waffle breakfast 354g 843 kcal -34%
Comparator Chicken tikka panini 226g 529 kcal -
30

Test Tuna cucumber panini 215g 458 kcal -13%
The redesigned chip box achieved a 15% reduction in calories compared to the standard box. The actual volume of the redesigned box was 20% smaller than the standard box, but we found that staff put extra chips into box to increase the likelihood of customer acceptability. The meals with the biggest potential calorie saving are those where the intervention meal makes a sizeable reduction in portion size compared to the standard best-selling item, such as the Muscle Meal (67% fewer calories than the standard chicken shish meal served with bread) and the waffle breakfast (34% fewer calories than the standard Full English breakfast). Small changes to the sales mix can have big impacts on calories in purchased meals The most significant test of the effectiveness of the interventions is looking at the calorie savings that can be gained through changing an outlet’s overall sales mix. We can make these calculations most confidently for the outlet that used the integrated Epos till to measure sales (Outlet 3). Looking at this outlet’s best selling items - their Full English breakfast and chicken tikka panini - and the menu items that we labelled to compete against these best-sellers, we see that even the 1% decrease in the sales of the Full English breakfast as customers switched to the labelled waffle breakfast led to a reduction of 4,063 calories consumed during the test period. A much smaller decrease of 332 calories is observable from the change in sales mix of paninis, due to the lower calorie difference between the best-selling chicken tikka panini and the labelled tuna cucumber panini. Table: Total calories saved by changing sales mix through menu label intervention
Intervention Category pairs
Meal Calories per
portion
% of category
sales - baseline
% of category
sales - test period
Total calories saved through changing sales
mix
Menu labels Breakfast Full English 1287 kcal 98% 97% 4063 kcal
Waffle breakfast 843 kcal 2% 3%
Panini Chicken tikka panini
529 kcal 91% 86% 332 kcal
Tuna cucumber panini
458 kcal 9% 14%
This suggests that interventions will have most impact if they focus on the best-selling, highest calorie meal on an outlet’s menu. The lack of complete sales data for the other outlets makes it difficult to ascertain the change in sales mix during the test period. However what we can do is use the sales figures reported on the outlet’s tally sheets recording sales of the intervention meal and work out how many calories are saved if we assume that the sales of the intervention meal during the test period directly cannibalised sales of the best-selling comparator meal.
31

For the Boss Meal grilled promotion sales of the grilled chicken meal increased by 50 sales over the test period (there were 25 sales during the baseline period and 75 sales during the test period). The grilled meal has 257 fewer calories than the best-selling fried chicken meal, and so across 50 sales this achieved a calorie reduction of 12,850 kcal. Table: Total calories saved through changing sales mix (assuming test meals cannibalised comparator meals during test period)
Intervention Meal type Description Calories per
portion
Baseline sales of
intervention meal
Test period sales of
intervention meal
Total calories saved through changing sales
mix
Grilled promotion (Boss Meal)
Comparator 6 fried wings + fries
1333 kcal
- -
12,850 kcal Test 5 grilled
wings + fries 1076 kcal
25 75
New menu item (Muscle Meal)
Comparator Chicken shish meal
1,494 kcal
- -
126,000 kcal Test Muscle Meal 486
kcal 0 125
As a new menu item, there were no sales of the Muscle Meal during the baseline. However, if we assume that the 125 sales of the Muscle Meal cannibalised sales of the chicken shish meal then that would be a calorie saving of 126,000 calories for those 125 meals. 3. Impact on customer satisfaction The impact of the interventions on customers was measured in the customer surveys via satisfaction questions repeated in baseline and test periods about meal attractiveness, tastiness, value for money and likelihood to recommend outlet to a friend. We also included in the test period survey questions directly asking customers about the interventions in relation to three measures: 1) awareness of intervention 2) consideration to buy and 3) acceptability. Customers noticed the ‘stealthy’ interventions The chart below shows customer awareness levels of the interventions (excluding menu labels as customer awareness was not a key measure). Disappointingly the majority of customers surveyed noticed the interventions that were intended to be ‘stealthy’ (i.e. the chip box redesigned to reduce portion size) and were less likely to notice the interventions intended to be noticed (i.e. the grilled promotions and new menu item). Chart: % customers who noticed the interventions (n=61)
32

All customers shown the redesigned chip box noticed that the chip portion size was smaller compared to the standard box. The redesigned chip box therefore did not succeed in stealthily reducing portion sizes without customers noticing. For the interventions designed to be noticed by customers (the ‘Boss Meal’ and ‘Meds Meal’ grilled promotions, and the ‘Muscle Meal’ new menu item), around one third of customers surveyed reported noticing the promotional posters before they purchased their meal. Impact on customer purchase decisions In the survey, customers who reported noticing the promotional posters for the Boss, Meds and Muscle Meals were asked whether they considered buying the meal when they saw the posters. As the table below shows, only relatively small numbers of customers considered buying the meals. Table: Awareness and consideration of promotional posters
Intervention No. customers surveyed
during test
No. customers who noticed promotion
No. customers who considered purchasing
promoted meal
Meds Meal 15 5 out of 15 customers noticed poster (33%)
0 out of the 5 customers who noticed poster
Boss Meal 15 5 out of 14 customers noticed poster (36%)
1 out of the 5 customers who noticed poster
Muscle Meal 16 3 out of 16 customers noticed poster (19%)
2 out of the 3 customers who noticed poster
Menu labels 15 4 out of 15 customers looked at menu before purchasing.
1 out of the 4 customers noticed the menu labels.
Not applicable as menu labels designed to unconsciously
influence purchase decision
33

The main reasons given by customers who noticed the promotional materials but did not consider buying the meal included:
● Already knowing what they wanted to order. ● Not liking the kind of food being promoted. ● Finding the meal shown in the poster did not look filling enough, or that its portion size
looked too small. The Muscle Meal posters appear to have been more successful in attracting customer consideration in that 2 out of the 3 people who had noticed the posters said they had thought about buying the meal (of which 1 had actually done so). Again, the reason for not purchasing the meal was because the customers had already decided what they wanted to order. These findings highlight the difficulty of changing customer purchase decisions in a food environment where customer behaviour is very habitual. The first challenge is to get customers to notice any promotional materials displayed before they make their purchase. A second and potentially bigger challenge is that it appears customers - particularly the regulars - have often made up their mind as to what they are going to order before they even walk into the shop. This suggests that interventions influencing purchase decisions may need to occur at multiple points in the purchase journey (e.g. before customers enter the shop). Although customers’ awareness levels of the promotional posters were relatively low, as was consideration among those who had noticed the posters, encouragingly future consideration levels were high. All customers surveyed during the test period were asked whether they could consider buying the promoted meal in the future. On average across the three promotions, 74% customers said they would consider purchasing the meal in the future. Chart: Future consideration of promoted meals (n=46)
34

The promotional posters were most acceptable to the target audience All customers surveyed in outlets testing the promotional posters were asked for their feedback on the posters, regardless of whether they had noticed the posters before purchasing their meal. Customers were asked to rate how appealing they found the posters. Chart: Appealing ratings for promotional posters (n=42)
For all the promotional posters, customers who matched the target audience appear to have been more likely to consider the poster designs as appealing. Overall the Boss Meal was considered to be the most appealing poster, with 57% customers surveyed saying they thought the posters were ‘very appealing’ due to the bright colours, humorous design and use of street slang (i.e. ‘pengest’). The Muscle Meal was the least appealing poster, with only 15% customers saying it was ‘very appealing’. This is perhaps not surprising given that the Muscle Meal was specifically targeting young adult men and that during the intervention period, more female customers took part in the survey than male. Survey respondents also skewed towards older age groups. Reasons for finding the poster unappealing included not liking the name of the meal, a too masculine aesthetic design and customers saying that they were not trying to become muscly. Feedback from the owner of Outlet 1, the outlet where the Muscle Meal was tested, suggests that the meal and associated promotional posters were successful with the target audience of young male gym-goers, who came to the shop in the early evening (and therefore not picked up by the customer surveys which took place earlier in the day).
35

The redesigned chip box was not acceptable to younger customers The intervention for which customer acceptability is most important is the redesigned chip box. This is because redesigning packaging to reduce portion size changes the product sold and if customers notice and do not accept the change, it could lead to problems for the business - such as customer complaints and loss of repeat custom. None of the other interventions changed the actual product sold, and therefore posed less risk to the business. If customers did not find the promotional posters acceptable, it would only result in them not buying the meal and making a different purchase instead. The redesigned chip box was not acceptable to the school age customers whom we sought feedback from. As noted in the previous section, all customers who were shown the redesigned chip box noticed that the box was smaller. These customers were then asked to estimate how much smaller the portion was, with most reporting that the portion looked around 30% smaller. This is disappointing given that the volume of the redesigned box was actually only 20% smaller than the standard box. Unsurprisingly the majority of customers therefore considered the redesigned chip box to be an unacceptable alternative to the standard packaging, particularly given that the there was no corresponding reduction in price. There were however exceptions. Feedback from Outlet 2’s owner paints a more nuanced picture of customer acceptability, suggesting that levels of acceptability may vary by customer demography. The owner observed that evening customers were less likely to comment on the size of the box, which he attributed to the fact that evening customers tend to be older. He also anecdotally noted that a group of young adult white British skateboarders really liked the design of the box and said it was ‘cool’. In our observations of the outlet using the redesigned chip box and feedback from the owner, the reduced size of the box was not only noticed by school age customers but also frequently commented on. These comments were not necessarily complaints, and generally took the form of questions such as ‘what is this?’ and ‘can I get some more fries?’. The request for more chips was generally granted by staff, who would add an extra scoop of chips into the box. Haggling for - and receiving - extra chips appears to have helped increase the acceptability of the redesigned box among school age children, which is encouraging given that the overall portion was still smaller than that of the standard box. 4. Feasibility All interventions, with the exception of the redesigned chip box, were considered by the owners as feasible to implement Although Shift had responsibility for the production and implementation of the interventions, the owners considered the interventions to be easy for themselves to implement. Indeed, several of the outlets have started producing their own promotional posters as a result of taking part in the study.
36

The menu labels were the easiest intervention to implement as they required little design time (just asking the print shop to add on the labels onto the menu pdf file), and the only costs associated with the intervention is reprinting menus, a cost which outlets usually expect to incur once a year anyway when they replenish their menu stock. The most difficult intervention to implement was the redesigned chip box. In addition to the issues with customer acceptability previously discussed, there were a number of practical difficulties associated with the current design of the chip box. The most significant difficulty the current design presents is the length of time it takes to fold the box compared to the standard chip box. The current chip box, which is stored flat packed in outlets, is extremely easy to turn into a box and takes staff about 1-3 seconds to fold. However the redesigned chip box required around 20 seconds. The design of the chip box would benefit from being optimised with input from a packaging technologist. Because Shift took responsibility for implementing the interventions (e.g. getting the menus reprinted, putting up the posters etc.), we do not know how successful the implementation would have been if outlets were responsible for it. This is an important consideration for how to scale the interventions across multiple outlets when it is not feasible for hands-on implementation to be done on outlets’ behalf. However based on feedback from outlet owners, it appears that outlets would be able to easily implement promotional posters and menu labels by themselves. Table: Costs and time for developing and implementing intervention
Intervention Costs associated with intervention development / implementation
Outlet time/labour costs associated with intervention implementation
Menu labels Label design Menu printing
Liaising with print shop & proofreading menu No effort required by staff
Grilled promotion Production of promotional materials
- Graphic design - Food photography /
purchase of stock imagery Poster printing
Putting up posters in shop No effort required by staff
New menu item Production of promotional materials
- Graphic design - Food photography /
purchase of stock imagery
Putting up posters in shop Training staff to prepare new meal
37
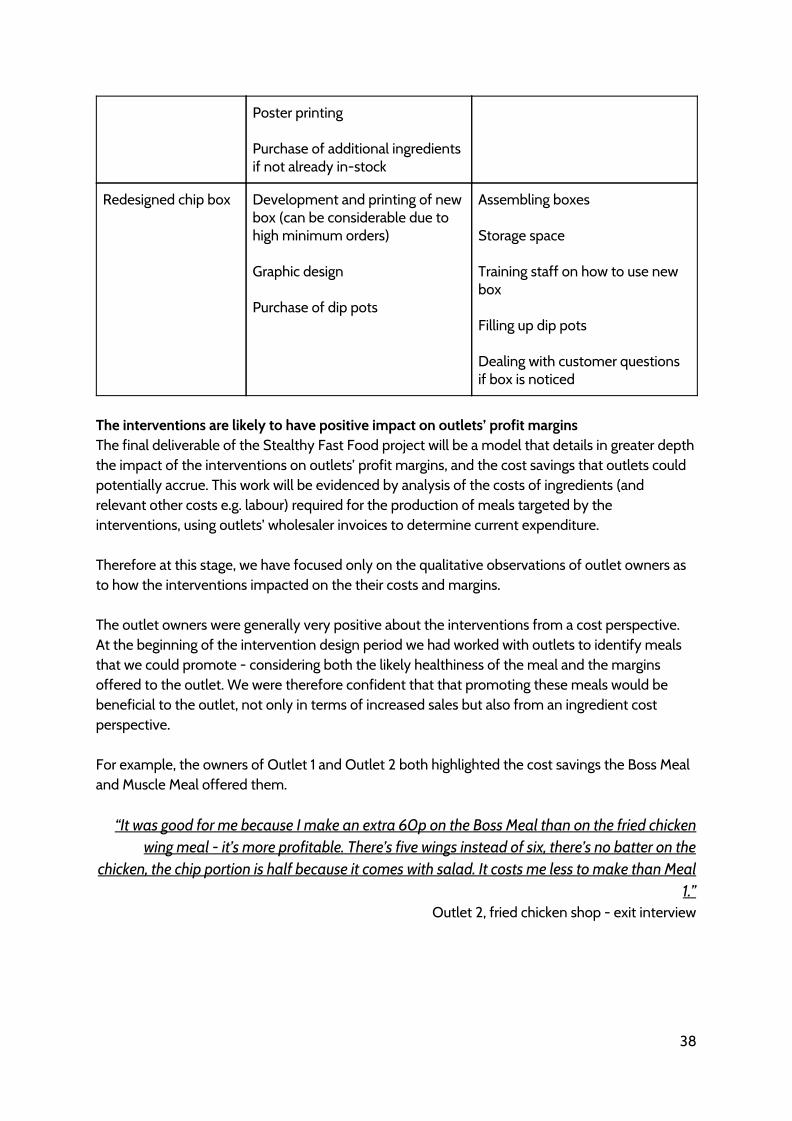
Poster printing Purchase of additional ingredients if not already in-stock
Redesigned chip box Development and printing of new box (can be considerable due to high minimum orders) Graphic design Purchase of dip pots
Assembling boxes Storage space Training staff on how to use new box Filling up dip pots Dealing with customer questions if box is noticed
The interventions are likely to have positive impact on outlets’ profit margins The final deliverable of the Stealthy Fast Food project will be a model that details in greater depth the impact of the interventions on outlets’ profit margins, and the cost savings that outlets could potentially accrue. This work will be evidenced by analysis of the costs of ingredients (and relevant other costs e.g. labour) required for the production of meals targeted by the interventions, using outlets’ wholesaler invoices to determine current expenditure. Therefore at this stage, we have focused only on the qualitative observations of outlet owners as to how the interventions impacted on the their costs and margins. The outlet owners were generally very positive about the interventions from a cost perspective. At the beginning of the intervention design period we had worked with outlets to identify meals that we could promote - considering both the likely healthiness of the meal and the margins offered to the outlet. We were therefore confident that that promoting these meals would be beneficial to the outlet, not only in terms of increased sales but also from an ingredient cost perspective. For example, the owners of Outlet 1 and Outlet 2 both highlighted the cost savings the Boss Meal and Muscle Meal offered them.
“It was good for me because I make an extra 60p on the Boss Meal than on the fried chicken wing meal - it’s more profitable. There’s five wings instead of six, there’s no batter on the
chicken, the chip portion is half because it comes with salad. It costs me less to make than Meal 1.”
Outlet 2, fried chicken shop - exit interview
38

“Meat is our biggest food cost. The Muscle Meal has less chicken than the 9pc chicken shish and the half baby chicken meals so it saves us money. That’s why we wanted to promote a 4pc
chicken shish meal rather than the half baby chicken which we sell more of.“ Outlet 1, kebab shop - exit interview
The outlet owner of the greasy spoon cafe where we implemented the Meds Meal focused on the benefits of the increased sales that the promotional posters had helped generate. However, he noted anecdotally that on at least one occasion a customer who had been about to order a more expensive meal switched to the cheaper Meds Meal after noticing the poster.
“The [Meds Meal] posters helped us sell more, so it’s been good. Although one time a customer was about to order a £9 meal but then saw the poster and bought that instead so I ended up
selling a cheaper meal.” Outlet 4, greasy spoon cafe - exit interview
We intended the Meds Meal to compete with the Full English breakfast, as both are at similar price points, but customer feedback on the posters (that the Meds Meal did not look as filling) suggests that the Meds Meal might actually have cannibalised more expensive meals. It is hard however to fully understand what happened due to the incomplete Epos sales data recorded by the outlet. The last intervention, the redesigned chip box, received mixed feedback from the outlet where it was tested. The intention was that by making a reduction in chip portions, the outlet would save money. By reducing chip portions by 15%, the outlet saves 3p on the cost of chips per portion (based on the cost of the McCains Fast Food fries used by the outlet). However even if produced on a mass scale the chip box is likely to be more expensive to produce than the standard box and requires the purchase of dip pots. The outlet owner who implemented this intervention therefore considered that the costs associated with the intervention in its current design would outweigh the cost savings gained through reducing chip portion sizes.
What did we learn on how to practically change the food environment? 1. Short-term business concerns are a greater priority for outlet owners Our starting hypothesis that there is a gap between what is important to fast food businesses and what is important to current healthier catering initiatives was confirmed when we engaged outlet owners on what their business priorities are. Health does matter to some owners, but it is superseded by - and often perceived to be in conflict with - more ‘pressing’ concerns such as keeping regular customers happy, managing variable monthly turnover, balancing cost of ingredients with quality, and attracting new customers in the face of growing competition from the big chain outlets opening up in the area.
39

Recommendation:
● Recognising these business concerns is important to securing outlets’ engagement. ● Demonstrating the positive impact of health improvements in relation to these wider business
issues where possible will be critical to the success of future engagement models. 2. The food environment of Burdett Road is driven by habitual customer behaviours The customer intercept surveys show that customers’ purchases are generally habitual - i.e. they go to the same outlets and buy the same meals from the outlets. This is important context as it highlights the difficulty of changing customer purchase decisions. The majority of customers going to the outlets on Burdett Road are regulars; over one third (36%) of the customers we surveyed visit the outlet on a weekly basis, and two thirds visit at least once a month (62%). 73% customers had previously bought the same meal before, with many saying that they bought the meal because it is what they usually order, or because they know they like the taste. Recommendation:
● The fact that one third of customers noticed the promotional posters used to promote intervention meals suggests that customers’ interaction with the physical environment of outlets is also to a degree habitual. Interventions that are intended to be customer facing have to work harder to be noticed.
3. Outlet sales are dominated by a very small number of menu items Habitual customer behaviour is reflected in outlets sales data; outlet sales are dominated by a very small number of menu items. For example, 70% of sales at one outlet was dominated by just one menu item: their Full English breakfast. Recommendation:
● In order to have greatest impact on calorie reduction, interventions should be tightly focused on competing with the unhealthiest best-seller.
● Making even small changes to the total sales mix can have a significant positive impact on health.
4. Outlets want to be ahead of the curve, but not the first to try something We found it easier to recruit outlets to participate in the study once we had at least one outlet already signed up. This is telling as it highlights that the mentality of small business owners is often quite risk averse. However we learnt in the exit interviews with owners that one of the reasons why they eventually signed-up to participate in the study was because they hoped it would give them access to new food products, marketing materials and/or knowledge about new consumer trends. There can quite intense competition between outlets that sell the same kind of food, and this means they are always on the lookout for new menu items that can differentiate them from their competitors. For example, one of the outlet owners is exploring extending his smoothie range to include ‘green smoothies’ as he had noticed this as a food trend. This may explain why outlet
40

owners in the exit interviews recommended that were we to do this project again, that we focus on introducing new menu items as well as promoting existing menu items. Recommendation:
● Outlet owners are focused on and excited by new products, particularly when they can see they are associated with a growing consumer trend, as this gives them the reassurance that they are not the first to try it.
● Presenting health improvements as ‘new products’ or ‘new innovation’ or ‘new marketing techniques’ may help increase outlet owner engagement with the intervention.
5. There are points in the annual business cycle when owners are more willing to make changes In Tower Hamlets, Ramadan plays an important role in food outlets’ business cycles. Outlets remain open during the day but their customer base is much lower than average. Outlet owners use this ‘down time’ as an opportunity to make changes to their business, such as introducing new menu items or undertaking refurbishments. Another occasion that we noticed often prompted outlet owners to make changes to their menu was when they got their menus reprinted. In sit-down cafes where customers are given table menus, menus have to be reprinted annually as they become damaged. Owners use this as an opportunity to change their prices and/or add new meals onto their menus. Takeaways physically replace their menu boards less often and rely instead more on handmade promotional posters to alert customers to menu changes. Recommendation:
● Targeting outlets during Ramadan may help increase outlet engagement, as the owners and staff have more time and are more willing to take more risks than usual due to there being fewer customers.
6. Staff buy-in and compliance is as important as owners’ when it comes to implementation In our early engagement with outlets, we quickly realised that outlets often have a hierarchical structure and staff have little influence on the owner’s decision-making. We therefore focused on building relationships with the outlet owners and this was crucial in terms of getting their agreement to test interventions. Owners played an important role in implementing interventions, as staff would generally not do anything new unless expressly given permission to do so by the outlet owner. However when it came to implementing the interventions, we found that the behaviours of staff can have an influence on its success (particularly for interventions that require staff to do something differently, such as serving fries in a new chip box). This was also true for recording sales in outlets where the Epos software was not integrated with the till. Recommendation:
41

● We found that there were a number of things that we could do to help increase staff’s engagement with the interventions. First, was developing a personal relationship with the staff as well as the owner.
● Second was exposing staff earlier on to the intervention. For example, the owner of the outlet where we tested the redesigned chip box was involved in the design but not the staff. When it came to implementing the box the staff were hesitant at first. It was only when they had the opportunity to test it out for themselves and handle it that they became more accepting of it.
● Third, there needs to be consideration of how to incentive staff to increase their motivation. 7. Outlets need to know how to handle customer resistance to change The only intervention that experienced customer resistance was the redesigned chip box, due to the fact that customers noticed the smaller portion size. The outlet found it useful having a clear plan in place for how to handle customer comments. We agreed with them that if the customer actively refused the box, then staff could switch back to the standard box. While staff would typically switch to the standard box after only a little pushback from customers, the owner was more persistent. When the owner served customers, he took a different approach and would instead joke with the customers and encourage them to try the new box rather than switching to the standard box straight away. This helped increase adoption of the box by customers. The owner told us that he took this approach because he has a lot of experience in making changes to his business that are resisted by customers, and has learnt that ‘banter’ with customers can help increase the acceptability of a change. Recommendation:
● It is useful for outlets to have a backup plan in place for what to do if customers do not accept the intervention, and that staff are told how to respond to customer comments.
● Having a few ‘stock lines’ that staff can draw on may help, as well as witnessing how the owner deals with comments.
42

8. Conclusion and next steps
The influence and impact of the food environment on young people’s health is becoming increasingly clear. In Tower Hamlets there is an historical over-concentration of fast food outlets in the borough; on Burdett Road alone there are 17 outlets selling takeaway food. However not everything to do with fast food is ‘bad’; it is recognised that fast food outlets can provide an important social and cultural function for some young people such as offering safe, non-judgemental spaces, as well as employment for local residents. Tower Hamlets has a multi-faceted approach improve diets in the Borough. Actions to improve the wider food environment include planning restrictions to limit new hot food takeaways, promotion and support of existing markets selling fresh fruit and vegetables and urban growing projects. There has also been extensive work with existing businesses to both improve the wholesome of their food (Food for Health Awards) and to increase availability of fresh fruit and vegetables (Buywell). However many local authorities struggle to engage fast food outlets in health improvement initiatives. This is due to the gap between what is important to the businesses (sales, costs and customer satisfaction) and what is important to local authority initiatives (i.e. reduction in calories and improvements in nutritional profile). If outlet engagement is to be increased, it is therefore important to explore a radically new approach to working with fast food outlets - one that focuses on the commercial opportunities for businesses, whether that helping them promote sales of existing (healthier) menu items to help outlets diversify their sales, or helping businesses minimise their ingredients costs through reducing portion sizes and wastage. As well as temporarily changing the food environment by making adaptations in four outlets on Burdett Road, this feasibility study provided important insight into how to work with fast food businesses to make health improvements. Crucially, we found that outlet owners are more willing to engage in health improvements if they can see the opportunities for business development. While outlet owners were initially skeptical that health improvements could be compatible with business interests, this feasibility study has demonstrated that making small changes such as adding labels onto menus or renaming a meal can influence customer decision-making and help outlets increase their sales.
43

The next step of the Stealthy Fast Project will be to use the learning gained through these intervention tests to develop a model of engagement for working with outlets that highlights the financial benefits of a range of interventions on outlet profit margins, and the cost savings that outlets could potentially accrue.
44

Appendix 1. The ‘Pitch’ document shared with outlet owners during the recruitment phase
45

46

47

48

49


