Critical point (also called a critical state) is a point in which the distinction between the liquid
and gas (or vapour) phases disappears, i.e., both phases have the same temperature, pressure and
density. The critical point is, therefore, characterized by these phase state which have unique
values for each pure substance.
Deteriorated Heat Transfer is characterized with lower values of the wall heat transfer
coefficient compared to those at the normal heat transfer; and hence has higher values of wall
temperature within some part of a test section or within the entire test section.
Improved Heat Transfer is characterized with higher values of the wall heat transfer coefficient
compared to those at the normal heat transfer; and hence lower values of wall temperature within
some part of a test section or within the entire test section.
Normal Heat Transfer can be characterized in general with wall heat transfer coefficients
similar to those of subcritical convective heat transfer far from the critical or pseudocritical
regions. Only normal heat transfer regime was considered in the thesis.
Pseudocritical point is a point at a pressure above the critical pressure and at a temperature
above the critical temperature that corresponds to the maximum value of the specific heat for this
particular pressure.
Supercritical fluid is a fluid at pressures and temperatures that are higher than the critical
pressure and critical temperature.
Superheated steam is a steam at pressures below the critical pressure, but at temperatures above
the critical temperature.
19
NOMENCLATURE cp specific heat, J/kg⋅K
D diameter, m
h specific enthalpy, J/kg
htc heat-transfer coefficient, W/m2⋅K
k thermal conductivity, W/m⋅K
kinf reactor multiplication constant for infinite lattice
Kir neutron flux irregularity coefficient
m mass-flow rate, kg/s
P pressure, MPa
Q power or heat-transfer rate, W
R radius, m
s specific entropy, J/kg K
T temperature, °C
x steam content
Greek letters
α thermal diffusivity, m2/s
Δ difference
π steam-superheating-zone to boiling-zone power ratio
µ dynamic viscosity, Pa⋅s
Non-dimensional Numbers
Nu Nusselt number hyhtc Dk⋅
Pr Average Prandtl number w b
w b
h hk T Tµ −⋅ −
20
Pr Prandtl number pck
µ ⋅
Re Reynolds number 4
hy
mDµπ
Subscripts
b bulk-fluid
cr critical
e electrical
hy hydraulic
in inlet
main refers to main or primary steam directed to turbine
out outlet
reheat refers to secondary or superheated steam directed to turbine
th thermal
w wall
wt weight
Abbreviations and Acronyms
AECL Atomic Energy of Canada Limited
AHFP Axial Heat Flux Profile
BNPP Beloyarsk Nuclear Power Plant
BONUS BOiling NUclear Superheater
BORAX BOiling Reactor Experiment
BW Boling-Water (channel)
BWR Boiling Water Reactor
CANDU CANada Deuterium Uranium (reactor)
CANFLEX CANada FLEXible (fueling)
CCP Pump of Reactor Control System Cooling
CEP Condenser-Extraction Pump
21
CND Condenser
CR-SCP Channelized Reactor with water at SuperCritical Pressure
ESADE Superheat Advance Demonstration Experiment
FEP Feeding Electric Pump
FWP Feedwater Pump
HHV Higher-Heating Value
HP High Pressure
HTC Heat Transfer Coefficient
HTP Heat-Transport Pump
HTR Heater
HWR Heavy Water Reactor
HX Heat eXchanger
ID Inside Diameter
IP Intermediate Pressure (turbine)
KP-SKD Channel Reactor of Supercritical Pressure (in Russian abbreviations)
LHV Lower-Heating Value
LP Low Pressure
LUEC Levelized-Unit-Energy Cost
LWR Light Water Reactors
Max. Maximum
MCP Main Circulation Pump
Min. Minimum
MIT Massachusetts Institute of Technology
MSR Moisture Separator and Reheater
NIKIET Russian abbreviation of RDIPE
NRC National Resources Canada
NSERC Natural Sciences and Engineering Research Council
NPP Nuclear Power Plant
OD Outside Diameter
O&M Operating and Maintaining
PCh Pressure Channel
22
PCP Pump of Protective System Cooling
PT Pressure Tube (reactor)
PV Pressure Vessel (reactor)
PWR Pressurized Water Reactor
RB Reactor Building
RBMK Russian Acronym for Channelized Reactor of High-Power
RDIPE Research and Development Institute of Power Engineering (Moscow, Russia)
RFP Reactor Feedwater Pump
SADE Superheat Advance Demonstration Experiment
SC SuperCritical
SCW Supercritical Water
SCWR Supercritical Water Reactor
SG Steam Generator
SGHWR Steam Generating Heavy Water Reactor
SHS SuperHeated Steam (channel)
SS Stainless Steel
T Turbine
USAEC United States Atomic Energy Commission
Z Zirconium
23
CHAPTER 1
INTRODUCTION
One of the six Generation-IV nuclear reactor concepts1
1 The other five Generation IV systems are: gas-cooled fast reactor, very-high-temperature reactor, lead-cooled
fast reactor, molten salt reactor, and sodium-cooled fast reactor.
is a SuperCritical Water-cooled nuclear
Reactor (SCWR), which is currently under development worldwide. An SCWR is a reactor that
uses water at SuperCritical (SC) pressure as its coolant and generates SC “steam” at the reactor
outlet. The main objectives for developing and utilizing SCWRs are: 1) To increase the thermal
efficiency of Nuclear Power Plants (NPPs) from the current range of 33 – 35% to approximately
45 – 50% (based on gross-plant efficiency); 2) To decrease the capital and Operating and
Maintaining (O&M) costs and, in doing so, decrease the unit-energy cost; and 3) Possibility for
co-generation, including hydrogen generation (Naterer et al. 2009; Naidin et al. 2009b,c; Mokry
et al. 2008).
The SCWR concepts (Pioro and Duffey 2007) follow two main types: (a) A large reactor
Pressure Vessel (PV), analogous to conventional Light Water Reactors (LWRs); or (b) a
channelized reactor in which individual Pressure Tubes (PTs) or Pressure Channels (PChs) carry
high pressure, analogous to conventional Heavy Water Reactors (HWRs).
Within these two main classes (PV and PT) (Pioro and Duffey 2007), PT reactors are more
flexible with respect to flow, flux and density changes than the PV reactors. A design whose
basic element is a channel has an inherent advantage of greater safety than large vessel structures
at supercritical pressures. In particular, the separation between moderator and coolant in a PT
SCWR allows for significant enhancement in safety. Particularly, the moderator will serve as a
back-up heat sink at normal and accident conditions and will reject heat through moderator-
cooling system (Chow and Khartabil 2008). This design requires no operator action and has the
potential to eliminate practically the possibility of core damage.
24
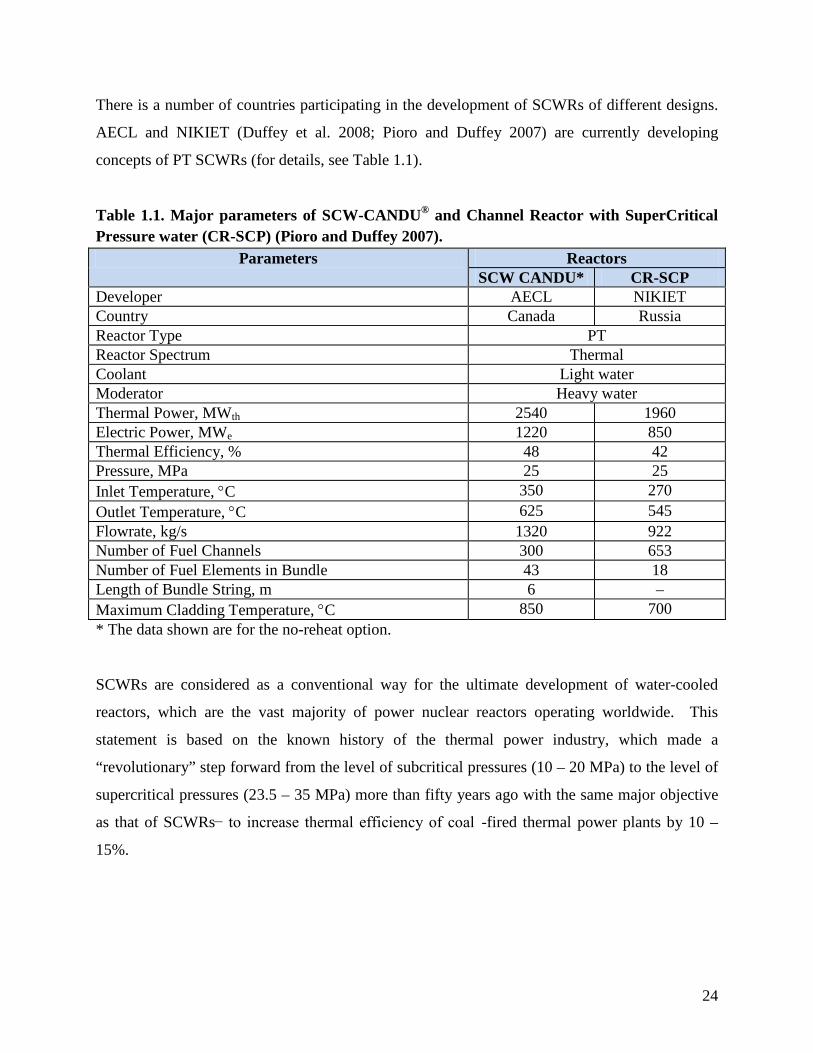
There is a number of countries participating in the development of SCWRs of different designs.
AECL and NIKIET (Duffey et al. 2008; Pioro and Duffey 2007) are currently developing
concepts of PT SCWRs (for details, see Table 1.1).
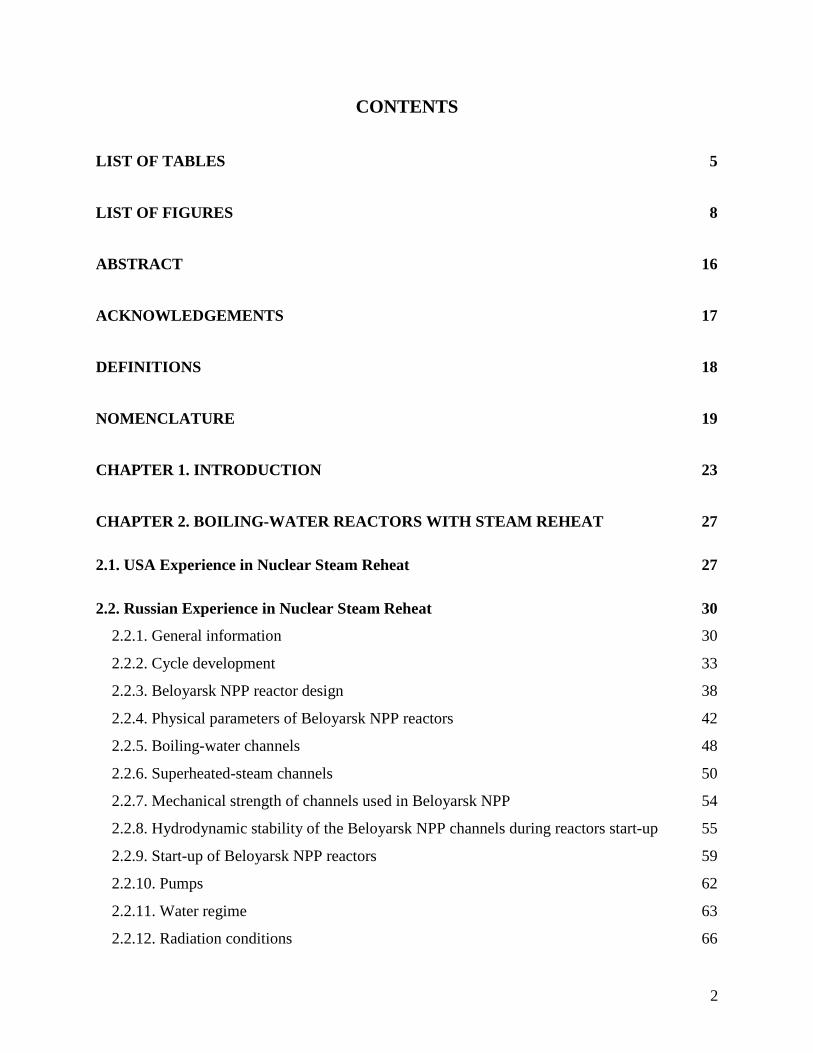
Table 1.1. Major parameters of SCW-CANDU® and Channel Reactor with SuperCritical Pressure water (CR-SCP) (Pioro and Duffey 2007).
Parameters Reactors SCW CANDU* CR-SCP
Developer AECL NIKIET Country Canada Russia Reactor Type PT Reactor Spectrum Thermal Coolant Light water Moderator Heavy water Thermal Power, MWth 2540 1960 Electric Power, MWe 1220 850 Thermal Efficiency, % 48 42 Pressure, MPa 25 25 Inlet Temperature, °C 350 270 Outlet Temperature, °C 625 545 Flowrate, kg/s 1320 922 Number of Fuel Channels 300 653 Number of Fuel Elements in Bundle 43 18 Length of Bundle String, m 6 – Maximum Cladding Temperature, °C 850 700 * The data shown are for the no-reheat option.
SCWRs are considered as a conventional way for the ultimate development of water-cooled
reactors, which are the vast majority of power nuclear reactors operating worldwide. This
statement is based on the known history of the thermal power industry, which made a
“revolutionary” step forward from the level of subcritical pressures (10 – 20 MPa) to the level of
supercritical pressures (23.5 – 35 MPa) more than fifty years ago with the same major objective
as that of SCWRs − to increase thermal efficiency of coal -fired thermal power plants by 10 –
15%.
25
(a)
(b)
Figure 1.1. T-s diagram of no-reheat (a) and single-reheat (b) cycles (Pioro et al. 2010).
It is well-known that the thermal efficiency of the cycle can be increased by 2 – 4% with the
implementation of steam reheat (T-s diagrams of no-reheat and single-reheat cycles are presented
in Fig. 1.1). For that reason, currently, majority of the SC turbines are designed with a steam-
reheat option. Furthermore, reheating steam reduces the amount of moisture in the last stages of
the turbine. The increase in efficiency of the cycle with steam-reheat as compared to that of the
26
cycle with no-reheat is achieved due to extra heat added during steam-reheat stage (Pioro et al.
2010).
Therefore, it is important to summarize both the 50-year experience of the coal-fired thermal
power industry and experience of implementing nuclear steam reheat at several experimental
Boiling Water Reactors (BWRs) worldwide and utilize it in the context of developing SCWRs
concepts with steam-reheat option. The general idea behind using this experience is to develop
SCWRs, which are capable to operate successfully and efficiently with the proven SC
technology, specifically the SC turbines from the thermal power industry.
Therefore, the main objectives of the thesis are:
1. To make a comprehensive literature review of operating experience of BWRs with
nuclear steam reheat. No one has performed such a review before.
2. To develop a detailed thermal layout of a NPP with nuclear steam reheat at parameters
that would be close to those in the proposed SCWR concept.
3. To perform and compare heat-transfer calculations of SHS and SCW channels with
different fuels and at different power conditions.
4. Analyze the calculations and decide which fuel is suitable for the SHS and SCW
conditions.
Chapter 2 of the thesis presents the literature review of operating experience of BWRs with
nuclear steam. Review of supercritical thermal power plants is presented in Chapter 3. Chapter
4 is devoted to general consideration of thermal layouts for SCW NPPs. The developed detailed
thermal layouts of SCW NPP with nuclear steam reheat are also presented in Chapter 4. Review
of heat-transfer correlations for SCW and SHS conditions as well as the results of heat-transfer
calculations are presented in Chapter 5. Conclusions are summarized in Chapter 6. Some ideas
on future work are presented in Chapter 7.
27
CHAPTER 2
BOILING-WATER REACTORS WITH STEAM REHEAT
Major advancements in implementation of steam reheat inside the reactor core were made in the
USA and Russia in 1960s – 1970s. No signs of any significant activity in this field in other
countries were found. Three experimental reactors in the USA and two power reactors in Russia
were developed, in which nuclear steam reheat was successfully implemented. It was realized
that the next advancement in nuclear-reactor technology and improvement in thermal efficiency
could be achieved by utilizing both coolant at supercritical parameters and subcritical
superheated steam. However, at that time there were no reliable materials that could withstand
high-temperature and high-pressure environment along with high neutron irradiation. Since the
1980’s, the advancements in metallurgical technology has improved the reliability of materials to
be used in supercritical-water environment, and recently the idea of SCWR was revived as as the
ultimate development path for water cooling (Pioro and Duffey 2007). Further increase in
thermal efficiency will be achieved by implementing nuclear steam reheat. Therefore, it is
important to summarize known experience in nuclear steam reheat that was implemented in
several BWRs.
2.1. USA Experience in Nuclear Steam Reheat
An active program for the development and demonstration of BWRs with nuclear steam reheat
was implemented and directed by the United States Atomic Energy Commission (USAEC). Two
general types of the reactors were demonstrated:
1. Reactors in which steam was generated and reheated in the same core (integral reheating
design); and
2. Reactors which only used reheated steam that was supplied from another source (separate
reheating design);
28
Under the USAEC program, the following reactors were constructed: Boiling Reactor
Experiment V (BORAX–V, started operation in December of 1962), BOiling NUclear
Superheater (BONUS, started operation in December of 1964), and Pathfinder (started operation
in July of 1966). Main parameters of these reactors are listed in Tables 2.1 and 2.2 (Novick et al.
1965).
At the design stage of these reactors a certain number of problems arising with the
implementation of steam reheat were realized and addressed. Among them were:
1. Fuel-element sheath performance and corrosion resistance at high temperatures;
2. Corrosion, erosion, and deposits on fuel-element surfaces due to ineffective steam
separation prior to the reheating-zone inlet;
3. Maintenance of the desired power split in the evaporating and reheating zones during
extended reactor operation;
4. Fission products carry-over in direct-cycle systems; And
5. Reactivity changes as a result of inadvertent flooding of the reheating zone.
In search of the solutions to these problems USAEC also instituted a number of programs to
determine long-term integrity and behavior of the fuel-element sheath. Since May of 1959, the
Superheat Advance Demonstration Experiment (SADE) and the subsequent Expanded SADE
(ESADE) loops had been utilized to irradiate a total of 21 fuel elements in the Vallecitos BWR.
Saturated steam at about 6.9 MPa from the Vallecitos BWR was supplied to the fuel-element
section where it was superheated to temperatures of 418 – 480°C. The results of those
irradiation tests combined with out-of-core corrosion tests led to the following conclusions
(Novick et al. 1965):
1. Commercial 18-8 stainless steel (18-8 SS) was not satisfactory for fuel-sheath material in
the SHS environment it was subjected to in the SADE and ESADE experiments;
2. Materials with higher nickel-alloy content, such as Inconel and Incoloy, appeared to
perform satisfactorily as a sheath material in the SHS environment; And
3. Strain cycling coupled with environmental chemistry were significant in the failure rate
29
of sheath materials for reactors with steam reheat.
Additional information on design of these reactors constructed under the USAEC program can
be found in USAEC reports 1959, 1961, and 1962 and in Ross (1961).
The major conclusion, which is based on the USA experience with nuclear steam reheat, is that
the nuclear steam reheat is possible, and higher thermal efficiencies can be achieved, but this
feature requires more complicated reactor-core design and better materials.
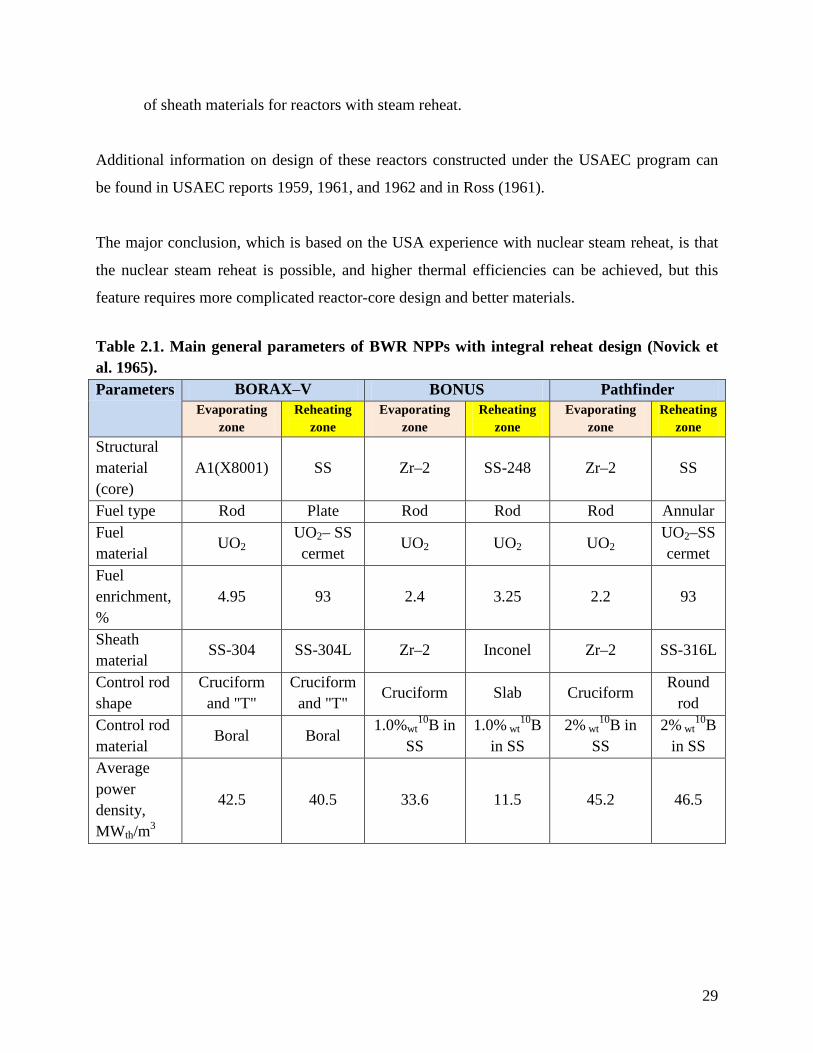
Table 2.1. Main general parameters of BWR NPPs with integral reheat design (Novick et al. 1965). Parameters BORAX–V BONUS Pathfinder
Evaporating zone
Reheating zone
Evaporating zone
Reheating zone
Evaporating zone
Reheating zone
Structural material (core)
A1(X8001) SS Zr–2 SS-248 Zr–2 SS
Fuel type Rod Plate Rod Rod Rod Annular Fuel material
UO2 UO2– SS cermet
UO2 UO2 UO2 UO2–SS cermet
Fuel enrichment, %
4.95 93 2.4 3.25 2.2 93
Sheath material
SS-304 SS-304L Zr–2 Inconel Zr–2 SS-316L
Control rod shape
Cruciform and "T"
Cruciform and "T"
Cruciform Slab Cruciform Round
rod Control rod material
Boral Boral 1.0%wt
10B in SS
1.0% wt10B
in SS 2% wt
10B in SS
2% wt10B
in SS Average power density, MWth/m3
42.5 40.5 33.6 11.5 45.2 46.5
30
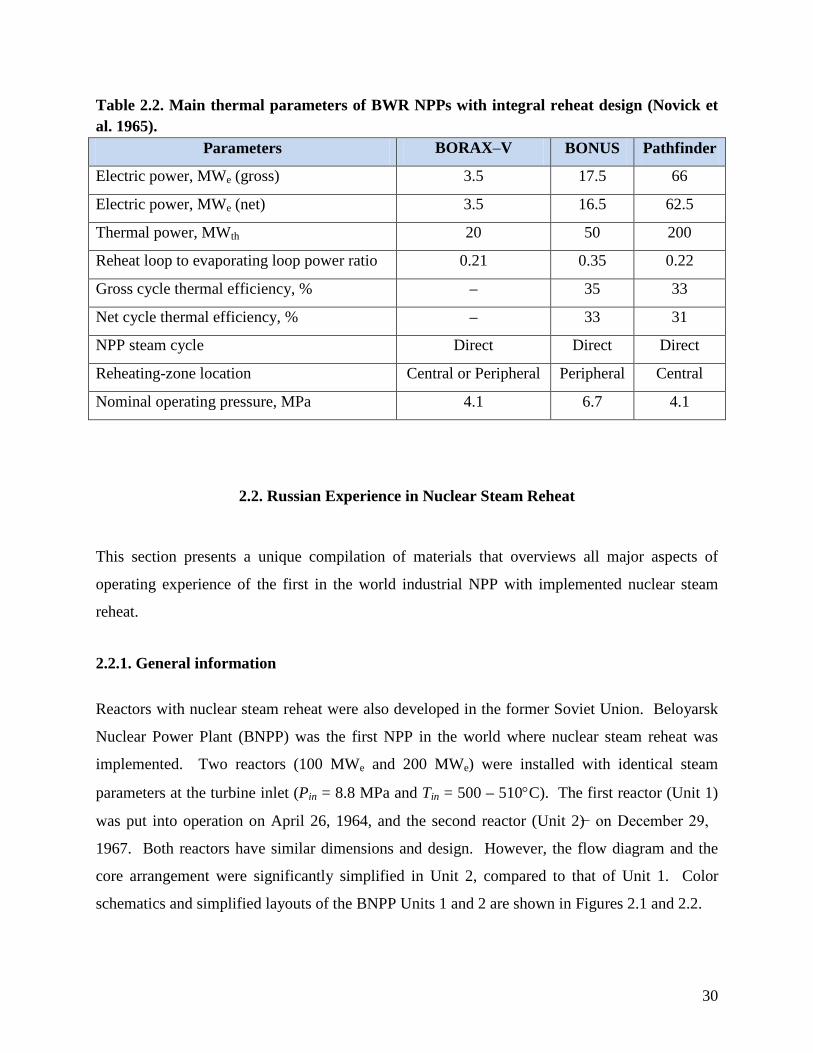
Table 2.2. Main thermal parameters of BWR NPPs with integral reheat design (Novick et al. 1965).
Parameters BORAX–V BONUS Pathfinder
Electric power, MWe (gross) 3.5 17.5 66
Electric power, MWe (net) 3.5 16.5 62.5
Thermal power, MWth 20 50 200
Reheat loop to evaporating loop power ratio 0.21 0.35 0.22
Gross cycle thermal efficiency, % – 35 33
Net cycle thermal efficiency, % – 33 31
NPP steam cycle Direct Direct Direct
Reheating-zone location Central or Peripheral Peripheral Central
Nominal operating pressure, MPa 4.1 6.7 4.1
2.2. Russian Experience in Nuclear Steam Reheat
This section presents a unique compilation of materials that overviews all major aspects of
operating experience of the first in the world industrial NPP with implemented nuclear steam
reheat.
2.2.1. General information
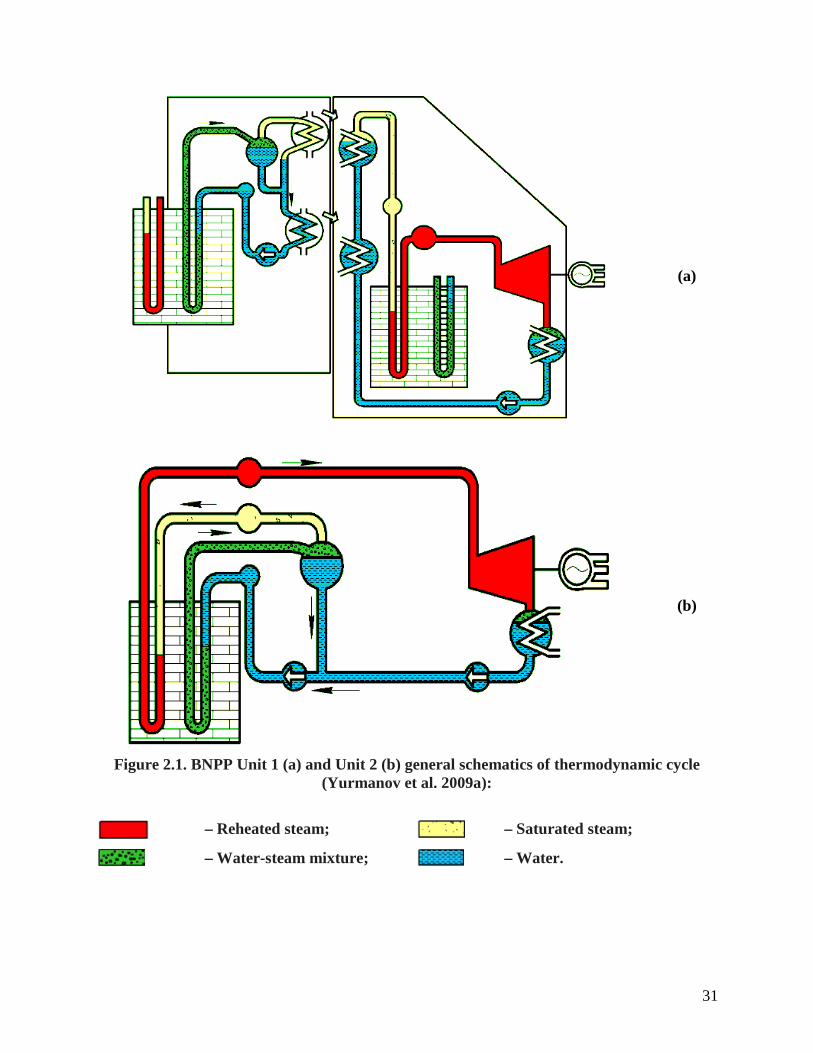
Reactors with nuclear steam reheat were also developed in the former Soviet Union. Beloyarsk
Nuclear Power Plant (BNPP) was the first NPP in the world where nuclear steam reheat was
implemented. Two reactors (100 MWe and 200 MWe) were installed with identical steam
parameters at the turbine inlet (Pin = 8.8 MPa and Tin = 500 – 510°C). The first reactor (Unit 1)
was put into operation on April 26, 1964, and the second reactor (Unit 2) − on December 29,
1967. Both reactors have similar dimensions and design. However, the flow diagram and the
core arrangement were significantly simplified in Unit 2, compared to that of Unit 1. Color
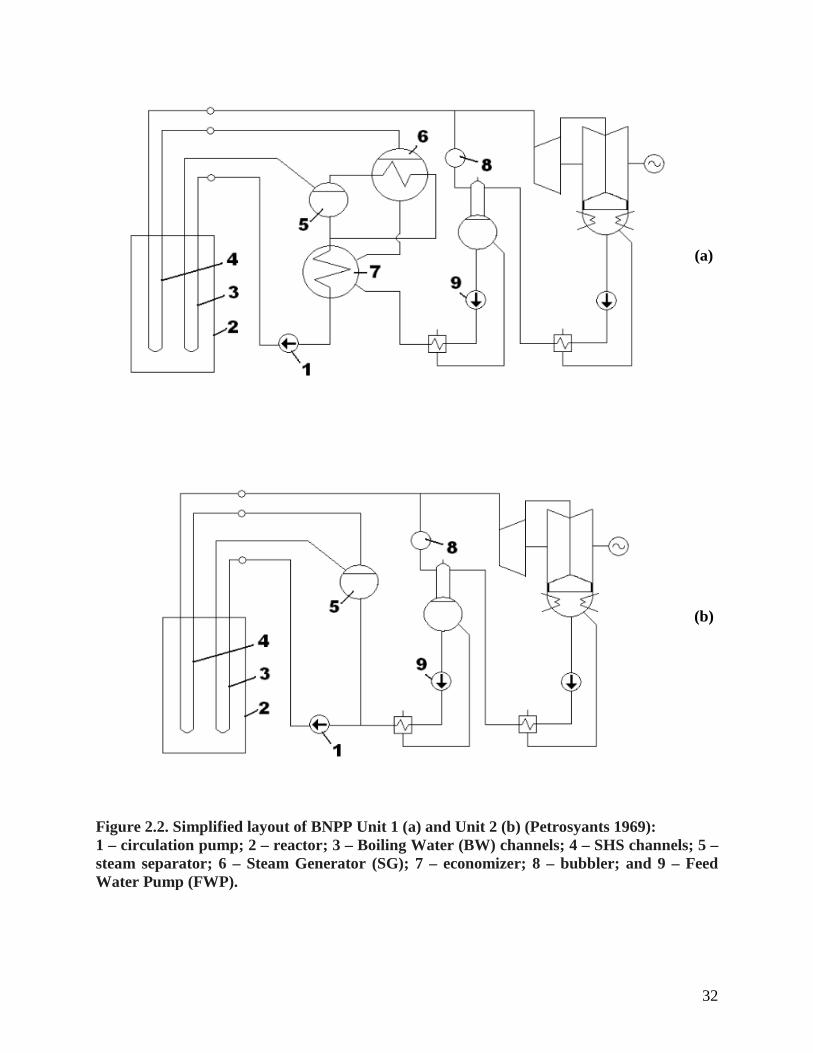
schematics and simplified layouts of the BNPP Units 1 and 2 are shown in Figures 2.1 and 2.2.
31
(a)
(b)
Figure 2.1. BNPP Unit 1 (a) and Unit 2 (b) general schematics of thermodynamic cycle (Yurmanov et al. 2009a):
– Reheated steam; – Saturated steam;
– Water-steam mixture; – Water.
32
(a)
(b)
Figure 2.2. Simplified layout of BNPP Unit 1 (a) and Unit 2 (b) (Petrosyants 1969): 1 – circulation pump; 2 – reactor; 3 – Boiling Water (BW) channels; 4 – SHS channels; 5 – steam separator; 6 – Steam Generator (SG); 7 – economizer; 8 – bubbler; and 9 – Feed Water Pump (FWP).
33
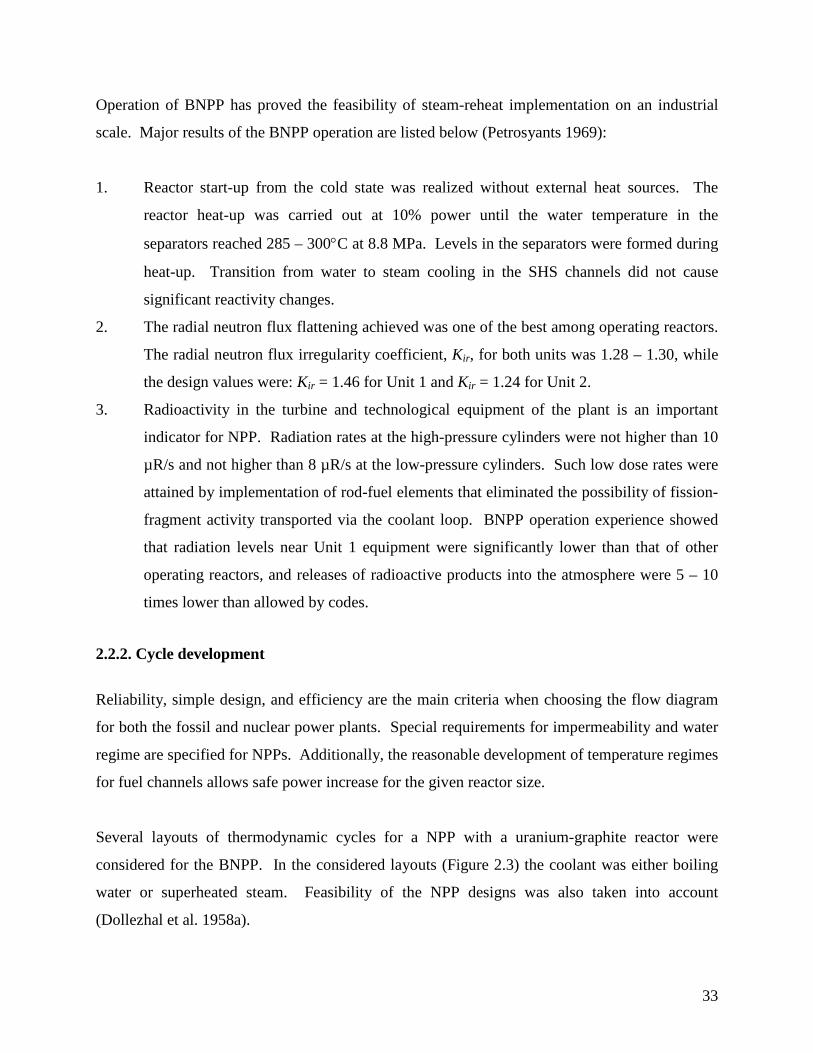
Operation of BNPP has proved the feasibility of steam-reheat implementation on an industrial
scale. Major results of the BNPP operation are listed below (Petrosyants 1969):
1. Reactor start-up from the cold state was realized without external heat sources. The
reactor heat-up was carried out at 10% power until the water temperature in the
separators reached 285 – 300°C at 8.8 MPa. Levels in the separators were formed during
heat-up. Transition from water to steam cooling in the SHS channels did not cause
significant reactivity changes.
2. The radial neutron flux flattening achieved was one of the best among operating reactors.
The radial neutron flux irregularity coefficient, Kir, for both units was 1.28 – 1.30, while
the design values were: Kir = 1.46 for Unit 1 and Kir = 1.24 for Unit 2.
3. Radioactivity in the turbine and technological equipment of the plant is an important
indicator for NPP. Radiation rates at the high-pressure cylinders were not higher than 10
µR/s and not higher than 8 µR/s at the low-pressure cylinders. Such low dose rates were
attained by implementation of rod-fuel elements that eliminated the possibility of fission-
fragment activity transported via the coolant loop. BNPP operation experience showed
that radiation levels near Unit 1 equipment were significantly lower than that of other
operating reactors, and releases of radioactive products into the atmosphere were 5 – 10
times lower than allowed by codes.
2.2.2. Cycle development
Reliability, simple design, and efficiency are the main criteria when choosing the flow diagram
for both the fossil and nuclear power plants. Special requirements for impermeability and water
regime are specified for NPPs. Additionally, the reasonable development of temperature regimes
for fuel channels allows safe power increase for the given reactor size.
Several layouts of thermodynamic cycles for a NPP with a uranium-graphite reactor were
considered for the BNPP. In the considered layouts (Figure 2.3) the coolant was either boiling
water or superheated steam. Feasibility of the NPP designs was also taken into account
(Dollezhal et al. 1958a).
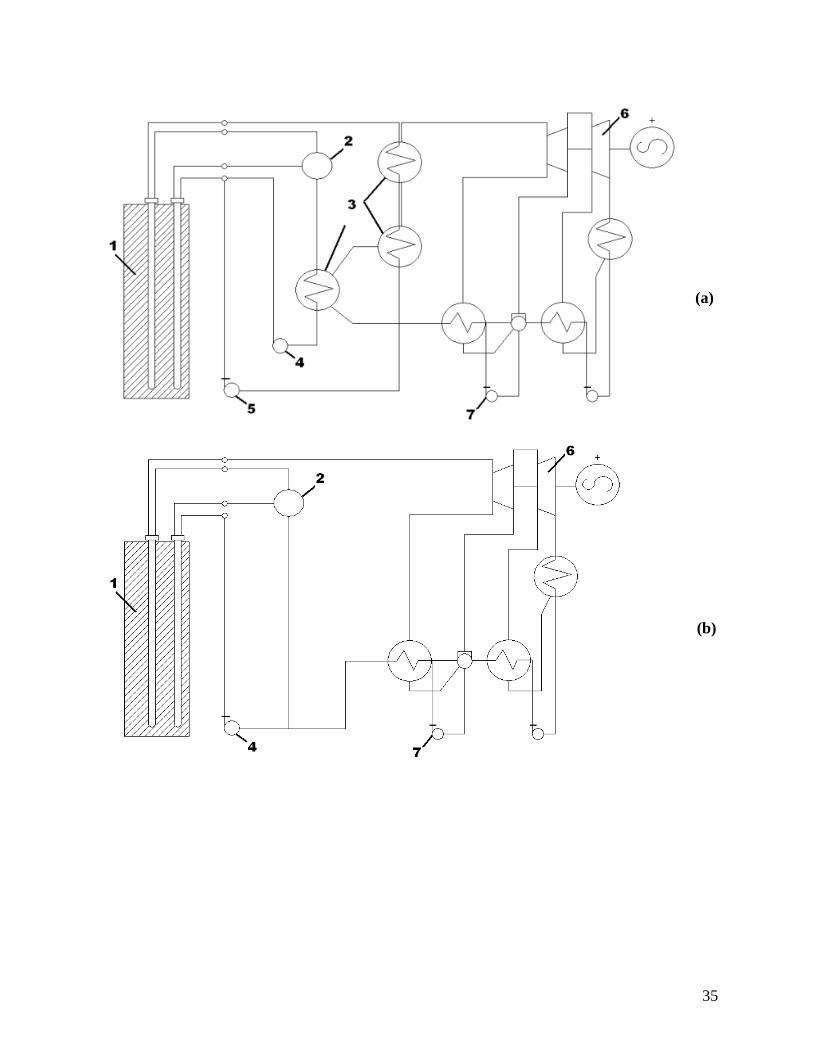
34
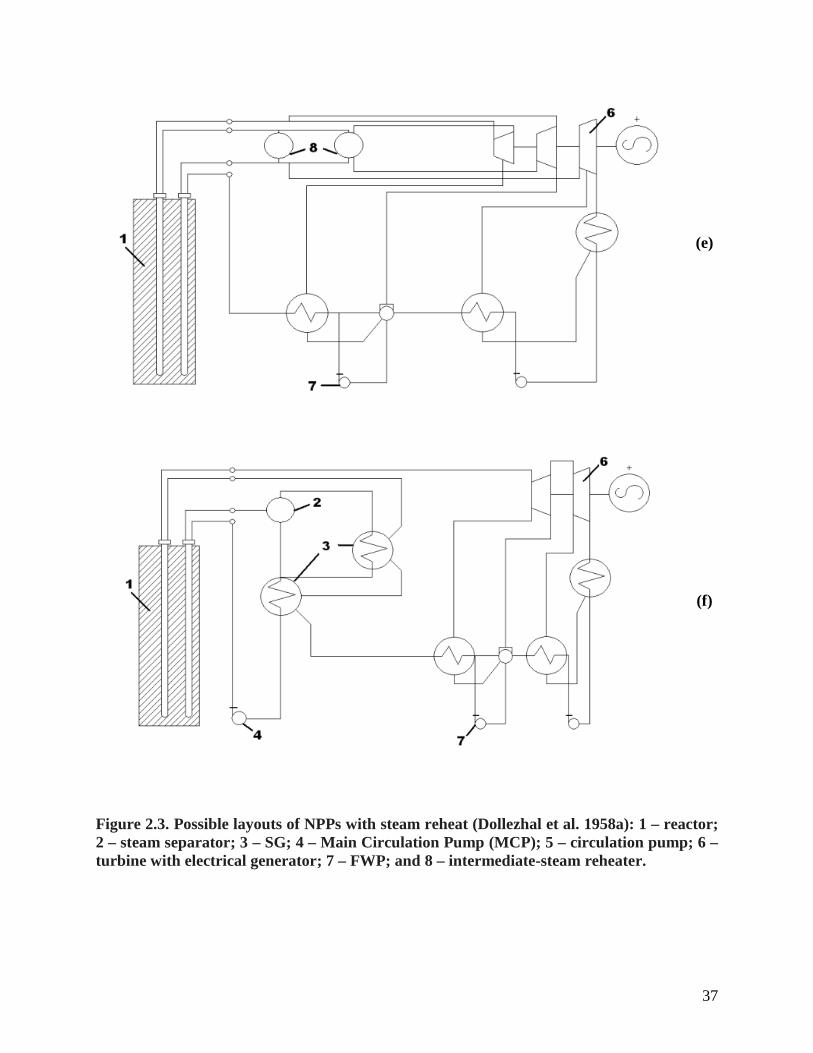
Layout (a). A steam separator, steam generator (consisting of preheating, boiling and steam-
superheating sections), and two circulation pumps are included in the primary coolant loop.
Water and very high-pressure steam are the primary coolants. High- and intermediate-pressure
steam is generated in the secondary loop and directed to the turbine.
Layout (b). Direct-cycle layout. Steam from a reactor flows directly to a turbine. The turbine
does not require an intermediate-steam reheat.
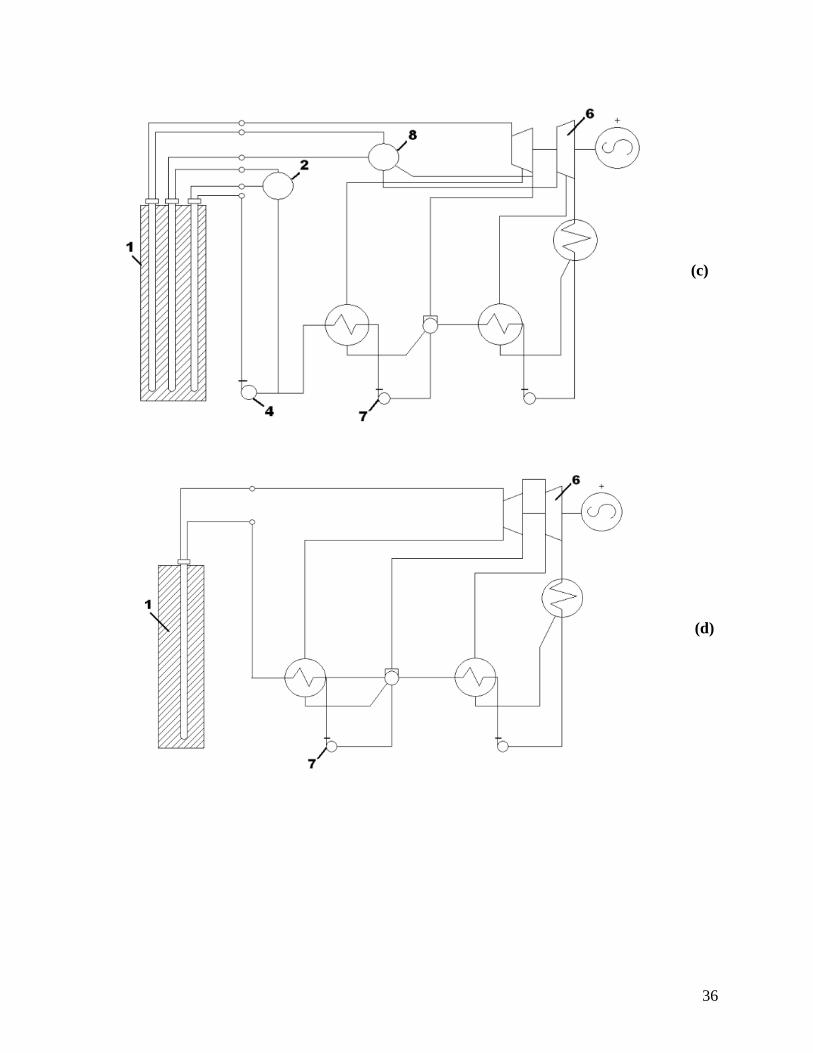
Layout (c). Steam from a reactor flows directly to a turbine. In contrast to Layout (b), the
turbine requires the intermediate-steam reheat. The reactor has three types of operating fuel
channels: 1) water preheating, 2) evaporating-boiling, and 3) steam-superheating.
Layout (d). Direct-cycle layout. The evaporation and reheat are achieved inside a reactor. The
turbine does not require the intermediate-steam reheat.
Layout (e). Direct-cycle layout. One or two intermediate-steam reheats are required.
Layout (f). Water circulates in the closed loop consisting of a reactor, steam separator,
preheater, and circulation pump. Partial evaporation is achieved in the first group of channels.
Steam exiting the steam separator is directed to the boiling section of the steam generator and
condenses there. Condensate from the boiler is mixed with water from the separator. The cooled
water is fed to a preheater and then directed to circulation pumps. The generated steam on the
secondary side is superheated in the second group of channels and then directed to the turbine.
35
(a)
(b)
36
(c)
(d)
37
(e)
(f)
Figure 2.3. Possible layouts of NPPs with steam reheat (Dollezhal et al. 1958a): 1 – reactor; 2 – steam separator; 3 – SG; 4 – Main Circulation Pump (MCP); 5 – circulation pump; 6 – turbine with electrical generator; 7 – FWP; and 8 – intermediate-steam reheater.
38
Layouts (b–e) were not recommended due to unpredictable water-chemistry regimes at various
locations throughout the thermodynamic cycle. Layout (a) with the secondary-steam reheat
required high pressures and temperatures in the primary loop. Circulation pumps with different
parameters (power and pressure) were used to feed common header upstream of the channels of
the primary group. In this respect, Layout (a) was considerably more complex and expensive
than Layout (f). Activation of SHS which could occur in Layout (f) wasn't considered to be
posing any significant complications to the turbine operation, and hence remained a viable option
(Dollezhal et al, 1958a).
From the considerations above, Layout (f) was chosen to be developed at the BNPP Unit 1.
Surface-corrosion products in the secondary loop and salts in condenser coolant were trapped in
the steam generator and removed from it during purging. Additionally, modern separators
provided steam of high quality, which resulted in very low salt deposits in the turbine.
2.2.3. Beloyarsk NPP reactor design
The reactor was placed in a cylindrical concrete cavity, where the 3-m thick wall served as a part
of the biological shield. A cooled ferro-concrete base of the reactor with six base jacks was
implemented on the bottom of the cavity. The bottom bedplate attached to the bottom supporting
ring was held by jacks. Cooling coils were placed on the bottom of the bedplate to provide its
cooling.
The cylindrical graphite stack (3 m in diameter, 4.5 m in height) of the reactor was installed on
the bottom bedplate. The stack was made of columns, assembled of hexagonal blocks (0.12 m
width across corners) in the center and of sectors in the periphery. The central part of the stack
was penetrated by vertical operating channels (long graphite cylinders containing inner thin steel
tubes with fuel elements). The reactor core (7.2-m diameter and 6-m height) was surrounded
with a 0.8-m thick graphite reflector. An additional 1-m thick graphite layer and an approx 0.5-
m cast iron layer over the upper reflector formed the principal part of the biological shield. A
0.6-m thick graphite layer serving as the lower neutron shield was located below the lower
39
reflector.
The graphite stack (9.6-m overall diameter and 9.0-m height) was enclosed in a gas-tight
cylindrical carbon-steel shell filled with nitrogen to prevent graphite deterioration. The outer
graphite blocks were penetrated by steel uprights with horizontal lateral braces in several places
along their height. The entire stack rested on the bottom bedplate. The graphite stack was
covered on the top with a plate carrying standpipes with openings for the insertion of operating
channels. The piping for feeding the coolant to the fuel bundles and for removing the coolant
water from control rods was located between the standpipes. The piping of the operating
channels and protective coating failure-detection system was also located between the
standpipes. The plate rested on supports installed on the tank of the side water shield. The plate
was connected with the graphite stack shell by means of a compensator, which allowed both for
vertical elongations of the shell and horizontal elongations of the plate, which occurred during
heating (Emelyanov et al. 1982).
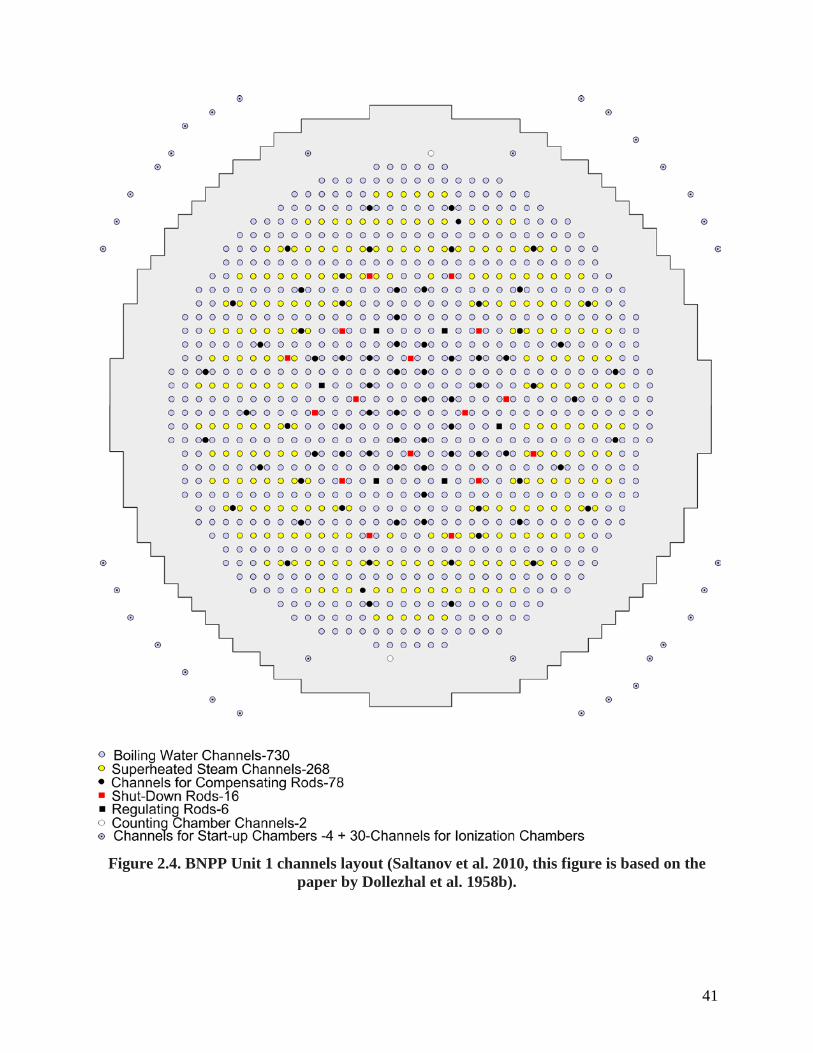
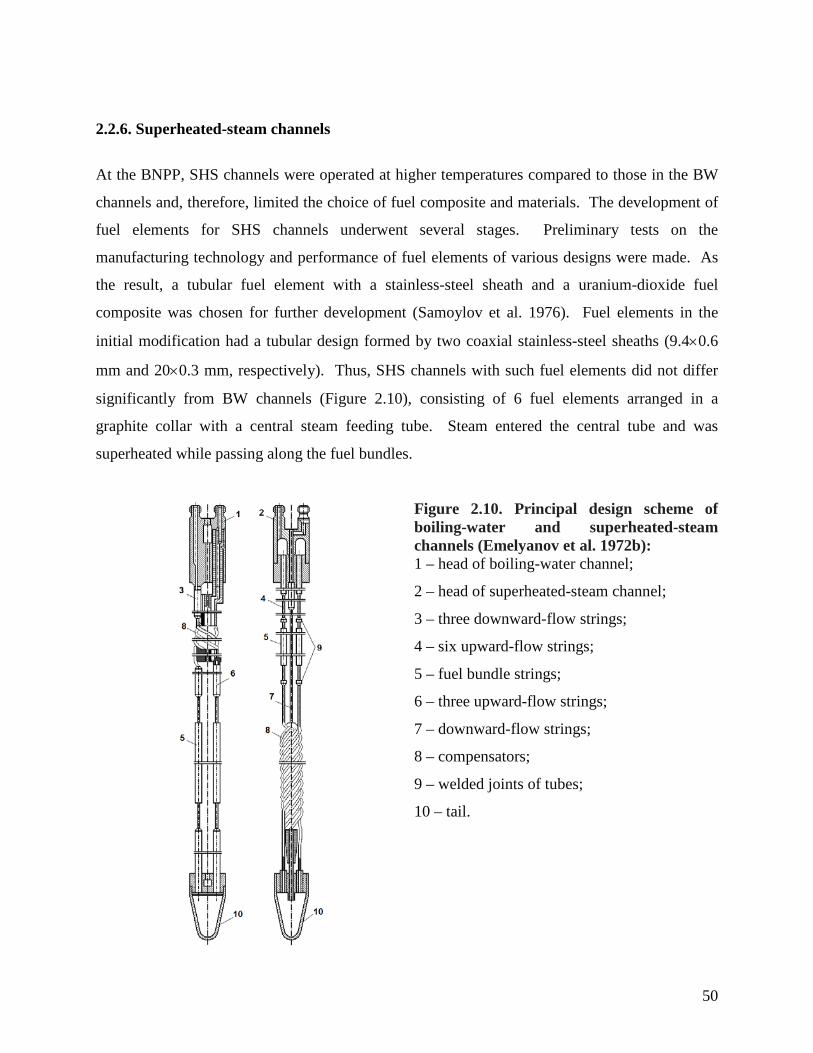
The reactor had 1134 operating channels as shown in Figure 2.4 and contained 998 fuel
channels, 6 automatic control rods, 78 channels for reactivity compensating rods, 16 shut-down
rods, and 36 channels for ionization chambers and counters. The fuel channels were represented
with 730 Boiling Water (BW) channels, also known as evaporating channels, and 268
SuperHeated Steam (SHSs) channels .
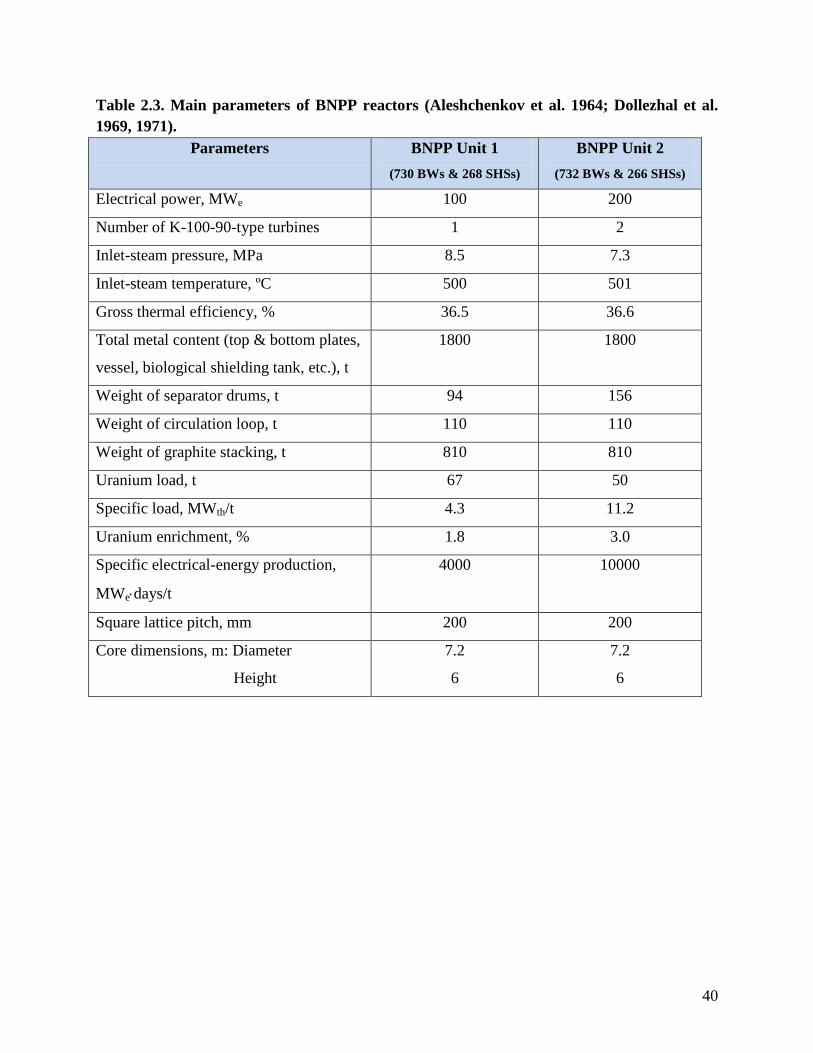
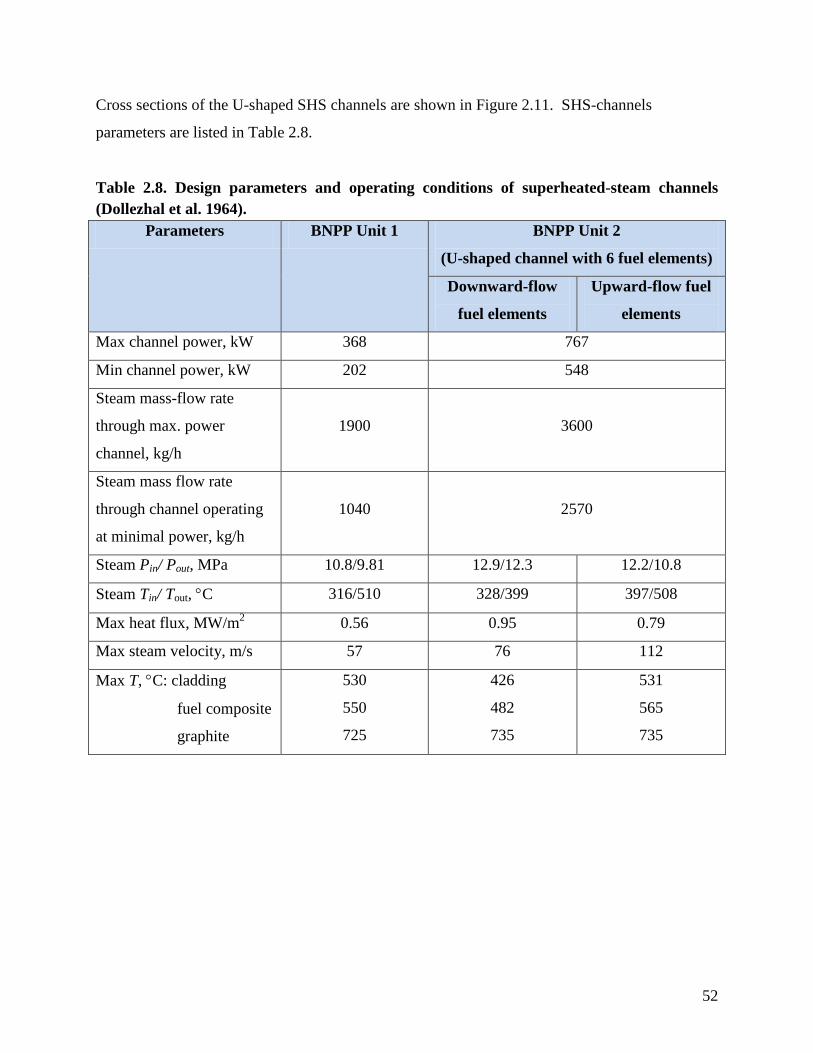
The main parameters of the BNPP reactors are listed in Table 2.3.
40
Table 2.3. Main parameters of BNPP reactors (Aleshchenkov et al. 1964; Dollezhal et al. 1969, 1971).
Parameters BNPP Unit 1 (730 BWs & 268 SHSs)
BNPP Unit 2 (732 BWs & 266 SHSs)
Electrical power, MWe 100 200
Number of K-100-90-type turbines 1 2
Inlet-steam pressure, MPa 8.5 7.3
Inlet-steam temperature, ºC 500 501
Gross thermal efficiency, % 36.5 36.6
Total metal content (top & bottom plates,
vessel, biological shielding tank, etc.), t
1800 1800
Weight of separator drums, t 94 156
Weight of circulation loop, t 110 110
Weight of graphite stacking, t 810 810
Uranium load, t 67 50
Specific load, MWth/t 4.3 11.2
Uranium enrichment, % 1.8 3.0
Specific electrical-energy production,
MWe⋅days/t
4000 10000
Square lattice pitch, mm 200 200
Core dimensions, m: Diameter
Height
7.2
6
7.2
6
41
Figure 2.4. BNPP Unit 1 channels layout (Saltanov et al. 2010, this figure is based on the
paper by Dollezhal et al. 1958b).
42
2.2.4. Physical parameters of Beloyarsk NPP reactors
General operating data of the BNPP Units 1 and 2 are listed in Table 2.4.
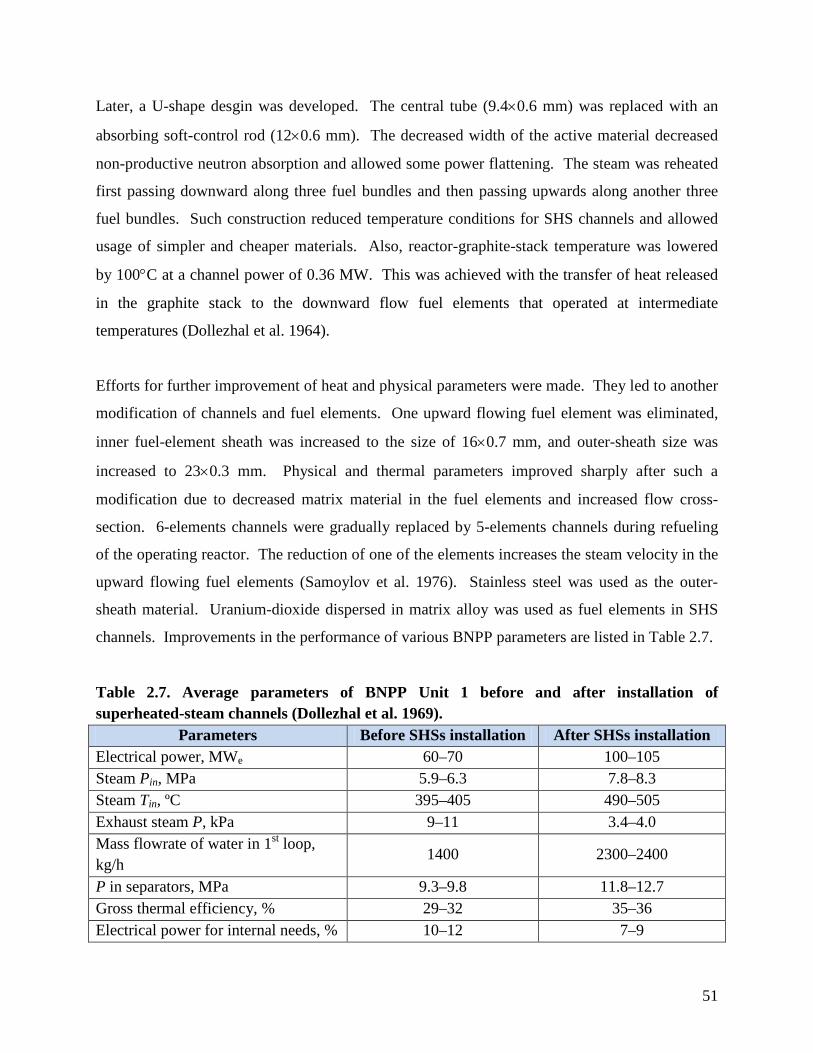
Table 2.4. General operating data of BNPP (Dollezhal et al. 1974b).
Net efficiency, % 29.1 31.6 32.9 34.2 34.2 33.6 32.6
Electric power for
internal needs, % 11.5 8.1 6.9 7.0 7.2 7.4 7.7
43
Flattening of the power distribution was achieved at the BNPP with physical profiling:
appropriate distribution of control rods and fuel channels of different uranium enrichment (for
fresh load) and profiling of burn-up fuel along the reactor radius. The reactor load consisted of
SHS channels of 2% and 3% uranium enrichments (SHS-2 and SHS-3 respectively) and BW
channels. The BW channels were located in rings in alternate locations with SHS-2 as shown in
Figure 2.4. SHS-3 were located along the circumference and had lower pressure losses in the
steam circuit (Dollezhal et al. 1964).
Neutronics calculations were made to choose optimal distribution of channels to achieve required
power shape. Most of the calculations for the core-reactor physics were performed in the 2-
group approximation. In accordance with the fuel-channels distribution the core was represented
by four cylindrical regions with the radii: R1 = 175 cm (234 fuel channels), R2 = 268 cm (324
fuel channels), R3 = 316 cm (220 fuel channels), and R4 = 358 cm (220 fuel channels). The
previous calculations and operating experience of large uranium-graphite reactors with relatively
small neutron leakage showed that a simplified schematic could be used when neutron
distribution in the reactor is determined by the multiplication characteristics of the reactor
regions. The multiplications constants obtained for the 4 regions (kinf,1 = 1.013, kinf,2 = 1.021,
kinf,3 = 1.043, and kinf,4 = 1.045) allowed flattening of the neutron distribution along the reactor
radius with Kir = 1.20 – 1.25. The increase in the multiplication constants values to the periphery
of the reactor was attained by placing fuel channels with 3% uranium enrichment. Refueling
schemes and, therefore, fuel burn-up at different regions were chosen such as to allow designed
power flattening in the end of the campaign, with corresponding values of kinf,i. Control rods
insertion in the core maintained kinf,i values in the necessary limits during normal operation
(Vikulov et al. 1971).
One of the requirements to be met when implementing nuclear steam reheat is to maintain a
constant specified power ratio (π) of the steam-superheating zone to the boiling zone during the
operating period. The SHS channel temperature up to 520°C at the BNPP was obtained by
setting π = 0.41 at the optimum parameters of the thermodynamic cycle. The number of SHS
channels was chosen to provide a π-value of 0.41 at the partial refueling scheme where the Kir ≈
1.25. The steady-state regime was characterized with small fluctuations of approximately 1% in
44
the π-value between the refuelings. Circular arrangement of SHS channels (Unit 1) had an
advantage of small π-sensitivity to the changes in radial neutron flux distributions, while for
central arrangement of SHS channels (Unit 2) π values were more sensitive (see Table 2.5).
Table 2.5. Steam-superheating-zone power to boiling-zone power ratio (π) dependence on neutron flux Keff for BNPP Unit 2 (Vikulov et al. 1971).
π 0.408 0.429 0.452 0.494
Keff 1.20 1.36 1.53 1.78
However, preference was given to the central arrangement of SHS channels, because this
allowed attaining a higher π-value (around 12% higher) with the same number of SHS channels.
Additionally, central arrangement of SHS channels provided better multiplication characteristics
than BW channels. SHS channels were placed in the central region to increase average fuel
burn-up by 10%. It should be noted, that during the initial operation period the burn-up rates
were different for BW and SHS channels of fresh load, which led to an unbalance of power
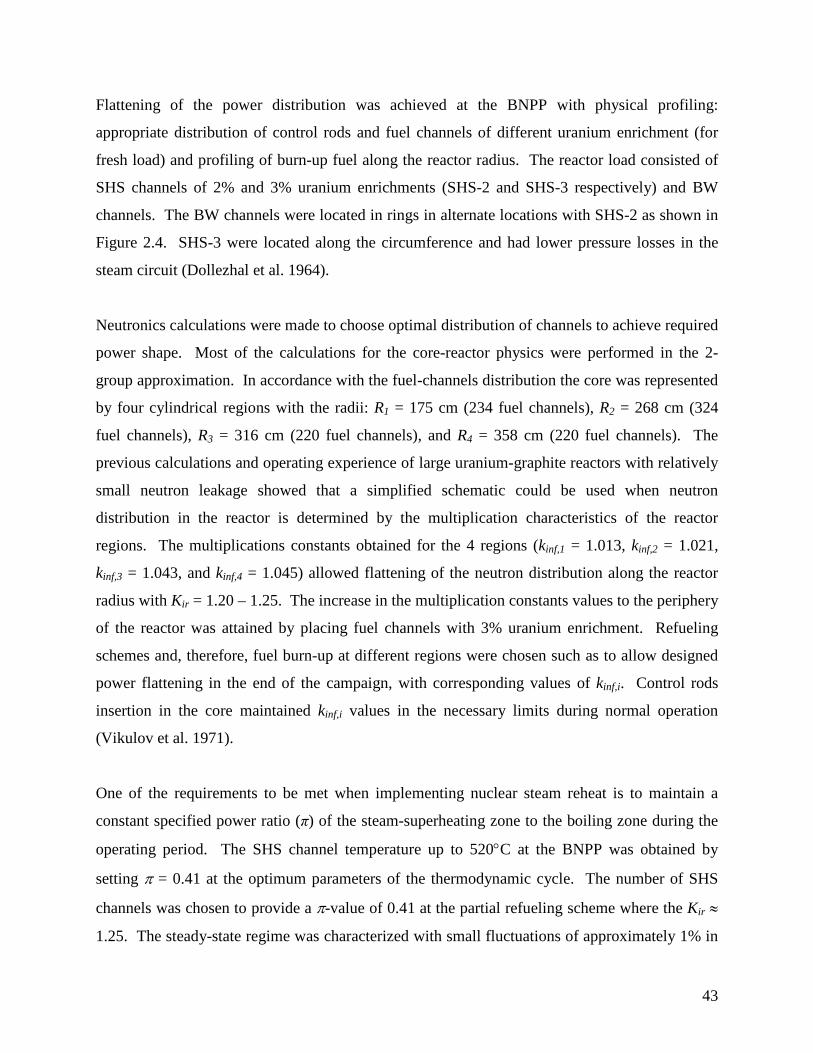
between superheating and boiling zones. Figure 2.5 shows the calculated dependence of π-
values and power variations for different types of fuel channels on the power generated by the
reactor (Vikulov et al. 1971).
Calculations were performed assuming Kir ≈ 1.25. A fast decrease in the superheating-zone
power relative to that of the boiling zone in the initial period was accounted for by a lower power
change in SHS channels due to slightly higher fuel conversion in the low enriched SHS-2.
Practically achieved values of Kir were approximately 1.4 for Unit 1 and 1.3 for Unit 2. Neutron
balance in the core of the critical reactor in the beginning of the operation period is shown in
Figure 2.6.
One of the features of the uranium-graphite reactors cooled with water is the possibility of
reactivity change with water-content change in the reactor. Substitution of boiling water with
steam in the operating channels leads to the rapid change of coolant average density. Failure of a
fuel-element sheath is another possibility of water-content change that was considered while
designing the BNPP reactors. The chosen core lattice with respect to reactivity change turned
45
out to be weakly dependent on water-content changes. It was explained by the compensation of
effects of increased resonance neutrons captured by increased water content and an increase at
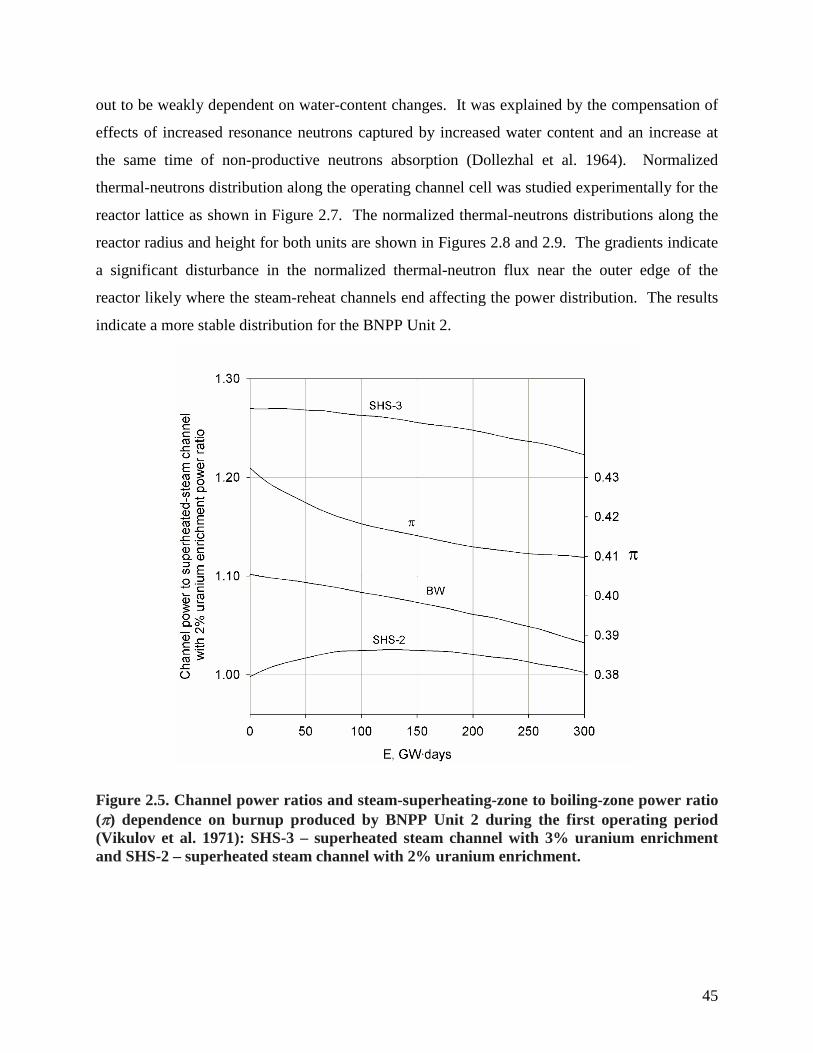
the same time of non-productive neutrons absorption (Dollezhal et al. 1964). Normalized
thermal-neutrons distribution along the operating channel cell was studied experimentally for the
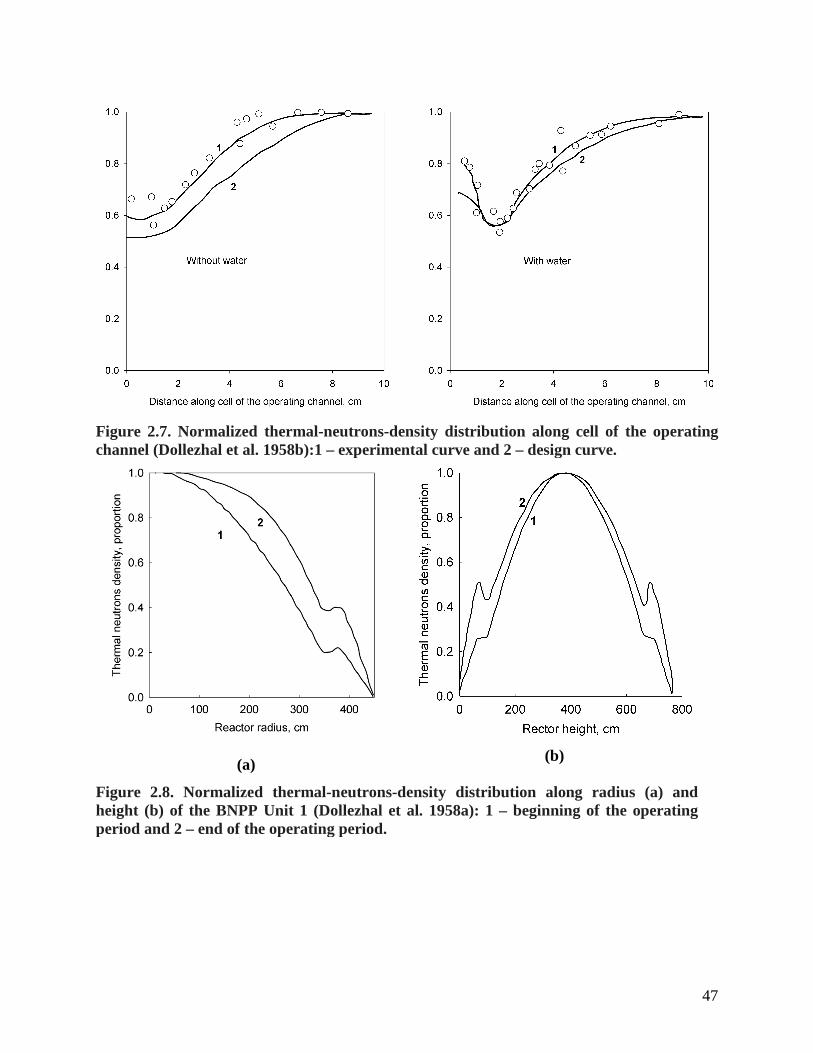
reactor lattice as shown in Figure 2.7. The normalized thermal-neutrons distributions along the
reactor radius and height for both units are shown in Figures 2.8 and 2.9. The gradients indicate
a significant disturbance in the normalized thermal-neutron flux near the outer edge of the
reactor likely where the steam-reheat channels end affecting the power distribution. The results
indicate a more stable distribution for the BNPP Unit 2.
Figure 2.5. Channel power ratios and steam-superheating-zone to boiling-zone power ratio (π) dependence on burnup produced by BNPP Unit 2 during the first operating period (Vikulov et al. 1971): SHS-3 – superheated steam channel with 3% uranium enrichment and SHS-2 – superheated steam channel with 2% uranium enrichment.
46
Figure 2.6. Neutron balance in a critical reactor (Dollezhal et al. 1958a).
47
Figure 2.7. Normalized thermal-neutrons-density distribution along cell of the operating channel (Dollezhal et al. 1958b):1 – experimental curve and 2 – design curve.
(a)
(b)
Figure 2.8. Normalized thermal-neutrons-density distribution along radius (a) and height (b) of the BNPP Unit 1 (Dollezhal et al. 1958a): 1 – beginning of the operating period and 2 – end of the operating period.
48
(a)
(b)
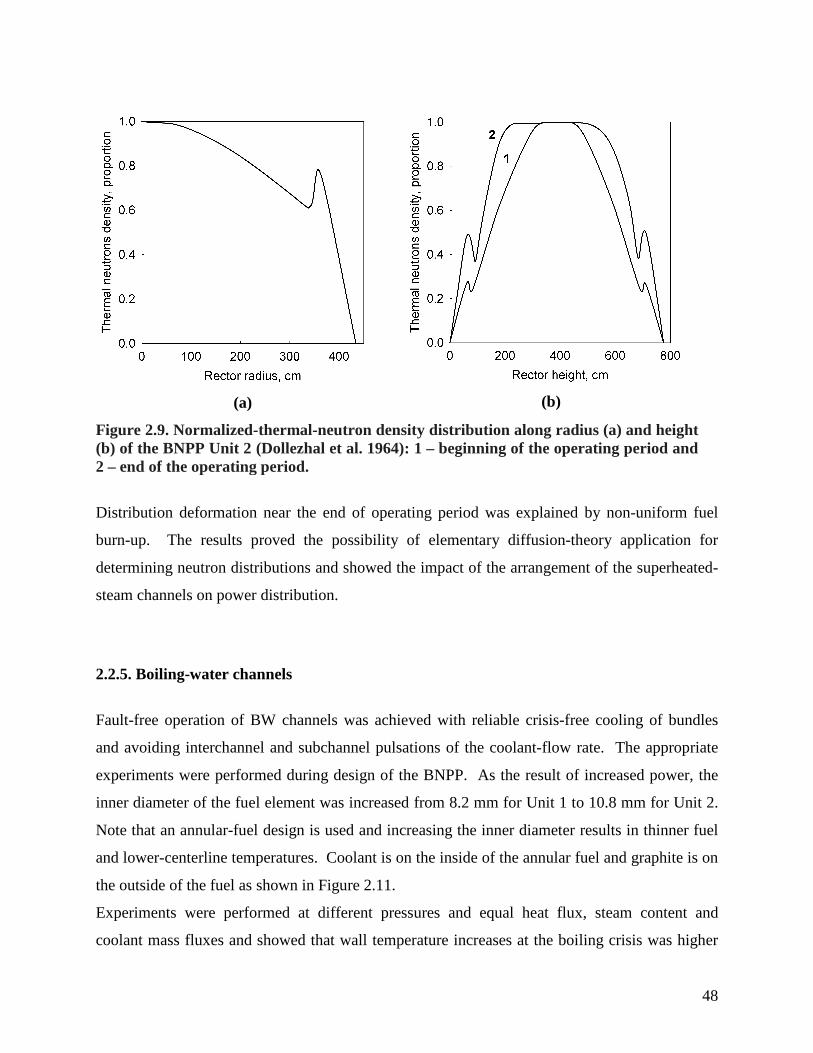
Figure 2.9. Normalized-thermal-neutron density distribution along radius (a) and height (b) of the BNPP Unit 2 (Dollezhal et al. 1964): 1 – beginning of the operating period and 2 – end of the operating period.
Distribution deformation near the end of operating period was explained by non-uniform fuel
burn-up. The results proved the possibility of elementary diffusion-theory application for
determining neutron distributions and showed the impact of the arrangement of the superheated-
steam channels on power distribution.
2.2.5. Boiling-water channels
Fault-free operation of BW channels was achieved with reliable crisis-free cooling of bundles
and avoiding interchannel and subchannel pulsations of the coolant-flow rate. The appropriate
experiments were performed during design of the BNPP. As the result of increased power, the
inner diameter of the fuel element was increased from 8.2 mm for Unit 1 to 10.8 mm for Unit 2.
Note that an annular-fuel design is used and increasing the inner diameter results in thinner fuel
and lower-centerline temperatures. Coolant is on the inside of the annular fuel and graphite is on
the outside of the fuel as shown in Figure 2.11.
Experiments were performed at different pressures and equal heat flux, steam content and
coolant mass fluxes and showed that wall temperature increases at the boiling crisis was higher
49
when coolant pressure was lowered. At the same time, with the lowered coolant pressure the
critical steam content increased. The experiments on hydrodynamic stability showed that mass-
flux pulsations within the region of high steam content did not introduce danger for the BNPP
reactors, because nominal pressure in the evaporating loop was 8.8 MPa and steam content at the
channels outlet was not higher than 35%. Wall-temperature oscillations were in the phase with
the subchannel flow-rate pulsations. With the increased pressure both the amplitude of
temperature oscillations and coolant flow rate decreased. The same effect occurred at the
decreased heat flux and increased flow rate per channel. Wall-temperature oscillations were
within the range of 65°C at 1000 kg/h flow rate and 30°C at 1500 kg/h flow rate at constant
pressure of 4.9 MPa and 0.2 MW power (Dollezhal et al. 1964).
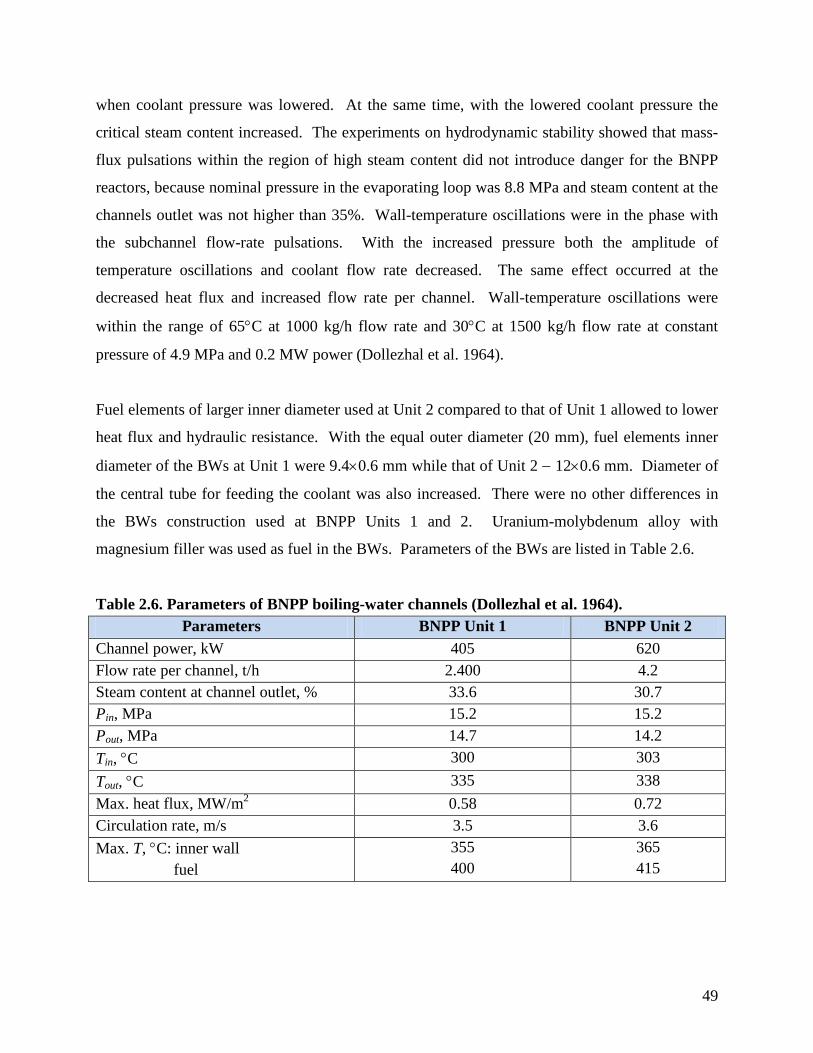
Fuel elements of larger inner diameter used at Unit 2 compared to that of Unit 1 allowed to lower
heat flux and hydraulic resistance. With the equal outer diameter (20 mm), fuel elements inner
diameter of the BWs at Unit 1 were 9.4×0.6 mm while that of Unit 2 − 12×0.6 mm. Diameter of
the central tube for feeding the coolant was also increased. There were no other differences in
the BWs construction used at BNPP Units 1 and 2. Uranium-molybdenum alloy with
magnesium filler was used as fuel in the BWs. Parameters of the BWs are listed in Table 2.6.
Table 2.6. Parameters of BNPP boiling-water channels (Dollezhal et al. 1964). Parameters BNPP Unit 1 BNPP Unit 2
Additional tests on corrosion resistance of the stainless steel in contact with the water–steam
mixture with oxygen and chlorine ions were performed (Emelyanov et al. 1972a). First,
55
compensators were put under displacement cyclic load at the highest working values (785
N/mm2). Then the number of cycles was 6000. The cyclic load simulated the most damaged
state of the compensators materials that would be in the end of channels operation period. Then
water–steam mixture at P = 14.2 MPa and T = 340°C was passed through the channels
compensators which were placed in an electrical furnace.
After holding the compensator for 144 h in the furnace, pressure in the compensators was
decreased to 9.8 MPa, and temperature was decreased to 100±5°C. Simultaneously, water with
0.06 mg/l chlorides content was injected into the electrical furnace. Moisture was condensed at
95°C and evaporated at 105°C throughout the test. The moisture condensation-evaporation cycle
was repeated 30 – 40 times during a 24-h period. The pressure was increased up to 14.2 MPa
and temperature was increased up to 340 °C and the compensators were being held for another
144 h. Then the condensation-evaporation cycle was repeated and so on. Compensators were
examined destructively after 144 – 1100 h under abovementioned conditions. The fracture
pattern was identical for each case where a net of cracks was formed on the outer surface and
cracks further developed into holes. More information on corrosion-mechanical and cyclic
strength of the channel constructional elements may be found in the paper by Emelyanov et al.
(1972a).
2.2.8. Hydrodynamic stability of the Beloyarsk NPP channels during reactors start-up
During start-up and nominal operating conditions it is necessary to provide reliable cooling of
fuel bundles (crisis-free heat exchange and hydrodynamic stability). Experiments on set-up
simulating Units 1 and 2 were performed for determining safe operating conditions for coolant
flow rate with no pulsations during the start-up.
Both SHS and BW channels of the BNPP were filled with water in the initial state. During
reactor start-up, the water in the SHS channels was to be discharged and transfer to cooling by
steam was to be performed. Additionally, the units were preheated and started without external
heat sources.
56
The coolant flow rate stability in the BW channels was studied for wide ranges of pressures, flow
rates and powers (Smolin et al. 1965). Special attention was paid to determination of the
pressure, flow rate, steam content and power. Different combinations of these parameters
created conditions leading to pulsations. When occurred, flow rate pulsations took place when
coolant reached saturation temperature at the outlet of the BWs. Pulsations were in the form of
coolant flow rate periodical oscillations in peripheral tubes. Oscillations were phase-shifted in
different tubes while the total flow rate was constant.
Two pulsation regions were determined as the result of the experiments: small steam content
region (x = 0 – 15 %, 3 – 6 oscillations per min.) and high steam content region (x = 25 – 80%,
15 – 20 oscillations per min.). Flow rate pulsations in tubes were accompanied by wall tube
temperature oscillations along its length with the frequency being equal to that of flow rate
oscillations. Wall temperature oscillations in the top cross-sections of the heating zone within
the small steam content region occurred with a shift to the smaller values in the surface or
volumetric boiling zones and to both the smaller and higher values in the economizer zone. Wall
temperature oscillations in the top cross-sections of the heating zone within the high steam
content shifted only to the higher values causing boiling crisis (Smolin et al. 1965).
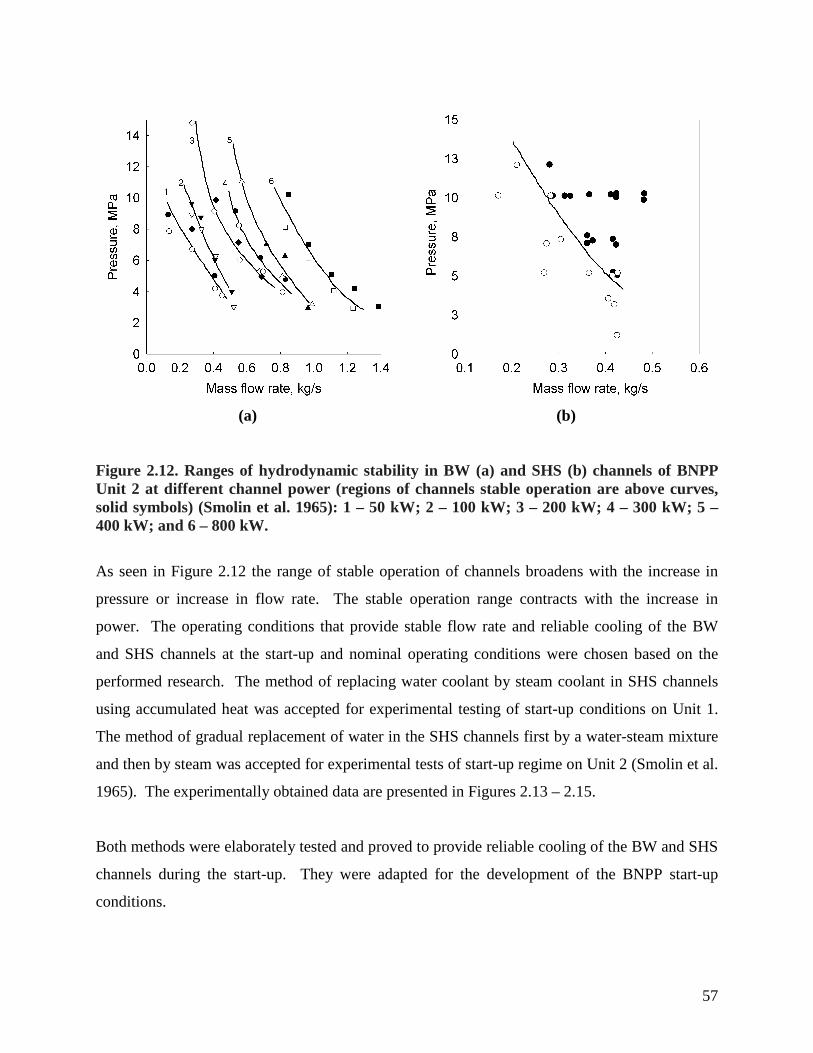
The curves distinguishing stability zones (above the curves) from pulsation zones (below the
curves) for the BW and SHS channels of the BNPP Unit 2 are shown in Figure 2.12.
57
(a)
(b)
Figure 2.12. Ranges of hydrodynamic stability in BW (a) and SHS (b) channels of BNPP Unit 2 at different channel power (regions of channels stable operation are above curves, solid symbols) (Smolin et al. 1965): 1 – 50 kW; 2 – 100 kW; 3 – 200 kW; 4 – 300 kW; 5 – 400 kW; and 6 – 800 kW.
As seen in Figure 2.12 the range of stable operation of channels broadens with the increase in
pressure or increase in flow rate. The stable operation range contracts with the increase in
power. The operating conditions that provide stable flow rate and reliable cooling of the BW
and SHS channels at the start-up and nominal operating conditions were chosen based on the
performed research. The method of replacing water coolant by steam coolant in SHS channels
using accumulated heat was accepted for experimental testing of start-up conditions on Unit 1.
The method of gradual replacement of water in the SHS channels first by a water-steam mixture
and then by steam was accepted for experimental tests of start-up regime on Unit 2 (Smolin et al.
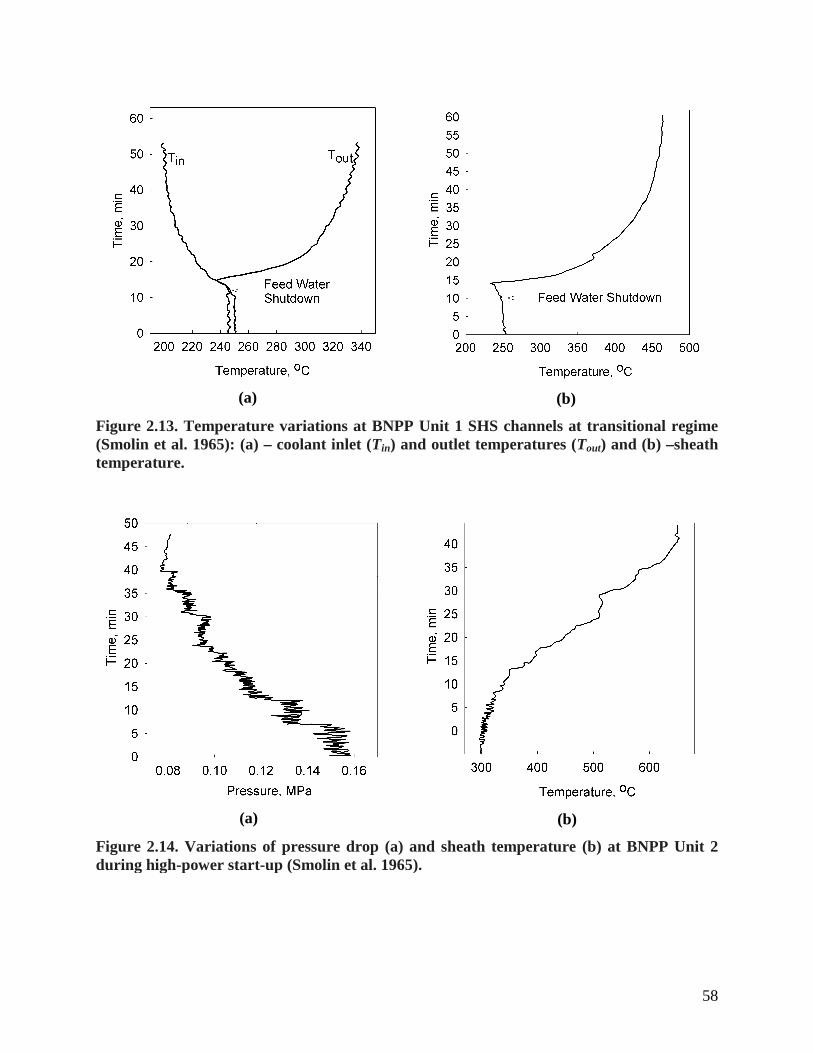
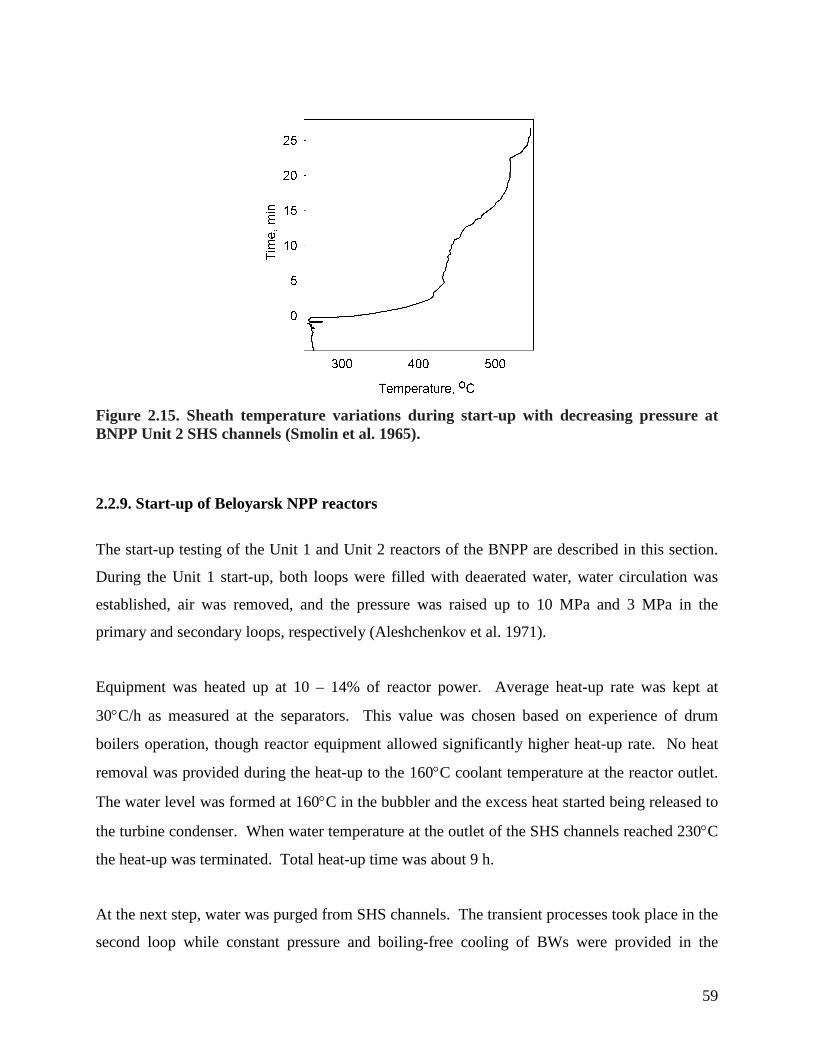
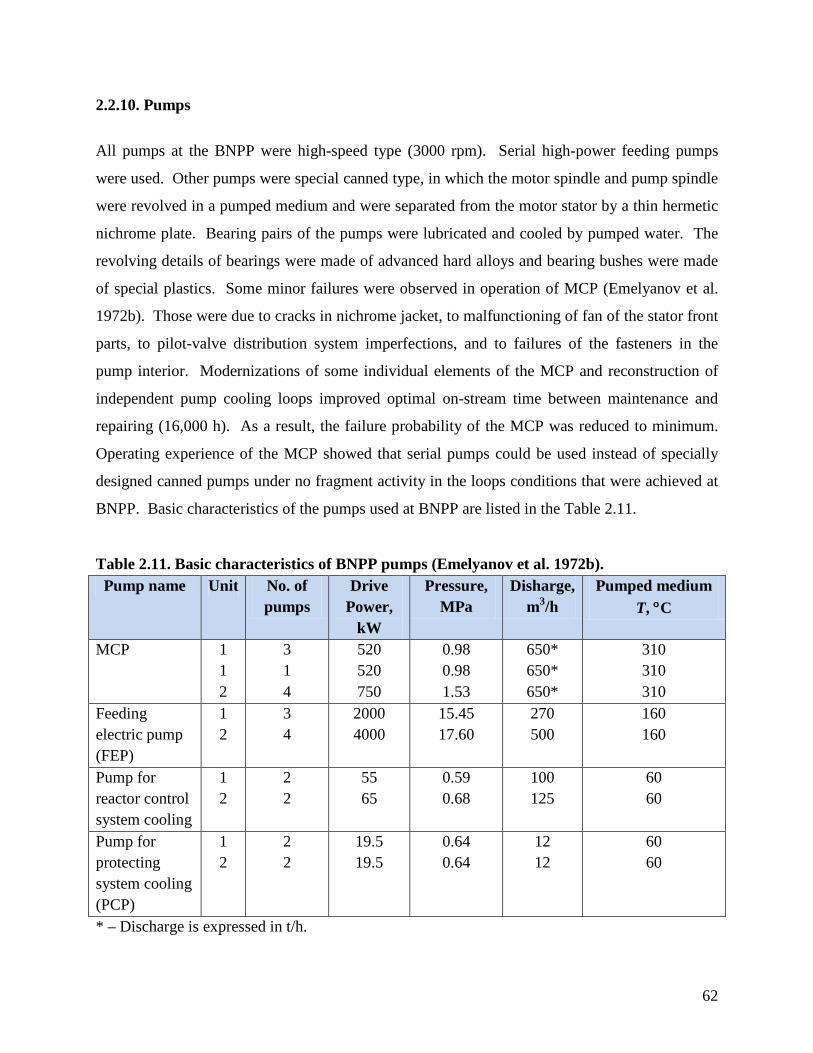
1965). The experimentally obtained data are presented in Figures 2.13 – 2.15.
Both methods were elaborately tested and proved to provide reliable cooling of the BW and SHS
channels during the start-up. They were adapted for the development of the BNPP start-up
conditions.
58
(a)
(b)
Figure 2.13. Temperature variations at BNPP Unit 1 SHS channels at transitional regime (Smolin et al. 1965): (a) – coolant inlet (Tin) and outlet temperatures (Tout) and (b) –sheath temperature.
(a)
(b)
Figure 2.14. Variations of pressure drop (a) and sheath temperature (b) at BNPP Unit 2 during high-power start-up (Smolin et al. 1965).
59
Figure 2.15. Sheath temperature variations during start-up with decreasing pressure at BNPP Unit 2 SHS channels (Smolin et al. 1965).
2.2.9. Start-up of Beloyarsk NPP reactors
The start-up testing of the Unit 1 and Unit 2 reactors of the BNPP are described in this section.
During the Unit 1 start-up, both loops were filled with deaerated water, water circulation was
established, air was removed, and the pressure was raised up to 10 MPa and 3 MPa in the
primary and secondary loops, respectively (Aleshchenkov et al. 1971).
Equipment was heated up at 10 – 14% of reactor power. Average heat-up rate was kept at
30°C/h as measured at the separators. This value was chosen based on experience of drum
boilers operation, though reactor equipment allowed significantly higher heat-up rate. No heat
removal was provided during the heat-up to the 160°C coolant temperature at the reactor outlet.
The water level was formed at 160°C in the bubbler and the excess heat started being released to
the turbine condenser. When water temperature at the outlet of the SHS channels reached 230°C
the heat-up was terminated. Total heat-up time was about 9 h.
At the next step, water was purged from SHS channels. The transient processes took place in the
second loop while constant pressure and boiling-free cooling of BWs were provided in the
60
primary loop. Reactor power was rapidly reduced to ~2% of its nominal level and feedwater
flow rate was reduced to provide water level in the SGs to purge SHS channels. Water-steam
mixture from evaporators and steam from the steam loop were directed to the bubbler and then to
the deaerator and the turbine condenser.
The purging of SHS channels started after the level in the SGs had been formed. The purging
regime was monitored by the pressure drop between the reactor inlet and outlet steam headers
and the coolant temperature at the outlet of each SHS channel. Additional steam discharge by
increased pressure drop rate was achieved and thus the purging was accelerated by opening gate
valves in front of the bubbler for 1 – 2 min. The pressure drop rate was chosen based upon the
allowed temperature condition and was set to ~0.15 MPa/min. Overall time for the level
formation in the evaporators was ~8 – 10 min, the time of purging ~6 – 10 min. The gate valves
in front of bubblers were closed and reactor power was increased after the purging had finished.
Thus, the pressure and the temperature in SHS channels were increase. After 2 hours the SHS
channels purging had been finished and the reactor achieved a stable operation at 10% power
level. The heating of steam pipes and the turbine was initiated and the turbine connection to the
power line was prepared. Further power increase was made once the turbine had been connected
to the power line.
The first loop was transferred to the boiling flow regime and the separators levels were formed at
35% reactor power and ~6 MPa pressure. During the transient to the boiling regime, the
operating conditions of the MCPs were continuously monitored. Water temperature was
maintained 5 − 6 °C below the boiling margin for intake pipes of the main circulation pumps.
Level formation in the separators was accompanied by smooth pressure change. It took about 3
h for the water to reach controlled level in the separators, the time being dependent only on the
separator bleed lines throughput.
The specific features of a single-circuit flow diagram made the sequence of the BNPP Unit 2
start-up operations somewhat different. SHS channels purging and transition to boiling regime
in the BW channels took place simultaneously. Filling of the circuits and equipment heat-up
were the same as in Unit 1. The terminal heat-up parameters were higher (P ≈ 9.3 MPa and T ≈
61
290°C). Two main circulation pumps were used to drive coolant circulation in the evaporating
loop. After heat-up the reactor power was reduced to 2 – 3% of nominal level. SHS channels
purging, and transition to boiling regime in the BW channels took place after the heat-up. The
feedwater flow rate was considerably reduced, water was purged out of the separators, and the
flow rate to the bubblers was increased to form levels in the separators. As a result, the water in
the fuel channels and separators boiled causing the purging of water and water-steam mixture
from SHS channels. The monitoring of the purging process was the same as at the Unit 1. After
SHS channels purging had been completed, the reactor power was increased and steam flow into
the bubbler was reduced at the reheated steam temperature rise rate of about 1°C/min with the
pressure drop between the steam headers at least ~50 – 60 kPa. The automatic level control
system was put into operation as soon as the water in the separators reached the rated level. The
subsequent reactor power increase, turbine preparation, and connection of the turbine to the
power line were the same as for Unit 1 (Aleshchenkov et al. 1971). Changes of the main
parameters during Unit 2 start-up are shown in Figure 2.16.
Figure 2.16. Variations of main parameters during start-up of BNPP Unit 2 (Aleshchenkov et al. 1971): 1 – turbine power; 2 – reactor power; 3 – steam pressure; 4 – coolant (water or
steam) temperature at SHS channel outlet; and 5 – feedwater temperature.
62
2.2.10. Pumps
All pumps at the BNPP were high-speed type (3000 rpm). Serial high-power feeding pumps
were used. Other pumps were special canned type, in which the motor spindle and pump spindle
were revolved in a pumped medium and were separated from the motor stator by a thin hermetic
nichrome plate. Bearing pairs of the pumps were lubricated and cooled by pumped water. The
revolving details of bearings were made of advanced hard alloys and bearing bushes were made
of special plastics. Some minor failures were observed in operation of MCP (Emelyanov et al.
1972b). Those were due to cracks in nichrome jacket, to malfunctioning of fan of the stator front
parts, to pilot-valve distribution system imperfections, and to failures of the fasteners in the
pump interior. Modernizations of some individual elements of the MCP and reconstruction of
independent pump cooling loops improved optimal on-stream time between maintenance and
repairing (16,000 h). As a result, the failure probability of the MCP was reduced to minimum.
Operating experience of the MCP showed that serial pumps could be used instead of specially
designed canned pumps under no fragment activity in the loops conditions that were achieved at
BNPP. Basic characteristics of the pumps used at BNPP are listed in the Table 2.11.
Table 2.11. Basic characteristics of BNPP pumps (Emelyanov et al. 1972b). Pump name Unit No. of
pumps Drive
Power, kW
Pressure, MPa
Disharge, m3/h
Pumped medium T, °C
MCP 1 1 2
3 1 4
520 520 750
0.98 0.98 1.53
650* 650* 650*
310 310 310
Feeding electric pump (FEP)
1 2
3 4
2000 4000
15.45 17.60
270 500
160 160
Pump for reactor control system cooling
1 2
2 2
55 65
0.59 0.68
100 125
60 60
Pump for protecting system cooling (PCP)
1 2
2 2
19.5 19.5
0.64 0.64
12 12
60 60
* – Discharge is expressed in t/h.
63
2.2.11. Water regime
The experiments on effectiveness of water and steam radiolysis suppression by hydrogen in BW
and SHS channels respectively were performed after 16 months of Unit 1 operation. Water and
steam samples were taken at the drum-separator, MCPs, inlet and outlet of SHS channels.
Ammonia dosing was terminated before the test for determination of the required amount of
hydrogen that was necessary to suppress water and steam radiolysis that was partially caused by
ammonia decomposition (Yurmanov et al. 2009b). Hydrogen concentration in saturated steam at
the separator was found to be 45 – 88 nml/kg and in circulation water at the main circulation
pump was found to be 2.75 – 12.8 nml/kg. Despite some hydrogen excess, oxygen concentration
decreased from 2.28 mg/dm3 to 0.1 mg/dm3. Dissolved oxygen concentration in the circulating
water at the main circulation pump did not exceed 0.01 – 0.03 mg/dm3. At the next stage of
experiments, steam radiolysis in SHS channels and the possibility of suppressing it by hydrogen
concentration levels were studied. Hydrogen concentration was set to 1.2 – 6.2 nml/kg in steam
and 1.2 – 1.8 nml/kg in circulating water. Oxygen concentration was below 0.15 mg/kg in steam
and about 0.02 mg/dm3 in the circulating water. The obtained results demonstrated effective
suppression of water radiolysis.
Additional research was carried out at 60% reactor power. The results showed that the oxygen
concentration was decreased to 0.03 mg/kg at the SHS channels outlet only at 45 nml/kg
hydrogen concentration. The water-steam mixture at the turbine ejector consisted of hydrogen
(62 – 65%) and oxygen (8 – 10%) at a hydrogen concentration of 40 – 45 nml/kg. The water-
steam mixture was needed to be diluted with air to a non-explosive state, i.e. hydrogen volume
fraction was to be decreased below 2 – 3% (Shitzman 1983).
The equipment for Unit 2 was made from the following constructional materials: stainless steel
(5500 m2, 900 m2 of which were used for the core); carbon steel (5600 m2); brass and
cupronickel (14,000 m2); stellite (4.8 m2). The studies showed that radiolytic gases production
rate was approximately 5 times lower than that of a BWR of the same power. Water radiolysis at
64
the BW channels of the BNPP Unit 1 was suppressed by ammonia dosing. This kept radiolityc
oxygen content in water at several hundredths of a milligram per liter. Ammonia dosing wasn't
used at Unit 2 due to the danger of corrosion of the condenser tubes and low-pressure heaters.
Radiolytic fixation of oxygen in the steam that was bled to high-pressure heaters was achieved
by hydrazine hydrate dosing. The operation norms and the actual quality of coolant at the BNPP
Unit 2 are listed in the Tables 2.12 and 2.13. Additional information on water flow regime may
be found in paper by Konovalova et al. (1971).
Table 2.12. Standards of water and steam quality for BNPP Unit 2 during operation (Konovalova et al. 1971).
Parameters Feed
water
Reactor
circulating
water
Reactor
bleed
water
Saturated
and reheated
steam
Turbine
condensate
Water hardness (μg-
equiv/kg) ≤3 ≤15 – – 3
Alkalinity (using mixed
indication, excluding
ammonia), (μg-equiv
/kg)
– – ≤50 – –
Sodium, μg/kg – – – – ≤10
SiO2-3, μg/kg ≤30 – ≤1000 ≤20 –
Chlorides, μg/kg – ≤30* – – –
Iron oxides, μg/kg – ≤60 – – –
Copper content, μg/kg ≤5 – – – ≤5
Total corrosion products,
μg/kg – – ≤500 – ≤5
Oxygen content, μg/kg 10 – – – 30
Oils content, μg/kg 300 – – – –
pH – ≥8.0 – – –
* During accident an increase of chlorides up to 150 μg/kg in reactor circulating water is
tolerated during 20 h per 1000 h of reactor operation.
65
Table 2.13. Actual parameters of BNPP Unit 2 coolant quality during period of normal operation (Konovalova et al. 1971).
Comparison of data in Tables 5.12 and 5.13 shows that all indicators of coolant quality were in
the range set by the water regime regulations during normal operating period.
In August 1972 (after 4.5 years of operation) neutral no-correction water was implemented at
Unit 2 (Dollezhal 1974b). Operation in the new conditions revealed the following advantages
over the ammonia treated state:
1. The cease of feedwater ammonia treatment led to the zero nitrate content in the reactor
circulation water. This allowed an increase of the pH from 4.8 to the neutral level at the
300°C operating temperature.
2. Balance of the corrosion products content in the circulation water and chemical flushing
of the BW channels showed that the rate of metallic oxide deposits formation on the fuel-
bundles surfaces in the evaporating zone of the reactor was three times lower using no-
correction water.
3. The Co-60 deposition rate outside the core was 7 – 10 times lower using no-correction
66
water.
4. Condensate purification experience using no-correction water allowed an increasing filter
service cycle by 6 times.
2.2.12. Radiation conditions
Radiation conditions on the premises of the BNPP and at its immediate environs was found to be
satisfactory. Radioactive emissions to the atmosphere were 5 – 10 times lower than allowed by
codes. The turbines have not the radiation shielding, and maximum intensity was 1.0 – 1.5 and
2.0 – 5.0 µR/s at the high-pressure cylinder and 0.3 – 2.0 and 1.0 – 4.0 µR/s at the low-pressure
cylinder for BNPP Unit 1 and 2 respectively. These values of intensities at the turbine were
several times lower than those at other direct-cycle reactors. For example, the radiation intensity
was about 100 µR/s at the turbines of SGHWR reactor in Winfrith (Dollezhal et al. 1969).
Steam activity at the turbine inlet was mainly caused by N-16 and its values were 2.5⋅10−3 and
9⋅10−3 Ci/kg for the BNPP Units 1 and 2 respectively. Coolant activity of the long-lived
corrosion products was relatively acceptable: 10−8 Ci/kg at the evaporating loop and 10−9 Ci/kg at
the reheat loop. Specific activities of the deposits on the water feeding tubes of the evaporating
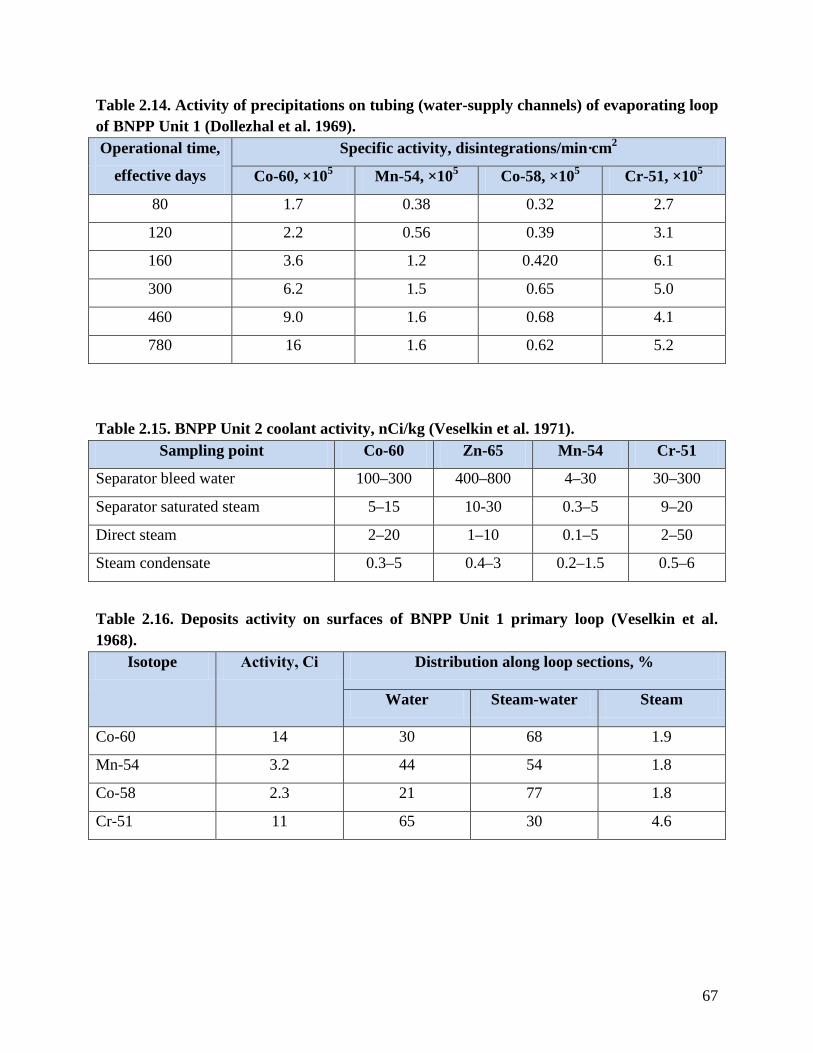
loop are presented in Table 2.14.
Radiation rates were 0.05 – 0.1 µR/s in the rooms where personnel worked constantly, and 0.3 –
12 µR/s in rooms occupied part-time. The dose rates during the reactor shut-down in the rooms
not used by personnel and near the evaporating loop of Unit 1 were measured to be 25 – 200
µR/s, and were measured to be 15 – 20 µR/s near the steam superheating zone. The dose rates at
those components were decreased by flushing and deactivation of the individual components of
the equipment and deactivation of loops. Personnel were mainly exposed during maintenance
work by the deposits of corrosion radioactive products on the surfaces of piping and equipment.
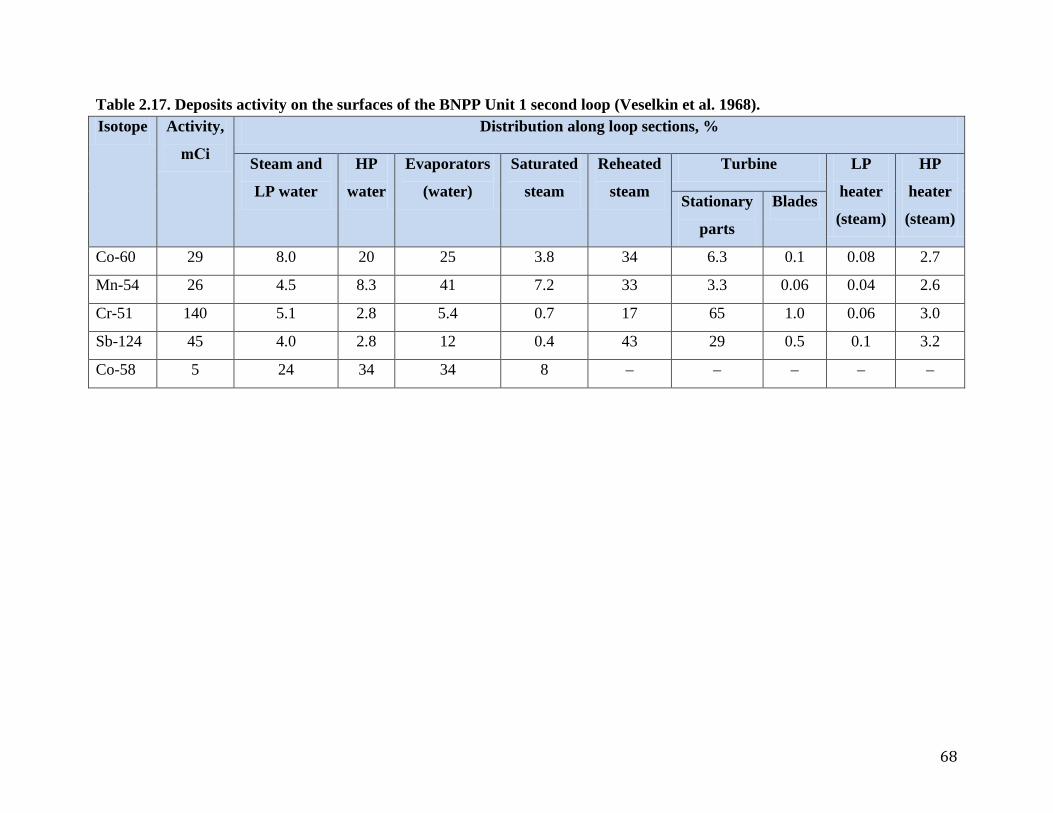
The major data on radiation levels at the BNPP Units 1 and 2 are listed in Tables 2.15 – 2.17 and
shown in Figures 2.17 – 2.22. Additional information on radioactive deposits build-up may be
found in papers by Aleksandrova et al. (1968) and Veselkin et al. (1968).
67
Table 2.14. Activity of precipitations on tubing (water-supply channels) of evaporating loop of BNPP Unit 1 (Dollezhal et al. 1969). Operational time,
effective days
Specific activity, disintegrations/min·cm2
Co-60, ×105 Mn-54, ×105 Co-58, ×105 Cr-51, ×105
80 1.7 0.38 0.32 2.7
120 2.2 0.56 0.39 3.1
160 3.6 1.2 0.420 6.1
300 6.2 1.5 0.65 5.0
460 9.0 1.6 0.68 4.1
780 16 1.6 0.62 5.2
Table 2.15. BNPP Unit 2 coolant activity, nCi/kg (Veselkin et al. 1971).
Table 2.16. Deposits activity on surfaces of BNPP Unit 1 primary loop (Veselkin et al. 1968).
Isotope Activity, Сi Distribution along loop sections, %
Water Steam-water Steam
Co-60 14 30 68 1.9
Mn-54 3.2 44 54 1.8
Co-58 2.3 21 77 1.8
Cr-51 11 65 30 4.6
Sampling point Co-60 Zn-65 Mn-54 Cr-51
Separator bleed water 100–300 400–800 4–30 30–300
Separator saturated steam 5–15 10-30 0.3–5 9–20
Direct steam 2–20 1–10 0.1–5 2–50
Steam condensate 0.3–5 0.4–3 0.2–1.5 0.5–6
68
Table 2.17. Deposits activity on the surfaces of the BNPP Unit 1 second loop (Veselkin et al. 1968). Isotope Activity,
mСi
Distribution along loop sections, %
Steam and
LP water
HP
water
Evaporators
(water)
Saturated
steam
Reheated
steam
Turbine LP
heater
(steam)
HP
heater
(steam) Stationary
parts
Blades
Co-60 29 8.0 20 25 3.8 34 6.3 0.1 0.08 2.7
Mn-54 26 4.5 8.3 41 7.2 33 3.3 0.06 0.04 2.6
Cr-51 140 5.1 2.8 5.4 0.7 17 65 1.0 0.06 3.0
Sb-124 45 4.0 2.8 12 0.4 43 29 0.5 0.1 3.2
Co-58 5 24 34 34 8 – – – – –
69
Figure 2.17. Dependence of dose date near boiling loop equipment of BNPP Unit 1 on its operation time (Dollezhal et al. 1969).
Figure 2.18. Activity dependence on operating time at BNPP Unit 1 boiling loop piping (Veselkin et al. 1971).
70
Figure 2.19. Specific activity of Co-60 deposits on turbine blades of BNPP Unit 1 (Veselkin et al. 1971): 1 – after 160 operating days and 2 – after 460 operating days.
Figure 2.20. Relative change of dose rate (at shut-downs) near boiling loop equipment depending on operating time of unit (Veselkin et al. 1971).
71
Figure 2.21. Cr-51 () and Zr-65 () activity distribution on BNPP Unit 2 turbine #2 blades after 294 effective days of operation (Veselkin et al. 1971).
Figure 2.22. Relative dose rate variations near steam condensing and feeding loops of BNPP Unit 2 at start-up and shut-down regimes (Veselkin et al. 1971): – equipment is filled with water from evaporating loop; – equipment is not filled with water from boiling loop.
72
2.2.13. Section-unit reactor with steam-reheat
The BNPP became the first in the world industrial NPP with a uranium-graphite power
reactor. Examination of the main characteristics of the BNPP reactors (for example, see
Table 2.8) shows that that performance of such type of reactors could be improved.
BNPP used slightly enriched uranium and the calculations showed that increasing
enrichment to 5% would increase fuel burn-up 4 − 10 times (up to 40,000 MW⋅days/t).
All channel reactors were constructed with traditional cylindrical shape of core.
Therefore, power increase in such a reactor could be attained by increasing the number of
working channels in the core and a proportional increase in diameter size. However,
increase in power per reactor would then be limited by the maximum size of the reactor
upper plate that could be built and withstand a high load. A way out of this situation was
found in section-unit design of the channel reactor with a rectangular core. Such a shape
would allow separating not only the core, but also reactor as a whole, into equal geometry
sections. Then the reactor of a specified capacity can be constructed of the required
number of sections. Each section would stay the same for reactors of different power
outputs, and, consequently, core width and maximum size of the upper metalwork would
stay the same too. Therefore, the power of a section-unit reactor power would not be
limited by the size of the upper plate (Emelyanov et al. 1982).
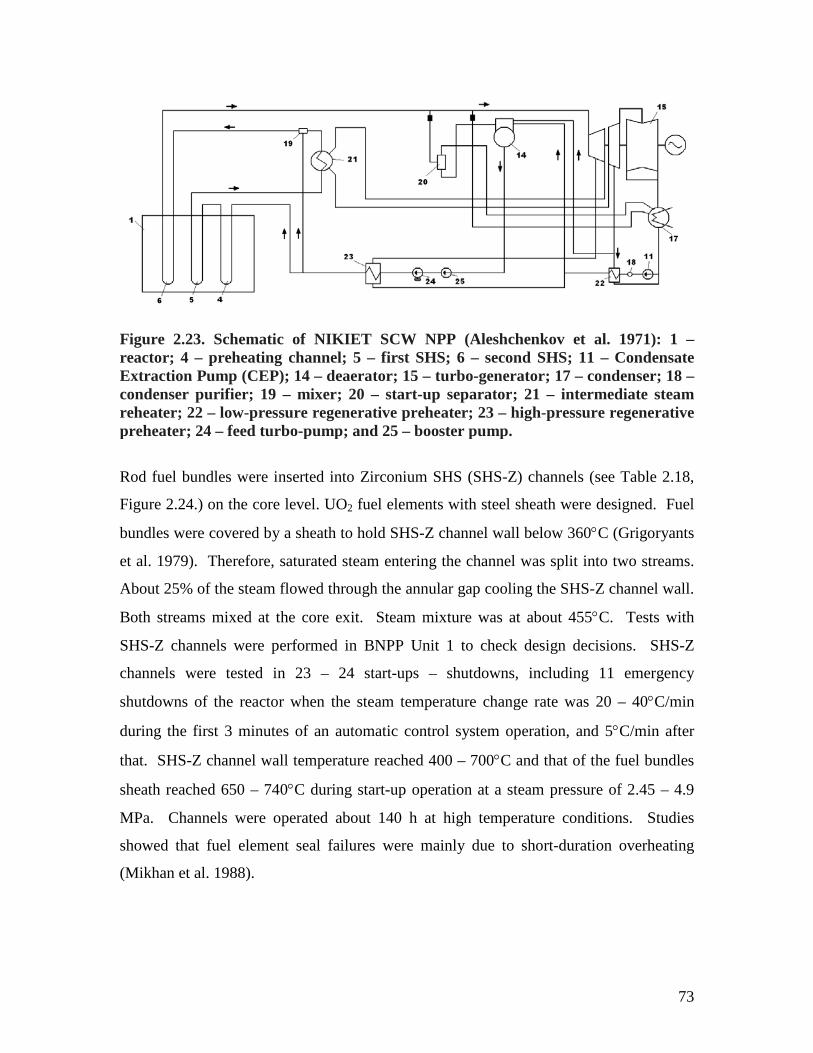
Section-unit type reactors with coolant at supercritical fluid conditions (see Figure 2.23)
was developed at NIKIET as an improvement to the existing RBMK (Russian acronym
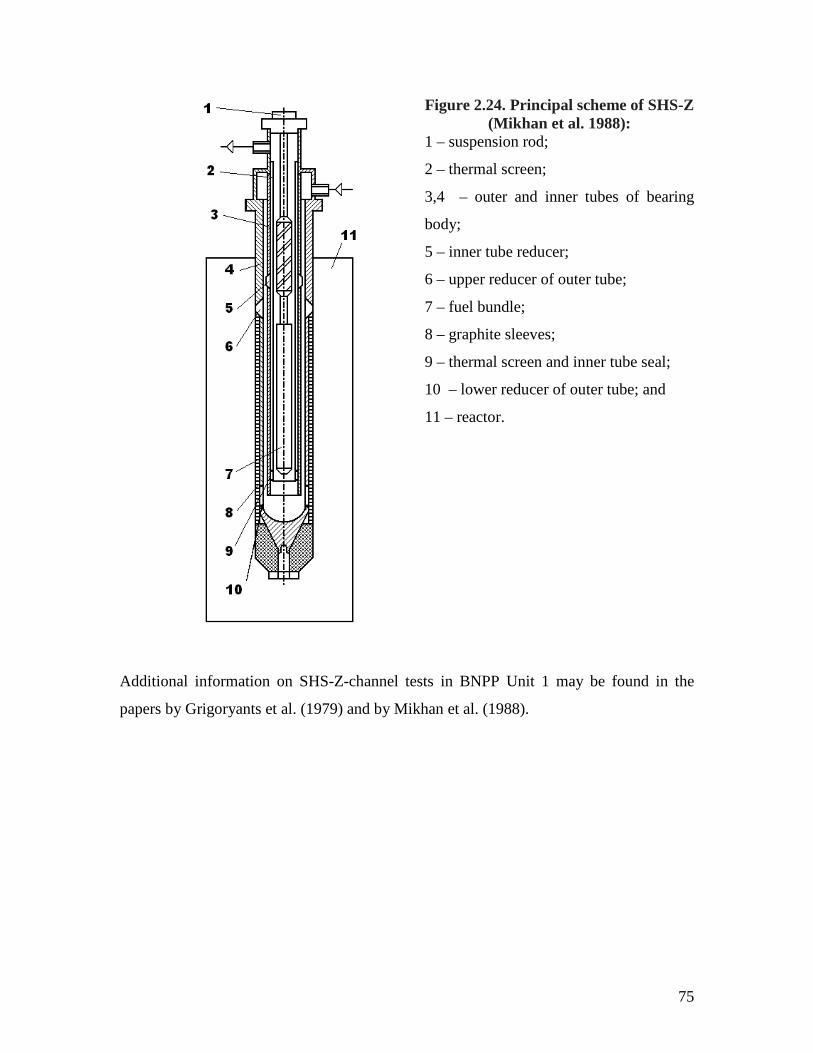
The SC “steam”-turbine technology is experiencing continuous improvements. For
example, Project Thermie-700 in Europe is developing a fossil-fueled “steam” generator-
turbine unit for “steam” parameters of 35 MPa and 700°C with a target net-plant
efficiency of 50 ~ 55%. It should be noted that this efficiency is expressed on a Lower-
Heating Value (LHV), which, based on typical coal moisture contents is approximately
equivalent to 47% – 52% on a HHV basis. The targeting implementation start date for
the Thermie-700 is the early 2010s.
As one can see from the Tables 3.1 to 3.4, that 25 MPa and 600°C are common SC
“steam” parameters in state-of-the-art fossil-fueled power plants (see Figure 3.1) and a
few plants even operate at pressures as high as 35 MPa and at temperatures as high as
650°C. The capacity of SC turbines ranges from 300 MWe to 1200 MWe. The gross
overall steam-cycle efficiency of SC fossil-fueled power plants typically ranges between
47% and 54% (i.e., net plant efficiencies between 38% and 43% on a Higher Heating
Value (HHV) basis). With the current SC-turbine technology and the ongoing
development, it is expected that the technologies required for the SCWR’s steam
parameters will be well proven when the Generation-IV SCWRs are market-ready.
The steam-cycle configuration of a SC cycle is very similar to a subcritical cycle in a
modern fossil-fueled power plant. Steam is usually reheated once in a boiler after passing
through the High-Pressure (HP) turbine, in order to achieve a higher efficiency. The
regenerative feedwater-heating system consists of Low-Pressure (LP) and High-Pressure
(HP) feedwater heaters (closed type) and a deaerator (mixing type). Usually, SC-“steam”
cycles involve 8 to 10 stages of feedwater heating, while subcritical steam cycles
typically involve 8 to 9 stages of feedwater heating.
While the modern SC turbines share many common merits, they also vary in many
aspects, depending on the manufacturer preference. These differences can include
turbine type (impulse or reaction), shaft combination (tandem or cross compound),
cylinder arrangement, parameter choices (feedwater temperature, reheat pressure), etc.
Individual manufacturers take different approaches in these areas based on their design
86
experiences. Some features (e.g., unit capacity, feedwater temperature, etc.) are flexible
within certain ranges if required by customers.
Therefore, our analysis of SC-turbine data can be summarized as follows:
• Only very few double-reheat-cycle turbines were manufactured so far. The
market demand for double-reheat turbines disappeared due to economic reasons
after the first few units were built. The vast majority of the modern and upcoming
SC turbines are single-reheat-cycle turbines.
• Major “steam” inlet parameters of these turbines are: the main or primary SC
“steam” – P = 24 – 25 MPa and T = 540 –600°C; and the reheat or secondary
subcritical-pressure steam – P = 3 – 7 MPa and T = 540 – 620°C.
• Usually, the main “steam” and reheat-steam temperatures are the same or very
close in value (for example, 566/566°C; 600/600°C; 600/620°C).
These conclusions coincide with those made by Naidin et al. (2009a) and Pioro and
Duffey (2007).
87
CHAPTER 4
THERMAL LAYOUTS FOR SCWRS: GENERAL CONSIDERATION
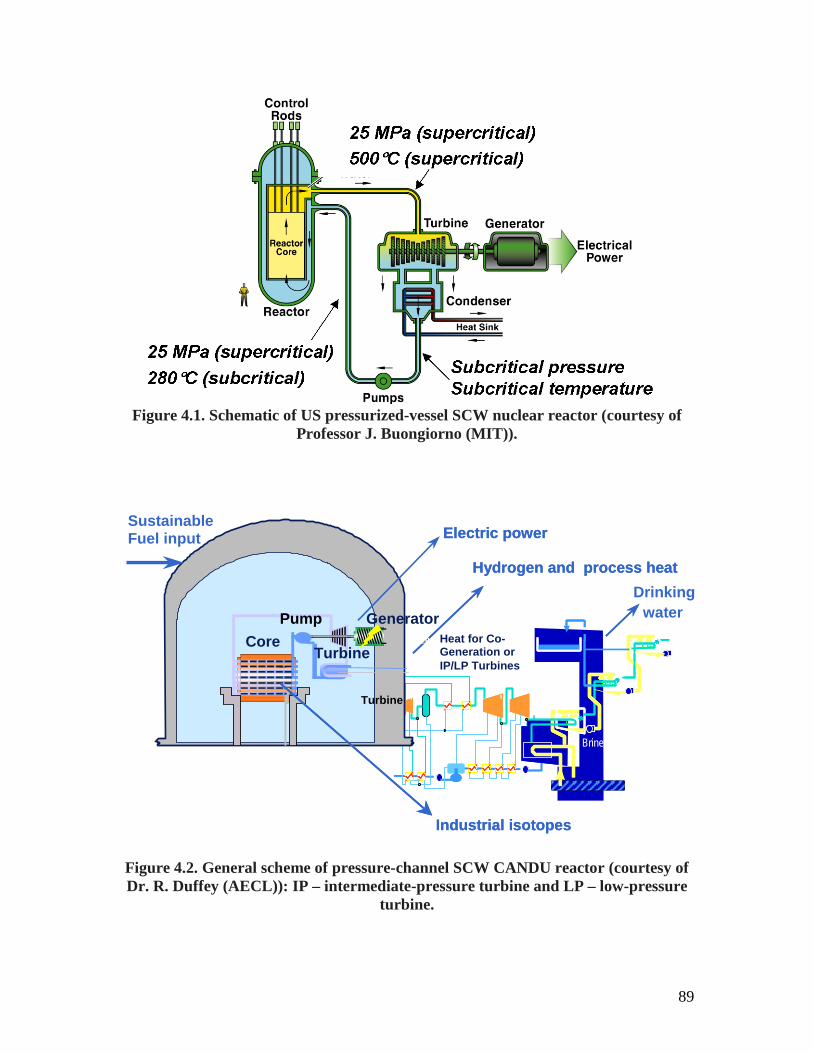
The SCWR concepts (Pioro and Duffey 2007) follow two main types: (a) A large reactor
Pressure Vessel (PV), analogous to conventional Light Water Reactors (LWRs); or (b) a
channelized reactor in which individual Pressure Tubes (PTs) or Pressure Channels
(PChs) (see Figures 4.1 and 4.2) carry high pressure, analogous to conventional Heavy
Water Reactors (HWRs).
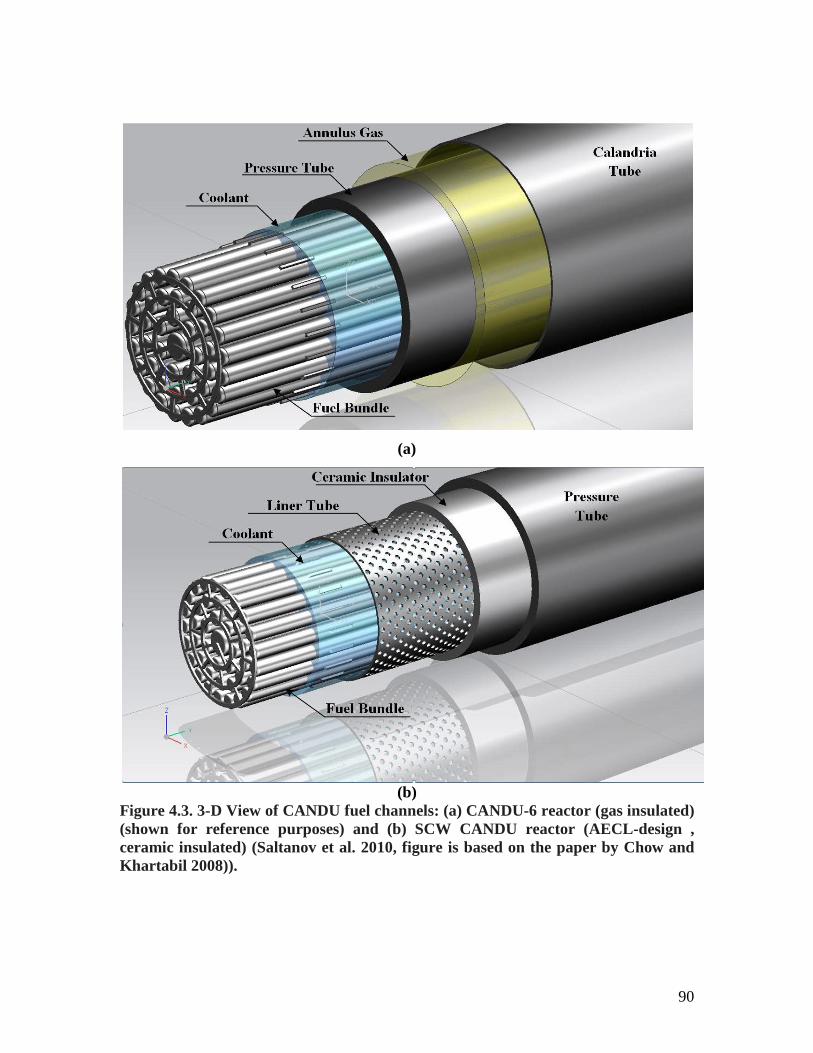
A schematic of a typical channel is shown in Figure 4.3 with the SCWR fuel channel
parameters listed in Table 4.1. A schematic of a typical PT type reactor core layout is
shown in Figure 4.4.
Based on the review in the previous chapter on SC turbines it follows that for a SCWR to
be matched with the modern SC turbines, the SCWR has to be operating on a single-
reheat cycle with the following major parameters: (a) the SC water pressure of 25 MPa
and temperature of 600 − 625ºC at the reactor outlet and (b) the secondary subcritical -
pressure steam – P = 3 – 5 MPa and T = 600 – 650°C at the reactor outlet. However, due
to special safety requirements for nuclear reactors all possible options in terms of SC-
water thermodynamic cycles have to be considered.
The following 3 cycles can be distinguished from the point of view of using different
substance as a working fluid and as a coolant:
1. Direct cycle;
2. Indirect cycle; and
3. Dual cycle.
88
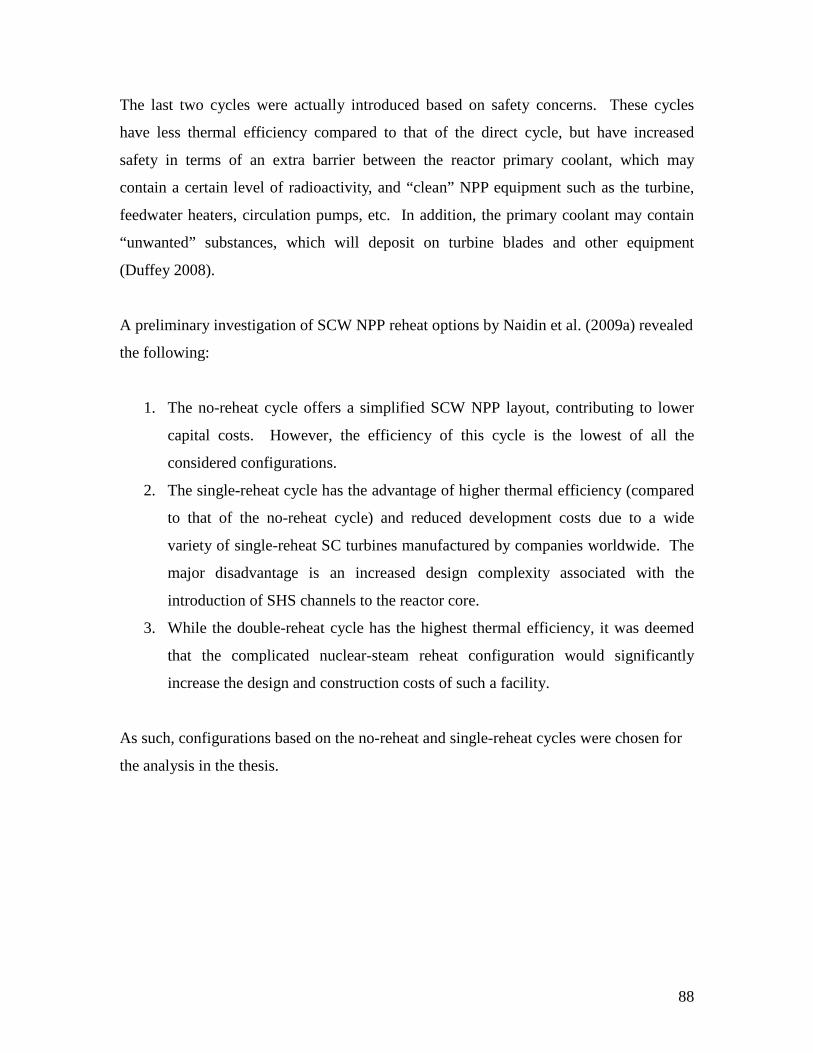
The last two cycles were actually introduced based on safety concerns. These cycles
have less thermal efficiency compared to that of the direct cycle, but have increased
safety in terms of an extra barrier between the reactor primary coolant, which may
contain a certain level of radioactivity, and “clean” NPP equipment such as the turbine,
feedwater heaters, circulation pumps, etc. In addition, the primary coolant may contain
“unwanted” substances, which will deposit on turbine blades and other equipment
(Duffey 2008).
A preliminary investigation of SCW NPP reheat options by Naidin et al. (2009a) revealed
the following:
1. The no-reheat cycle offers a simplified SCW NPP layout, contributing to lower
capital costs. However, the efficiency of this cycle is the lowest of all the
considered configurations.
2. The single-reheat cycle has the advantage of higher thermal efficiency (compared
to that of the no-reheat cycle) and reduced development costs due to a wide
variety of single-reheat SC turbines manufactured by companies worldwide. The
major disadvantage is an increased design complexity associated with the
introduction of SHS channels to the reactor core.
3. While the double-reheat cycle has the highest thermal efficiency, it was deemed
that the complicated nuclear-steam reheat configuration would significantly
increase the design and construction costs of such a facility.
As such, configurations based on the no-reheat and single-reheat cycles were chosen for
the analysis in the thesis.
89
Figure 4.1. Schematic of US pressurized-vessel SCW nuclear reactor (courtesy of
Professor J. Buongiorno (MIT)).
T1, P1
T2, P2
T3, P3
T1, P1
T2, P2
T3, P3
T1, P1
T2, P2
T3, P3
H.P. S
CONDENSER
H.P. S
CONDENSER Brine
Heat for Co-Generation or IP/LP Turbines
Turbine
Pump Generator Core
Sustainable Fuel input Electric power Electric power
Hydrogen and process heat Hydrogen and process heat Drinking
water
Industrial isotopes Industrial isotopes
H.P
Turbine
Figure 4.2. General scheme of pressure-channel SCW CANDU reactor (courtesy of Dr. R. Duffey (AECL)): IP – intermediate-pressure turbine and LP – low-pressure
turbine.
90
(a)
(b)
Figure 4.3. 3-D View of CANDU fuel channels: (a) CANDU-6 reactor (gas insulated) (shown for reference purposes) and (b) SCW CANDU reactor (AECL-design , ceramic insulated) (Saltanov et al. 2010, figure is based on the paper by Chow and Khartabil 2008)).
91
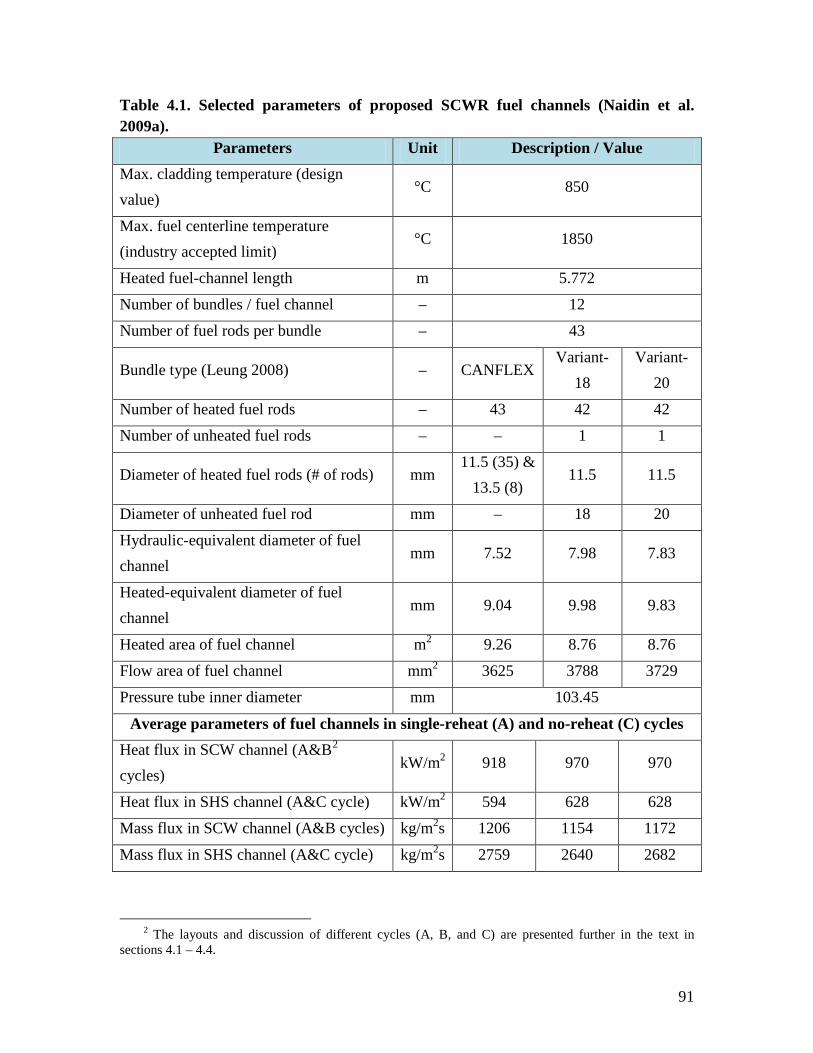
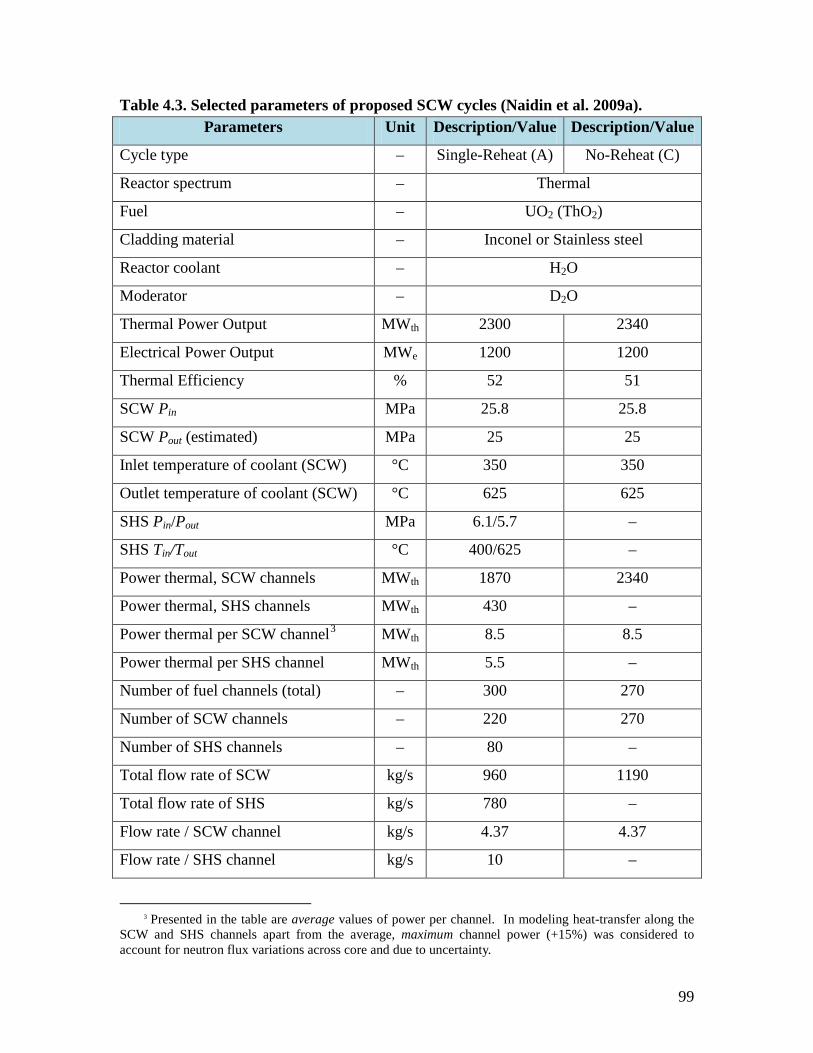
Table 4.1. Selected parameters of proposed SCWR fuel channels (Naidin et al. 2009a).
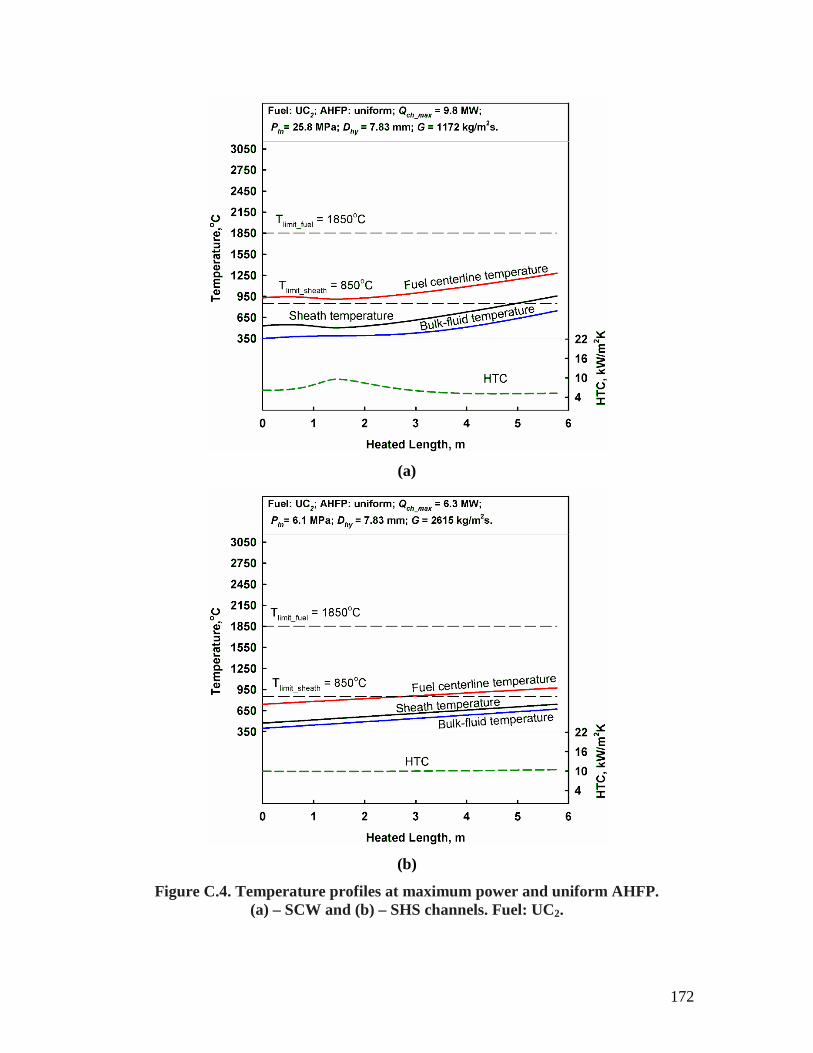
Parameters Unit Description / Value Max. cladding temperature (design value)
°C 850
Max. fuel centerline temperature (industry accepted limit)
°C 1850
Heated fuel-channel length m 5.772
Number of bundles / fuel channel – 12
Number of fuel rods per bundle – 43
Bundle type (Leung 2008) – CANFLEX Variant-
18 Variant-
20
Number of heated fuel rods – 43 42 42
Number of unheated fuel rods – – 1 1
Diameter of heated fuel rods (# of rods) mm 11.5 (35) &
13.5 (8) 11.5 11.5
Diameter of unheated fuel rod mm – 18 20
Hydraulic-equivalent diameter of fuel channel
mm 7.52 7.98 7.83
Heated-equivalent diameter of fuel channel
mm 9.04 9.98 9.83
Heated area of fuel channel m2 9.26 8.76 8.76
Flow area of fuel channel mm2 3625 3788 3729
Pressure tube inner diameter mm 103.45
Average parameters of fuel channels in single-reheat (A) and no-reheat (C) cycles Heat flux in SCW channel (A&B2
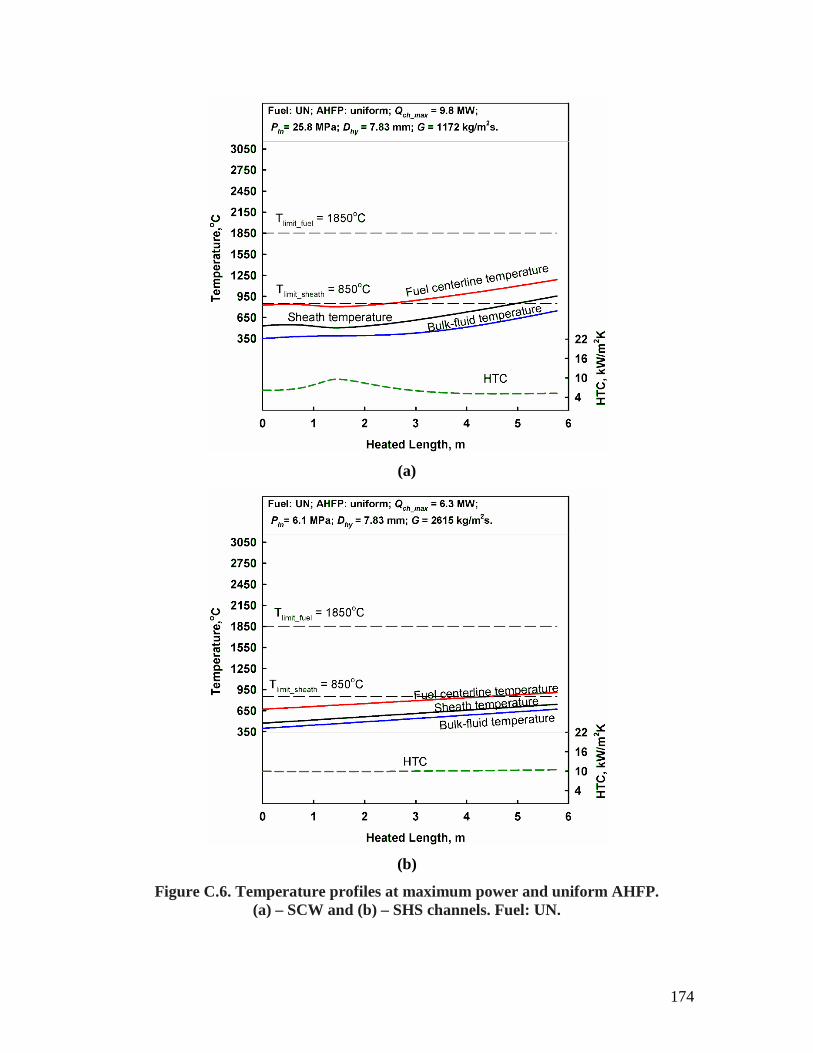
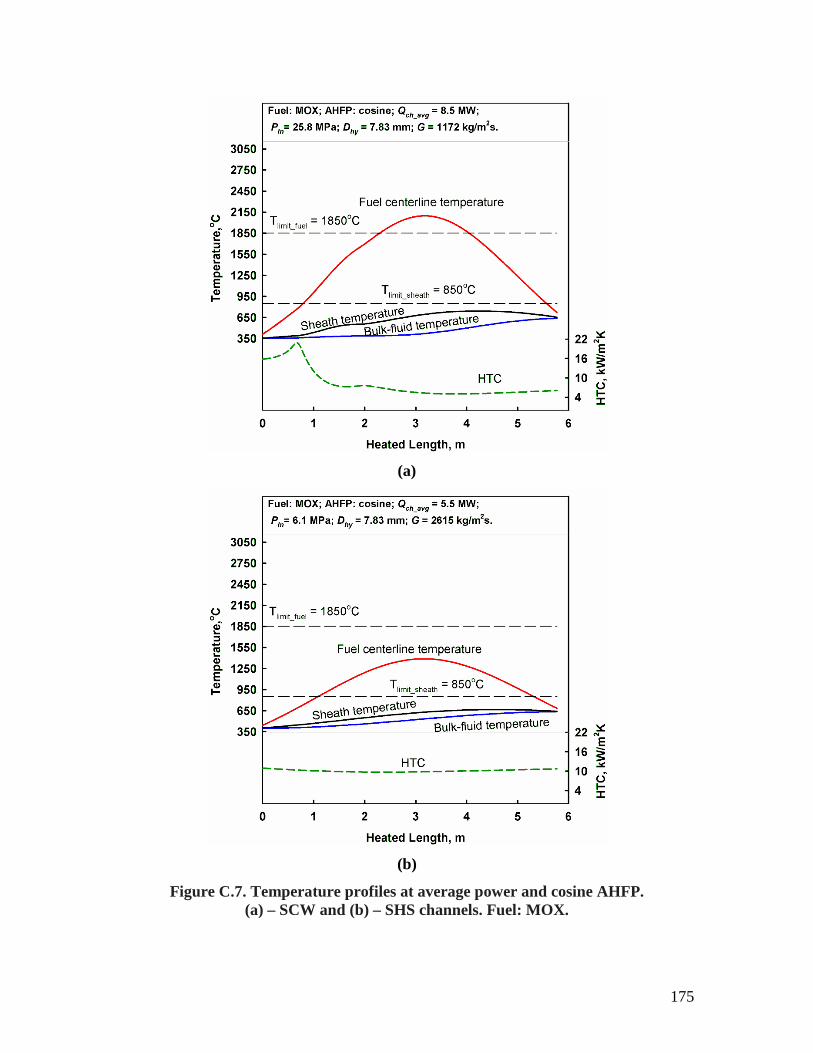
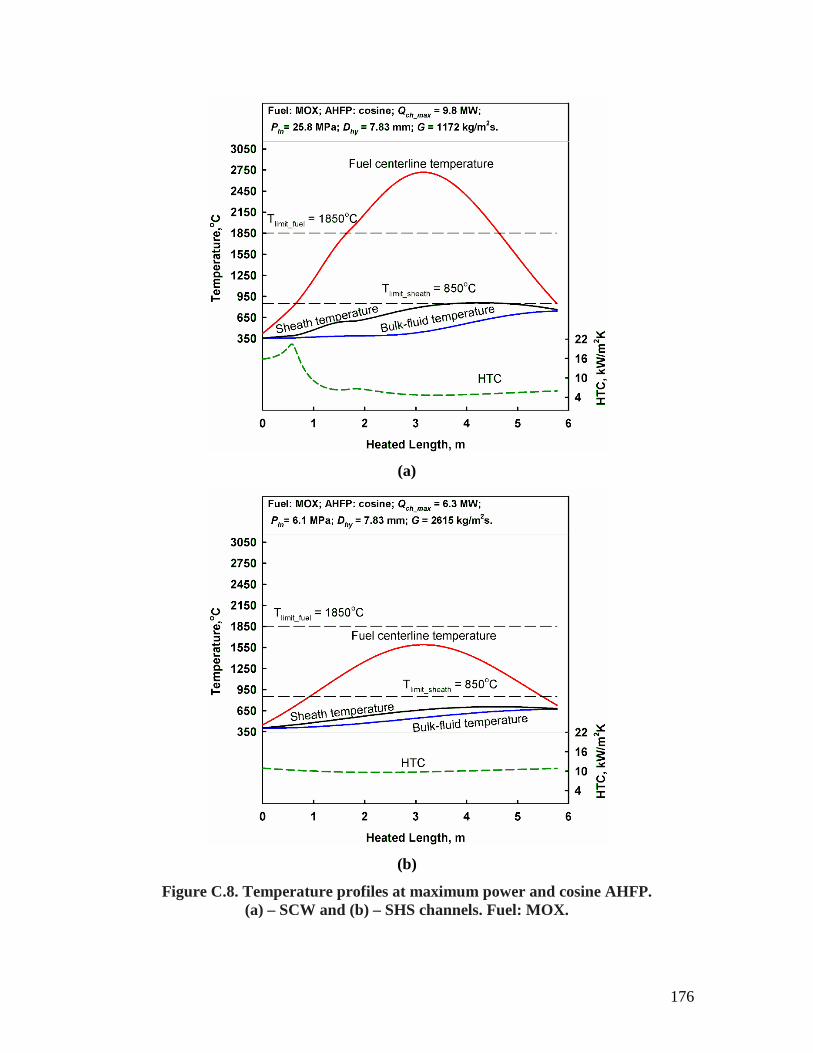
Mass flux in SCW channel (A&B cycles) kg/m2s 1206 1154 1172
Mass flux in SHS channel (A&C cycle) kg/m2s 2759 2640 2682
2 The layouts and discussion of different cycles (A, B, and C) are presented further in the text in
sections 4.1 – 4.4.
92
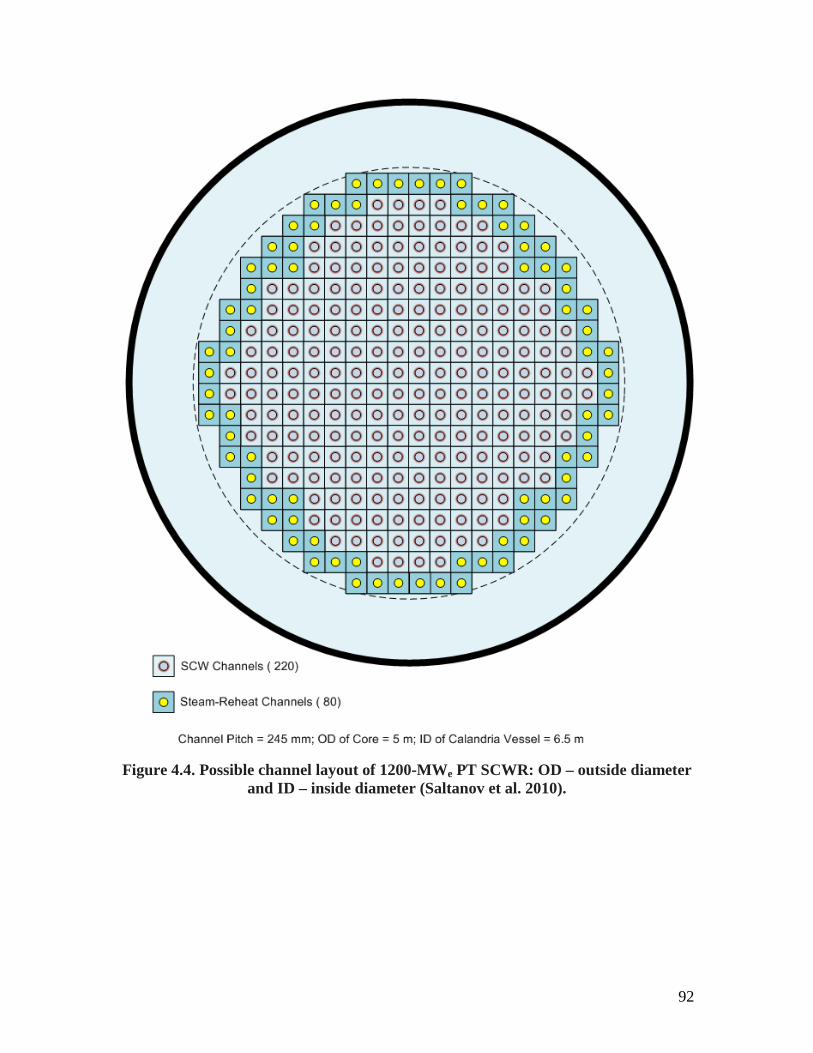
Figure 4.4. Possible channel layout of 1200-MWe PT SCWR: OD – outside diameter
and ID – inside diameter (Saltanov et al. 2010).
93
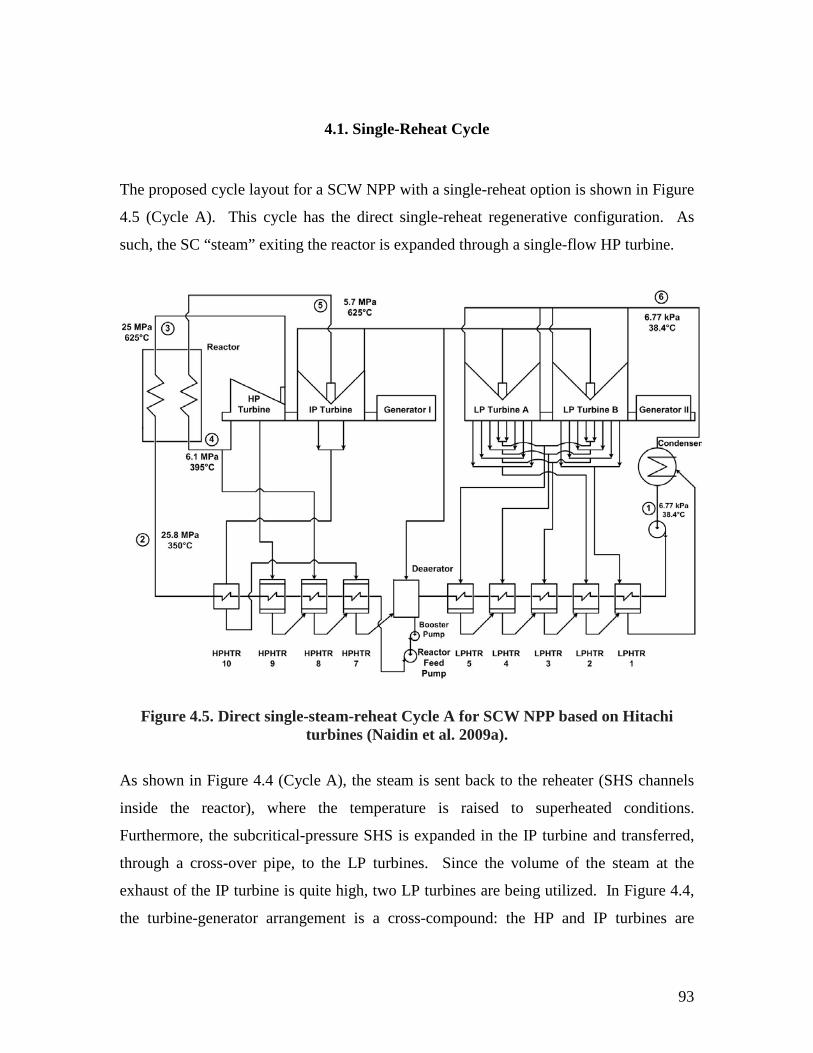
4.1. Single-Reheat Cycle
The proposed cycle layout for a SCW NPP with a single-reheat option is shown in Figure
4.5 (Cycle A). This cycle has the direct single-reheat regenerative configuration. As
such, the SC “steam” exiting the reactor is expanded through a single-flow HP turbine.
Figure 4.5. Direct single-steam-reheat Cycle A for SCW NPP based on Hitachi turbines (Naidin et al. 2009a).
As shown in Figure 4.4 (Cycle A), the steam is sent back to the reheater (SHS channels
inside the reactor), where the temperature is raised to superheated conditions.
Furthermore, the subcritical-pressure SHS is expanded in the IP turbine and transferred,
through a cross-over pipe, to the LP turbines. Since the volume of the steam at the
exhaust of the IP turbine is quite high, two LP turbines are being utilized. In Figure 4.4,
the turbine-generator arrangement is a cross-compound: the HP and IP turbines are
94
located on the same shaft, while the LP turbines are located on a separate shaft (Naidin et
al. 2009a).
4.2. Single-Reheat Cycle with MSR
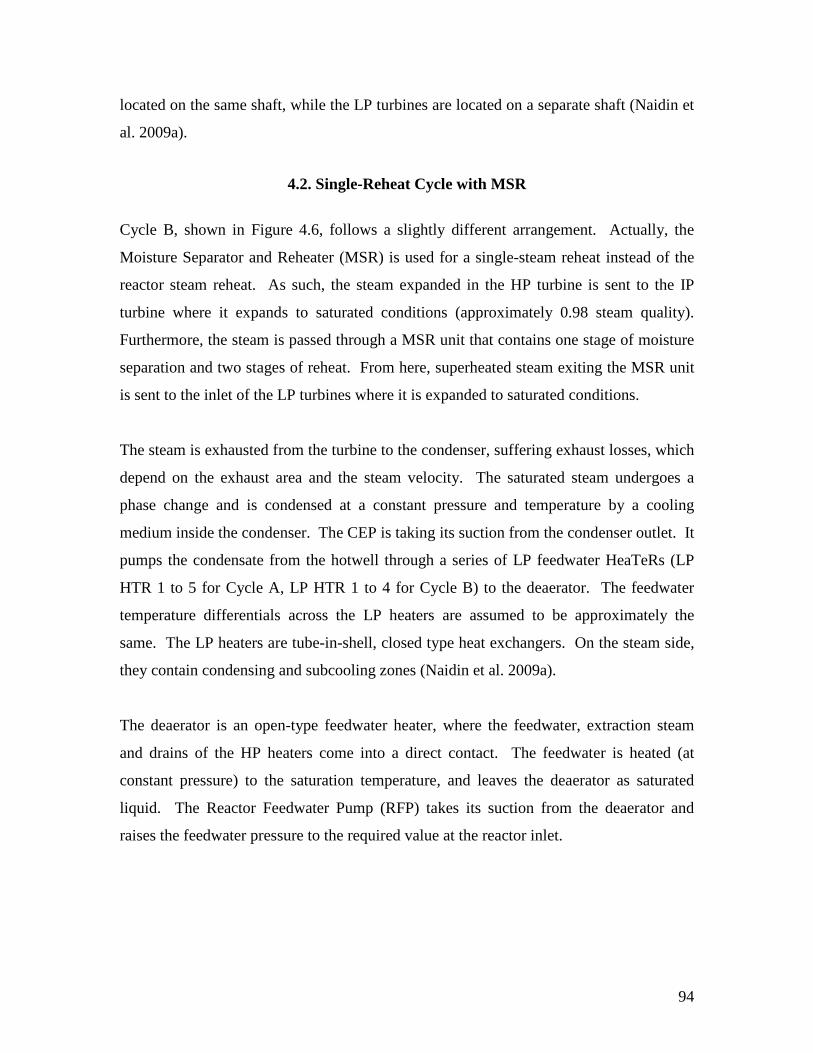
Cycle B, shown in Figure 4.6, follows a slightly different arrangement. Actually, the
Moisture Separator and Reheater (MSR) is used for a single-steam reheat instead of the
reactor steam reheat. As such, the steam expanded in the HP turbine is sent to the IP
turbine where it expands to saturated conditions (approximately 0.98 steam quality).
Furthermore, the steam is passed through a MSR unit that contains one stage of moisture
separation and two stages of reheat. From here, superheated steam exiting the MSR unit
is sent to the inlet of the LP turbines where it is expanded to saturated conditions.
The steam is exhausted from the turbine to the condenser, suffering exhaust losses, which
depend on the exhaust area and the steam velocity. The saturated steam undergoes a
phase change and is condensed at a constant pressure and temperature by a cooling
medium inside the condenser. The CEP is taking its suction from the condenser outlet. It
pumps the condensate from the hotwell through a series of LP feedwater HeaTeRs (LP
HTR 1 to 5 for Cycle A, LP HTR 1 to 4 for Cycle B) to the deaerator. The feedwater
temperature differentials across the LP heaters are assumed to be approximately the
same. The LP heaters are tube-in-shell, closed type heat exchangers. On the steam side,
they contain condensing and subcooling zones (Naidin et al. 2009a).
The deaerator is an open-type feedwater heater, where the feedwater, extraction steam
and drains of the HP heaters come into a direct contact. The feedwater is heated (at
constant pressure) to the saturation temperature, and leaves the deaerator as saturated
liquid. The Reactor Feedwater Pump (RFP) takes its suction from the deaerator and
raises the feedwater pressure to the required value at the reactor inlet.
95
Figure 4.6. Single-reheat Cycle B with MSR for SCW NPP (Naidin et al. 2009a).
The feedwater is passed through 4 HP HTRs (6 to 9) in the case of Cycle B. The HP
heaters are tube-in-shell, closed-type heat exchangers with de-superheating, condensing
and subcooling zones.
4.3. No-Reheat Cycle
The single-reheat cycle introduces nuclear SHS channels, thus increasing the complexity
of the reactor core design. Although preliminary results show that the thermal efficiency
of the no-reheat cycle is approximately 2% lower than that of the single-reheat cycle, the
less complex reactor-core configuration (all channels are cooled with SCW) might prove
to be a major factor when selecting the most suitable design. In conclusion, it is worth
96
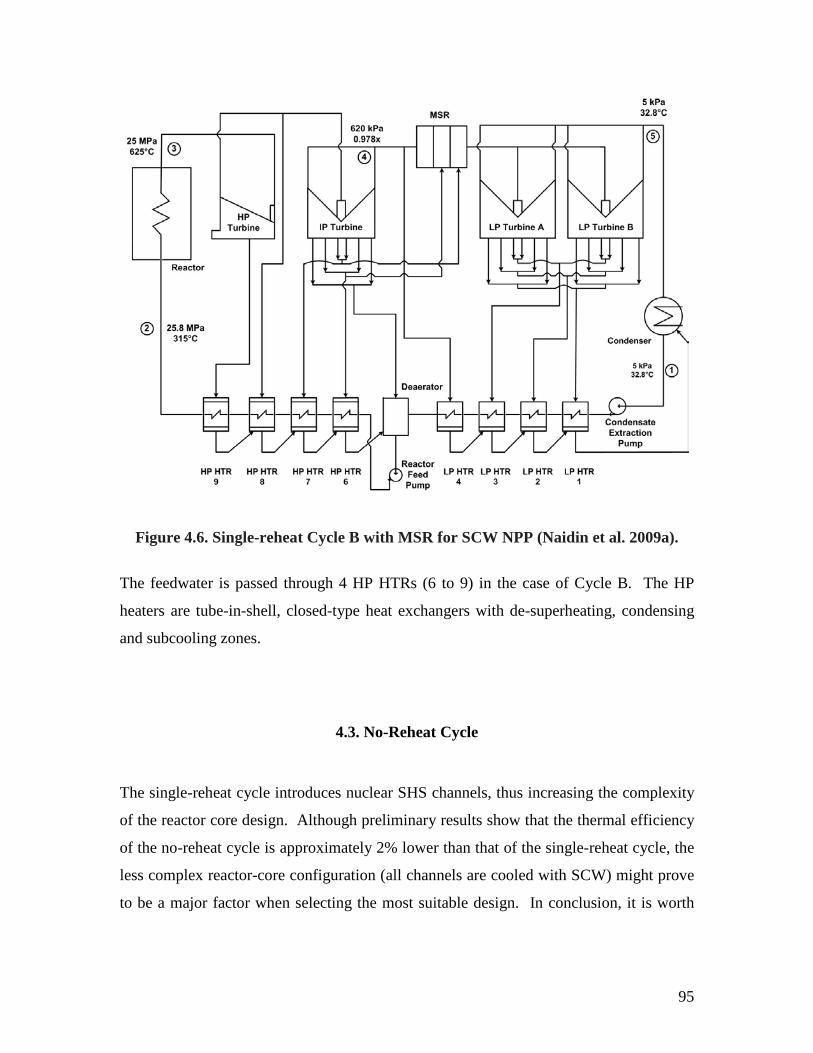
analyzing the possibility of a no-reheat SCW NPP Cycle C (see Figure 4.7) such as the
one proposed in this section (Naidin et al. 2009a).
Figure 4.7. No-reheat Cycle C for SCW NPP (Naidin et al. 2009a).
The proposed no-reheat SCW NPP cycle consists of five LP HTRs, one deaerator, three
HP HTRs and one topping de-superheater. The cycle has a direct, no-reheat, regenerative
configuration. As such, the SC “steam” exiting the reactor is expanded through a double-
flow HP turbine to superheated conditions. Since the volume of the steam at the exhaust
of the HP turbine is quite high, two IP/LP turbines are being utilized. Furthermore, the
steam is exhausted from the IP/LP turbine to the condenser. The saturated steam
undergoes a phase change and is condensed at constant pressure and temperature by a
cooling medium inside a condenser.
The CEP is taking its suction from the condenser hotwell. It pumps the condensate
through a series of five LP HTRs (1 to 5) to the deaerator. The feedwater is heated at
97
constant pressure, and leaves the deaerator as saturated liquid. A RFP takes its suction
from the deaerator and raises the feedwater pressure to the required value at the reactor
inlet (25 MPa). Furthermore, the feedwater is passed through three HP HTRs (7 to 9) and
a topping de-superheater (HP HTR 10).
4.4. Indirect Cycle
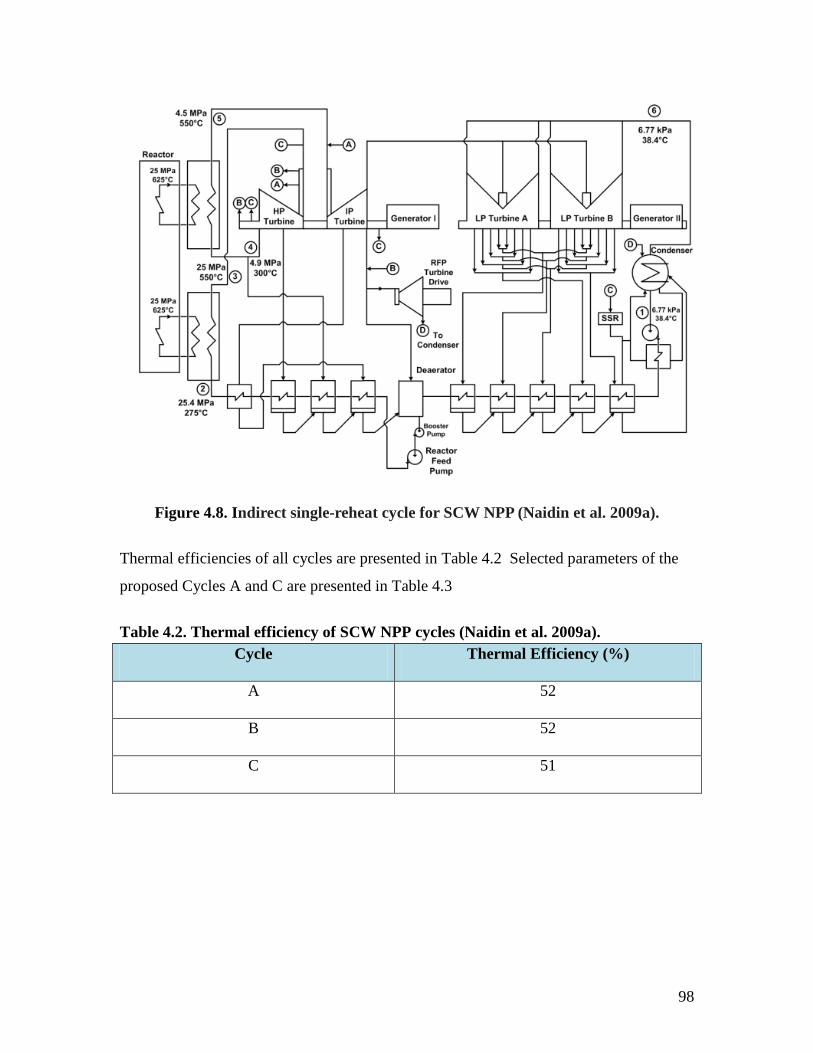
SCWR NPP indirect single-reheat-cycle arrangement is shown in Figure 4.8 (Naidin et al.
2009a). The SC “steam” from the reactor at a pressure of 25 MPa and temperature of
625oC transfers the heat through a heat exchanger to the secondary loop. The SC “steam”
from the secondary loop is expanded inside a single-flow HP turbine from the
supercritical pressure of 25 MPa and temperature 550oC (Point 3) to an intermediate
pressure of 4.9 MPa and temperature of 300oC (Point 4). The subcritical steam from HP
turbine is sent to the second heat exchanger, where SC “steam” from the reactor at a
pressure of 25 MPa and temperature of 625oC raises the steam temperature in the
secondary loop to superheated conditions through the heat exchanger. Then the
superheated steam at a subcritical pressure of 4.5 MPa and temperature of 550oC (Point
5) is expanded in the IP turbine and transferred through a cross-over pipe and expanded
in the LP turbine to a pressure of 6.77 kPa and temperature of 38.4oC (Point 6).
98
Figure 4.8. Indirect single-reheat cycle for SCW NPP (Naidin et al. 2009a).
Thermal efficiencies of all cycles are presented in Table 4.2 Selected parameters of the
proposed Cycles A and C are presented in Table 4.3
Table 4.2. Thermal efficiency of SCW NPP cycles (Naidin et al. 2009a).
Cycle Thermal Efficiency (%)
A 52
B 52
C 51
99
Table 4.3. Selected parameters of proposed SCW cycles (Naidin et al. 2009a). Parameters Unit Description/Value Description/Value
Cycle type – Single-Reheat (A) No-Reheat (C)
Reactor spectrum – Thermal
Fuel – UO2 (ThO2)
Cladding material – Inconel or Stainless steel
Reactor coolant – H2O
Moderator – D2O
Thermal Power Output MWth 2300 2340
Electrical Power Output MWe 1200 1200
Thermal Efficiency % 52 51
SCW Pin MPa 25.8 25.8
SCW Pout (estimated) MPa 25 25
Inlet temperature of coolant (SCW) °C 350 350
Outlet temperature of coolant (SCW) °C 625 625
SHS Pin/Pout MPa 6.1/5.7 –
SHS Tin/Tout °C 400/625 –
Power thermal, SCW channels MWth 1870 2340
Power thermal, SHS channels MWth 430 –
Power thermal per SCW channel3 MWth 8.5 8.5
Power thermal per SHS channel MWth 5.5 –
Number of fuel channels (total) – 300 270
Number of SCW channels – 220 270
Number of SHS channels – 80 –
Total flow rate of SCW kg/s 960 1190
Total flow rate of SHS kg/s 780 –
Flow rate / SCW channel kg/s 4.37 4.37
Flow rate / SHS channel kg/s 10 –
3 Presented in the table are average values of power per channel. In modeling heat-transfer along the
SCW and SHS channels apart from the average, maximum channel power (+15%) was considered to account for neutron flux variations across core and due to uncertainty.
100
Concluding abovementioned results, the single-reheat cycle with heat regeneration and
the corresponding arrangement appears to be the most advantageous as a basis for an
SCW NPP.
4.5. Developed Detailed Thermal Layouts for NPPs Cooled with SCW
Unfortunately, schematics in Figures 4.5 – 4.8 are too general and have parameters only
of the few elements of the cycles. Thus, a complete thermodynamic layout of a SCW
NPP cannot be calculated based on these schematics. Therefore, the objective was to
make a complete calculation of a SCW NPP thermodynamic layout. Figures 4.8 and 4.9
show recalculated schematics of a modern SC thermal power plant in Tom-Usinsk
(Russia), based on the Figures 3.1 and 3.2. The layouts in Figures 4.8 and 4.9 are unique,
because they contain full information on steam extraction from different stages of turbine
and on the rest of the components of the layout. The characteristics of these layouts
match the discussed above concept of the SCWR. Two variants are presented – for 600
MWe output (two turbines should be used) and for 1200 MWe output.
Recalculation was made based on mass flow and heat balance. Pressure drop along line
was recalculated in proportion to the square of the ratio of the recalculated mass-flow rate
to the reference mass-flow rate. This is valid assuming that differences in densities at the
recalculated and reference temperatures are negligible. Rebalancing feedwater heaters
and condenser required iterative search, since for these elements both mass and energy
were to be conserved. Coolant at the deaerator and condenser outlets was assumed to be
at saturated state.
It is important to mention, that heat-transfer calculations presented in the next section
were made based on the parameters of generic SCW/SHS channels corresponding to the
original AECL scheme, presented in Fig. 4.5. However, the detailed schematics
presented below were developed after the heat-transfer calculations had been performed.
Therefore, there is slight difference between the schematics in terms of inlet temperature
to the SCW and SHS channels.
101
Figure 4.8. Thermal layout of 600-MWe single-reheat-cycle: Cyl – Cylinder; D – Deaerator; H – Heat exchanger (feedwater heater); FP - Feedwater pump; CP – Condenser Pump; and TDr – Turbine Drive;
102
Figure 4.9. Thermal layout of 1200-MWe single-reheat-cycle: Cyl – Cylinder; D – Deaerator; H – Heat exchanger (feedwater heater); FP - Feedwater pump; CP – Condenser Pump; and TDr – Turbine Drive;
103
To conclude this chapter, the following advantages of the single-reheat cycle in
application to SCW NPPs should be emphasized:
1. High thermal efficiency (45 – 50%), which is the current level for SC thermal
power plants and close to the maximum thermal efficiency achieved in the power
industry at combined-cycle power plants (up to 55%);
2. High reliability through proven state-of-the-art SC turbine technology;
3. Potential for co-generation of hydrogen; and
4. Reduced development costs based upon the wide variety of available SC turbines
manufactured by companies worldwide.
However, the implementation of a single-reheat-cycle in SCW NPPs will require
designing of the SHS channels and significant changes to the reactor-core design due to
addition of these channels.
104
CHAPTER 5
HEAT-TRANSFER CALCULATIONS FOR GENERIC
SUPERCTICIAL-WATER AND SUPERHEATED-STEAM
CHANNELS
5.1. Overview of Relevant Correlations
At the current design stage of a generic SCW/SHS it is necessary to model coolant
temperature distribution along the channel at steady-state at expected heat flux conditions
and inlet coolant parameters. As the most basic approach, it is the bulk-fluid (or average
in the cross-section) temperature is analyzed based on the heat-balance method. The next
step is to determine temperatures of the sheath of the fuel element, as well as fuel
centerline temperature. There are no exact analytical methods of prediction for
temperature change across the coolant flowing in turbulent regime, and experimentally
obtained heat-transfer correlations are used. Generally in such heat-transfer correlations,
Nusselt number is correlated against the product of Reynolds number and Prandtl
number, each raised to a certain power (so called Dittus-Boelter type). There are several
heat-transfer correlations for the forced convection of a coolant in the supercritical and
superheated-steam state. Below, the most recognized are discussed according to Pioro
and Duffey (2007).
5.1.1. Correlations appropriate for SHS conditions
Due to the difficulty in dealing with the steep property variations, especially in turbulent
flows and at high heat fluxes, satisfactory analytical methods have not yet been
developed. Therefore, empirical generalized HTC correlations based on experimental
data are used for HTC calculations for forced convective turbulent flows.
105
McAdams (1942) proposed to use the Dittus and Boelter (1930) equation in the following
form for forced convective heat transfer in turbulent flows and subcritical pressures (this
statement is based on the recent study by Winterton (1998)):
0.8 nC=b b bNu Re Pr , (5.1)
where C = 0.0243 and n = 0.4 for heating (Tw > Tb), and C = 0.0265 and n = 0.3 for
cooling (Tw < Tb). This equation has been confirmed experimentally for the range of
conditions: 0.7 ≤ Pr ≤ 160; Reb ≥ 10,000.
For flows characterized with large property variations the following equation (Sieder and
Tate 1936) is recommended:
0.14
0.8 1/30.027 b
w
μμ
=
b bNu Re Pr , (5.2)
where all properties are evaluated at Tb except µw, which is evaluated at Tw. This
equation has been confirmed experimentally for the range of conditions: 0.7 ≤ Pr ≤
16,700 and Reb ≥ 10,000.
For superheated steam, a correlation was developed by Hadaller and Banerjee (1969):
0.033
0.877 0.6110.0101 hLD
− =
f f fNu Re Pr , (5.3)
where all properties are evaluated at the film temperature:
2
b wf
T TT += (5.4)
106
Gnielinski (1976) modified and improved a correlation developed by Petukhov and
Kirillov (1958) for supercritical CO2:
( )
( )2/3
10008
1 12.7 18
ξ
ξ
−=
+ −
b b
b
b
Re PrNu
Pr, (5.5)
where friction factor ξ can be determined from an appropriate relation, such as Petukhov
equation:
2
1(0.790ln 1.64)
ξ =−bRe
(5.6)
Gnielinski correlation (5.5) is valid for .0.5 ≤ Pr ≤ 2000 and 3⋅103 < Reb< 5·106.
5.1.2. Correlations appropriate for SCW conditions
Krasnoshchekov and Protopopov (1959, 1960) proposed (later, together with Petukhov
(Petukhov et al. 1961)) the following correlation for forced convective heat transfer in
water and carbon dioxide at supercritical pressures:
0.350.11 0.33pb b
w w pb
k ck c
µµ
− =
0Nu Nu , (5.7)
where according to Petukhov and Kirillov (1958):
107
23
8
12.7 ( 1) 1.078
ξ
ξ=
− +
b
0
Re PrNu
Pr
(5.8)
and 210
1(1.82 log 1.64)
ξ =−bRe
. (5.9)
In effect, the Pr and cp were averaged over the ranges to account for the thermophysical
properties variations. The majority of their data (85%) were generalized using Equation
(5.7) and showed discrepancies within ±15%. Equation (5.7) is valid within the
following ranges:
2·104 Z Reb < 8.6·105, 0.85 < bPr < 65; 0.90 <w
b
µµ
< 3.60, 1.00 <w
b
kk
< 6.00,
and 0.07 < ,
p
p b
cc
< 4.50.
Bishop et al. (1964) conducted experiments with supercritical water flowing upward
inside tubes and annuli within the following range of flow and operating parameters:
pressure 22.8 – 27.6 MPa, bulk-fluid temperature 282 – 527ºC, mass flux 651 – 3662
kg/m2s and heat flux 0.31 – 3.46 MW/m2. Their data for heat transfer in tubes were
generalized using the following correlation, with a fit of ±15%:
0.430.660.90 0069 1 2.4w
b x
D.x
ρρ
= +
xx xNu Re Pr (5.10)
where x is the axial location along the heated length.
Swenson et al. (1965) investigated local forced-convection Heat Transfer Coefficients
(HTCs) in supercritical water flowing inside smooth tubes. They found that, due to rapid
changes in thermophysical properties of supercritical water near the pseudocritical point,
108
conventional correlations did not work well. They recommended the following
correlation:
0.2310.6130.9230 00459 w
b
. ρρ
=
ww wNu Re Pr (5.11)
Equation (5.11) was obtained within the following range: P = 22.8 – 41.4 MPa, G = 542
– 2150 kg/m2s, Tw = 93 – 649ºC, and Tb = 75 – 576ºC; and re-produced the data to within
±15%. Also, this correlation predicted the data of carbon dioxide with good accuracy.
However, Swenson et al. assumed that thermal conductivity was a smoothly decreasing
function of temperature near the critical and the pseudocritical points. According to their
experimental data, the HTC in the pseudocritical region is strongly affected by heat flux.
At low heat fluxes, the HTC had a sharp maximum near the pseudocritical temperature.
At high heat fluxes, the HTC was much lower and did not have a sharp peak.
Krasnoshchekov et al. (1967) modified their original correlation for forced-convective
heat transfer in water and carbon dioxide at supercritical pressures (see Equation (5.7)) to
the following form:
0.3 npw
b pb
cc
ρρ
=
0Nu Nu , (5.12)
where Nu0 is defined in Equation (5.8). Exponent n is 0.4 at 1≤pc
w
TT
or 2.1≥pc
b
TT
;
pc
w
TT
nn 18.022.01 +== at 5.21 ≤≤pc
w
TT
; and
−−⋅+=
pc
b
TT
nnn 1)25( 11 at
2.11 ≤≤pc
b
TT
. Equation (5.12) is accurate within ±20% and is valid within the following
range:
109
8·104 < Reb < 5·105, 0.85 < Pr < 65, 0.09 < b
w
ρρ
<1.0, 0.02 < ,
p
p b
cc
< 49.0,
5.29.0 <<pc
w
TT
, 5.29.0 <<pc
w
TT
(q'' is in W/m2) and 15≥Dx .
Later, Krasnoshchekov et al. (1971) added to Equation (5.11) a correction factor for the
tube entrance region in the form of
80
950950.
Dx..
Dxf
+=
(5.13)
Also, this correction factor can be used for a heated tube with abrupt inlet within
152 ≤≤Dx .
Jackson and Fewster (1975) modified the correlation of Krasnoshchekov et al. to employ
a Dittus-Boelter type form for Nu0. Finally, they obtained a correlation similar to that of
Bishop et al. (1964) without the effect of geometric parameters and with different values
of constant and exponents:
0.30.50.820 0183 w
b
. ρρ
=
bNu Re Pr (5.14)
Hence, it can be expected that Jackson and Fewster correlation will follow closely a trend
predicted by Bishop et al. correlation (Equation (5.10)).
Dyadyakin and Popov (1977) performed experiments with a tight 7-rod bundle with
helical fins cooled with supercritical water and they correlated their data for the local
HTCs as:
110
0.45 0.2 0.10.70.80.021 1 2.5 hyw b b
b in inx x x
Dx
ρ µ ρρ µ ρ
= +
xx xNu Re Pr
, (5.15)
where x is the axial location along the heated length in meters, and Dhy is the hydraulic-
equivalent diameter in meters. This correlation fits the data (504 points) to within ±20%.
The maximum deviation of the experimental data from the correlating curve corresponds
to points with small temperature differences between the wall temperature and bulk
temperature. Sixteen experimental points had deviations from the correlation within
±30%.
The latest SCW correlation developed by Mokry et al. (2009a) was obtained by analyzing
a large set of experimental data obtained in Russia:
0.564
0.6840.9040 0061 w
b
. ρρ
=
bb bNu Re Pr (5.16)
This correlation is valid within P = 22.8 – 29.4 MPa, q'' = 70 – 1250 kW/m2, G = 200 –
1500 kg/m2s and Dhy = 3 – 38 mm. The experimental dataset was obtained for
supercritical water flowing upward in a 4-m-long vertical bare tube. The data was
collected at pressures of about 24 MPa for several combinations of wall and bulk-fluid
temperatures that were below, at, or above the pseudocritical temperature. The values for
mass flux ranged from 200 – 1500 kg/m2s, for heat flux up to 1250 kW/m2 and inlet
temperatures from 320 to 350°C. Mokry et al. (2009a) correlation has demonstrated a
good fit for HTC values (±25%) and for wall temperatures (±15) for the analyzed dataset.
A comparison done by Mokry et al. (2009b) showed that the Dittus-Boelter correlation
significantly overestimates experimental HTC values within the pseudocritical range.
The Bishop et al. and Jackson correlations tended also to deviate substantially from the
experimental data within the pseudocritical range. The Swenson et al. (1965) correlation
provided a better fit for the experimental data than the previous three correlations within
some flow conditions, but did not follow up closely the experimental data within others.
111
Also, HTC and wall temperature values calculated with the FLUENT CFD code (Pioro et
al. 2010, Vanyukova et al. 2009) might deviate significantly from the experimental data,
for example, the k-ε model (wall function). However, the k-ε model (low-Re numbers)
showed better fit within some flow conditions.
In a recent research on creating look-up tables for trans-critical heat transfer, Zahlan et al.
(2010) analyzed a big number of correlations against a large set of date. They showed
that the best agreement with the date in the supercritical water and superheated steam
region had the correlation developed by Mokry et al. (2009) (see Tables 5.1 and 5.2).
Table 5.1. Overall weighted average and RMS errors within three supercritical sub-regions (Zahlan et al. 2010).
Correlation
Supercritical Region Region
Liquid-Like Gas-Like Critical or Pseudocritical
Errors, %
Average RMS Average RMS Average RMS Bishop et al. (1965) 6.3 24.2 5.2 18.4 20.9 28.9 Swenson et al. (1965) 1.5 25.2 -15.9 20.4 5.1 23.0 Krasnochekov et al. (1967)
Table 5.2. Overall average and RMS error within subcritical region (Zahlan et al. 2010).
Correlation
Subcritical liquid Superheated steam
Error, %
Average RMS Average RMS
Sieder and Tate (1936) 27.6 37.4 83.8 137.8
Gnielinski (1976) -4.3 18.3 80.3 130.2
Hadaller and Banerjee (1969) 27.3 35.9 19.1 34.4
Dittus-Boelter (1930) 10.4 22.5 75.3 127.3
Mokry et al. (2009) -1.1 19.2 -4.8 19.6
In bold – the minimum values.
Therefore, Mokry et al. correlation was used to calculate temperature profiles along SCW
and SHS channels. In the case of UO2, usage of heat-transfer coefficient at average value
may underestimate fuel centerline temperature by about 100°C. Therefore, the minimum
value of heat-transfer coefficient was used (1.2 times lower than average) in order to have
conservative results.
5.2. Generic Design of SCWR and Pressure Channels
It is envisaged that a generic SCWR will consist of 220 SCW channels and 80 SHS
channels (Pioro and Duffey 2007). SHS channels are placed in the periphery of the core.
SCW at a temperature of about 350ºC will enter the core and heated there up to
temperature of about 625ºC. The HP turbine inlet pressure will be about 25 MPa. After
expansion to the SHS state (P ≈ 6.1MPa, T ≈ 350 – 400ºC) it will be sent back to the
reactor and superheated there to a temperature of about 625ºC and then sent to the IP
section of the turbine. The detailed parameters of the single-reheat cycle for a generic
SCWR are listed in Table 4.3. The cross section view of the generic SCWR is presented
in Figure 4.4. Peiman et al. (2010) analyzed heat losses from such a configuration. Total
heat loss for the 300 channels is predicted to be around 32.7 MW (about 1.4% of the
reactor thermal power).
113
Table 5.3. Total Heat Losses per Fuel Channel and for 300 Fuel Channels (Peiman et al. 2010). Fuel Channel Ceramic-Insulated
Heat Loss/ SCW Channels, kW 105.2
Heat Loss/ SRH Channels, kW 112.3
# of SCW Channels 220
# of SRH Channels 80
Total Heat Loss (300 Channels), MW 32.7
Ceramic insulation was proposed for the fuel channel, while in conventional CANDU
channels CO2 is used as an insulator. The generic SCW channel consists of a liner tube,
ceramic insulator, and PT. Inconel-718 is a potential candidate, which can be used as the
material of choice for the PT. The minimum required thickness of PT at SCW conditions
is approximately 7.6 mm. The main purpose of the liner tube, which is a perforated tube,
is to protect the ceramic insulator during re-fuelling and operation with fuel bundles
inside. The ceramic insulator, which is 70% porous and made of Yttria-Stabilized
Zirconia (YSZ), should provide good thermal insulation (Peiman et al. 2010).
As mentioned above, water at the supercritical state will be used in the generic SCWR.
All thermophysical parameters experience significant change near the pseudocritical
point. Variations of some thermophysical properties of water along the SCW channel are
plotted in the Figures 5.1 and 5.2 (values of the properties were calculated using NIST
(2007) software).
The values of volumetric expansivity, Prandtl number, and specific heat experience 8 –
10 fold increase in the vicinity of the pseudocritical point. The values of viscosity,
thermal conductivity and density drop 4 – 5 times in the vicinity of the pseudocritical
point. For comparison, the graphs for the same properties are plotted along SHS channel
in the same scale.
114
(a)
(b)
Figure 5.1. Variation of density, viscosity, and volumetric expansivity of water along SCW (a) and SHS (b) channels.
115
(a)
(b)
Figure 5.2. Variation of thermal conductivity, Prandtl number, and specific heat of water along SCW (a) and SHS (b) channels.
116
5.3. Heat-Transfer-Calculations Algorithm
Heat-transfer calculations were made for a channel with Variant-20 bundles. The model
consists of two parts: (a) calculation of the hydraulic-equivalent diameter, Dhy, for the
given geometry of the channel, and (b) calculation of bulk-fluid, fuel-element sheath, and
fuel centerline temperatures along the cannel. In the model, steady-state operating
conditions are assumed and one-dimensional heat transfer along heated length of the
channel is evaluated.
In the part (a), the values of PT inner diameter, DPT,i, outer diameter of the fuel-element
sheath, DSH,o, outer diameter of the central unheated control rod, DUH, and number of fuel
elements, NSH, are the input parameters. Then area blocked by fuel elements, flow area,
wetted perimeter, and Dhy are calculated (Equations 5.17 – 5.20):
Ablock =
π4
NSH DSH ,o2 + DUH
2( ) (5.17)
2,4fl PT i blockA D Aπ
= − (5.18)
, ,( )wet PT i SH SH o UHp D N D Dπ= + + (5.19)
2 2 2
, ,
, ,
4 ( )fl PT i SH SH o UHhy
wet PT i SH SH o UH
A D N D DD
p D N D D− +
= =+ +
(5.20)
The calculated value of Dhy is equal to 7.83 mm for Variant-20 bundle.
In the part (b), first of all, the linear flux shape was set up. Four Axial Heat-Flux Profiles
were considered: uniform, cosine-like, upstream-skewed, and downstream-skewed. The
truncated cosine and upstream-skewed profiles were taken as proposed in the paper by
Leung (2008). Downstream-skewed profile was obtained by symmetrical reflection of
upstream-skewed profile with respect to longitudinal center of the channel. This idea was
proposed by Allison et al. (2009). The AHFPs are plotted in Figure 5.3. These flux
profiles were chosen based on the following ideas. Uniform profile is the easiest one to
117
be reproduced in the experimental set-up, therefore, calculated values could be verified
by experimental. Moreover, if the even burn up is to be achieved in the reactor, then the
flux shape is to be flattened, being close uniform profile. Cosine profile corresponds to
theoretical solution to flux shape along finite cylindrical fuel element. Cosine-like profile
of linear power density q′ used at heat transfer calculations was taken from paper by
Leung (2008), and is described as sum of two sinuses:
( ) ( )' 1.511 sin 0.533 0.04431 0.08373 sin 1.589 0.1137q x x= ⋅ ⋅ + + ⋅ ⋅ + (5.21)
Since it is virtually impossible to hold the same flux shape in all channels during all
times, there are numerous other shapes. The one that covers all possible flux shapes is
represented by downstream-skewed profile. Upstream-skewed profile is relevant to either
the four-bundle-shift or two-bundle-shift refueling scheme in CANDU (Leung 2008).
Figure 5.3. Various AHFPs used for heat-transfer calculations (based on Leung
2008).
After this the inlet values of temperature and inlet and outlet value of pressure are input.
Linear pressure drop along the channel was assumed. Then iterative loop for calculation
118
of temperatures distribution was implemented. Channel length was sliced into
elementary pieces, each 1 mm long. For piece i, value of specific enthalpy hi was
retrieved from NIST4
'' 1
1 1 1
1 1 1 2 1 1
( , ); ( ) ;
( , ) ( , ) andsoon,
ii i i i i i i i
i i i i i i
qh f T P m h h q h hm
T f h P h f T P
++ + +
+ + + + + +
= − = ⇒ = +
= ⇒ =
, specific enthalpy at the end of the piece, hi+1 was calculated from
the heat balance on the piece, and Ti+1 was retrieved from NIST:
where q’ is linear power density.
Knowing bulk-fluid temperature allows calculating wall temperature. In the model, Tw
was calculated from Mokry et al. correlation (see Equation (5.16)), where dimensionless
groups were calculated from their definitions as follows:
4; ;
p
hy w b
hy w b
c
htc D h hmk D k T T
µµ π
⋅ −= = = ⋅
⋅ −bb bNu Re Pr
(5.22)
Mokry et al. correlation requires iteration be made to calculate Tw. Therefore, for the first
piece of channel initial guess of Tw was made, HTC was calculated from Mokry et al.
correlation, and corrected value of Tw,1 was calculated from Newton's cooling law:
( )'
', ,1 ,1
,sh od sh w b w b
sh od sh
qq htc D N T T T Thtc D N
ππ
= ⋅ − ⇒ = +⋅
After that the value of Tw,1 is compared to Tw. If the absolute value of the difference
between these values was higher than 0.1K, the value of Tw,1 was assigned to Tw. and
another iteration was performed, starting from redetermination of heat-transfer coefficient
4 This is a Fortran-based program which calculates various thermophysical parameters for different
substances in gaseous and liquid phase, based on the given inputs. NIST may be called from different programs (Matlab, Excel, etc.) to calculate unknown parameter based on the two known.
119
from Mokry et al. correlation. Therefore, the iterations for the piece I were stopped after
difference of wall temperatures Tw and Tw,1 became less than 0.1 K. For all the next
pieces the initial guess of wall temperature was equal to: Tw,i+1 = Tb,i+1 + (Tw,i – Tb,i). This
approach saved about 35,000 iterations for the channel. HTC profiles along SCW and
SHS channels are plotted in Figures 5.4 and 5.5.
(a)
(b)
Figure 5.4. HTC profiles along SCW (a) and SHS (b) channels at average channel power.
120
(a)
(b)
Figure 5.5. HTC profiles along SCW (a) and SHS (b) channels at maximum channel power.
121
After determining wall temperature, inner sheath temperature, Tsh,id, was determined from
Fourier's law, assuming that the sheath material is Inconel-718:
', ,'
,,,
,
2 ln2
ln
sh id w sh odsh sh sh id w
sh sh sh idsh od
sh id
T T Dqq k N T Tk N DD
D
ππ
−= ⇒ = +
,
where Dsh,o is outer diameter of sheath and Dsh,i is inner diameter of sheath, the latter
being equal to the fuel pellet diameter. Therefore, we assumed perfect contact between
sheath and pellet. To substantiate this assumption, we refer to a paper by Chan et al.
(1999), where heat-transfer coefficient between pellet and sheath is evaluated to be
65kW/m2K at CANDU-6 channels operating conditions. It means that in case of SHS
channel, at maximum power the maximum temperature drop between fuel pellet and
sheath will be about 25ºC, which only slightly affects fuel centerline temperature. At
SCW channel conditions, additionally sheath will be pressed to pellet at much higher
pressure (about 25MPa. Thermal conductivity of sheath, ksh, depends on temperature,
5 One of the reasons why search for an alternative to UO2 to be used in the current CANDU-6 is not a
question of principle is because the outlet temperature reached by coolant is 310°C, which is 15°C below the inlet temperature of the SCWR. The other reason is that UO2 has negative temperature reactivity coefficient.
123
Figure 5.6. Thermal conductivities of nuclear fuels.
As it is seen from Figure 5.6, the fuels maybe distinguished into two groups according to
their thermal conductivity k behaviour with temperature: for UO2, ThO2, and MOX, k is
decreasing with temperature increase up to about 1650°C, while for UC2, UC, and UN k
As one can, maximum relative error is of the order 10−5 and there are single cases when values of temperatures differ in the second
decimal place. It shows convincingly that the programmed model is reliable and should produce reasonable results when use to
calculate temperature profiles at the channel conditions of interest.
169
APPENDIX C
TEMPERATURE PROFILES ALONG SUPERCRITICAL-WATER
AND SUPERHEATED-STEAM CHANNELS WITH MOX, UC2, AND
UN FUELS
(a)
(b)
Figure C.1. Temperature profiles at average power and uniform AHFP. (a) – SCW and (b) – SHS channels. Fuel: MOX.
170
(a)
(b)
Figure C.2. Temperature profiles at maximum power and uniform AHFP. (a) – SCW and (b) – SHS channels. Fuel: MOX.
171
(a)
(b)
Figure C.3. Temperature profiles at average power and uniform AHFP. (a) – SCW and (b) – SHS channels. Fuel: UC2.
172
(a)
(b)
Figure C.4. Temperature profiles at maximum power and uniform AHFP. (a) – SCW and (b) – SHS channels. Fuel: UC2.
173
(a)
(b)
Figure C.5. Temperature profiles at average power and uniform AHFP. (a) – SCW and (b) – SHS channels. Fuel: UN.
174
(a)
(b)
Figure C.6. Temperature profiles at maximum power and uniform AHFP. (a) – SCW and (b) – SHS channels. Fuel: UN.
175
(a)
(b)
Figure C.7. Temperature profiles at average power and cosine AHFP. (a) – SCW and (b) – SHS channels. Fuel: MOX.
176
(a)
(b)
Figure C.8. Temperature profiles at maximum power and cosine AHFP. (a) – SCW and (b) – SHS channels. Fuel: MOX.
177
(a)
(b)
Figure C.9. Temperature profiles at average power and cosine AHFP. (a) – SCW and (b) – SHS channels. Fuel: UC2.
178
(a)
(b)
Figure C.10. Temperature profiles at maximum power and cosine AHFP. (a) – SCW and (b) – SHS channels. Fuel: UC2.
179
(a)
(b)
Figure C.11. Temperature profiles at average power and cosine AHFP. (a) – SCW and (b) – SHS channels. Fuel: UN.
180
(a)
(b)
Figure C.12. Temperature profiles at maximum power and cosine AHFP. (a) – SCW and (b) – SHS channels. Fuel: UN.
181
(a)
(b)
Figure C.13. Temperature profiles at average power and upstream-skewed AHFP. (a) – SCW and (b) – SHS channels. Fuel: MOX.
182
(a)
(b)
Figure C.14. Temperature profiles at maximum power and upstream-skewed AHFP. (a) – SCW and (b) – SHS channels. Fuel: MOX.
183
(a)
(b)
Figure C.15. Temperature profiles at average power and upstream-skewed AHFP. (a) – SCW and (b) – SHS channels. Fuel: UC2.
184
(a)
(b)
Figure C.16. Temperature profiles at maximum power and upstream-skewed AHFP. (a) – SCW and (b) – SHS channels. Fuel: UC2.
185
(a)
(b)
Figure C.17. Temperature profiles at average power and upstream-skewed AHFP. (a) – SCW and (b) – SHS channels. Fuel: UN.
186
(a)
(b)
Figure C.18. Temperature profiles at maximum power and upstream-skewed AHFP. (a) – SCW and (b) – SHS channels. Fuel: UN.
187
(a)
(b)
Figure C.19. Temperature profiles at average power and downstream-skewed AHFP. (a) – SCW and (b) – SHS channels. Fuel: MOX.
188
(a)
(b)
Figure C.20. Temperature profiles at maximum power and downstream-skewed AHFP. (a) – SCW and (b) – SHS channels. Fuel: MOX.
189
(a)
(b)
Figure C.21. Temperature profiles at average power and downstream-skewed AHFP. (a) – SCW and (b) – SHS channels. Fuel: UC2.
190
(a)
(b)
Figure C.22. Temperature profiles at maximum power and downstream-skewed AHFP. (a) – SCW and (b) – SHS channels. Fuel: UC2.
191
(a)
(b)
Figure C.23. Temperature profiles at average power and downstream-skewed AHFP. (a) – SCW and (b) – SHS channels. Fuel: UN.
192
(a)
(b)
Figure C.24. Temperature profiles at maximum power and downstream-skewed AHFP. (a) – SCW and (b) – SHS channels. Fuel: UN.
193
APPENDIX D
NUMERICAL VALUES OF TEMPERATURES AT 12 POINTS
ALONG THE CHANNEL AT AVERAGE POWER Table D.1. Values of bulk-fluid, wall, inner-sheath and UO2 fuel centerline temperatures at 12 points of SCW channel at average power.
Axial position, m AHFP q′ per pin, W/m
Tbf,°C Tw,°C Tsh,id,°C Tf,°C
0 Uniform 35063 350 564 596 1625
Downstr.-sk. 1797 350 354 356 386
0.481 Uniform 35063 370 577 610 1647
Downstr.-sk. 16160 385 661 404 725
0.962 Uniform 35063 382 562 595 1620
Downstr.-sk. 28185 369 480 509 1226
1.443 Uniform 35063 386 528 562 1557
Downstr.-sk. 35698 380 583 616 1699
1.924 Uniform 35063 389 523 557 1547
Downstr.-sk. 39574 386 587 623 1863
2.405 Uniform 35063 393 543 576 1585
Downstr.-sk. 41770 389 594 634 1963
2.886 Uniform 35063 403 574 607 1641
Downstr.-sk. 43927 396 644 683 2131
3.367 Uniform 35063 420 613 644 1710
Downstr.-sk. 46515 413 719 756 2334
3.848 Uniform 35063 445 657 687 1785
Downstr.-sk. 48411 446 796 832 2497
4.329 Uniform 35063 479 704 733 1863
Downstr.-sk. 47249 496 843 878 2516
4.810 Uniform 35063 521 753 781 1941
Downstr.-sk. 39985 555 834 863 2258
5.291 Uniform 35063 571 804 830 2018
Downstr.-sk. 24226 605 757 776 1530
5.772 Uniform 1997 625 857 882 2092
Downstr.-sk. 0 625 625 625 625 Temperature values in red are those exceeding the industry accepted limit for UO2 of 1850°C
194
Table D.2. Values of bulk-fluid, wall, inner-sheath and UO2 fuel centerline temperatures at 12 points of SHS channel at average power.
Axial position, m AHFP q′ per pin, W/m
Tbf,°C Tw,°C Tsh,id,°C Tf,°C
0 Uniform 22688 400 477 500 1031
Downstr.-sk. 1163 400 404 405 425
0.481 Uniform 22688 481 497 518 1059
Downstr.-sk. 10456 404 434 450 657
0.962 Uniform 22688 437 515 537 1088
Downstr.-sk. 18237 416 478 497 908
1.443 Uniform 22688 456 534 556 1117
Downstr.-sk. 23099 434 514 537 1109
1.924 Uniform 22688 475 553 574 1147
Downstr.-sk. 25607 454 544 569 1242
2.405 Uniform 22688 494 572 593 1177
Downstr.-sk. 27028 477 572 597 1339
2.886 Uniform 22688 514 591 612 1207
Downstr.-sk. 28423 501 601 627 1441
3.367 Uniform 22688 534 611 631 1237
Downstr.-sk. 30098 527 632 659 1559
3.848 Uniform 22688 554 630 650 1266
Downstr.-sk. 31325 554 663 690 1661
4.329 Uniform 22688 573 650 669 1296
Downstr.-sk. 30573 582 687 713 1670
4.810 Uniform 22688 594 669 688 1326
Downstr.-sk. 25873 608 695 716 1496
5.291 Uniform 22688 614 689 708 1356
Downstr.-sk. 15676 627 678 691 1107
5.772 Uniform 22688 634 708 727 1389
Downstr.-sk. 0 634 634 634 634
195
APPENDIX E
PUBLISHED PAPERS, CONFERENCES ATTENDED AND
AWARDS In total: papers in refereed proceedings of international/national
conferences/symposiums – 7; major technical reports – 1;
Papers in refereed proceedings of international/national conferences/symposiums
1. Pioro, I., Mokry, S., Peiman, W., Grande, L. and Saltanov, Eu., 2010. Supercritical
Water-Cooled Nuclear Reactors: NPP Layouts and Thermal Design Options of
Pressure Channels, Proceedings of the 17th Pacific Basin Nuclear Conference
(PBNC-2010), Cancun, Mexico, October 24-30, 31 pages.
2. Saltanov, Eu., Peiman, W., Farah, A., King, K., Naidin, M. and Pioro, I., 2010.
Steam-Reheat Options for Pressure-Tube SCWRs, Proceedings of the 18th
International Conference On Nuclear Engineering (ICONE-18), Xi'an, China, May
17-21, Paper 29972, 12 pages.
3. Peiman, W., Saltanov, Eu., Gabriel, K. and Pioro, I., 2010. Heat-Loss Calculations
in a SCWR Fuel-Channel, Proceedings of the 18th International Conference On
Nuclear Engineering (ICONE-18), Xi'an, China, May 17-21, Paper 30069, 9 pages.
4. Pioro, I., Naidin, M., Mokry, S., Saltanov, Eu., Peiman, W., King, K., Farah, A. and
Thind, H., 2010. General Layouts of Supercritical-Water NPPs, Proceedings of the
18th International Conference On Nuclear Engineering (ICONE-18), Xi'an, China,
May 17-21, Paper 29993, 9 pages.
5. Saltanov, E., King, K., Farah, A., and Pioro, I., 2010. Nuclear Steam-Reheat
Options: Russian Experience, Proceedings of The 2nd Canada-China Joint
Workshop on Supercritical Water-Cooled Reactors (CCSC-2010) Toronto, Ontario,
Canada, April 25-28, 2010, Paper 72, 8 pages.
6. Saltanov, E., King, K., Farah, A., and Pioro, I., 2010. Nuclear Steam-Reheat
Options: World Experience, Proceedings of the 31st Canadian Nuclear Society
196
(CNS) and 34th Student Conference of the CNS and CNA, Montreal, Canada, May
24-27, 9 pages.
7. Saltanov, E., Monichan, R., Tchernyavskaya, E. and Pioro, I., 2009. Steam-Reheat
Option for SCWRs, Proceedings of the 17th International Conference On Nuclear
Engineering (ICONE-17), Brussels, Belgium, July 12-16, Paper 76061, 10 pages.
Major technical reports 1. Pioro, I., Saltanov, Eu., Naidin, M., King, K., Farah, A., Peiman, W., Mokry, S.,
Grande, L., Thind, H., Samuel, J. and Harvel, G., 2010. Steam-Reheat Option in
SCWRs and Experimental BWRs, Report for NSERC/NRCan/AECL Generation
IV Energy Technologies Program (NNAPJ) entitled “Alternative Fuel-Channel
Design for SCWR” with Atomic Energy of Canada Ltd., Version 1, UOIT,
Oshawa, ON, Canada, March, 128 pages.
Conferences attended with paper presentation: 1. 17th International Conference On Nuclear Engineering (ICONE-17), Brussels,
Belgium, July 12-16, 2009.
2. 2nd Canada-China Joint Workshop on Supercritical Water-Cooled Reactors (CCSC-
2010) Toronto, Ontario, Canada, April 25-28
3. 18th International Conference On Nuclear Engineering (ICONE-18), Xi'an, China,
May 17-21, 2010.
4. 31st Canadian Nuclear Society (CNS) and 34th Student Conference of the CNS and
CNA, Montreal, Canada, May 24-27.
Awards and honors: 1. Winner in the ICONE-18 (International Conference On Nuclear Engineering)
Student Best Poster Competition for the paper/poster "Steam-Reheat Options for
Pressure-Tube SCWRs";
2. Winner in the ICONE-18 North America Student Best Poster Competition for the
paper/poster "Heat-Loss Calculations in a SCWR Fuel-Channel”.