17 Steam Turbines Under Abnormal Frequency Conditions in Distributed Generation Systems Fabrício A. M. Moura 1 , José R. Camacho 2 , Geraldo C. Guimarães 2 and Marcelo L. R. Chaves 2 1 Federal University of Triângulo Mineiro, 2 Federal University of Uberlândia, Brazil 1. Introduction Considerable efforts have been developed to encourage the installation of independent electricity producers in distribution systems. Obvious example of such efforts is demonstrated by the attempt to standardize their interconnection and protection requirements. However, this standardization can be difficult due to variations in the design of distribution circuits, the various types of generators coupled to the network and the particular requirements of each utility. However, a series of questions points to the development of further studies to ensure the quality of electric power, the system transient stabilty and lifetime of the blades of steam turbines (Moura et al.,2011). Distributed generation shows frequent use of steam turbines as a primary machine to produce electricity. Such units have increased considerably due to a restructuring of the energy sector worldwide. Most of the process of converting thermal energy into electrical energy occurs in the steam turbine. This is due to the numerous advantages of such turbines over other similar technologies. Among the main advantages stands the balanced construction, relatively high efficiency, few moving parts, ease of maintenance, and availability in large sizes. The industries that typically employ the technology of cogeneration are the sugar and ethanol, the pulp and paper and oil refining (Anderson & Fouad, 2003). Recently, special attention has been devoted to turbo-alternators under abnormal conditions of operation of the electrical system concerning the frequency (over or under frequency). In particular, major research efforts have been spent with the main aim of assessing the possible damage they are subjected to the steam turbine when in operation under conditions of prolonged under frequency, during a severe overload condition imposed on the system when occurring a deficit of generation (Kundur, 1994). Contingencies common to the distribution of electricity systems can cause serious damage to the generators installed in parallel to the network as well as steam turbines responsible for providing mechanical power to their axis. Thus, it is necessary to assess the possible impacts of steam turbines of the IP (independent producer) electrical machinery in system abnormal operating conditions. www.intechopen.com
Transcript
17
Steam Turbines Under Abnormal Frequency Conditions in Distributed Generation Systems
Fabrício A. M. Moura1, José R. Camacho2, Geraldo C. Guimarães2 and Marcelo L. R. Chaves2
1Federal University of Triângulo Mineiro, 2Federal University of Uberlândia,
Brazil
1. Introduction
Considerable efforts have been developed to encourage the installation of independent electricity producers in distribution systems. Obvious example of such efforts is demonstrated by the attempt to standardize their interconnection and protection requirements. However, this standardization can be difficult due to variations in the design of distribution circuits, the various types of generators coupled to the network and the particular requirements of each utility. However, a series of questions points to the development of further studies to ensure the quality of electric power, the system transient stabilty and lifetime of the blades of steam turbines (Moura et al.,2011).
Distributed generation shows frequent use of steam turbines as a primary machine to produce electricity. Such units have increased considerably due to a restructuring of the energy sector worldwide.
Most of the process of converting thermal energy into electrical energy occurs in the steam turbine. This is due to the numerous advantages of such turbines over other similar technologies. Among the main advantages stands the balanced construction, relatively high efficiency, few moving parts, ease of maintenance, and availability in large sizes. The industries that typically employ the technology of cogeneration are the sugar and ethanol, the pulp and paper and oil refining (Anderson & Fouad, 2003).
Recently, special attention has been devoted to turbo-alternators under abnormal conditions of operation of the electrical system concerning the frequency (over or under frequency). In particular, major research efforts have been spent with the main aim of assessing the possible damage they are subjected to the steam turbine when in operation under conditions of prolonged under frequency, during a severe overload condition imposed on the system when occurring a deficit of generation (Kundur, 1994).
Contingencies common to the distribution of electricity systems can cause serious damage to the generators installed in parallel to the network as well as steam turbines responsible for providing mechanical power to their axis. Thus, it is necessary to assess the possible impacts of steam turbines of the IP (independent producer) electrical machinery in system abnormal operating conditions.
www.intechopen.com
Mechanical Engineering
382
For this it is essential to develop a computer model able to represent accurately the phenomena experienced.
2. Steam turbines control functions
The speed regulation system is the primary control loop of the Automatic Generation Control (AGC) of an electrical system. The control of active power in a power system is accomplished primarily by controlling the torque of the machines primary drive system (Anderson & Fouad, 2003).
Figure 1 illustrates a system for regulating the speed of a steam turbine. By controlling the
position xE of the control valve, a control can be exercised over the admission of steam (or
water) at high pressure trough the turbine, and therefore the torque of the turbine. For a
hydraulic amplifier, the input is the position of the pilot valve xD and the output is position
xE of the main piston. A small downward movement of point E, the steam flow increases by
an amount that, if measured in terms of power valve, represents an increment vP . This
increased flow is rendered by the increase in turbine power, TP .
Fig. 1. Example illustrating the mechanical speed control system of a steam turbine
The pilot valve XD, still in figure 1, can have its position changed, through the links or arms connection system, in three ways:
Directly, by the speed changer. A small downward movement of the connecting point
A ( Ax ) corresponds to an increase in the reference power, rP ef ;
Indirectly, by feedback, due to changes in the position of the connection point E of the
main piston ( Ex ), resulting from variations in steam pressure;
www.intechopen.com
Steam Turbines Under Abnormal Frequency Conditions in Distributed Generation Systems
383
Indirectly, by feedback due to changes in the position of the connection point B ( Bx ),
resulting from changes in speed.
Historically, load-frequency primary controls are part of the so-called characteristics of speed
governors. However, the term “regulator“ implies a mechanical speed sensor mechanically
connected to control variations in input power, and since today most of the load-frequency
controls are electro-hydraulic, speed control term does not describe generically this control
function (Kundur, 1994).
2.1 Isochronous governor
Another simple mechanism of regulation is shown by figure 2. In this case, the deviation in
speed, captured by the centrifugal body (flyballs), cause the displacement x in the pilot
valve, which makes the oil to flow though the main servo motor. This servo motor, in turn,
opens or closes the valve or turbine blades, depending on the direction of x.
It is important to observe that a displacement x in the pilot valve causes a rate of change of
the servo piston, or a rate of change in the valve position.
Fig. 2. “Isochronous” type speed governor
With reference to figure 2, can be written for the position of pilot valve (x):
1x k f (1)
where:
f = frequency deviation (f0 – f); k1 = proportionality constant.
Also, for the turbine valve position (y), we have:
2
d( y) k x
dt (2)
www.intechopen.com
Mechanical Engineering
384
where: k2 = proportionality constant.
1 2
d( y) k k f
dt
or
1 2y k k f dt (3)
These equations are described in the block diagram in figure 3.
Fig. 3. Block diagram of the isochronous type speed governor
Due to the integrative action of the main servo motor, it is evident that y reach a new
equilibrium state only when f reaches zero.
The governor with the configuration of figure 2 will therefore reduce the frequency error to
zero in steady state and move the valve position, within physical limits, to any position that
is necessary to make such reduction. It is known as an isochronous governor.
Note that a frequency shift may occur either by variation of the actual frequency, or change
in the reference value f0, which is accomplished through a change in the pivot point, usually
via a screw mechanism, triggered by a “synchronization engine“, or change of speed level
motor.
Isochronous governors are not used in multiple machines systems, because of the need for
appropriate division of load between the machines. The division itself is ensured by
providing a regulation and speed decrease in the governor action or speed control (Kundur,
1994).
2.2 Governor with speed drop
Figure 4 shows the schematic of a governor with speed drop or adjustment of equilibrium.
The characteristic drop is due to the connection between the pilot valve and the main servo
motor
www.intechopen.com
Steam Turbines Under Abnormal Frequency Conditions in Distributed Generation Systems
385
Fig. 4. Schematics of the speed drop governor
With reference to the block diagram of the isochronous governor in figure 2, the effect of the
feedback connection, figure 4, is represented by inserting a gain K3. This fact is illustrated in
figure 5.
Fig. 5. Block diagram of the governor with speed drop
Figure 6 shows the time response of the valves controlled by the speed governor to a step
change in the frequency deviation. TG is known as a time constant of speed governor,
usually the order of a fraction of a second (0.5 s).
From the transfer function in figure 6, a function given by equation (4), one can notice that
the value of the steady-state frequency shift f required to produce a variation of 1 p.u. at
the valve of the turbine V is R. This parameter is known as “speed control”.
valve (p.u.) 1
frequency (p.u.) R(1 sT )G
(4)
The parameter R can also be expressed in percentage as
0
R
N NR% 100%
N
where: N0 = speed in steady-state at no load (valves closed);
www.intechopen.com
Mechanical Engineering
386
N = steady-state speed at full load (valves completely opened); NR = rated speed.
Fig. 6. Throttle response controlled by the speed governor in figure 4 to a step change in the frequency deviation.
Thus, a regulation of 5% means that a frequency deviation of 5% causes a 100% change in power or at the valve outlet. In the terminology of process control, the governor would be characterized as a proportional control of a proportional gain of 1/R, or a proportional band of R×100%.
In order to familiarize the reader with the methodology used to perform computer simulations of dynamic software analysis, it is presented through figure 7 the block diagram of a steam turbine with reheat, figure 7(a) and without reheating, figure 7(b). However, they are representations for a system that is being represented by a single equivalent electric machine.
Fig. 7. Block diagrams for isolated systems represented by a single equivalent machine: (a) steam without reheat, (b) steam with reheat
www.intechopen.com
Steam Turbines Under Abnormal Frequency Conditions in Distributed Generation Systems
387
In figure 7 was used the following notation:
M = (MS + MR + MH) = combined inertia moment;
D = PL / = damping characteristics of the load; Rs = Regulation of steam without reheating; Rr = Regulation of steam with reheating; TR = Reheater time constant; TS = Charging time of the steam turbine; TG = Time constant of the governor.
However, figure 8 presents the block diagram of a steam turbine in a simplified form. It is one of the models adopted by the IEEE – Institute of Electrical and Electronic Engineers (Anderson & Fouad, 2003). It is noteworthy that for a steam unit T4 = 0s.
Fig. 8. Model for a thermal turbine speed governor
3. Steam turbine operation under abnormal conditions of frequency
Special attention has been given to the operation of turbo-generators under abnormal
system operating conditions concerning the frequency (over or under frequency). In
particular, more research efforts have been made to analyze the possible damage the steam
turbines are the subject when operating in conditions of prolonged under frequency, during
a severe overload imposed on the system with the occurrence of a generation deficit.
To avoid a total collapse of the system and minimize the damage to the equipment during such disturbances, considerable effort has been expended in the development and implementation of automatic load shedding. These load shedding programs are idealized to reject just enough loads to lighten the remaining generation system from overload to restore as soon as possible the system frequency close to nominal.
Both the turbines and generators have operational restrictions, to different degrees, under abnormal frequency conditions. On the other hand, steam turbines are more sensitive to the under frequency phenomena when compared with the attached generators. For this reason, the following discussion is related to the steam turbines (Anderson & Fouad, 2003).
3.1 Turbine limits
The steam turbine consists of a sequence of stages of increasing dimensions with each stage having more complicated geometry of stator and rotor blades. Each blade row has its own natural frequency. The turbines are carefully designed so that the resonance frequencies of the blades to the rated speed are sufficiently out of phase, to avoid vibration and excessive “stress” or fatigue.
www.intechopen.com
Mechanical Engineering
388
Must be highlighted that here will be presented a discussion for systems operating in a nominal frequency of 60 Hz, like in Brazil.
Figure 9 illustrates the phenomenon that involves operations of the turbines under off-nominal frequency (“off-frequency operation”), showing the amplitude of vibrations fatigue for a number of stages of a turbine vane according to the nominal frequency. It is observed that when the turbine operates out of its nominal frequency, the amplitude of “stress” increases and some damage can be cumulative.
The Campbell diagram, illustrates how a change in turbine speed can provide steam excitation frequencies that coincide with the natural frequencies of a blade, how can be seen in the reference cited at final of this paragraph. At the figure 9 is demonstrated the relationship between blade failure due to fatigue and off-frequency operation. Below stress level A, the vibration stress amplitude is low enough that no damage results. Operation at stress level B would produce a failure at 104 cycles, and at level C failure would occur at 103 cycles (Kundur, 1994).
(a) (b)
Fig. 9. Frequency x stress (fatigue) range for steam turbines (a) Increase in vibration amplitude with off-frequency operation; (b) Stress x number of cycles to failure
Research for a large amount of vibration frequency data leads to the time limits suggested for operations outside of the nominal frequency range and for different steam turbines that are represented in figure 10.
The diagram of figure 10 represents the estimated minimum time to the failure of some part of the structure of the blades, illustrating the limits of time for operation of steam turbines for both the under-frequency and for over-frequency. It is observed for a frequency deviation of 5% or more, the damage time becomes very small and it is not practical to operate a system more than a few seconds in this frequency range.
As can be seen, for the lower limit frequency, i.e., approximately fn- 6% Hz (see figure 10), the permissible minimum time is one second for frequencies near the nominal time is undefined so that a variation frequency of 1%, will have no harmful effect on the blades.
It is important to note that the effect of operation outside the nominal frequency is cumulative, i.e., half a minute of operation under full load at fn–4% Hz now leaves only approximately another half a minute of fn–4% Hz for operation in the unit life.
www.intechopen.com
Steam Turbines Under Abnormal Frequency Conditions in Distributed Generation Systems
389
Fig. 10. Frequency limits of the operation of a steam turbine
From figure 10, we can build table 1 that shows the maximum time values of operating a steam turbine according to its frequency.
Frequency at full load (Hz) Maximum operating time
fn – 1% Continuously
fn – 2% 100 minutes
fn – 3% 10 minutes
fn – 4% 1 minute
fn – 5% 0.1 minute
fn – 6% 1 second
Table 1. Maximum operating time of a steam turbine according to its frequency of operation at full load
The condition most often found corresponds to the turbine over-frequency, resulting in sudden shutdown of the generator by the action of the breaker. Under these conditions the characteristic of the speed governor will allow an over speed of around 5% and from there take immediate action to reduce the speed to close to the nominal (Anderson & Fouad, 2003).
3.2 Cascading shots
If a limit is reached for operating a turbine, it will be disconnected from the system by actions of its protection. This exacerbates the problem, since the power imbalance increases (greater deficit of generation), and consequently, the frequency drops quickly and the system enters a cascade process until it comes to the collapse.
www.intechopen.com
Mechanical Engineering
390
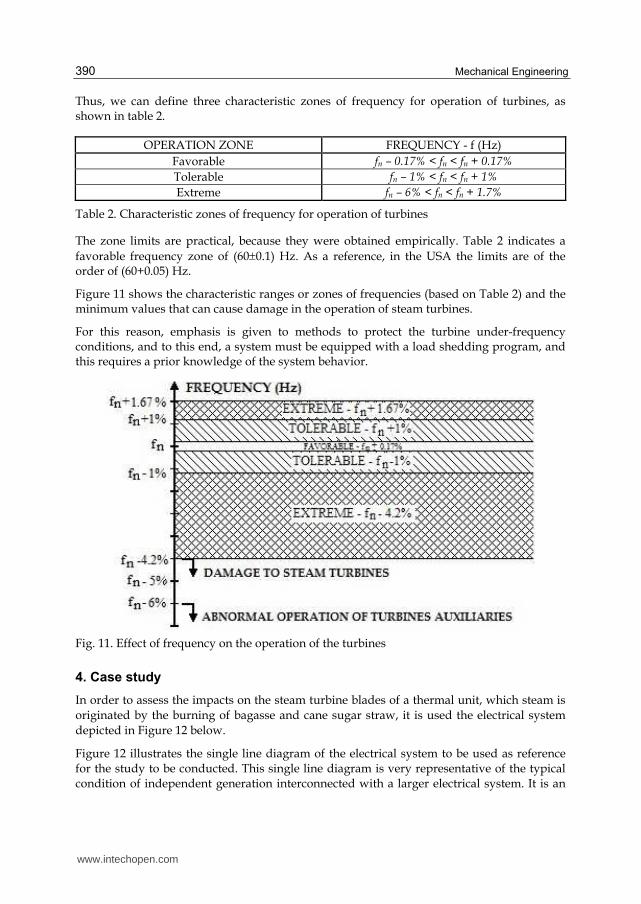
Thus, we can define three characteristic zones of frequency for operation of turbines, as shown in table 2.
OPERATION ZONE FREQUENCY - f (Hz)
Favorable fn – 0.17% < fn < fn + 0.17%
Tolerable fn – 1% < fn < fn + 1%
Extreme fn – 6% < fn < fn + 1.7%
Table 2. Characteristic zones of frequency for operation of turbines
The zone limits are practical, because they were obtained empirically. Table 2 indicates a
favorable frequency zone of (600.1) Hz. As a reference, in the USA the limits are of the order of (60+0.05) Hz.
Figure 11 shows the characteristic ranges or zones of frequencies (based on Table 2) and the minimum values that can cause damage in the operation of steam turbines.
For this reason, emphasis is given to methods to protect the turbine under-frequency conditions, and to this end, a system must be equipped with a load shedding program, and this requires a prior knowledge of the system behavior.
Fig. 11. Effect of frequency on the operation of the turbines
4. Case study
In order to assess the impacts on the steam turbine blades of a thermal unit, which steam is
originated by the burning of bagasse and cane sugar straw, it is used the electrical system
depicted in Figure 12 below.
Figure 12 illustrates the single line diagram of the electrical system to be used as reference for the study to be conducted. This single line diagram is very representative of the typical condition of independent generation interconnected with a larger electrical system. It is an
www.intechopen.com
Steam Turbines Under Abnormal Frequency Conditions in Distributed Generation Systems
391
Fig. 12. Single line diagram for the electrical system in the case considered
electricity distribution network, connected to the busbar number 3 (Point of Common
Coupling - PCC), through a transformer, the independent producer electrical system. The
representation of the (IPP) Independent Power Producer consists of two synchronous
generators (whose primary machines are steam turbines), a static electrical load as well as an
electric motor, internal to this “independent” system. In addition to meeting its domestic
demand for energy, these generators also provides power to the distribution network.
The three-phase distribution network has an ideal voltage source (infinite bus), connected to
transformer T1, through busbar 1. This transformer T1 is connected to two power
distribution lines of 13.8 kV through busbar 2. This busbar has a capacitor bank and load.
The two referred distribution lines end at busbar 3, where it is connected to transformer T2.
At busbar 3, there is a bank of capacitors and load. Transformer T2 is used to make the
connection between the power utility and the independent power producer. The
transformer T2 is also connected to busbar 4, where are connected the generators of the
independent power producer (IEEE Std. 1547, 2003). These generators have the nominal
values of 5 MVA, 6.6 kV. At busbar 4 there is also another transformer T3, which is
connected to busbar 5, where we have the loads of the independent power producer.
The voltage source, which is the mains of the distribution system, was implemented as na
ideal three-phase source. Therefore, the short-circuit level at busbar 1 is considered infinite.
The data needed for modeling the independent power producers generators (among others,
the sub-transient, transient, synchronous reactance and time constants) are listed in Table 3.
The rated parameters obtained for the machine voltage and speed regulators, as well as data
referred to the independent power producer synchronous generator, were obtained directly
from manufacturers.
www.intechopen.com
Mechanical Engineering
392
Data needed for G1 (G1 = G2)
Sn = 5MVA x0=0.046pu
Un= 6.6kV T’d0=1.754s
RA= 0.004pu T’q0=0s
xL= 0.1pu T”d0=0.019s
xd= 1.8pu T”q0=0.164s
xq=1.793pu H1=1s ;H2=2s
x’d=0.166pu P=4 poles
x’q=0.98pu f=60 Hz
x”d=0.119pu ωs = 188.5 rad/s
x”q=0.17pu ---
Table 3. Synchronous machine parameters for the independent generator
It is highlighted that this independent generator is driven by a steam turbine with regulators and governors modeled in “ATP-Alternative Transients Program”, through the use of TACS subroutines. Thus we adopted here the block diagram shown in Figure 8 in order to assess the dynamic response of the system of Figure 12, towards the contingency to be applied. Similar works using ATP were developed like (Saldaña et al., 2006) and an important work about distributed generation can be found in through (Freitas et al. 2006).
However, it is necessary the modeling of the voltage regulator to obtain a better and more reliable response from the model. In this way, it is presented through Figure 13 the block diagram used to represent the excitation regulator. This is the IEEE type I model (Guimarães, 1990).
Fig. 13. Voltage regulator model
4.1 Sudden opening of the interconnection breaker
With the purpose of evaluating the influence of penetration of the independent power
producer in the largest network and its close correlation with the inertia moment of the
generator, with regard to the maintenance of transient stability was established the power
flow illustrated in Table 4.
The machines of the IPP generate a total of 4.2 MW and 1.5 MVAr respectively of active and reactive three-phase power. Thus, the total of active power generated 1.7 MW is designed to the grid of the local electricity authority.
www.intechopen.com
Steam Turbines Under Abnormal Frequency Conditions in Distributed Generation Systems
393
Source PG [MW] QG [MVAr]
G1 0.7 0.25
G2 0.7 0.25
Table 4. Active and reactive power generated by the independent power sources
It is worth clarifying to the reader the pre-established conditions to the speed governors of
the IPP machines, these where adjusted to operate with a 5% slope, in order to better meet
the interconnection. Therefore, no machine installed in the IPP generation, has the
characteristic to ensure that frequency oscillations will be inside the favorable frequency
range, i.e., there is no need for the presence of an isochronous generator.
Faced by the sudden opening of the interconnection circuit breaker there is a considerable
fluctuation in the speed of the electric machine G2, Figure 14(a). Such transient oscillation
immediately affects the frequency in the electrical system belonging to the IPP, burdening
strongly the quality of electricity, especially with regard to the efficiency of micro-
computerized devices (Dugan et al., 2002).
However, slight changes in the operating speed of the machines originate variations in
power demand, since the active and reactive powers, required by electrical loads vary
dynamically with system frequency. Nevertheless, there is clearly and strongly the tendency
of the synchronous machine speed G2 to stabilize, as shown in Figure 14(a) in the period
after contingency, thus indicating the influence of the IPP generation penetration in the
transient stability of its own machines.
As for the speed regulator, Figure 14(b) convincingly portrays the attempt of that regulator
to meet the new situation imposed on the system.
(a) (b)
Fig. 14. Response of the mechanical variables of the generator G3 (a): Operating frequency; (b) Action of the speed governor
In the moment immediately after the opening of the interconnection breaker, the machine is
subjected to an immediate rejection of load. Thus, the operating speed rises gently to 189.63
rad/s (f = 60.4 Hz). However, at this moment the lower inertia machine G1 is taken out of
the system, in order to restore the load-generation balance. It is worth mentioning the
www.intechopen.com
Mechanical Engineering
394
performance of the machine G2 speed regulator in Figure 14(b) to reduce the steam
consumption to ensure the G2 synchronous speed.
With the withdrawal of G1, a new scenario is presented with respect to the power flow in
the system. The machine G2 becomes responsible for all the electrical loads at the IPP. Thus,
according to equation (5), the balancing equation, the electrical power becomes greater than
the mechanical power, which leads to deceleration of the generator, taking the angular
speed to = 184.45 rad/s (f = 58.71 Hz). At this moment, the speed governor acts to
increase the steam consumption to restore the load-generation balance. However, the
frequency of operation of the machine oscillates in a damped transient between f1 = 59.6 Hz
( = 187.15 rad/s) and f2 = 59.33 Hz ( = 186.42 rad/s), and tends to stabilize at a
frequency f = 59.4 Hz, i.e., = 186.74 rad/s.
2
m e a2R
2.H.dP P P
.dt
(5)
As for the speed governor, it follows the oscillations observed in the operating speed of the machine G2, tending to stabilize around 1.17 pu, in other words, it is necessary the production by the boilers of 17% more steam, to be supplied to the generators turbine to meet the new request of active power, as can be observed in Figure 14(b).
The moment immediately after the withdrawal of the machine G1, the remaining generator G2 reaches the frequency f = 58.71 Hz. That is classified as extreme in Table 2, burdening sharply the impeller blades of this generating set. However, during the damped transient period, G2 oscillates within the tolerable region of Table 2. The observation of such limits ensures the life time of the equipment, thus reducing the mechanical wear of turbine blades and reduces the number of stoppages for maintenance of this generating set.
In order to get a better response in operation for the IPP electrical system after the opening
of the interconnection circuit breaker, it is possible the insertion of a flywheel in the axis of
G2, in order to rise the generating set equivalent inertia.
However, it is necessary to reject the generating unit G1 inside the 100 ms after the application of contingency.
4.2 Application of a flywheel
The flywheel is a mechanical device with significant moment of inertia used for storing
rotational energy. Has high resistance to variations in speed, which helps to ensure a small
variation in rotation speed of the shaft (Kundur, 1994).
The energy is stored in the rotor as kinetic energy, or more specifically, rotational energy:
2k
1E .I.
2 (6)
where: is the angular speed, and
I is the mass moment of inertia about the center of rotation.
www.intechopen.com
Steam Turbines Under Abnormal Frequency Conditions in Distributed Generation Systems
395
An increase in angular speed greatly increases the energy stored in the flywheel, and the energy density of the KESS – Kinetic Energy Storage System. However, the no-load losses, viscous friction with air and by contact and friction in mechanical bearings, will be higher, hurting the efficiency of the system. In addition, the rotating parts of the system must support high mechanical stresses due to high speed at which they are submitted. These limitations found in KESS can now be properly solved because:
the development of new materials such as fiberglass and carbon;
the use of vacuum systems, which reduce the losses by viscous friction with the air;
the use of magnetic bearings that eliminate friction by contact;
the advancement of power electronics, which improved signal conditioning;
the evolution of microelectronics, that allowed more sophisticated and less expensive control systems.
These factors enable the development and implementation of a new generation of KESSs, with superior performance, whose speed can reach tens of thousands of rpm (approximately 60,000 rpm). Thus, increases the number of possibilities for the use of flywheels, since this generation presents high energy density and power.
Among the applications for this equipment, we can mention:
uninterruptible power supply (UPS systems);
provision of extra energy in case of increased demand;
compensation of voltage dips.
The moment of inertia is a measure of resistance to the applied torques in a rotating object, i.e., the higher the moment of inertia, the slower the wheel will spin after applying a certain force on its axis.
It is presented here the main ways to obtain the moment of inertia for a solid cylinder:
21I .m.r
2 (7)
However, for an empty cylinder with thin walls, one must employ the equation (8) detailed below:
2I m.r (8)
However, in the case of an empty cylinder with thick walls, one should use the equation 9 below:
2 21 2
1I .m.(r r )
2 (9)
Where m is the mass and r is the radius of gyration. It is worth to present equation (10) used to obtain the constant of inertia of a generator.
2s
n
1. .I
2HS
(10)
www.intechopen.com
Mechanical Engineering
396
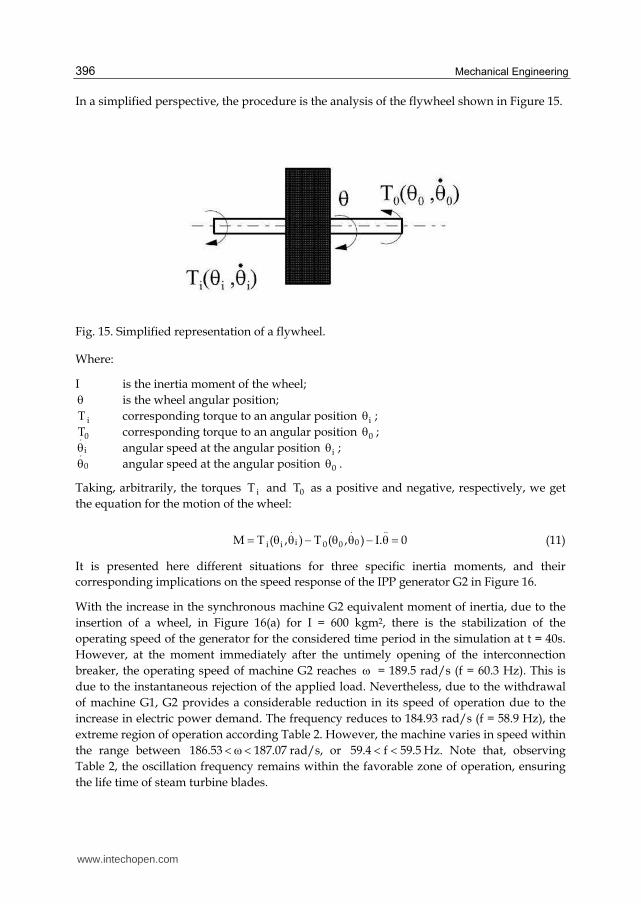
In a simplified perspective, the procedure is the analysis of the flywheel shown in Figure 15.
Fig. 15. Simplified representation of a flywheel.
Where:
I is the inertia moment of the wheel;
is the wheel angular position;
iT corresponding torque to an angular position i ;
0T corresponding torque to an angular position 0 ; .
i angular speed at the angular position i ; .
0 angular speed at the angular position 0 .
Taking, arbitrarily, the torques iT and 0T as a positive and negative, respectively, we get
the equation for the motion of the wheel:
. . ..
i 0i i 0 0M T ( , ) T ( , ) I. 0 (11)
It is presented here different situations for three specific inertia moments, and their
corresponding implications on the speed response of the IPP generator G2 in Figure 16.
With the increase in the synchronous machine G2 equivalent moment of inertia, due to the
insertion of a wheel, in Figure 16(a) for I = 600 kgm2, there is the stabilization of the
operating speed of the generator for the considered time period in the simulation at t = 40s.
However, at the moment immediately after the untimely opening of the interconnection
breaker, the operating speed of machine G2 reaches = 189.5 rad/s (f = 60.3 Hz). This is
due to the instantaneous rejection of the applied load. Nevertheless, due to the withdrawal
of machine G1, G2 provides a considerable reduction in its speed of operation due to the
increase in electric power demand. The frequency reduces to 184.93 rad/s (f = 58.9 Hz), the
extreme region of operation according Table 2. However, the machine varies in speed within
the range between 186.53 187.07 rad/s, or 59.4 f 59.5 Hz. Note that, observing
Table 2, the oscillation frequency remains within the favorable zone of operation, ensuring
the life time of steam turbine blades.
www.intechopen.com
Steam Turbines Under Abnormal Frequency Conditions in Distributed Generation Systems
397
(a)
(b)
(c)
Fig. 16. Frequency response of machine G2 for different inertia moments (a): I = 600 kgm2;
(b): I = 700 kgm2; (c): I = 800 kgm2
www.intechopen.com
Mechanical Engineering
398
Figure 16(b) shows the response to an equivalent moment of inertia I = 700 kgm2. The
system has more damping, reducing the time required to reach a new steady state speed at
= 186.77 rad/s (f = 59.5 Hz). Therefore, according Table 2, the industrial frequency falls in
the tolerable operating zone, contributing not only to maintain the transient stability of the
system, but also ensures the integrity of the steam turbine blades, as well as presenting a
significant contribution in terms of the quality of electric power. As for the oscillations of
frequency in the transient period, it is verified a maximum speed of = 189.4 rad/s (f =
60.3 Hz), at the moment immediately after the contingency. Nevertheless, with the removal
from operation of G1, machine G2 reaches a minimum speed of = 185.28 rad/s (f = 59.0
Hz) at the extreme operation zone.
However, the machine G2 varies in speed within the range between
186.61 187.01 rad/s or 59.4 f 59.5 Hz. It can be noticed that the frequency
oscillation, according Table 2, remains in the favorable zone of operation, ensuring the
expected life time for blades of the steam turbine.
With the main objective to reduce the oscillations, evident in the speed of operation, of the
remaining synchronous generator (G2) it was applied an equivalent moment of inertia I =
800 kgm2, the result can be seen in Figure 16(c). There, the damping obtained allows
reaching the new steady state more efficiently. This helps to mitigate the harmful effects
to the quality of electric power to ensure better response of electrical parameters of the
system.
With regard to changes in speed, the maximum reaches the magnitude =189.3 rad/s (f
= 60.3 Hz) at the tolerable zone of operation, but the minimum is settled at = 185.55
rad/s (f = 59.06 Hz) at the extreme operation zone. Thus, one can conclude here and for
the other equivalent inertia moments simulated that, at the instant immediately after the
removal of generator G1, the synchronous machine G2 presents a significant reduction in
its operating speed. In this way, it is generated a sub-frequency costly to the physical and
mechanical integrity of the turbine blades, since the obtained frequency, at this instant,
fits the extreme region of operation at Table 2. However, oscillations in the transient
period do not affect the impeller blades, as they pass inside the tolerable zone.
Nevertheless, after the damped transient period, the machine reaches the new steady-state
and stabilizes at a speed = 186.77 rad/s (f = 59.5 Hz), similar to that obtained for the
case illustrated in Figure 16(b).
5. Conclusion
Through the discussions presented along this chapter, there is the need to make the correct
and effective study of the synchronous machine speed governors, in order to obtain better
dynamic response of the system. However, this goal is achieved from te transfer function of
these governors, so it is essential to be aware of the topology of the turbine used, i.e.,
whether or not this is reheating . It shows that before the model transfer function, yet it is
necessary to choose an appropriate software to implement the model. In this way, it can be
seen that ATP, through TACS subroutines allows the correct and efficient computational
modeling of both the speed governor and voltage regulator.
www.intechopen.com
Steam Turbines Under Abnormal Frequency Conditions in Distributed Generation Systems
399
The answers regarding the performance of the speed governor, for the transfer function
shown here, respond faithfully and reliably to dynamical requests imposed to the electrical
system under analysis.
Due to untimely performance by interconnection break, the IPP machines face an immediate
rejection of load, which burdens the system frequency, thereby compromising the integrity
of turbine blades. However, it appears that even without the application of mitigation
measures the system tends to stabilize. Nevertheless, the responses refer to a system such
that the penetration of IPP does not take place significantly. The literature shows that higher
levels of active power exported by the IPP mean larger damage to the turbines due to higher
frequency oscillations. Thus, the use of the flywheel is shown as an effective alternative,
since it damps transient oscillations, thys contributing to ensuring the life time of the
impeller blades.
In short, it is extremely important the correct modeling and use of speed governors in
studies relevant to the dynamic stability of power system analysis in terms of commitment
to the life time of the blades of steam turbines.
6. References
Moura, F. A. M. ; Camacho, J. R. ; Chaves, M. L. R. & Guimarães, G. C. “The Dynamic
Interaction of Independent Power Producer Synchronous Machines Connected to a
Distribution Network in ATP-EMTP”, ICEM2010 – XIX International Conference on
Electrical Machines, Rome, Italy, September 2010.
Moura, F. A. M. ; Camacho, J. R. ; Chaves, M. L. R. & Guimarães, G. C. “Independent Power
Producer Parallel Operation Modeling in Transient Network Simulations for
Interconnected Distributed Generation Studies”, Electric Power Systems Research,
Elsevier, Article in Press, (2009),doi:10.1016/j.epsr.2009.08.016.
Anderson , P. M. & Fouad , A. A. Power System Control and Stability, vol. I. Iowa, 1977.
Kundur, P. Power Systems Stability and Control, McGraw-Hill, EPRI Power Systems
Engineering Series, New York, 1994.
IEEE Standard for Interconnecting Distributed Resources with Electric Power Systems, IEEE
Std. 1547, New York, USA, 2003.
LIPA-Long Island Power Authority, Control and Protection Requirements for Independent Power
Producers, Transmission Interconnections, found at the internet in 22/11/2007, at
http://tinyurl.com/33clq4.
Saldaña, C. ; Calzolari, G. & Cerecetto, G. "ATP modeling and field tests of the ac voltage
regulator in the Palmar hydroelectric power plant", Electric Power Systems Research,
Elsevier, 76 (2006), pp.681-687.
Freitas, W. ; França, A. M.; Vieira Jr., J. C. M. & Silva, L. C. P. "Comparative Analysis Between
Synchronous and Squirrel Cage Induction Generators for Distributed Generation
Applications”. IEEE Trans. Power Systems, vol. 21,NO.1, FEBRUARY 2006.
Guimarães, G. C. Computer Methods for Transient Stability Analysis of Isolated Power Generation
Systems with Special Reference to Prime Mover and Induction Motor Modelling, PhD
Thesis, University of Aberdeen, 1990.
www.intechopen.com
Mechanical Engineering
400
Dugan, R. C. ; McGranaghan, M. F. ; Santese, S. & Beaty, H. W. Electrical Power Systems
Quality, McGraw-Hill, New York, 2002.
www.intechopen.com
Mechanical EngineeringEdited by Dr. Murat Gokcek
ISBN 978-953-51-0505-3Hard cover, 670 pagesPublisher InTechPublished online 11, April, 2012Published in print edition April, 2012
InTech ChinaUnit 405, Office Block, Hotel Equatorial Shanghai No.65, Yan An Road (West), Shanghai, 200040, China
Phone: +86-21-62489820 Fax: +86-21-62489821
The book substantially offers the latest progresses about the important topics of the "Mechanical Engineering"to readers. It includes twenty-eight excellent studies prepared using state-of-art methodologies by professionalresearchers from different countries. The sections in the book comprise of the following titles: powertransmission system, manufacturing processes and system analysis, thermo-fluid systems, simulations andcomputer applications, and new approaches in mechanical engineering education and organization systems.
How to referenceIn order to correctly reference this scholarly work, feel free to copy and paste the following:
Fabrício A. M. Moura, José R. Camacho, Geraldo C. Guimarães and Marcelo L. R. Chaves (2012). SteamTurbines Under Abnormal Frequency Conditions in Distributed Generation Systems, Mechanical Engineering,Dr. Murat Gokcek (Ed.), ISBN: 978-953-51-0505-3, InTech, Available from:http://www.intechopen.com/books/mechanical-engineering/steam-turbines-under-abnormal-frequency-conditions-in-distributed-generation-systems