33
Oregon Department of Transportation STEEL SLAG IN HOT MIX ASPHALT CONCRETE Final Report State Research Project #511

Oregon Department of Transportation
STEEL SLAG IN HOT MIX ASPHALT CONCRETE
Final Report
State Research Project #511

STEEL SLAG IN HOT MIX ASPHALT CONCRETE
Final Report
State Research Project #511
by
Liz Hunt, P.E.Research Coordinator
and
Glenn E. BoyleBituminous Mix Design Supervisor, Retired
Research GroupOregon Department of Transportation
Salem, Oregon 97301-5192
April 2000


Technical Report Documentation Page 1. Report No.
OR-RD-00-09
2. Government Accession No. 3. Recipient's Catalog No.
5. Report Date
April 2000
4. Title and Subtitle
Steel Slag in Hot Mix Asphalt Concrete Final Report 6. Performing Organization Code
7. Author(s)
Liz Hunt, P.E. Glenn Boyle
8. Performing Organization Report No.
10. Work Unit No. (TRAIS)9. Performing Organization Name and Address
Oregon Department of Transportation Research Group 200 Hawthorne SE, Suite B-240 Salem, OR 97301-5192
11. Contract or Grant No.
State #511
13. Type of Report and Period Covered
Final October 1994 to April 1999
12. Sponsoring Agency Name and Address
Oregon Department of Transportation Research Group 200 Hawthorne SE, Suite B-240 Salem, OR 97301-5192
14. Sponsoring Agency Code
15. Supplementary Notes
16. Abstract
In September 1994, steel slag test and control sections were constructed in Oregon to evaluate the use of steel slag in hot mix asphalt concrete (HMAC). his report covers the construction and five-year performance of a pavement constructed with 30% steel slag.
Asphalt concrete can be produced and the pavement constructed readily in Oregon when crushed steel slag is used as a portion of the aggregate. If the unit cost of steel slag modified mixes is the same as conventional dense graded mixes, overall project costs may increase because of the decrease in coverage by the heavier steel slag mix. or the test section HMAC constructed with 30% steel slag, the coverage was 15% less than a conventional “B” mix. ased resistance to rutting and improved skid resistance was not measured during the five years the pavements have been monitored. The differences between the two sections may not be measurable because only 30% steel slag was used in the test mix and the slag was finer than the conventional ½ - ¼" (12.7 to 6.3 mm) material it replaced. control and test sections are performing satisfactorily.
17. Key Words
STEEL SLAG, ASPHALT PAVEMENTS
18. Distribution Statement
Available through the Oregon Department of Transportation, Research Group.
19. Security Classif. (of this report)
Unclassified
20. Security Classif. (of this page)
Unclassified
21. No. of Pages 22. Price
T
FReported incre
To date, both the
Form DOT F 1700.7 (8-72) Reproduction of completed page authorized
i
ii
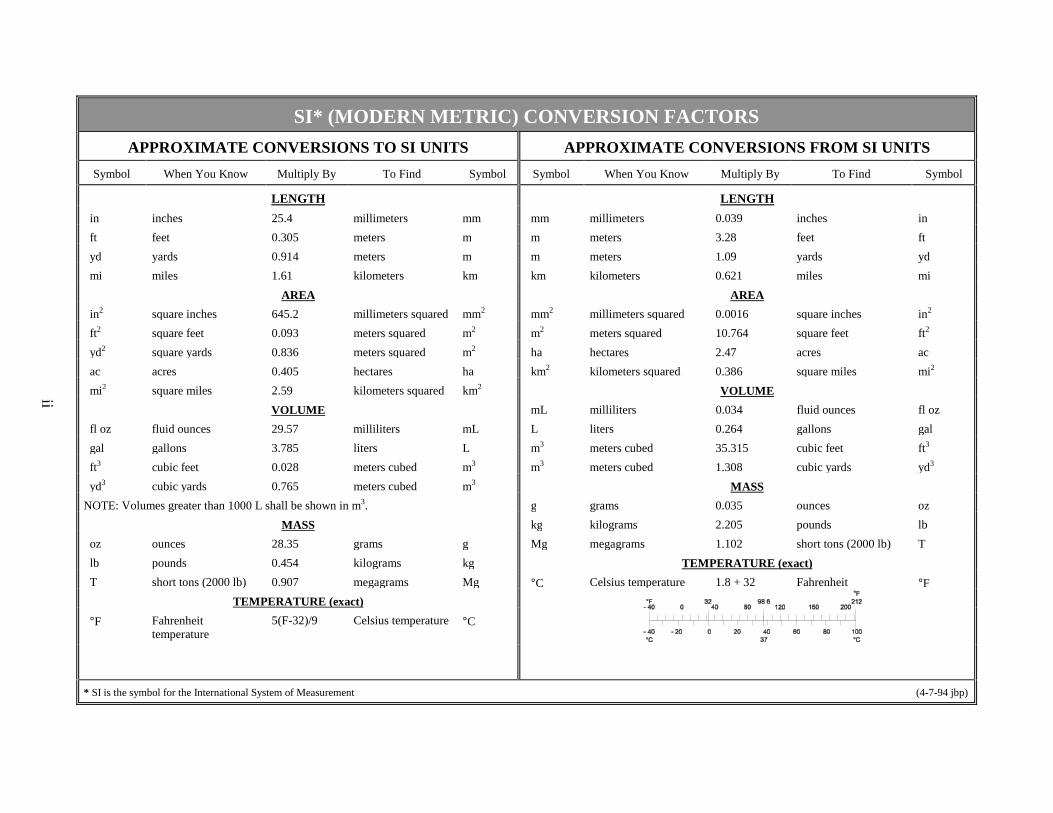
SI* (MODERN METRIC) CONVERSION FACTORS APPROXIMATE CONVERSIONS TO SI UNITS APPROXIMATE CONVERSIONS FROM SI UNITS
Symbol When You Know Multiply By To Find Symbol Symbol When You Know Multiply By To Find Symbol
LENGTH LENGTH in inches 25.4 millimeters mm mm millimeters 0.039 inches in ft feet 0.305 meters m m meters 3.28 feet ft yd yards 0.914 meters m m meters 1.09 yards yd mi miles 1.61 kilometers km km kilometers 0.621 miles mi
AREA AREA in2 square inches 645.2 millimeters squared mm2 mm2 millimeters squared 0.0016 square inches in2
ft2 square feet 0.093 meters squared m2 m2 meters squared 10.764 square feet ft2
yd2 square yards 0.836 meters squared m2 ha hectares 2.47 acres ac ac acres 0.405 hectares ha km2 kilometers squared 0.386 square miles mi2
mi2 square miles 2.59 kilometers squared km2 VOLUME VOLUME mL milliliters 0.034 fluid ounces fl oz
fl oz fluid ounces 29.57 milliliters mL L liters 0.264 gallons gal gal gallons 3.785 liters L m3 meters cubed 35.315 cubic feet ft3
ft3 cubic feet 0.028 meters cubed m3 m3 meters cubed 1.308 cubic yards yd3
yd3 cubic yards 0.765 meters cubed m3 MASS NOTE: Volumes greater than 1000 L shall be shown in m3 . g grams 0.035 ounces oz
MASS kg kilograms 2.205 pounds lb oz ounces 28.35 grams g Mg megagrams 1.102 short tons (2000 lb) T lb pounds 0.454 kilograms kg TEMPERATURE (exact) T short tons (2000 lb) 0.907 megagrams Mg °C Celsius temperature 1.8 + 32 Fahrenheit °F
TEMPERATURE (exact) °F Fahrenheit
temperature 5(F-32)/9 Celsius temperature °C
* SI is the symbol for the International System of Measurement (4-7-94 jbp)
ACKNOWLEDGEMENTS
The authors would like to thank International Mix Services, Inc., Tim Hart, George Post and Wayne Chett for their help and cooperation with the aggregate production. We also thank Morse Bros. Inc., their A.C. plant and paving crews at the Deer Island plant site. In addition, we thank ODOT personnel including Art Louie, Earl Mershon, Gene Lilly and Tony Rodriguez. Last, special thanks to Eric Brooks for assisting with the field surveys.
DISCLAIMER
This document is disseminated under the sponsorship of the Oregon Department of Transportation in the interest of information exchange. The State of Oregon assumes no liability of its contents or use thereof.
The contents of this report reflect the views of the authors, who are solely responsible for the facts and accuracy of the material presented. The contents do not necessarily reflect the official views of the Oregon Department of Transportation.
This report does not constitute a standard, specification, or regulation.
iii

STEEL SLAG IN HOT MIX ASPHALT CONCRETE Final Report
TABLE OF CONTENTS
1.0 INTRODUCTION................................................................................................................. 1
1.1 OBJECTIVES.......................................................................................................................... 11.2 BACKGROUND AND SIGNIFICANCE OF WORK....................................................................... 11.3 BENEFITS.............................................................................................................................. 2
2.0 LOCATION AND DESIGN ................................................................................................. 3
2.1 LOCATION ............................................................................................................................ 32.2 DESIGN................................................................................................................................. 4
3.0 MATERIALS......................................................................................................................... 5
3.1 NATURAL AGGREGATE ........................................................................................................ 53.2 STEEL SLAG ......................................................................................................................... 5
3.2.1 Production................................................................................................................... 53.2.2 Sampling and Testing.................................................................................................. 5
3.3 TEST RESULTS...................................................................................................................... 6
4.0 MIX DESIGNS ...................................................................................................................... 7
5.0 CONSTRUCTION ................................................................................................................ 9
5.1 MIXING ................................................................................................................................ 9 5.2 PLACEMENT AND COMPACTION ........................................................................................... 95.3 FIELD MIX PROPERTIES...................................................................................................... 10
6.0 POST CONSTRUCTION EVALUATION....................................................................... 11
6.1 LABORATORY TESTING ...................................................................................................... 116.2 FIELD INSPECTIONS ............................................................................................................ 116.3 SKID TESTING..................................................................................................................... 126.4 RIDE TESTING .................................................................................................................... 126.5 PERFORMANCE SUMMARY ................................................................................................. 13
7.0 CONCLUSIONS ................................................................................................................. 15
8.0 RECOMMENDATIONS.................................................................................................... 17
9.0 REFERENCES.................................................................................................................... 19
APPENDIX
v
LIST OF TABLES
Table 3.1: ½" to ¼" Aggregate Gradations .................................................................................... 6Table 3.2: Aggregate Test Results (½" to ¼" (12.7 mm to 6.3 mm) material) .............................. 6Table 4.1: Mix Design Criteria and Design Mix Characteristics at Design Binder Contents........ 7Table 5.1: Construction Temperatures ......................................................................................... 10Table 5.2: Mix Design Criteria, Construction Cold Feed Gradation (wet sieve), and Binder
Contents....................................................................................................................... 10Table 6.1: Void Contents as Determined from Cores .................................................................. 11Table 6.2: Distress Survey Results............................................................................................... 12Table 6.3: Average Skid Testing Results ..................................................................................... 12Table 6.4: Pavement Ride Test Results........................................................................................ 12
LIST OF FIGURES
Figure 2.1: Vicinity Map................................................................................................................ 3Figure 2.2: Typical Cross Section .................................................................................................. 4
vi

1.0 INTRODUCTION
In September 1994, steel slag test and control sections were constructed in Oregon to evaluate the use of steel slag in hot mix asphalt concrete (HMAC). Steel slag, a by-product of the steel-making process, is readily available in the Portland Metropolitan area. If unused, the slag material could end up in landfills, costing Oregon taxpayers money as disposal facilities reach capacity and new landfills are required. One way to utilize the steel slag is to incorporate it into HMAC. This process has been used successfully in the midwest and eastern United States with reported improved pavement performance (Ramirez 1992). Prior to this study, Oregon had no experience in handling, testing, or constructing steel slag pavements.
1.1 OBJECTIVES
The primary objective of this study is to evaluate the use of steel slag in HMAC. All aspects of using this material in a pavement will be evaluated, including:
1) Steel slag sampling methods and laboratory tests, 2) Asphalt concrete mix design and testing, 3) Constructability, and 4) Performance characteristics.
Other objectives include determining appropriate revisions to ODOT specifications and mix design procedures for the addition of steel slag.
1.2 BACKGROUND AND SIGNIFICANCE OF WORK
Steel slag has been used to construct pavements for nearly one hundred years. Since it was discovered that the residue from the manufacture of steel could be crushed and processed into a product that looked like crushed rock, other testing was performed to determine the usefulness of this “waste” product.
It was discovered that the highly angular, rough textured, vesicular, pitted surfaces provide the particle interlock, and if properly compacted, the high stability required for good serviceable pavements. The slag is usually added as part of the coarse aggregate fraction of the mixture at a percentage of 20% to 100%, depending on the application of the mixture.
States in the midwest and the eastern United States have extensive experience with the addition of steel slag to HMAC. Their experiences indicate that the addition of steel slag may enhance the performance characteristics of the pavement. Since the slag is rough, the material improves the skid resistance of the pavement. Also, because of the high specific gravity and angular, interlocking features of the crushed steel slag, the resulting HMAC is more stable and resistant to rutting (Ramirez 1992, Noureldin and McDaniel 1990, Lemass 1992).
1

Currently there are two steel mills producing steel slag in Oregon, both in the Portland area: Cascade and Oregon Steel. Cascade currently produces about 60,000 to 70,000 tons/year (54,000 to 63,000 Mg/year) of steel slag. Oregon Steel produces about 100,000 tons/year (90,000 Mg), and currently has about 300,000 tons (270,000 Mg) on hand. This slag would normally be placed in a landfill if it was not crushed and used for construction material.
1.3 BENEFITS
Steel slag may be an appropriate addition to asphalt concrete. The current ODOT specifications do not exclude the use of steel slag, however, ODOT has no experience in the use of steel slag in asphalt concrete. The overall benefit of the research will be an understanding of the properties of steel slag HMAC and the applicability to future projects. ODOT may also realize improved pavement performance in terms of reduced rutting and improved skid resistance.
Typical aggregate used for HMAC in the Portland area includes crushed gravel. Pavements with the crushed gravel are typically not as stable as mixes without gravel and are often susceptible to rutting. The addition of steel slag may provide a viable alternative to the crushed gravel, as it reportedly increases the stability of the mix materials, thus reducing the rutting potential.
If steel slag used as an aggregate is determined to be an appropriate addition with benefits to asphalt concrete, then additional HMAC pavements may be constructed with steel slag. The agency may also encourage the use of steel slag in some pavements by providing incentives.
Other benefits of using steel slag in asphalt concrete include the recycling of a waste product, thus reducing the volume of material placed in Oregon landfills.
2

2.0 LOCATION AND DESIGN
2.1 LOCATION
This project is located about 55 miles (88 km) northwest of Portland on U.S. Highway 30, (Lower Columbia River Highway). The project included a two-lane highway with some left turn lanes as well as truck climbing lanes, and was classified as a preservation overlay with leveling. The vicinity map (Figure 2.1) indicates the total length of the project as well as the asphalt concrete overlay sections.
The steel slag test section is located between M.P. 57.1 and 57.2 in the westbound travel lane. The control section is located between M.P. 58.3 and 58.4, also in the westbound travel lane.
The average elevation for the project is about 100 feet (30 m). The climatic conditions for the area are moderate with average temperatures of 43 °F (6 °C) in January and 63 °F (17 °C) in July. The average annual rainfall is about 44 inches (1120 mm) (NOAA 1992).
Figure 2.1: Vicinity Map
3

2.2 DESIGN
The typical cross section shown in Figure 2.2 represents the pavements that were overlayed for the control and test sections. The general condition of the existing pavement was fair to poor with transverse cracks. The worst areas were pre-leveled to provide extra thickness and fill wheel track depressions. The overlay included a 2-inch (50 mm) nominal thickness standard duty class “B” asphalt concrete mix placed with a center line crown of 0.02 ft/ft slope.
Figure 2.2: Typical Cross Section
4
3.0 MATERIALS
3.1 NATURAL AGGREGATE
Natural aggregate used for the project was obtained from Deer Island. The rock is a gravel obtained from the Columbia River. The gradation of the ½- to ¼-inch (12.7 mm to 6.3 mm) material used in the mix design is discussed in Section 3.2 and presented in Table 3.1. A comparison of test results between the Deer Island source and the steel slag aggregate is contained in Section 3.3 and Table 3.2.
3.2 STEEL SLAG
3.2.1 Production
Steel-furnace slag is a synthetic aggregate produced as a by-product of the electric arc steel making furnace. The molten slag flows from the furnace into a pit area where it solidifies. The slag consists principally of a fused mixture of oxides of calcium, silica, iron, alumina and magnesia.
The large pieces of slag (3 ft to 4 ft (0.9 m to 1.2 m) across and 1 ft (0.3 m) thick) are crushed to about 8 inches (200 mm) in diameter, by dropping a large steel ball or a solid steel cylinder about 15 ft (4.6 m), using a magnetic crane. The pieces are then dumped onto a screen deck grizzly by a front-end loader. The finer material goes through the screen deck and on to other screen deck gradation units. Larger pieces that remain on the primary grizzly are routed into an impact crusher then back to gradation screen decks. Any material still too large for the screen deck sizes is rerouted back into the impact crusher to be crushed again prior to once more going through the gradation screens. At the first and second screen decks, the conveyer belts are equipped with magnetic pickups to remove any metallic pieces that may be in the slag (Boyle 1994).
After the steel slag has been crushed and graded into the sizes desired it is stockpiled for delivery. The surface texture of the slag was observed to be quite variable, from very dense and solid like basalt, to vesicular like volcanic cinders.
3.2.2 Sampling and Testing
A sample of slag was obtained by passing a five-gallon (20-liter) bucket through the flow of material at the end of the final belt on top of the stockpile. The material was used to determine the gradation, abrasion resistance, and bulk densities. Additional samples of the crushed and graded steel slag were delivered to the ODOT laboratory for a mix design.
Aggregate quality testing was performed on the samples. The test results are shown in Tables 3.1 and 3.2. Chemical analyses tests had been performed earlier; these results may be found in the Appendix.
5

Table 3.1: 1/2" to 1/4" Aggregate Gradations
Sieve Size (Dry Analysis) Deer Island (Percent Passing)
Steel Slag (Percent Passing)
3/4" (19.1 mm) 100 100 1/2" (12.7 mm) 98 100 3/8" (9.5 mm) 55 94 1/4" (6.3 mm) 2 49 #4 4.75 mm) 1 20
#10 (2.0 mm) 1 3 #40 (425 µm) 1 .9 #200 (75 µm) 0.5 0.9
(
1
Table 3.2: Aggregate Test Results (1/2" to 1/4" (12.7 mm to 6.3 mm) material) (ODOT 1991)
Test Name Number Specification Deer Island (Natural) Aggregate
Steel Slag Aggregate
Coarse Bulk Gravity: Bulk AASHTO-T-85 2.69 3.63 Saturated Surface Dry (SSD) " 2.74 3.68
Apparent " 2.81 3.82 Absorption " 1.54% 1.35%
LAR Abrasion (Grading C) AASHTO-T-96 30% max. 16.3% Loss 24.2% Loss
Oregon Air Degradation OSHD-TM208 Pass #20 ≤ 30% Sed. Ht. ≤ 3.0”
Pass #20 = 11.4% Sed. Ht. = 0.3"
Pass #20 = 6.7% Sed. Ht. = 0.2"
Sodium Sulfate OSHD-TM206 12% max. 1.5% Loss 0.6% Loss
3.3 TEST RESULTS
The results of the tests indicate that the gradation of the slag which was substituted for the ½- to ¼-inch (12.7 to 6.3 mm) aggregate is finer than the natural aggregate. Also, the specific gravity of the slag is about 35% more than the natural aggregate.
The LAR abrasion test provides an indication of the relative quality of competence of various sources of aggregate with similar mineral compositions. ODOT uses the LAR abrasion test as an indication of aggregate wear resistance. In this case, comparing the slag results to the aggregate results may not be appropriate, as the materials are different (AASHTO 1990).
The Oregon air degradation test is designed to measure the quantity and quality of material produced by attrition similar to that produced in the roadway under repeated traffic loading and unloading (OSHD 1986).
The sodium sulfate test measures the soundness of aggregates subject to weathering action, by immersing samples in either sodium or magnesium sulfate (OSHD 1986). The test results indicate that both samples should be resistant to weathering, however, the steel slag may be more resistant.
6

4.0 MIX DESIGNS
Both the control “B” mix and the slag-modified mix were fabricated using the standard ODOT mix design procedure (George and Dominick 1993). The California kneading compactor was used to compact the samples and the Hveem stabilometer was used to determine the stability after compaction. The steel slag mix was prepared substituting steel slag for the ½- to ¼-inch (12.7 to 6.3 mm) aggregate. The test mix included 30% steel slag aggregate.
Published literature indicates that steel slag mixes with varying amounts of steel slag aggregate provide high stability, which resist permanent deformation (Ramirez 1992, Noureldin and McDaniel 1990). During our study, however, we found little difference between the control “B” mix and the slag mix design test results, as shown in Table 4.1. The Hveem stabilities were nearly the same, as were the compacted percent voids and VMA for both mixes. In addition, the design required asphalt contents were within 0.2%.
Table 4.1: Mix Design Criteria and Design Mix Characteristics at Design Binder Contents
Characteristics Class "B" Mix Design Criteria
"B" Mix w/ Deer Island Aggregate
"B" Mix w/ Steel Slag Aggregate
Gradation (% Passing Screen) 1-inch (25.4 mm) 3/4-inch (19.1 mm) 1/2-inch (12.7 mm) 3/8-inch (9.5 mm) 1/4-inch (6.3 mm) #10 (2.0 mm) #40 (425 µm) #200 (75 µm)
99 - 100a
92 – 100 75 – 91
-50 – 70 21 – 41 6 – 24 2 – 7
100b
96 80 68 53 27 12 5.0
100b
96 80 76 59 24 11 4.6
Binder Content (%) 4 - 8a 4.7 4.9 Binder Film Thickness Sufficient Sufficient Sufficient Sp. Gr. @ 1st Comp. None 2.420c 2.593c
Voids @ 1st Comp. (%) 5.5 - 6.5 4.5 4.7 Stab. @ 1st Comp. (Hveem) ≥37 36 36 Sp. Gr. @ 2nd Comp. None 2.474c 2.650c
Voids @ 2nd Comp. (%) ≥2.5 2.3 2.6 Stab. @ 2nd Comp. (Hveem) ≥37 42 42 Rice Max. Sp. Gr. None 2.533 2.722 Voids in Mineral Aggregate (%) ≥14 14.2 14.7 Index of Ret. Strength (%) ≥75 88 95 Index of Ret. Resilient Modulus (%) ≥70 94 96
a Broadband limits for gradation and binder content. Gradations are percentage of dry ingredient weight. b Mix design sample at design binder content test results in this column. c Based on immersed unit weight of unsealed core (AASHTO T166).
7

The lack of substantial increase in stability may be a function of using only 30% steel slag, with more material passing the 3/8-inch (9.5 mm) sieve than the control mix, resulting in a finer mix gradation. Coarser steel slag aggregate mixes may provide more stability because the larger components would include angular and rough textured particles that would increase the interlocking friction.
The greatest difference between the control and test mix was with the maximum specific gravity. The control mix maximum specific gravity was 2.533 or 158 lb./ft.3 (2533 kg/m3), whereas the steel slag mix specific gravity was 2.722 or 170 lb./ft.3, (2725 kg/m3). The difference in unit weights would be significant when calculating bid quantities for overlay construction.
8
5.0 CONSTRUCTION
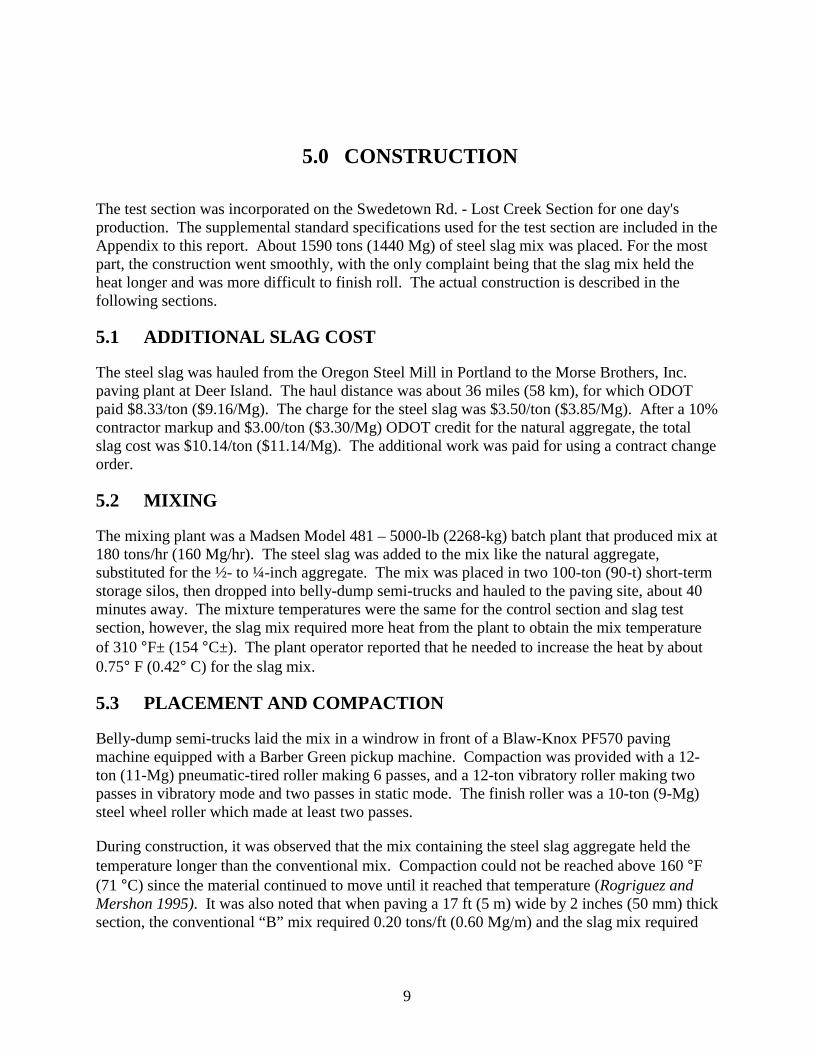
The test section was incorporated on the Swedetown Rd. - Lost Creek Section for one day's production. The supplemental standard specifications used for the test section are included in the Appendix to this report. About 1590 tons (1440 Mg) of steel slag mix was placed. For the most part, the construction went smoothly, with the only complaint being that the slag mix held the heat longer and was more difficult to finish roll. The actual construction is described in the following sections.
5.1 ADDITIONAL SLAG COST
The steel slag was hauled from the Oregon Steel Mill in Portland to the Morse Brothers, Inc. paving plant at Deer Island. The haul distance was about 36 miles (58 km), for which ODOT paid $8.33/ton ($9.16/Mg). The charge for the steel slag was $3.50/ton ($3.85/Mg). After a 10% contractor markup and $3.00/ton ($3.30/Mg) ODOT credit for the natural aggregate, the total slag cost was $10.14/ton ($11.14/Mg). The additional work was paid for using a contract change order.
5.2 MIXING
The mixing plant was a Madsen Model 481 – 5000-lb (2268-kg) batch plant that produced mix at 180 tons/hr (160 Mg/hr). The steel slag was added to the mix like the natural aggregate, substituted for the ½- to ¼-inch aggregate. The mix was placed in two 100-ton (90-t) short-term storage silos, then dropped into belly-dump semi-trucks and hauled to the paving site, about 40 minutes away. The mixture temperatures were the same for the control section and slag test section, however, the slag mix required more heat from the plant to obtain the mix temperature of 310 °F± (154 °C±). The plant operator reported that he needed to increase the heat by about 0.75° F (0.42° C) for the slag mix.
5.3 PLACEMENT AND COMPACTION
Belly-dump semi-trucks laid the mix in a windrow in front of a Blaw-Knox PF570 paving machine equipped with a Barber Green pickup machine. Compaction was provided with a 12-ton (11-Mg) pneumatic-tired roller making 6 passes, and a 12-ton vibratory roller making two passes in vibratory mode and two passes in static mode. The finish roller was a 10-ton (9-Mg) steel wheel roller which made at least two passes.
During construction, it was observed that the mix containing the steel slag aggregate held the temperature longer than the conventional mix. Compaction could not be reached above 160 °F (71 °C) since the material continued to move until it reached that temperature (Rogriguez and Mershon 1995). It was also noted that when paving a 17 ft (5 m) wide by 2 inches (50 mm) thick section, the conventional “B” mix required 0.20 tons/ft (0.60 Mg/m) and the slag mix required
9
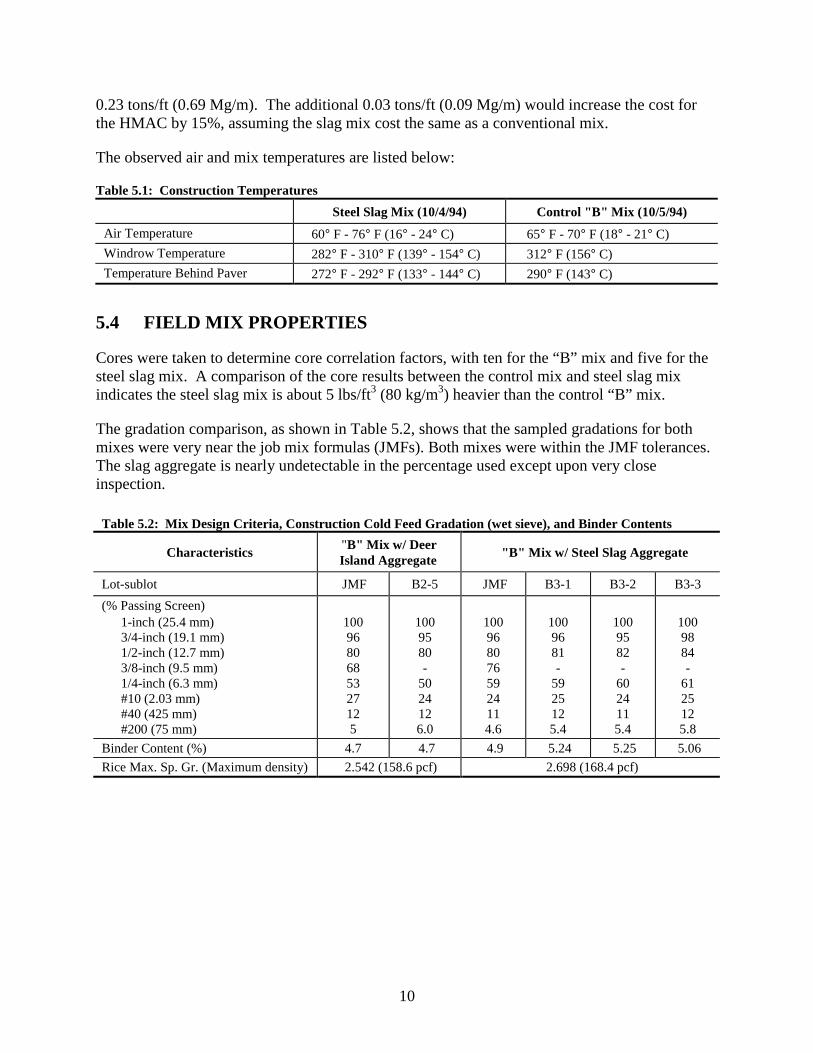
0.23 tons/ft (0.69 Mg/m). The additional 0.03 tons/ft (0.09 Mg/m) would increase the cost for the HMAC by 15%, assuming the slag mix cost the same as a conventional mix.
The observed air and mix temperatures are listed below:
Table 5.1: Construction Temperatures Steel Slag Mix (10/4/94) Control "B" Mix (10/5/94)
Air Temperature 60° F - 76° F (16° - 24° C) 65° F - 70° F (18° - 21° C) Windrow Temperature 282° F - 310° F (139° - 154° C) 312° F (156° C) Temperature Behind Paver 272° F - 292° F (133° - 144° C) 290° F (143° C)
5.4 FIELD MIX PROPERTIES
Cores were taken to determine core correlation factors, with ten for the “B” mix and five for the steel slag mix. A comparison of the core results between the control mix and steel slag mix indicates the steel slag mix is about 5 lbs/ft3 (80 kg/m3) heavier than the control “B” mix.
The gradation comparison, as shown in Table 5.2, shows that the sampled gradations for both mixes were very near the job mix formulas (JMFs). Both mixes were within the JMF tolerances. The slag aggregate is nearly undetectable in the percentage used except upon very close inspection.
Table 5.2: Mix Design Criteria, Construction Cold Feed Gradation (wet sieve), and Binder Contents
Characteristics "B" Mix w/ Deer Island Aggregate "B" Mix w/ Steel Slag Aggregate
Lot-sublot JMF B2-5 JMF B3-1 B3-2 B3-3 (% Passing Screen)
1-inch (25.4 mm) 3/4-inch (19.1 mm) 1/2-inch (12.7 mm) 3/8-inch (9.5 mm) 1/4-inch (6.3 mm) #10 (2.03 mm) #40 (425 mm) #200 (75 mm)
100 96 80 68 53 27 12 5
100 95 80 -
50 24 12 6.0
100 96 80 76 59 24 11 4.6
100 96 81 -
59 25 12 5.4
100 95 82 -
60 24 11 5.4
100 98 84 -
61 25 12 5.8
Binder Content (%) 4.7 4.7 4.9 5.24 5.25 5.06 Rice Max. Sp. Gr. (Maximum density) 2.542 (158.6 pcf) 2.698 (168.4 pcf)
10

6.0 POST CONSTRUCTION EVALUATION
Following construction, an inspection was made, cores were obtained and the project was skid and ride tested to quantify pavement performance. Additional inspections were made with ride and skid data obtained for five years after construction. This chapter provides a summary of the test and control section performance.
6.1 LABORATORY TESTING
Eight 4-inch (100 mm) cores were taken from the control and test sections three months and five years following construction to look for stripping and to determine in-place void contents. No stripping was noted when the cores were split open. The void contents for the cores are included in Table 6.1.
Table 6.1: Void Contents as Determined from Cores Sample Date
Location January 10, 1995 August 30, 1999 MP 58.43 6.5 7.8 4.1 3.5
MP 58.29 10.2 6.9 6.1 6.8
Con
trol
Average 7.9 (8.4%)a 5.1
MP 57.23 10.5 10.6 7.7 7.2 MP 57.10 10.3 10.7 9.3 8.1 Sl
ag
Average 10.5 (10.6%) a 8.1 aAs determined during construction from nuclear density gauge readings compared to calculated maximum densities.
The air voids appear to be decreasing with time, as expected due to traffic impacts.
6.2 FIELD INSPECTIONS
A visual inspection was made at the test and control sections about two months after construction and annually for the following five years. The test section appeared to be a finer gradation than the control section, and it was noted that small pieces of metallic material were embedded in the surface. Metal pieces could be a problem in the mat since they could pick out leaving small holes that could increase pavement wear. The steel slag supplier has indicated that corrective measures have been taken to eliminate pieces of metallic material in future sources.
Some low severity raveling and minor rutting was noted in both the test and control sections during distress surveys from 1995 to 1999. ODOT considers low severity raveling as normal pavement wear. The survey results are shown in Table 6.2.
11
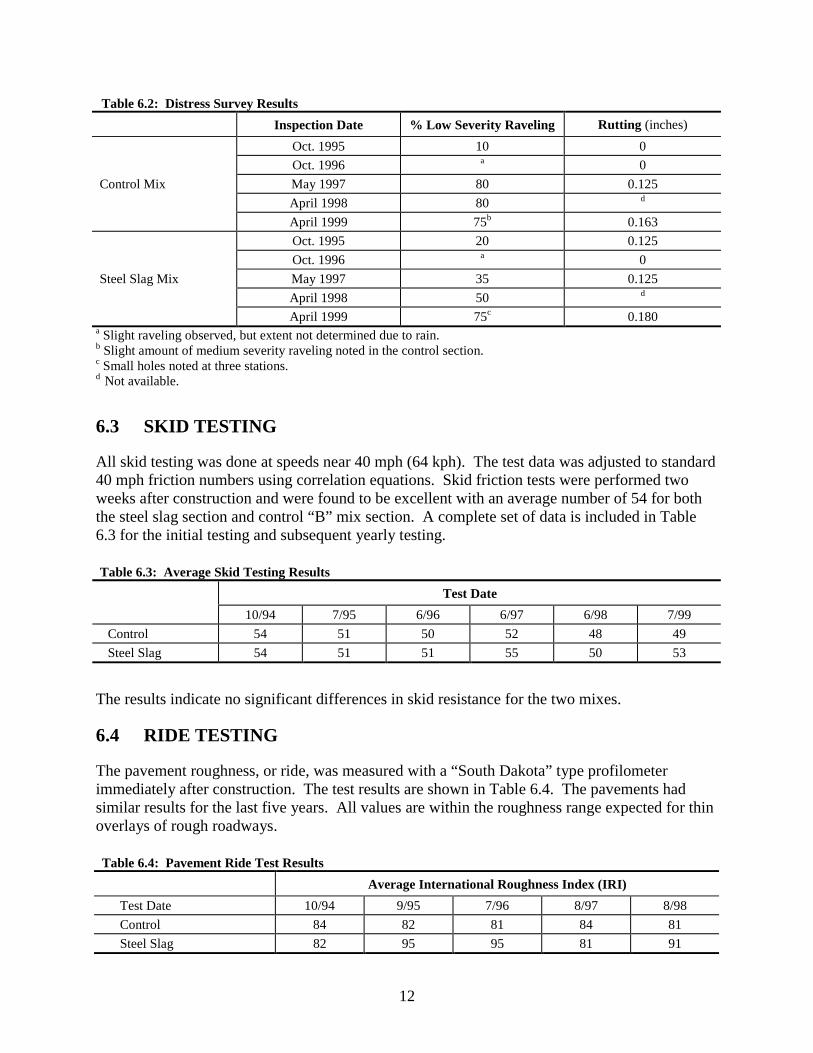
Table 6.2: Distress Survey Results Inspection Date % Low Severity Raveling Rutting (inches)
Oct. 1995 10 0 Oct. 1996 a 0 May 1997 80 0.125 April 1998 80 d
Control Mix
April 1999 75b 0.163 Oct. 1995 20 0.125 Oct. 1996 a 0 May 1997 35 0.125 April 1998 50 d
Steel Slag Mix
April 1999 75c 0.180 a Slight raveling observed, but extent not determined due to rain.b Slight amount of medium severity raveling noted in the control section.c Small holes noted at three stations.d Not available.
6.3 SKID TESTING
All skid testing was done at speeds near 40 mph (64 kph). The test data was adjusted to standard 40 mph friction numbers using correlation equations. Skid friction tests were performed two weeks after construction and were found to be excellent with an average number of 54 for both the steel slag section and control “B” mix section. A complete set of data is included in Table 6.3 for the initial testing and subsequent yearly testing.
Table 6.3: Average Skid Testing Results Test Date
10/94 7/95 6/96 6/97 6/98 7/99 Control 54 1 0 2 8 9 Steel Slag 54 51 51 55 50 53
5 5 5 4 4
The results indicate no significant differences in skid resistance for the two mixes.
6.4 RIDE TESTING
The pavement roughness, or ride, was measured with a “South Dakota” type profilometer immediately after construction. The test results are shown in Table 6.4. The pavements had similar results for the last five years. All values are within the roughness range expected for thin overlays of rough roadways.
Table 6.4: Pavement Ride Test Results Average International Roughness Index (IRI)
Test Date 10/94 9/95 7/96 8/97 8/98 Control 84 2 81 4 81 Steel Slag 82 95 95 81 91
8 8
12

6.5 PERFORMANCE SUMMARY
A comparison of in-place properties, field observations, skid testing and ride testing does not identify any differences in performance between the control and steel slag pavements. Both pavements appear to be performing satisfactorily. Minor raveling was noted in both sections but is not considered critical. The pavement performance will continue to be monitored to identify possible differences.
6.6 COST CONSIDERATIONS
The steel mill representative recently quoted steel slag prices of $3.25/ton ($3.57/Mg) for 1”minus (25.4 mm-minus) material that was not screened. If the material were screened, the cost would go up to $6.00/ton ($6.60/Mg). The slag material costs may be compared to contractor estimated processed aggregate prices of $5.50 to $7.50/ton ($6.05 to $8.25/Mg). For short haul distances, there may be situations where slag is cost effective as a natural aggregate substitute. The reduction in coverage associated with increase in weight, however, may increase the cost to the agency.
13


7.0 CONCLUSIONS
Asphalt concrete can be produced and the pavement constructed readily when crushed steel slag is used as a portion of the aggregate. If the unit cost of steel slag modified mixes is the same as conventional dense graded mixes, overall project costs may increase because of the decrease in coverage by the heavier steel slag mix. For the test section of HMAC constructed with 30% steel slag, the coverage was 15% less than a conventional “B” mix. Reported increased resistance to rutting and improved skid resistance was not measured during the five years the pavements have been monitored. The differences between the two sections may not be measurable because only 30% steel slag was used in the test mix and the slag was finer than the conventional ½- to ¼-inch (12.7 - 6.3 mm) material it replaced. To date, both the control and test sections are performing satisfactorily.
Considerations for future use of steel slag in HMAC:
1) The gradation of the steel slag should be monitored to assure that a uniform mixture of hot mix is produced.
2) Specific gravity of the produced slag aggregate should be monitored. As a rule, as the slag particle size increases, the specific gravity decreases.
3) More energy is needed to heat the slag mix to a given temperature than conventional aggregate, however, the mix holds the heat longer and therefore cools slower.
4) A specification will need to be developed that addresses the use of steel slag as an aggregate.
15


8.0 RECOMMENDATIONS
• No changes to the current asphalt pavement specification are recommended.
• Additional mixes should be evaluated using the Superpave mix design system. Superpave may allow for optimizing the gradation and also better determine the asphalt demand. It is also recommended that the slag be crushed to meet a specific designated size gradation, such as ¾" - ½", ½" - ¼", or ¾" - ¼" (19 - 12.7 mm, 12.7 - 6.3 mm, 19 - 6.3 mm) and/or replace the entire portion of coarse aggregate with crushed slag.
• It is recommended that two or three more test sections be constructed with aggregates that generally produce mixtures with marginal stability, to determine if the slag blend would in fact improve this condition.
• The economics for future use, as a supplement for potential increases in stability should be evaluated on an as needed basis. Considerations such as increased aggregate weights, increased mixing temperatures and reduced HMAC coverage may make steel slag cost prohibitive.
17


9.0 REFERENCES
American Association of State Highway and Transportation Officials, Standard Specifications for Transportation Materials and Methods of Sampling and Testing (Washington, D.C.: American Association of State Highway and Transportation Officials, 1990).
Boyle, Glenn, Oregon Department of Transportation, Site visit memo, July 5, 1994.
George, Anthony J. and Dick Dominick, Oregon Department of Transportation Asphalt Concrete Mix Design Guidelines (Salem, Oregon: Oregon Department of Transportation, February 1993).
Lemass, Brett, Slag Solutions for Heavy Duty Road Pavements, Proceedings 16th ARRB Conference, Part 2, 1992.
NOAA, Climatography of the United States No. 81, Monthly Station Normals of Temperature, Precipitation, and Heating and Cooling Degree Days 1961-1990, Oregon, January, 1992.
Noureldin, A. Sam, and McDaniel, Rebecca S., Evaluation of Surfaces Mixtures of Steel Slag and Asphalt. Transportation Research Record 1296, 1990.
Oregon Department of Transportation, Standard Specifications for Highway Construction, 1991.
Oregon State Highway Division, Materials Section, Laboratory Manual of Test Procedures, Manual No. 26, 1986).
Oregon State Highway Division, Manual of Field Test Procedures, 1990 Edition with revisions through January 1992 (Salem, Oregon: Oregon Department of Transportation, January 1992).
Ramirez, T.L., Steel Slag Aggregates in Bituminous Mixtures, Final Report, March 1992.
Rodriguez, Tony and Mershon, Earl, Oregon Department of Transportation, Construction Project Narrative, August 24, 1995.
19

APPENDIX
Chemical Analysis Supplemental Standard Specifications


A-1

CLASS B STEEL SLAG ASPHALT CONCRETE PAVEMENT
Asphalt concrete for the Class B steel slag asphalt concrete pavement shall be constructed in accordance with Section 00745 of the Standard Specification supplemented and/or modified as follows:
00745.00 Scope - Add the following:
Standard Duty Class "B" steel slag asphalt concrete shall be used for construction of the pavement between M.P. 21.2 to M.P. 22.0 on the Lower Columbia River Highway. Paving shall include production of 2000 tons placed, as a minimum, on one outside travel lane. The Standard Duty Class "B" steel slag asphalt concrete shall include no more than 50% steel slag aggregate, crushed and sized to ½" - ¼" standard grading.
00745.02 Definitions - Add the following:
Steel Slag Asphalt Concrete - ODOT Class "B" asphalt concrete modified by substitution of steel slag aggregate for a portion of the crushed "natural" coarse aggregate specified.
Steel Slag Aggregates - Steel-furnace slag is a synthetic aggregate produced as a by-product of the electric arc steel making furnace. The molten slag flows from the furnace into a pit area where it solidifies. The slag consists principally of a fused mixture of oxides of calcium, silica, iron, alumina, and magnesia.
00745.03 Reclaimed Asphalt Pavement (RAP) Material - Delete this subsection and substitute the following:
RAP shall not be used.
Materials
00745.10 (b) Standard Duty and Heavy Duty AC - Delete the paragraph and substitute the following:
Provide new aggregates, steel slag aggregate, and stockpile aggregates for Standard Duty and Heavy Duty AC according to Section 02680.
00745.16 (b-2-g) Sublot Size - Delete the paragraph and substitute the following:
A sublot is 500 tons of AC.
A-2


