ISIJ International, Vol. 37 (1997), No. 3, pp. 232-239 Evaluation contalnlng of Susceptibility Steels by Tensile to Surtace Test Hot Shortness in Ou- Seok-Jong SEO. Kentaro ASAKURA1) and Koji SHIBATA1) Graduate School. Department of Materials Science. The University of Tokyo. Hongo. Bunkyo-ku, Tokyo, 11 3 Japan. 1 ) Department of Materials Science. The University of Tokyo. Hongo, Bunkyo-ku. Tokyo. 11 3 Japan. (Received on August /. 1996, accepted in final form on November 12. 1996) The feasibility of a new method for evaluating the susceptibility of steels to surface hot shortness due to Cu and Sn was examined. Steels used are IF steels containing 0.1-0.2•1•Cu and 0.1•/•C-0.5'1•Cu steels. Chemical compositions of the IF steels were controlled with the purpose of being as similar as possible to those of steels of which the susceptibility was previously examined by a visual method in a practical rolling process at Nippon Steel Corporation. Tensile tests were carried out at 11 OO'C after heating a specimen in air or Ar gas. The total elongation and maximum load were measuredfrom a load-elongation curve. By dividing the difference between the total elongations or maximum loads obtained in air and Ar gas by the total elongation or maximum load in Ar gas. the parameters Ee or Ep were calculated. By considering the reduction in specimen diameter due to oxidation, the Ep corrected. Ep', was calculated. The Ee, Ep and Ep' of the IF steels corresponded to the degree of surface cracks observed in the practical rolling process. Penetration of Cu-enriched phase into grain boundaries tends to occur under thermal and external stresses. Surface cracks stop growing along the depth direction at the earlier stage of deformation when the amount of Cu-enriched phase is the smaller at steel/scale interface. Tensile tests using specimens having artificial round cracks clarified that the Ee and Ep' increased with an increase in the crack depth and that, in contrast. the Ep' increased slightly and the Ee decreased with an increase in the number of cracks. The parameter Ee and Ep' showed a maximum value at a strain rate of around 3x I 0-2s~1, and the difference in their values among the steels is largest around this strain rate. Therefore it is possible to know sensitively the effects of any factors like alloying or impurity elements on surface hot shortness at around this strain rate although this strain rate is much slower than those of hot workings. KEYWORDS: copper; tin; scrap iron; oxidation; hot shortness; surface crack; IF steels; carbon steels, tensile test; strain rate; temperature; artificial crack. 1. Introduction Copper tends to enter steels through usage of scrap iron and be enriched at steel/scale interface by prefer- ential oxidation of Fe, Ieading to liquid embrittlement or surface cracking during hot working. This phenomenon is well known as surface hot shortness.1) Hot bend tests are generally usedl,2) in order to evaluate the sus- ceptibility of steels to such shortness in laboratories. In such bend tests, the severity of surface cracking is evaluated by visual comparison with a standard scale or by measuring characteristics of surface cracks by their number, width and depth. The evaluation by visual comparison, however, is not quantitative and measuring such crack characteristics is very laborious. Therefore, it is necessary to establish a new quantitative and easier evaluation method. Kajitani et al.3) stopped tensile tests at several pre-determined strains, and measured the length and the width of surface cracks. Their method is useful to know the growth behavior of the surface cracks and effects of impurity and alloying elements on the severity of surface cracking. In their method, however, C 1997 ISIJ 232 measuring length and width of surface cracks is also very laborious. Reduction of area obtained by tensile test is often used to evaluate the ductility of steels at elevated temperatures. But generally speaking, the reduction of area is not suitable for the evaluation of surface hot shortness because it yields around 100 o/o in usual cases except whentoo much Cu is enriched at the steel/scale interface. This present paper examines the feasibility of a new method for evaluating the susceptibility of steels to surface hot shortness using total elongation and maxi- mum load obtained by hot tensile tests. 2. Experimental Procedure 2.1. Steels Steels used in this work are classified into two groups; Steels A-Care interstitial free (IF) steels and Steels D-G are 0,lo/oC-O.5010Cu steels. The IF steels were melted as 30kgf ingots in the laboratory of Nippon Steel Cor- poration, and the latter as 50kgf ingots in the labora- tory of Kawasaki Steel Corporation. Table I shows the
Transcript
ISIJ International, Vol. 37 (1997), No. 3, pp. 232-239
Evaluation
contalnlng
of Susceptibility
Steels by Tensile
to Surtace
Test
Hot Shortness in Ou-
Seok-JongSEO.Kentaro ASAKURA1)and Koji SHIBATA1)
Graduate School. Department of Materials Science. The University of Tokyo. Hongo. Bunkyo-ku, Tokyo, 113Japan.
1)Department of Materials Science. The University of Tokyo. Hongo, Bunkyo-ku. Tokyo. 113Japan.
(Received on August /. 1996, accepted in final form on November12. 1996)
The feasibility of a newmethodfor evaluating the susceptibility of steels to surface hot shortness due to
Cu and Sn was examined. Steels used are IF steels containing 0.1-0.2•1•Cu and 0.1•/•C-0.5'1•Cu steels.
Chemical compositions of the IF steels were controlled with the purpose of being as similar as possible to
those of steels of which the susceptibility waspreviously examinedby a visual method in a practical rolling
process at Nippon Steel Corporation. Tensile tests were carried out at 11OO'Cafter heating a specimen in
air or Ar gas. The total elongation and maximumload were measuredfrom a load-elongation curve. Bydividing the difference between the total elongations or maximumloads obtained in air and Ar gas by thetotal elongation or maximumload in Ar gas. the parameters Ee or Ep were calculated. By considering the
reduction in specimen diameter due to oxidation, the Ep corrected. Ep', was calculated. The Ee, Ep andEp' of the IF steels corresponded to the degree of surface cracks observed in the practical rolling process.Penetration of Cu-enriched phase into grain boundaries tends to occur under thermal and external stresses.
Surface cracks stop growing along the depth direction at the earlier stage of deformation whenthe amountof Cu-enriched phase is the smaller at steel/scale interface. Tensile tests using specimens having artificial
round cracks clarified that the Eeand Ep' increased with an increase in the crack depth and that, in contrast.
the Ep' increased slightly and the Ee decreased with an increase in the numberof cracks. The parameterEe and Ep' showeda maximumvalue at a strain rate of around 3x I0-2s~1, and the difference in their
values amongthe steels is largest around this strain rate. Therefore it is possible to knowsensitively theeffects of any factors like alloying or impurity elements on surface hot shortness at around this strain rate
although this strain rate is muchslower than those of hot workings.
KEYWORDS:copper; tin; scrap iron; oxidation; hot shortness; surface crack; IF steels; carbon steels, tensile
test; strain rate; temperature; artificial crack.
1. Introduction
Copper tends to enter steels through usage of scrapiron and be enriched at steel/scale interface by prefer-
ential oxidation of Fe, Ieading to liquid embrittlement orsurface cracking during hot working. This phenomenonis well knownas surface hot shortness.1) Hot bend tests
are generally usedl,2) in order to evaluate the sus-ceptibility of steels to such shortness in laboratories.
In such bend tests, the severity of surface cracking is
evaluated by visual comparison with a standard scale orby measuring characteristics of surface cracks by their
number, width and depth. The evaluation by visual
comparison, however, is not quantitative and measuringsuch crack characteristics is very laborious. Therefore,it is necessary to establish a newquantitative and easier
evaluation method. Kajitani et al.3) stopped tensile tests
at several pre-determined strains, and measured the
length and the width of surface cracks. Their methodis
useful to knowthe growth behavior of the surface cracks
and effects of impurity and alloying elements on the
severity of surface cracking. In their method, however,
C 1997 ISIJ 232
measuring length andwidth of surface cracks is also verylaborious. Reduction of area obtained by tensile test is
often used to evaluate the ductility of steels at elevated
temperatures. But generally speaking, the reduction of
area is not suitable for the evaluation of surface hotshortness because it yields around 100 o/o in usual casesexcept whentoo muchCu is enriched at the steel/scale
interface.
This present paper examines the feasibility of a newmethod for evaluating the susceptibility of steels tosurface hot shortness using total elongation and maxi-
mumload obtained by hot tensile tests.
2. Experimental Procedure
2.1. Steels
Steels used in this work are classified into two groups;Steels A-Care interstitial free (IF) steels and Steels D-Gare 0,lo/oC-O.5010Cu steels. The IF steels were melted
as 30kgf ingots in the laboratory of Nippon Steel Cor-poration, and the latter as 50kgf ingots in the labora-
tory of KawasakiSteel Corporation. Table I shows the
ISIJ International. Vol. 37 (1997), No. 3
Table 1. Chemical compositions of the steels tested in masso/o.
No. C Mn PSi S Cu Ni Cr Sn OAI Ti N
A 0.0015
B 0.001 7
C O.0024
D 0.096
E O. IOO
F 0.099
G O. I05
ool 0,1 o 0,009 0,01 o0,01 0,10 ool I ool 10,01 o12 oolo oolo
o39 o.50 0,002 o002
0,01 0,50 o020 o002
0,38 0,50 o021 o002
0,01 0,50 o002 o002
0,086
0,1 17
o. i75
0,48
0,47
o,53
0,48
0,038 0,058 0,008
0,025 0,056 o027
0,080 o151 o029
0,01 ool
0,01 0.01
ool 0,01
0.01 0,01
o033 o053 13
o.035 0.051 17
o035 0,052 21
0,001 0,001 2135
oool 0,001 28 i8
0,009 0,003 40 18
0,001 0.00i 38 37
* N,O:ppm, Fe:bal,
chemical compositions of these steels in masso/o. In Steel
B. 0.03 o/o Sn is alloyed to the base composition of Steel
A. Comparedwith Steel B, contents of Cu, Ni and Crwere increased in Steel C. Chemical compositions ofthese IF steels werecontrolled to be as similar as possible
to those of steels of which susceptibility to surface hotshortness waspreviously examinedby the visual methodin the practical hot and cold rolling processes at NipponSteel Corporation.4) Onthe other hand, Steels D to Gwere used in the experiments in which effects of strain
rate on surface hot shortness were examined. In Steels
were addedrespectively to the base composition of Steel
G.
2.2. Tensile Test at Elevated Temperatures
Specimens for tensile tests were machined from hotrolled plates. Geometries of the specimensare shownin
Fig. l. The specimens which were shorter were sub-
jected to tensile tests at higher strain rates of above8.3 x l0~1 sl. Tensile tests at slower strain rates wereperformed using a mortar drive type machineequippedwith an electric resistance furnace, while an electro-
hydraulically actuated type machine equipped with ahigh frequency induction heater wasused in the tests at
the strain rate of 5.0 x 10 s~ l. Tensile tests were carried
out in Ar gas at 1100'C after heating the specimen in
air or Ar gas. The purity of Ar gas used was four nine.
The three parameters were calculated by using the fol-
lowing Eqs. (1) to (3) as well as the relationships be-
tween these parameters and susceptibility to surface hotshortness were examined.
M12XI .7515R
6
25 30 25
80
(a)
e(Ar) - e(air)Ee(olo)= xIOO ................(1)
e(Ar)
P(Ar) - P(air)Ep(olo)= x 100 ...............(2)
P(Ar)
P(Ar) - P'(air)Ep'(olo)= x 100 ..............(3)
P(Ar)
wheree(Ar) ande(air) are the total elongations measuredin Ar gas and air, and P(Ar) and P(air) the maximumloads measuredin Ar gas and air, respectively. P'(air) is
the maximumload calculated by considering the reduc-
tion in diameter of the specimenby oxidation using the
233
M8X1.25
18 10
1
14 10 18
70
(b)
Fig, l, Geometries of tensile specimens for (a) Iower strain
rates and (b) higher strain rates.
results of thermogravimetry. In this calculation, the fol-
10wing assumptions were used.(1) Scale is composedof only FeO~(Wtistite).
(2) Atomic ratio n ofWustite is 1.14.s)
(3) Si and Mnform Si02 and MnO,respectively.
In order to examine the progress of the surface crack-ing during deformation, the depth to the normal direc-
tion to the specimensurface and width of surface cracks
were measured with an optical microscope after the
specimenswere deformed to strains of 10 and 30 o/o at astrain rate of 2.8 > lO~ i s~ I after heated in air at 1100'Cfor 30min.
To clarify the effects of the depth and the numberofsurface cracks on the parameters EeandEp', tensile tests
were performed at elevated temperature in Ar gas usingspecimenshaving artificial cracks of 0.3, 0.6 and 0.9 mmdepths and 0.2mmwidth. Oneto five artificial cracks
weremachinedby electron discharging at equal intervals
as shownin Fig. 2. Froma mechanics viewpoint, these
cracks should be referred to as notches. In this paper,
however, these will be referred to as cracks becausethese
were machinedartificially in order to simulate the sur-face cracks induced by Cu-enriched liquid phase.
2.3. Observation of Oxidation by Thermogravimetry
Changeof the specimenweight with time wasmeasur-ed in air during heating at 20'C/min and holding at
l 100'C with a gravity-type balance. Specimengeometrywasa cylinder with a diameter of 3mmand a height of3.5 mm.Temperatureandspecimenweight wererecorded
every three seconds with a personal computer.
2.4. Optical Microscopy and EPMASpecimens of lOx lOx lOmmwere oxidized in air
at I 100"C for 30min and air-cooled. Then they weremountedin epoxy resin andpolished mechanically. Afterchemically etched in a 2o/o nital, they were subjected tooptical microscopy and EPMA(Electron Probe Micro-analysis). In optical microscopy. Cu-enriched phasenearsteel/scale interface of the specimen was observed. In
EPMA,concentration behavior of Cu and Sn in the
steel/scale interface region wasexamined.
3. Results and Discussion
3.1. Measurementof the Parameters Ee, Epand Ep'
Figures 3and 4show the total elongation and maxi-
mumload of Steels A-C tested at 1100'C and at 2.8 x10~1s~ l, respectively. Total elongation and maximum10ad in air decrease in the order of Steels A, Band Cwhile those obtained in Ar gas increase in the sameorder.
Figure 5shows the change in specimenweight duringheating at 20'C/min andholding at I 100'C, Upto about30min holding, which is the heating condition in tensile
tests, oxidation rates of the three steels are similar.
Figure 6showsthe parameters Ee, Epand Ep', whichderived from the data of Figs. 3, 4and 5using Eqs. (1),
(2) and (3), respectively. The three values for Steel Aaresmallest, and those for Steel Care largest.
3.2. Comparisonof the Ee, Epand Ep' with the Resultsof the Inspection of Surface Cracks in a PracticalProcessing Line
As mention~d in Sec. 2.1, susceptibility to surface hotshortness of three steels were previously examinedby thevisual method in the practical hot and cold rolling
processes by Yamadaet al. at Nippon Steel Corpora-tion.4) Thechemical composition of the steels which theyexaminedare very similar to those of the present Steels
A, Band C. Therefore, in the present paper, their steels
will be referred to as Steel A', B' and C', respectively.
C 1997 ISIJ 234
~~OO
co
CTS
~)
Oa)
cEf
+'OH
Fig. 3.
'~o)~e1:,cTs
EE'~
~
Fig. 4.
~~EE~~~~~
Fig. 5.
140
120
1oO
80
60
oF~inl~solid: in air
goe
,
oOo
e,
8
8e
A CBSteelS
Total elongation of Steels A, Band C .Tensile tests
performed at 1100'C at a strain rate of 2.8 x lO~ I s~ lin Ar gas after heating for 30min in Ar gas and air.
200
180
160
140
120
r6~~~TIT~Fl~~~J
sond: in air
Oo
O
ee
Oo
e8
g
e,
A B CSteelS
Maximumload of Steels A, Band C. Tensile testsperformed at I 100'C at a strain rate of 2.8 x lO I s~ 1in Ar gas after heating for 30 min in Ar gas a~rd air.
I t
cB t
A
0.8
0.6
0.4
0.2
o
~
,
50 1oo 150 200 2.r
0.8
250
Time(min)
Changein specimenweight during heating at 20'C/minand holding at 1100'C for 2h.
ISIJ International. Vol. 37 (1997), No. 3
50
_ 40~~OO
UJ~ 30
aLUJ 20UJO
10
o
I
O
I
e
A
l
o
JL
A BSteelS
Fig. 6. Comparison of Ee, Ep and Ep'
and C.
c
amongSteels A, B
Ea
~_o
oQoca
tCO~-oJ:,l
O
Fig. 7.
50
40
30
20
10
O
~- cropped bar
=~Pickled plate
-P skin-passed sheet
A C'' B'
SteelS
Maximumdepths of surface cracks measuredYamadaet a/.4) on the practical processing line.
by
scale
50~!m
Fig. 8. Results of EPMAfor Steels A air-cooled after heated at I 100'C for Ih in air.
(a) SEM,(b) Fe, (c) Cu, (d) Sn
According to the report by Yamadaet al., the degrees
of surface cracks of Steels B' and C' were not allowedin all inspections of cropped bars, pickled plates andskin-passed sheets, while for Steel A' the results of all
inspections were allowed. The maximumdepth of sur-face cracks measuredby Yamadaet al. is plotted in Fig.
7. ComparingFigs. 6and 7, it is generally knownthat
the large and small values of Ee, Ep and Ep' of eachSteel A, Bor Ccorrespond to the maximumdepth of
surface cracks of each corresponding Steel A', B' or C'.
That is to say, the Ee, Ep and Ep' represent the degree
of the penetration of surface cracks observed in the
practical rolling process. In the following sections, the
235
relationship between the concentration of Cu due topreferential oxidation of Fe and surface cracks will beexamined.
3.3. Cu-enriched Phaseand Its Penetration into GrainBoundaries
In Steel A. Cu-enriched phase at steel/scale interface
andconcentration of Sncould not be observed by opticalmicroscopy and EPMA.In Steels Band C, however,concentrations of Cu, Ni and Snwere observed at steel/
scale interface. The results of EPMAare shownin Figs.
8and 9 for Steels A and Cair-cooled after heated at
l 100'C for Ih in air. Figure 10 represents the results
C 1997 IS]J
ISIJ International, Vol. 37 (1997), No. 3
c)
Fig. 9. Results of EPMAfor Steels Cair-cooled after heated at I 100"C for i hin air
(a) SEM,(b) Fe, (c) Cu, (d) Sn
~~!'~~~:S_cale
c)
40~!m
Fig, lO. Result of EPMAfor Steel Cfurnace-cooled after heated at I 100'C for Ihin air
(a) SEM,(b) Fe, (c) Cu, (d) Sn
of EPMAfor Steel C furnace-cooled after heated at
1100'C for Ih in air. Penetratlon of Cu-enriched liquidphase into austenitic grain boundaries of the steel can
be observed, but rarely in specimensair-cooled. This fact
suggests that the penetration is hard to occur beforecooling although several previous papers has presumed
C 1997 ISIJ 236
ISIJ International, Vol. 37 (1 997), No. 3
the penetration to occur before cooling.1'6)
The reason for the cooling rate dependenceof thepenetration behavior has remained unclarified, but it canbe presumedthat in the case of air cooling, spontaneousbreak downof the scale tends to occur at the early stageof cooling and tensile stress due to the difference oftherm~l shrinkage betweensteel and scale does not workat the steel surface. It is knownthat linear coefficient ofthermal expansion of Fe is larger by about 25 o/. thanthat of Fe0.6) Onthe other hand, in the case of furnace-cooling the break downof scale is presumedto be delayedand the thermal tensile stress at the steel surface assists
the penetration of Cu-enriched liquid phase into grainboundaries.
3.4. GrowthBehavior of Surface Cracks
During hot deformation, it is conceived that the Cu-enriched liquid phase penetrates into austenitic grain
boundaries and induce surface cracks under appliedstress. In Figs. 11 and 12, depths of surface cracks areplotted as a function of their widths for Steels A andCdeformed by 10 and 300/. at I 100'C, respectively. InSteel A, both the depth and width are small even after
30 ~/o deformation. In Steel C, cracks over 0.3 mmdepth
are observed even in the specimendeformedby 10 ~/.. Inthis steel, proceeding of deformation up to 30 o/o in-
creases the crack width significantly but does not increase
the depth noticeably. That is to say, surface cracks in
this steel cease the growth along the depth direction
before lO"/* deformation and thereafter cracks grow byincreasing their width. Similar growth behavior of sur-face cracks has beenobserved in a 0.20/0C-1 .OoloCu steel
by Kajitani et al.3) Theyattribute the stop of the growthalong the depth direction to the lack of Cu-enrichedliquid phase at the tip of the crack. In the observationby Kajitani et al., surface cracks increase their depth upto around 20 "/o elongation whereas in the present worksurface cracks stop increasing their depth before 100/*
deformation. This discrepancy is attributable to the
E:~
~::
c:L
o1:)
~:o~O
difference in the amountof Cu-enriched liquid phase atsteel/scale interface becauseCucontent of the steel usedby them is higher by twice than that used in the presentwork.
3.5. Effects of Depth andNumberof the Surface Crackson the Eeand Ep'
Figures 13 and 14 exhibit the results of tensile tests
performed in Ar gas using specimens having artificial
cracks in order to clarify the effects of the depth and thenumberof surface cracks on the parameters, Eeand Ep'.
Total elongation decreases with an increase in the crackdepth and with a decrease in the number of cracks.
Maximumload decreases with an increase in the crackdepth and shows a slight decrease with an increase in
the numberof cracks.
Figure 15 exhibits the effects of the depth and the
Numberof Crack : (a) 59.5 cm~1,
(b) 71 ,2cm~1
E~c~CLo1:,
~ocU
O
400
300
200
1oO
O
ooO
o
8o
oooo
oo~o
~o
o
8
o
(a)
~;(b~:ooo
G~o (~)eoo~~
o
(b)
ooo o
oo
Numberof Crack : (a) 39.7 cm~1, (b) 36.8cm~1
400
300
200
1oo
(a)
oo
(b)
oo(~)
O 50 IoO 150 O 50 IoO 150
Fig. Il.
Fig. 12.
50 100 150 O 50 100
Crack width (/A m)150
~~OO
~C:O
5::!~!:
O)=O~515~OH
Crack depths of surface cracks of Steels Cas a func-tion of their width.(a) 100/, deformation, (b) 300/* deformation
140
120
1oo
80
60
40
20
o
e
numberof artificial cracke :O l:3A:1 ~:5IF
lJL
IF
O 50 100 150 O 50 100 150
Crack width (,t m)
Crack depths of surface cracks of Steels Aas a func-tion of their width.(a) lO"/, deformation, (b) 30'/. deformation
Fig. 13.
O 0.2 0,4 0.6 0.8 iDepth Of artificial crack(mm)
Effects of depth and numberof artificial cracks ontotal elongation.
mark shows the result for the specimen having 5artificial cracks of which depths were 0.6 mmexceptthat at center, 0.9 mm.
237 C 1997 ISIJ
ISIJ International, Vol. 37 (1997), No. 3
~;~~~cu
E=E
.~
:~i
140
180
120
110
1oO
90
80
r~T~:~~,~;~1number_ofart'='ificial
crack
eA
O1 (~
35
el~ L,
~ A
,O 0.2 0.4 0.6 0.8 1Depth of artificial crack(mm)
Effects of depth and numberof artificial cracks onmaximumload.
~> mark shows the result for the specimen having 5artificial cracks of which depths were 0.6 mmexceptthat at center, 0.9mm.
~~OO
C:o
~U~)
Oa)
cV
OH
SOlid : in air, open : in Ar
200
150
1OO
50
Fig. 14.
IF ~ D(+Si)
AA E(+P)I [] F(+Si+P)
e OG(BASE)
IL
10~4 10~3 1O IO IOo IO I02
Strain rate (S~1)
Fig. 16. Effects of strain rate on total elongation of Steels Dto Gat 1100'C.
~~oo
o-LLl
LUo
1oo
solid : in air, open : in ArSOlid : Ee' open: Ep'
80
60
40
20
numberof artificial crack
AA: I l[]: 3 •~: 5
AI
~
OAIO
a~
~
O 0.2 0,4 0.6 0.8 iDepth Of artificial crack(mm)
Fig. 15. Effects ofdepth and numberofcracks on the param-eters Eeand Ep'.
Oand Omarks show the result for the specimenhaving 5artificial cracks of which depths were0,6 mmexcept that at center, O.9 mm.
numberof cracks on the parameters Eeand Ep'. TheEeincreases with an increase in the crack depth and with adecrease in the numberof cracks. In contrast, the Ep'
increases with increases in the crack depth and the num-ber of cracks. That is to say, the larger value of Ep'
suggests the occurrence of the deeper and the larger num-ber of cracks, which meansthe higher susceptibility to
surface defects or surface hot shortness. Therefore, the
parameter Ep' can be said to be a better indicator of the
susceptibility to surface hot shortness than the parameterEe.
Figure 6shows that the values of Ee and Ep increase
with an increase in the Ep' whenCuand Sn are addedalthough the numberof surface cracks increases. Suchachange of the samesense in Ee and Ep' is attributable
to a large increase in the maximumdepth of penetration
'~c,)~:~DcQ
E~.~
~
300
250
200
150
1OO
50
i O'4 10~3 10~2 10~1 i Oo IO I02
Strain rate (S~1)
Frg 17. Effects of strain rate on maximumload of Steels Dto Gat 1100*C.
of Cu-enriched liquid phase by the addition of CuandSn. As for the change of the samesense in Ep and Ep',
it can be explained by the fact that oxidation rates aresimilar amongSteels A, Band Cheated at 1100'C for
30min before tensile tests as shownin Fig. 5.
3.6. Effects of Strain Rate on the ParametersEeandEp'
Figures 16 and 17 show the effects of the strain rate
on the total elongation and maximumload at I 100'Cof Steels DG, respectively. There seems to be a dis-
continuity in total elongations between the strain rates
of 2.8 x l0~1 and 8.3 x l0~1 s~1, whereas such a dis-
continuity cannot be observed in maximumload. Thediscontinuity in total elongation is attributed to the
difference in specimen geometry, area by length ratio.
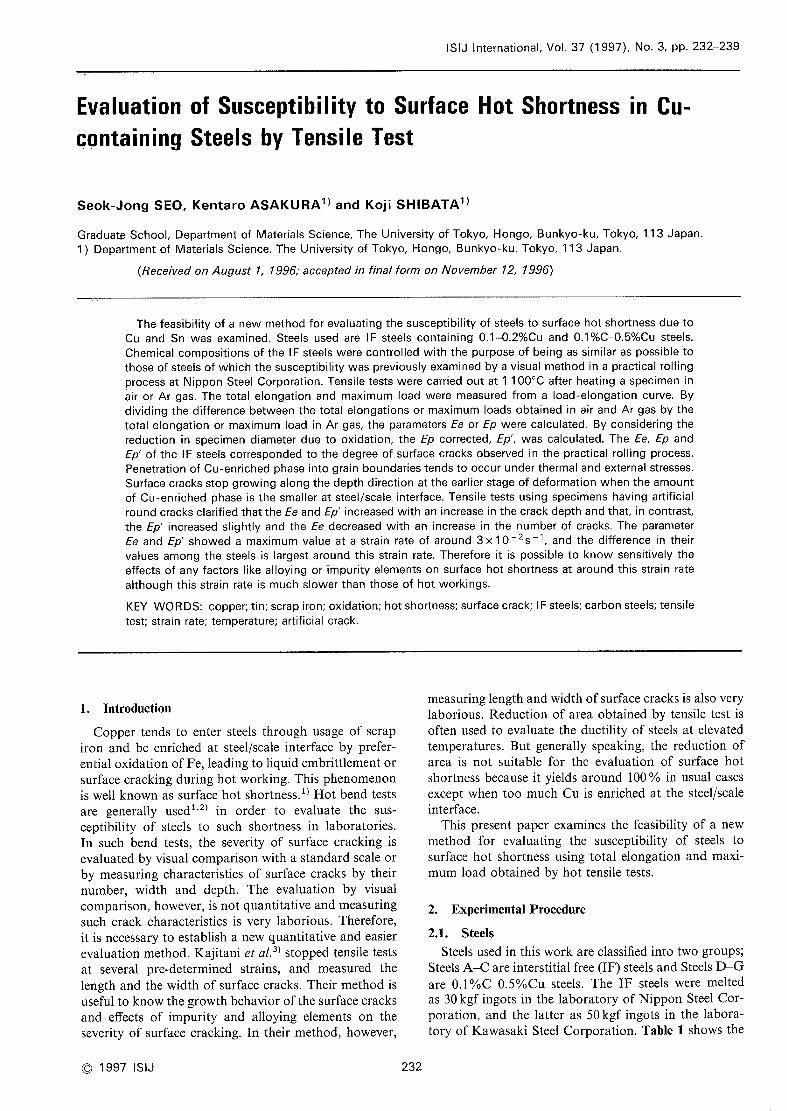
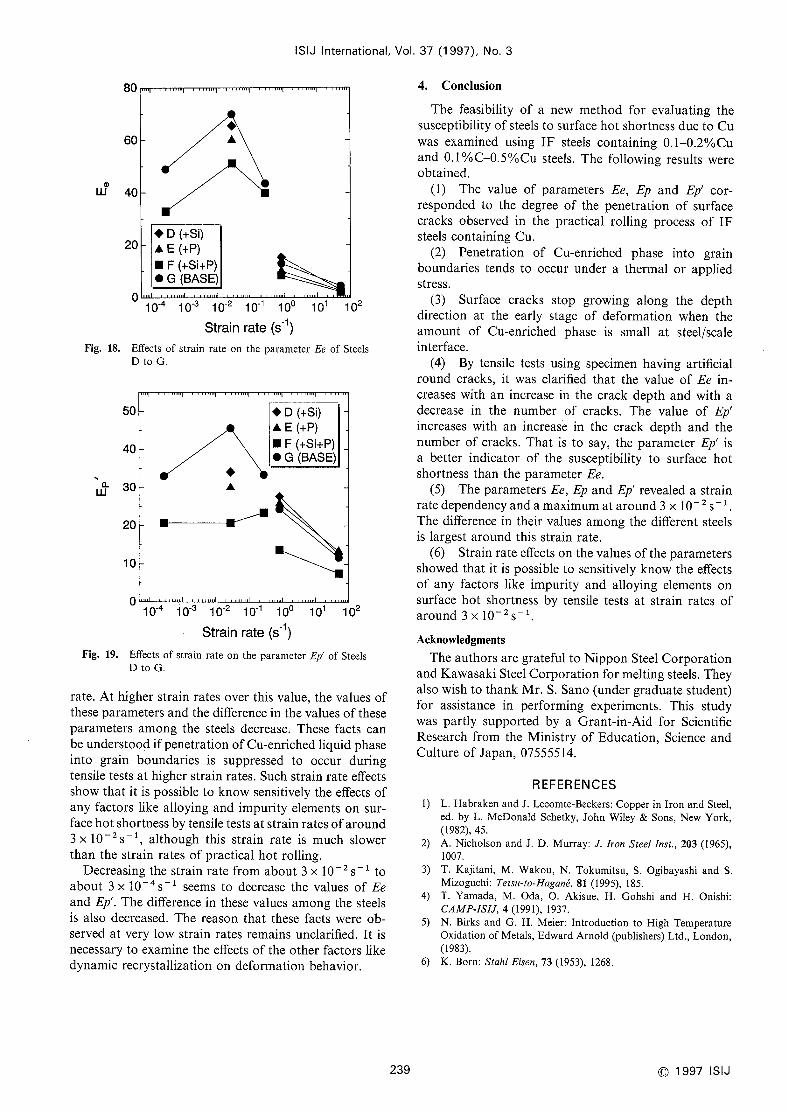
Theparameters Eeand Ep' are shownin Figs. 18 and19, respectively. Fromthese figures, it is knownthat the
values of these parameters reveal a maximumat a strain
rate of around 3x l0~2 s~1 and that the difference in
their values amongthe steels is largest around this strain
C 1997 ISIJ 238
80
ISIJ Internationai, Vol. 37 (1997). No. 3
60
uJo40
20IF D(+Si)
AE(+P)
I F(+Si+P)
OG(BASE)
~
O10 4 i O'3 10~2 10~1 1Oo 101 i 02
Strain rate (S~1)
Fig. 18. Effects of strain rate on the parameter Ee of Steels
D to G.
50
40
~ 30LLi
20
IF
10
~D(+Si)
AE(+P)
I F(+Si+P)
OG(BASE)
O _410 i0~3 10~2 10~1 100 10 10
Strain rate (s~1)
Fig. 19. Effects of strain rate on the parameter Ep' of steels
D to G,
rate. At higher strain rates over this value, the values ofthese parameters and the difference in the values of these
parameters amongthe steels decrease. These facts canbe understood if penetration of Cu-enriched liquid phaseinto grain boundaries is suppressed to occur duringtensile tests at higher strain rates. Suchstrain rate effects
showthat it is possible to knowsensitively the effects of
any factors like alloying and impurity elements on sur-face hot shortness by tensile tests at strain rates of around3x l0~2 s~1, although this strain rate is muchslowerthan the strain rates of practical hot rolling.
Decreasing the strain rate from about 3x 10~2s~ I toabout 3x 10~4s~1 seemsto decrease the values of Eeand Ep'. Thedifference in these values amongthe steelsis also decreased. The reason that these facts were ob-served at very low strain rates remains unclarified. It is
necessary to examine the effects of the other factors like
dynamic recrystallization on deformation behavior.
4. Conclusion
The feasibility of a newmethod for evaluating thesusceptibility of steels to surface hot shortness due to Cuwas examined using IF steels containing 0.1-0.2010Cuand 0.1 o/oC-0.5010Cu steels. The following results wereobtained.
(1) The value of parameters Ee, Ep and Ep' cor-responded to the degree of the penetration of surfacecracks observed in the practical rolling process of IFsteels containing Cu.
(2) Penetration of Cu-enriched phase into grainboundaries tends to occur under a thermal or appliedstress.
(3) Surface cracks stop growing along the depthdirection at the early stage of deformation when the
amount of Cu-enriched phase is small at steel/scaleinterface.
(4) By tensile tests using specimen having artificial
round cracks, it was clarified that the value of Ee in-
creases with an increase in the crack depth and with adecrease in the number of cracks. The value of Ep'increases with an increas~ in the crack depth and the
numberof cracks. That is to say, the parameter Ep' is
a better indicator of the susceptibility to surface hotshortness than the parameter Ee.
(5) Theparameters Ee, Epand Ep' revealed a strain
rate dependencyandamaximumat around 3x 10~2s~ I,
The difference in their values amongthe different steels
is largest around this strain rate.(6) Strain rate effects on the values ofthe parameters
showedthat it is possible to sensitively knowthe effects
of any factors like impurity and alloying elements onsurface hot shortness by tensile tests at strain rates ofaround 3x l0~2 s~ 1.
Acknowledgments
Theauthors are grateful to Nippon Steel Corporationand KawasakiSteel Corporation for melting steels. Theyalso wish to thank Mr. S. Sano(under graduate student)for assistance in performing experiments. This study
was partly supported by a Grant-in-Aid for Scientific
Research from the Ministry of Education, Science andCulture of Japan, 07555514.
REFERENCESl) L, Habrakenand J. Lecomte-Beckers: Copper in lron and Steel,
ed. by L. McDonaldSchetky, John Wiley & Sons, NewYork,(1982), 45.
2) A. Nicholson and J. D. Murray: J. Iron Steel Inst., 203 (1965),
l007.
3) T. Kajitani, M, Wakou,N. Tokumitsu, S. Ogibayashi and S.
Mizoguchi: Tetsu-to-Hagan~, 81 (1995), 185.
4) T. Yamada,M. Oda, O. Akisue, H. Gohshi and H. Onishi:
CAMP-ISIJ,4 (1991), 1937.5) N. Birks and G. H. Meier: Introduction to High Temperature
Oxidation of Metals, EdwardArnold (publishers) Ltd., London,(1983).