37
Stefan Arnborg, KTH and SICS http://www.nada.kth.se/~stefan Brain Research and Data Mining
| Date post: | 03-Jan-2016 |
| Category: |
Documents |
| Upload: | mark-white |
| View: | 221 times |
| Download: | 4 times |

Stefan Arnborg, KTH and SICS
http://www.nada.kth.se/~stefan
Brain Research and Data Mining

Visualization or Statistics?
• A good visualization strikes the investigator between the eyes with the truth J. Tukey
• The human perception system is biased towards wishful thinking - we normally see what we want to see.

0 0.1 0.2 0.3 0.4 0.5 0.6 0.7 0.8 0.9 10
0.1
0.2
0.3
0.4
0.5
0.6
0.7
0.8
0.9
1
The human eye finds structureBayes factor is 1.2 in favor of no structure vs structureThe points are generated completely randomly

0 0.1 0.2 0.3 0.4 0.5 0.6 0.7 0.8 0.9 10
10
20
30
40
50
60
70
80
90
100
Cumulative plots of x- and y-coordinate
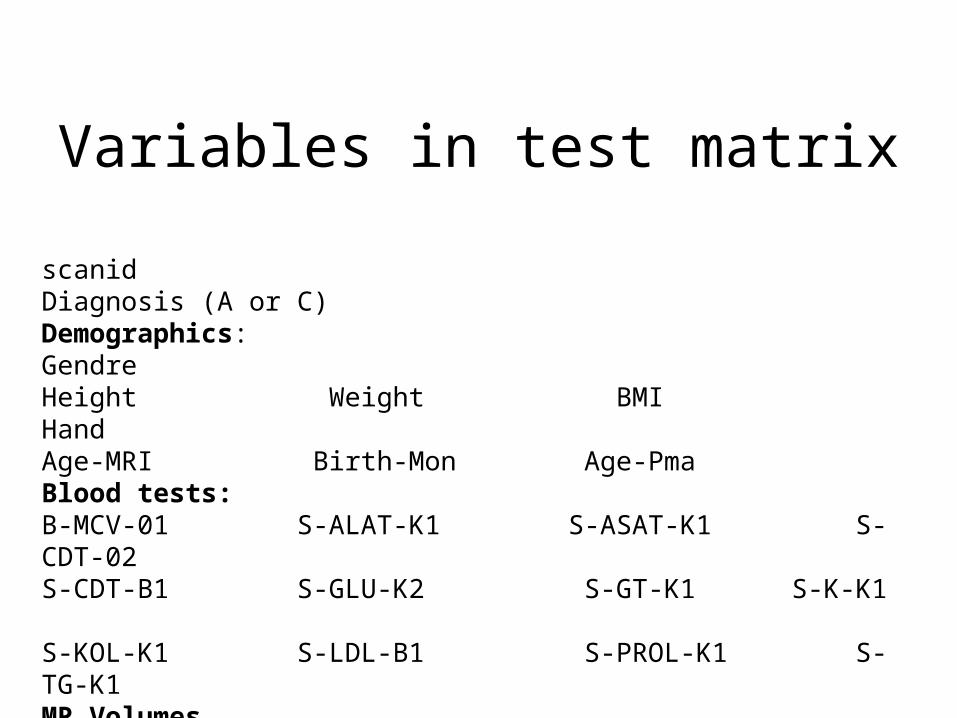
Variables in test matrix
scanid Diagnosis (A or C) Demographics:Gendre Height Weight BMI Hand Age-MRI Birth-Mon Age-PmaBlood tests:B-MCV-01 S-ALAT-K1 S-ASAT-K1 S-CDT-02 S-CDT-B1 S-GLU-K2 S-GT-K1 S-K-K1 S-KOL-K1 S-LDL-B1 S-PROL-K1 S-TG-K1
MR Volumes

MR Volumes in test matrix(144 subjects)
BrsCSF BrsGrey BrsWhite Cer-CSF CerGrey CerWhite FroCSF FroGrey FroWhite OccCSF OccGrey OccWhite ParCSF ParGrey ParWhite SubCSF SubGrey SubWhite TemCSF TemGrey TemWhite VenCSF VenGrey VenWhite Rel-volGrey Total-intr Total-CSF Total-Grey Total-White Int-nocl Int-blood CSF/Grey Grey/Total White/Total CSF/Total
Vermis (manually traced, 109 subjects):CH TV AV PSV PIV

Thomas Bayes (1703-1762)
• If I suspect that a coin used for betting is unbalanced, how should I test it? - inverse probability.
• Prior: Before the experiment my probability for heads is uniformly distributed between 0 and 1.
• Posterior: After the experiment my probability is described by a ‘beta distribution’.

C. S. Peirce (1839 - 1914).Pragmaticism: How does our understanding of Nature develop? How should Sciencebe developed?
Semeiotics: Meaning is created by signs sent around in the nervous system. Scientific knowledge is created in a never-ending process of discontent with the current theories which force new models of thought.

C. S. Peirce (1839 - 1914).
A person is not absolutely anindividual. His thoughts are what he is ‘saying to himself’,that is, saying to that other selfthat is coming into life in the flow of time. When one reasons it is that critical self that one is trying to persuade.It is a necessity of Logic that every logical evolution of thought should be dialogic.Every thought is a sign.
The Sign of ThreeUmberto Eco, Thomas SebeokIndiana University Press, 1983.
Love, Chance and Logic:C.S. Peirce, 1923

Sherlock Holmes: common senseinference
Techniques used by Sherlock are modelled on Conan Doyle’s professor in medical school, who followed the methodological tradition of Hippocrates and Galen. Abductive reasoning, first spelled out by Peirce, is found in 217 instances in SherlockHolmes adventures - 30 of them in the first novel, ‘A study in Scarlet’.

Bayes’ factor
• Choice between two hypotheses, H1 and H2,given experimental/observational data D
P(H1|D) P(D|H1) P(H1)P(H2|D) P(D|H2) P(H2)
Posterior odds Bayes factor prior odds
Bayes factor 8 issignificant,32 is strong
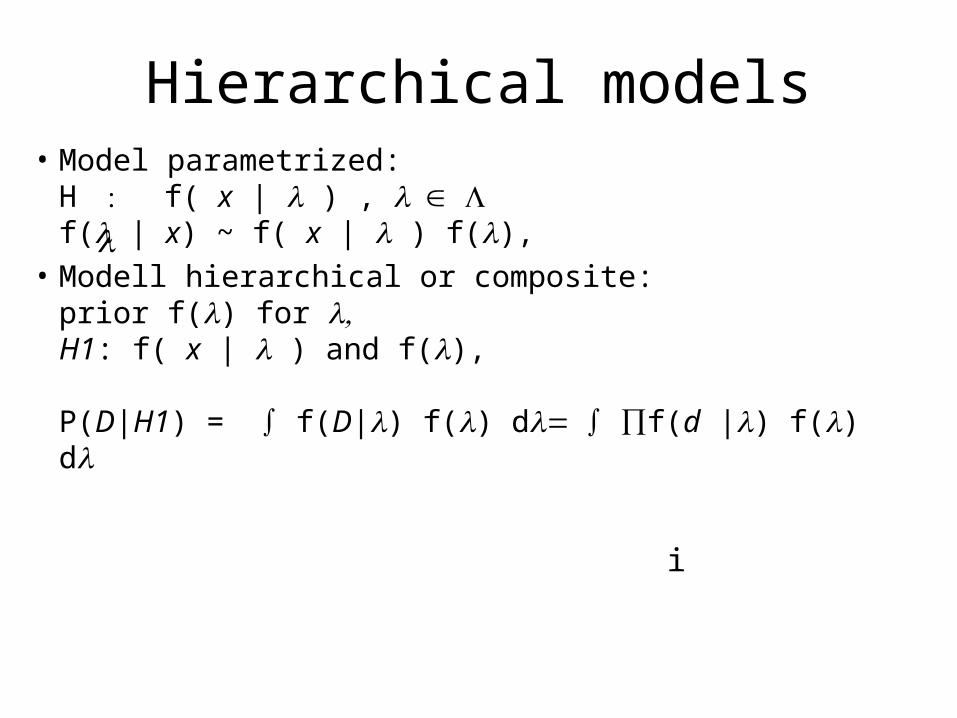
Hierarchical models• Model parametrized:
H f( x | ) , f( | x) ~ f( x | ) f(),
• Modell hierarchical or composite: prior f() for H1: f( x | ) and f(),
P(D|H1) = ∫ f(D|) f() d∫ ∏f(d |) f() d
i

Hypothesis in test matrix
• H1: (no effect) a data column is generatedindependently of diagnosis (composite model)
• H2: the data for controls are generated by one composite model, for affected by another one.
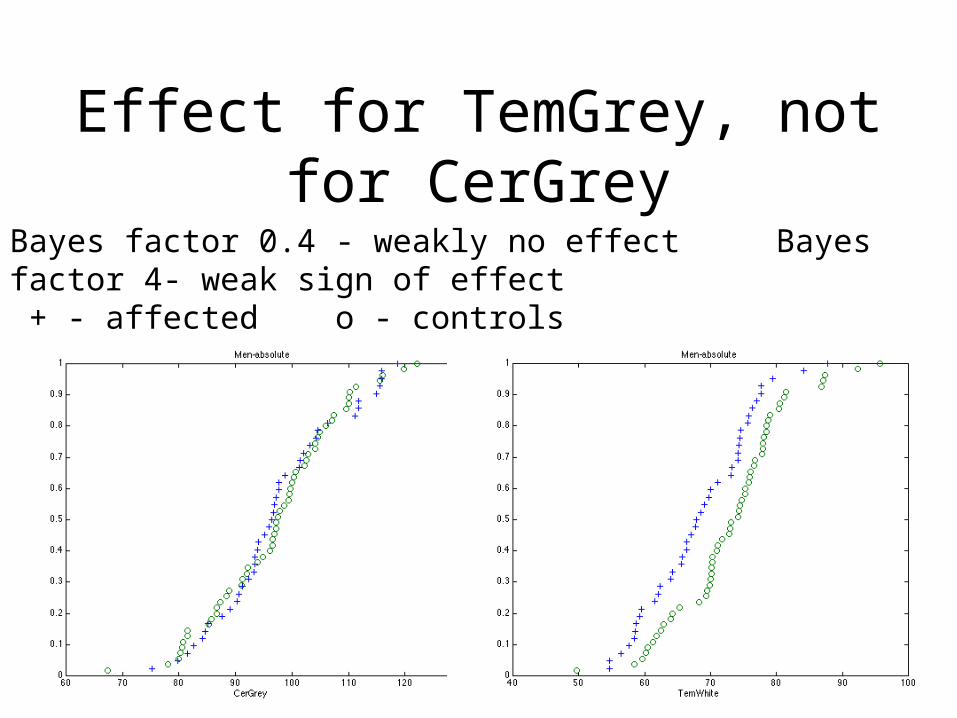
Effect for TemGrey, not for CerGrey
Bayes factor 0.4 - weakly no effect Bayes factor 4- weak sign of effect + - affected o - controls

Difference women-men
BF 0.1: no effect for women BF 4 : weak sign of effect,men

Mass testing effects, confounders
• In a 1000-column table there are ~5000 accidental associations on the 1% level.
• Bayesian analysis, properly applied, avoids all problems of overfitting and mass testing.
• Observational studies are prone to misleadingconclusions from known & unknown confounder
• Causal graphical models is a tool to avoid this

Compensating mass testing
• Bonferroni 1937: For level and n tests, use level /n
• Benjamini 1996: Control False Discovery Rate
• Composite Bayes model (1763-2001): Theoretically optimal procedure, but requiresan explicit (composite) alternative to the nullhypothesis (with nuisance parameters).

Dependence on sampleBrsCSF 7.4TemCSF 6.6VenWhite 6.3Total-CSF 4.2SubWhite 3.5VenCSF 3.1FrCSF 2.9SubCSF 2.6BMI 1.9Rel-volGrey 1.6S-GLU-K2 1.6CerGrey 1.4
(144 subject sample)
PSV 9.5BrsCSF 7.7TemCS 7.3VenCSF 4.8TV 4.7Total-CSF 4.4SubCSF 3.5VenWhite 3.4FrCSF 3.4age 3.4AV 2.3SubWhite 2.2OccWhite 1.1S-GLU-K2 1.0(109 subject sample)
20 25 30 35 40 45 50 55 600
0.1
0.2
0.3
0.4
0.5
0.6
0.7
0.8
0.9
1
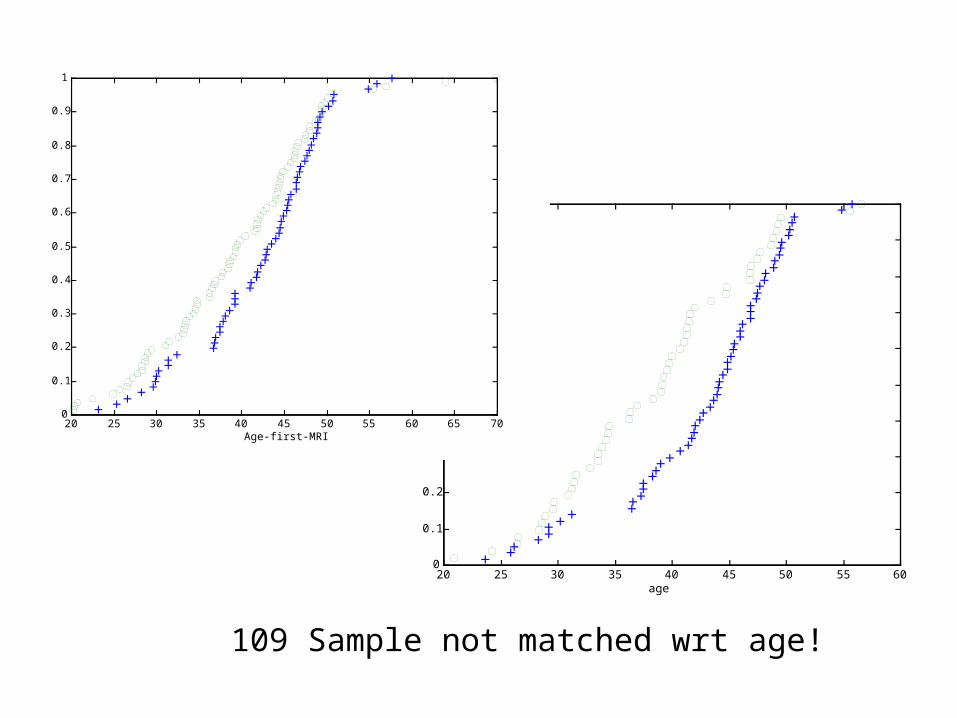
age
109 Sample not matched wrt age!
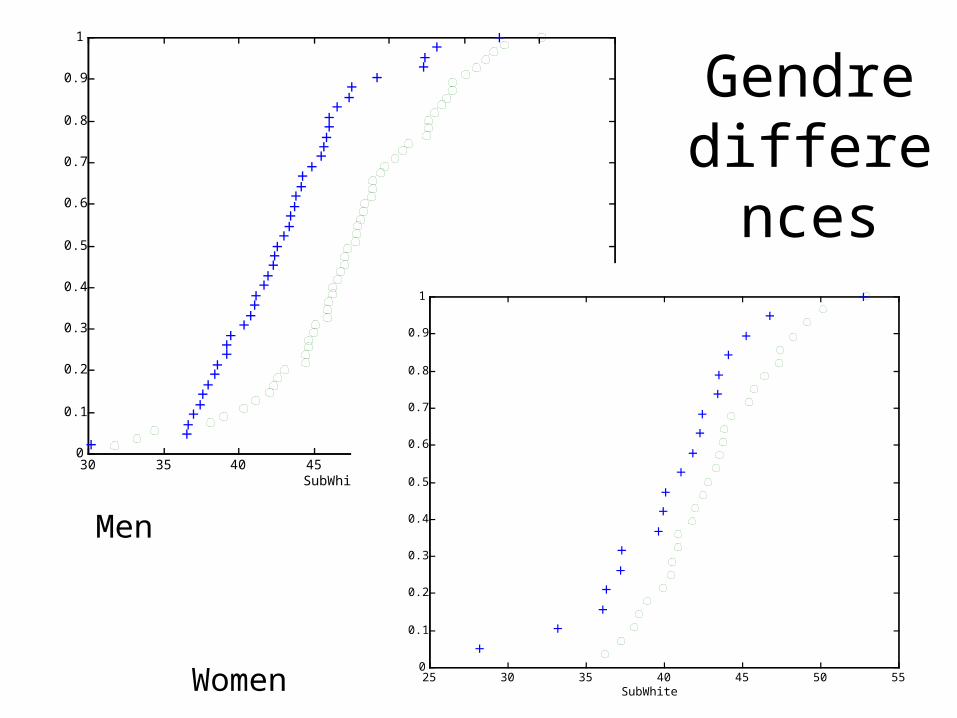
Gendre differences
30 35 40 45 50 55 60 650
0.1
0.2
0.3
0.4
0.5
0.6
0.7
0.8
0.9
1
SubWhite
25 30 35 40 45 50 550
0.1
0.2
0.3
0.4
0.5
0.6
0.7
0.8
0.9
1
SubWhite
Men
Women

Graphical models
Y
Z
X
Y
Z
X
Y
Z
Xf(x,y,z)=f(x)f(y)f(z)
f(x,y,z)=f(x,z)f(x,y)/f(x)
f(x,y,z)

SubCSF
SubWhiteTemCSFVenWhite
Diagnosis FrCSFFrWhiteParCSF
Totalwhite
TotalCSF
BrsCSF
144 sample without Vermis variables

106 sample with Vermis variables
Diagnosis PSV
TV
PIV
TotalGrey
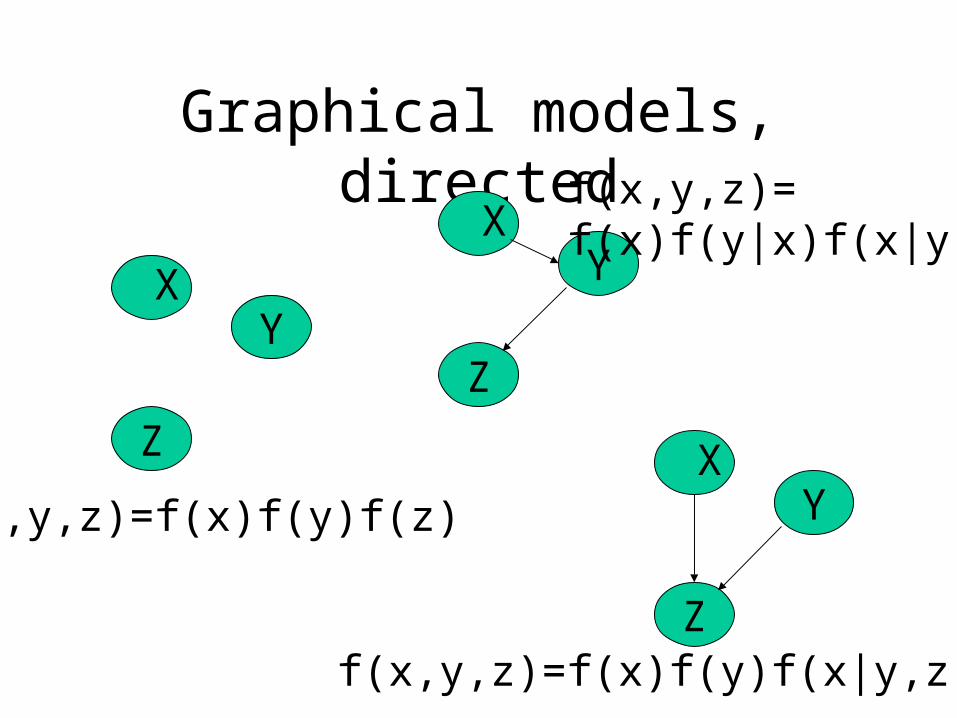
Graphical models, directed
Y
Z
X
Y
Z
X
Y
Z
Xf(x,y,z)=f(x)f(y)f(z)
f(x,y,z)=f(x)f(y|x)f(x|y)
f(x,y,z)=f(x)f(y)f(x|y,z)

Experimental vs observational data
• Is there an association between treatment and recovery?
• Is there a causal link? - or a backdoor path(confounder)?
• Can we decide if a patient had recovered with a different treatment?
• Can we decide which treatment has best chance of recovery for patient?
Cause or effect?
• Association between drinking red wine and good health is known since long. Drinking 1 litrea day is equivalent, for life insurance purposes, to temperance (Skandia-If statistics, 1998)
• Does drinking red wine promote health?
• Does sound lifestyle promote drinking red wine?
• Or both? Causes are today only hypotheses!(Svenska Dagbladet Sept 3 2001)

Causal graphs-Bayesian networks
• Statistical DAG: f(x,y) = f(y|x) f(x)
• Causal graph: Arrow means causation: y <— F(x,)
X Y

Controlling eelworms by fumigants(Cochran 1981)
Y
X
Z0
Z1
Z3
B
X: FumigantsY: YieldB: Birds
Z0: Eelworms in winterZ1: Eelworms at treatmentZ2: Eelworms after treatmentZ3: at end of season
Z2
P(y|x)= P(y|x z0) P(z0)
Must condition on Z0, or on Z1 and B.

Classification (Cheeseman, Stutz)
cases
Variables hiddenclass
...
ab..bba
Model assumption:within each class,columns are generatedindependently of eachother. (Other options existfor numerical data)
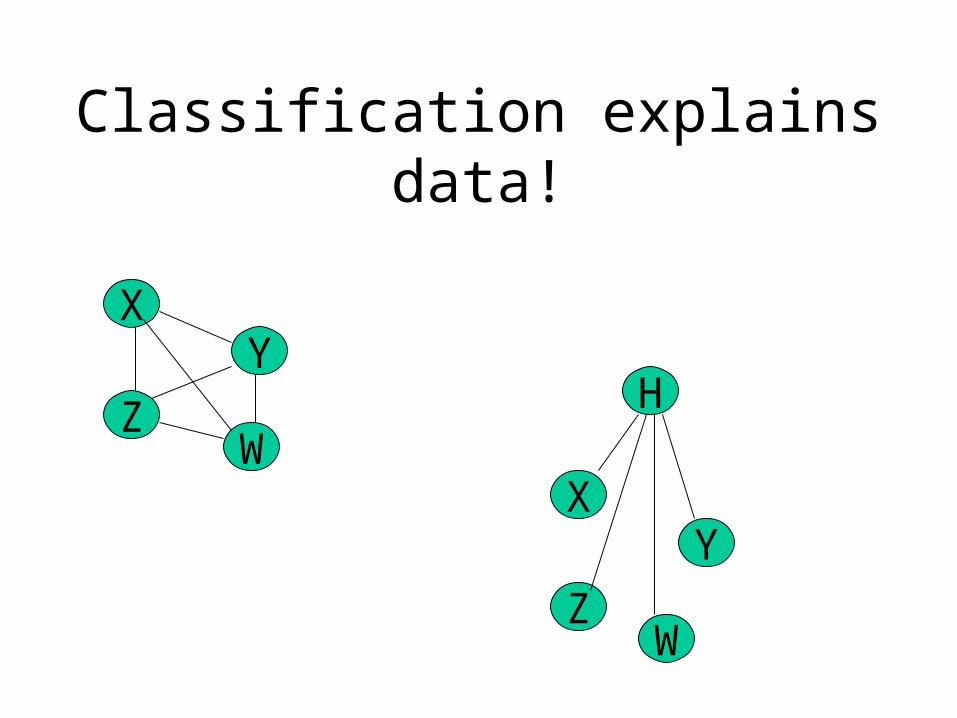
Classification explains data!
XY
Z
XY
Z
HW
W

Autoclass1

Autoclass10

Autoclass10 vs CSF
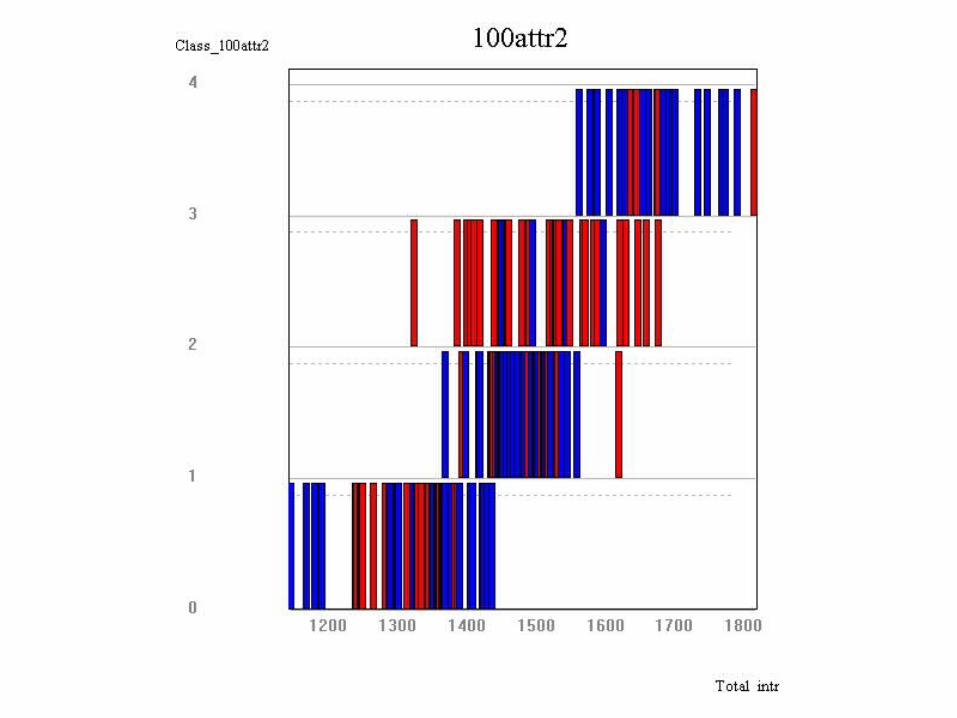
Autoclass100
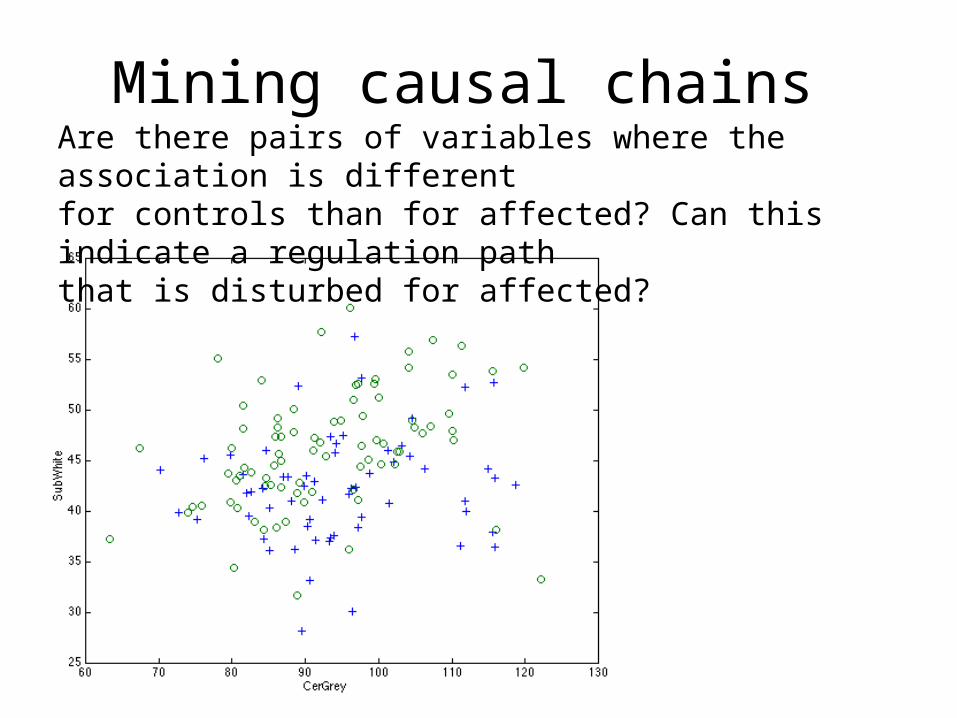
Mining causal chainsAre there pairs of variables where the association is differentfor controls than for affected? Can this indicate a regulation paththat is disturbed for affected?

35 40 45 50 55 60 65 7025
30
35
40
45
50
55
60
65
VenGrey

Strong difference in association
Rel-volGrey SubWhite 11.3VenGrey SubWhite 10.5Cer-CSF SubWhite 10.5Total-intr SubWhite 10.4FroCSF SubWhite 10.3Int-nocl SubWhite 10.2TemGrey SubWhite 9.9ParGrey Total-CSF 9.6


