27
Stellar Linearity Test Jason Surace (Spitzer Science Center)
| Date post: | 22-Dec-2015 |
| Category: |
Documents |
| View: | 216 times |
| Download: | 1 times |

Stellar Linearity Test
Jason Surace (Spitzer Science Center)
IRAC Linearization Pre-Launch
Linearization was based on exhaustive ground testing.
Tests were done with ramped exposure time observations of a steady, extended emission source (test lamp).
Quadratic and cubic functions were fit to the observed DN as a function of time.
Solutions appeared to be good to better than 1%.
IRAC Linearization Post-Launch
Inability to use the shutter made pixel-wise measurements of the linearization practically impossible.
Linearity was tested by examining HDR frames of a bright source which illuminated most of the array, and which had a strong gradient (a nebula). The ratio between the surface brightness in the long and short frames was examined as a function of flux in the short frame.
Channel 4 was found to appear to be much more linear than the ground solution, and a new solution was used. Confusingly, different ground tests produced different results.
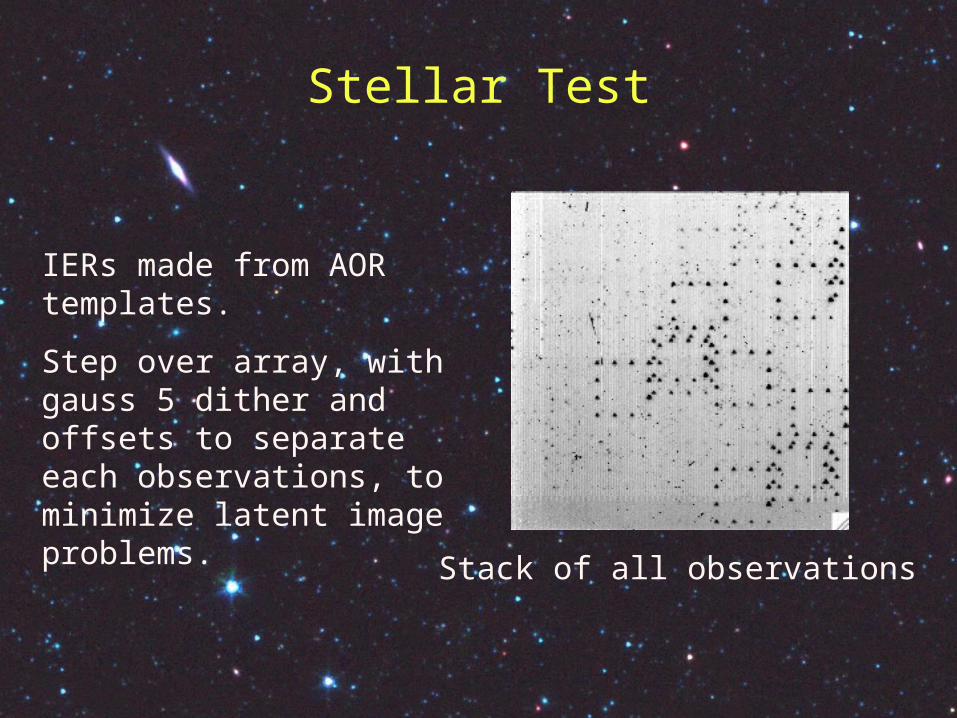
Stellar Test
Stack of all observations
IERs made from AOR templates.
Step over array, with gauss 5 dither and offsets to separate each observations, to minimize latent image problems.
Stellar Test: Target Selection
Target selection difficult, yet critical to success.
Stars need to saturate in 10-15 seconds.
Test from 1/3 to 3x full well depth.
Had to use different stars for InSb and Si:As channels.
Needed stars actually visible, and had been previously observed. Settled on IOC CVZ calibrators

Data Reduction
Data processed with “pipe-0” - this applies basic reformatting, adds pointing.
Data further processed with on-line linearity correction module, flat-fielded, gain corrections applied.
IDL script locates stars, re-centers, extracts photometry using local background subtraction.

Channel 1 - Peak DN vs. Exptime

Ch.1 Flux vs Peak DN

Ch.1 Flux vs Peak DN

Channel 2
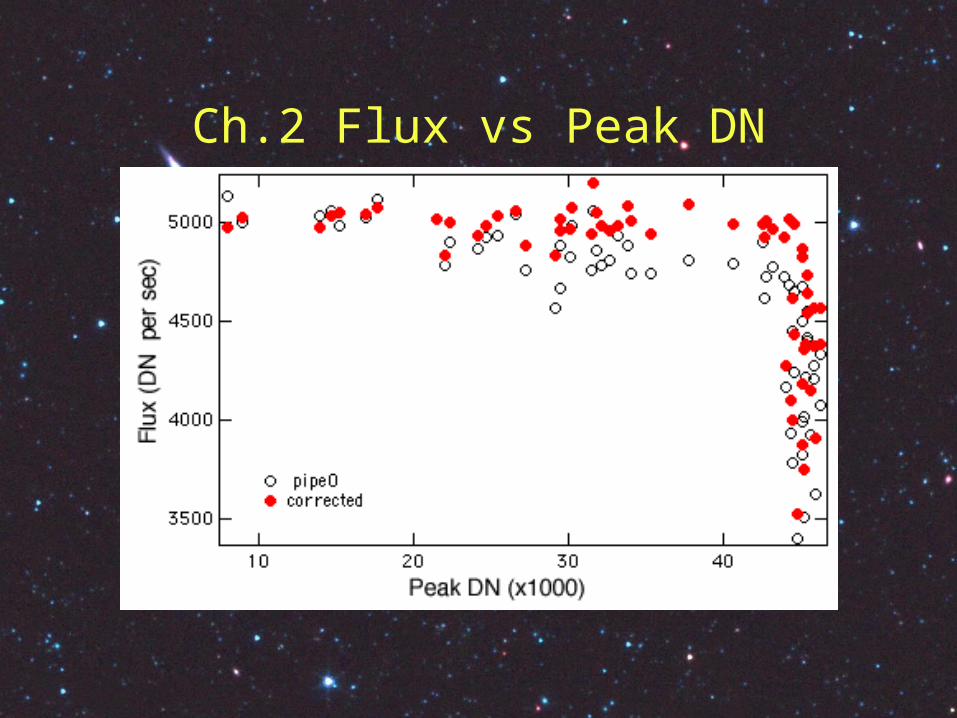
Ch.2 Flux vs Peak DN

Ch.2 Flux vs Exptime

Summary: InSb
Up until nearly full-well, the InSb channels are linearized to around 0.2%.
The “saturation level” is highly dependent on pixel phasing, due to the undersampling of the IRAC beam.
Saturation affects the central pixel first, and driving this well into saturation only results in flux underestimates of 20% or so.

Ch.4 Peak Flux vs Exptime
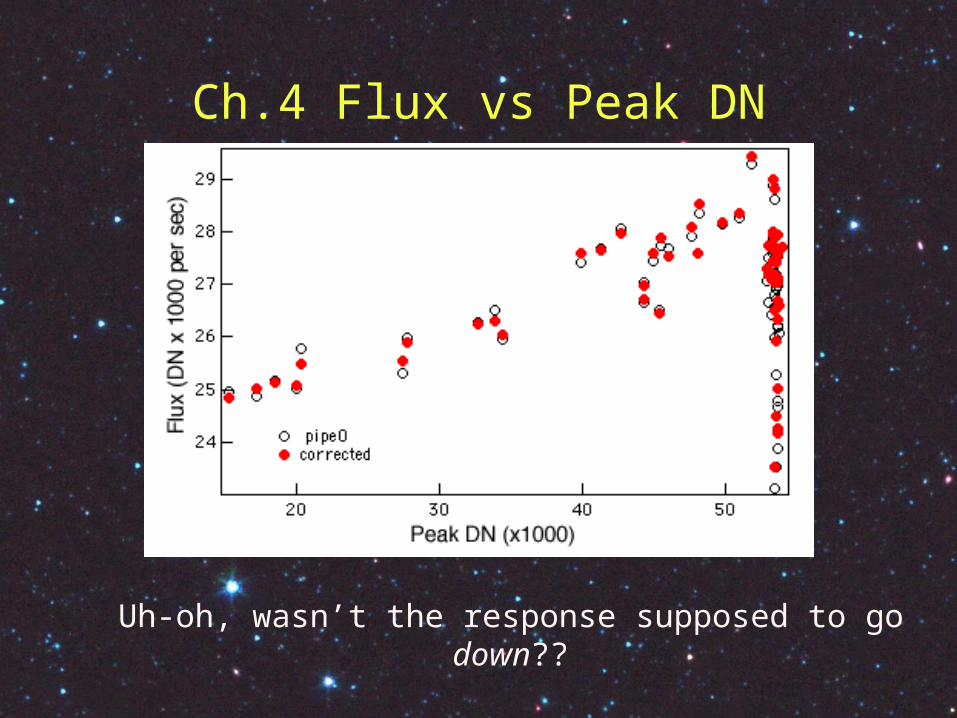
Ch.4 Flux vs Peak DN
Uh-oh, wasn’t the response supposed to go down??
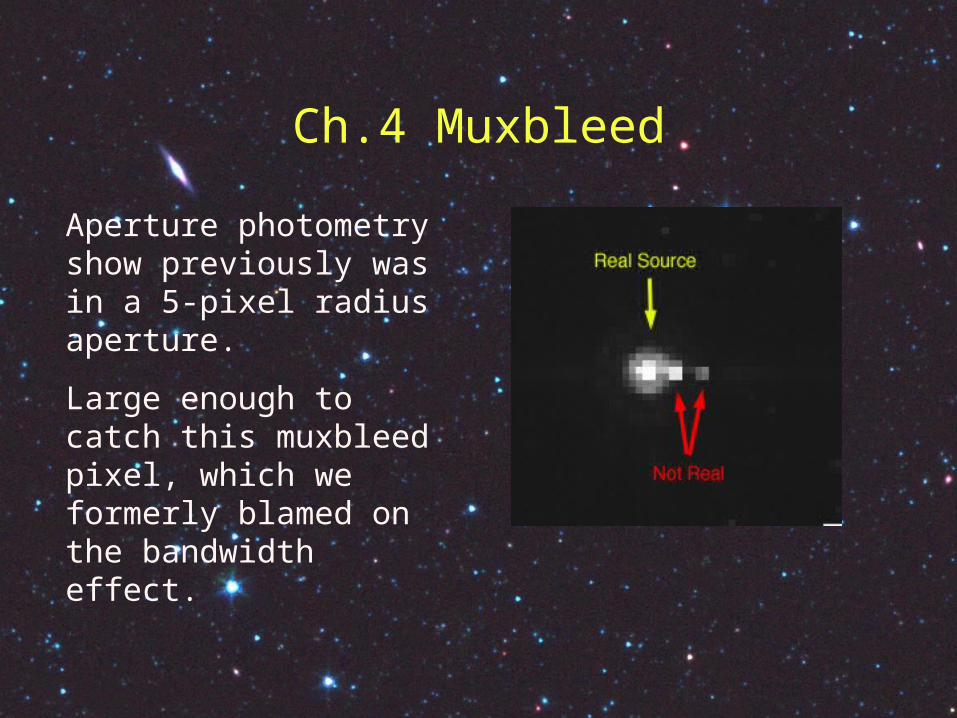
Ch.4 Muxbleed
Aperture photometry show previously was in a 5-pixel radius aperture.
Large enough to catch this muxbleed pixel, which we formerly blamed on the bandwidth effect.

Ch.4 Muxbleed

Ch.4 Small Ap. Flux vs Peak DN
The uncorrected data is totally linear! Not how it behaved on the ground!

Ch.4 Derived Fluxes into Saturation
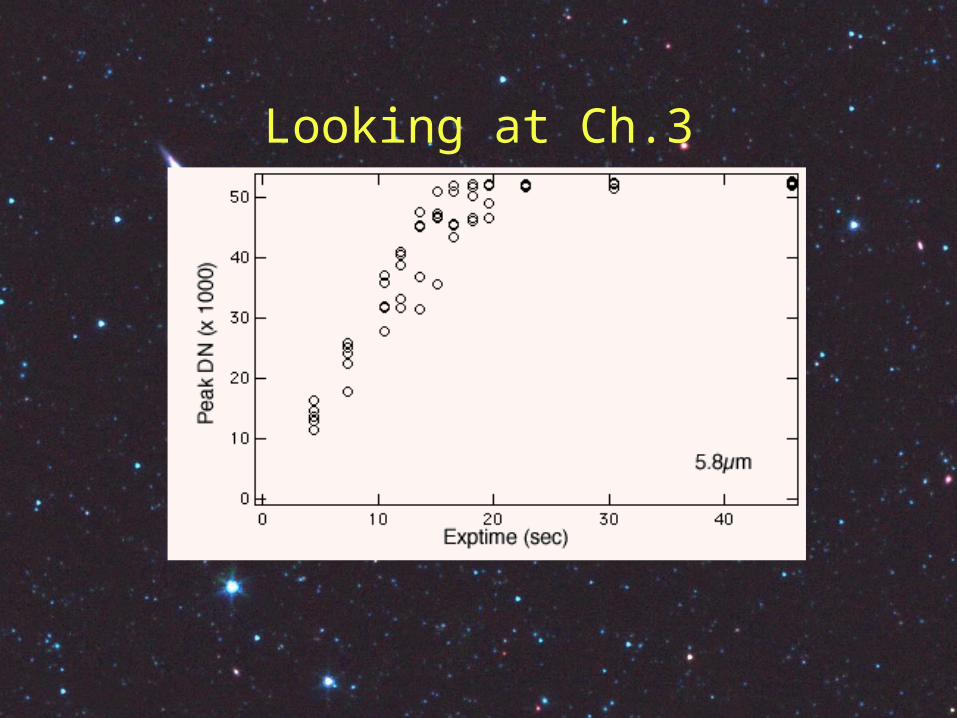
Looking at Ch.3

Same behavior as Ch.4

Ch.3 Muxbleed
Muxbleed nearly identical to ch.4

Ch.3 Small Ap. Photometry
Hmm…. Correction is no good - it hurts more than it helps.

Ch.3 Flux vs Exptime

SWIRE-2MASS Color-Mag DR1
Original analysis from ELAIS-N1 DR1 Release
(note: offsets between channels zeroed, real ones are between 0 and 0.1)
Note: arrays are linear at low well depths!
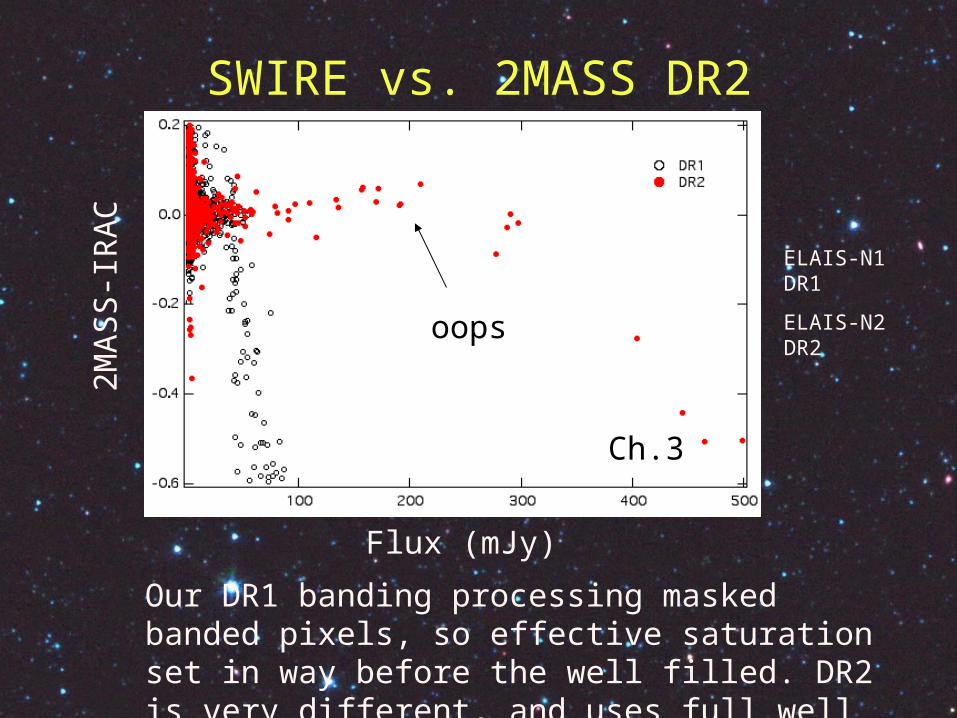
SWIRE vs. 2MASS DR2
Our DR1 banding processing masked banded pixels, so effective saturation set in way before the well filled. DR2 is very different, and uses full well depth.
Ch.3
2MA
SS
-IR
AC
Flux (mJy)
oops
ELAIS-N1 DR1
ELAIS-N2 DR2
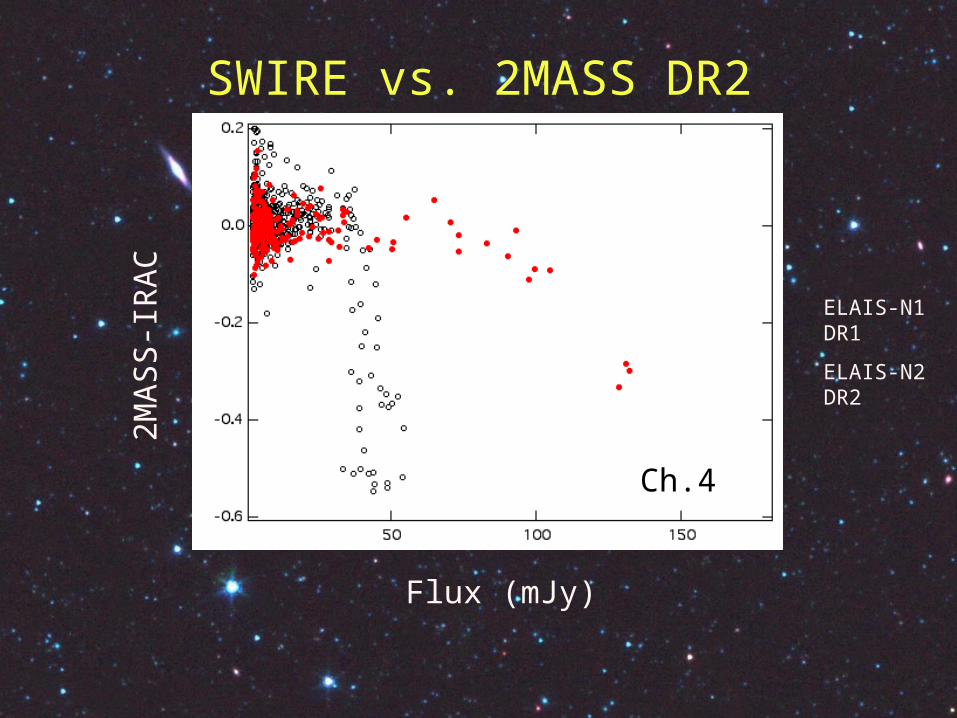
SWIRE vs. 2MASS DR2
Ch.4
2MA
SS
-IR
AC
Flux (mJy)
ELAIS-N1 DR1
ELAIS-N2 DR2


