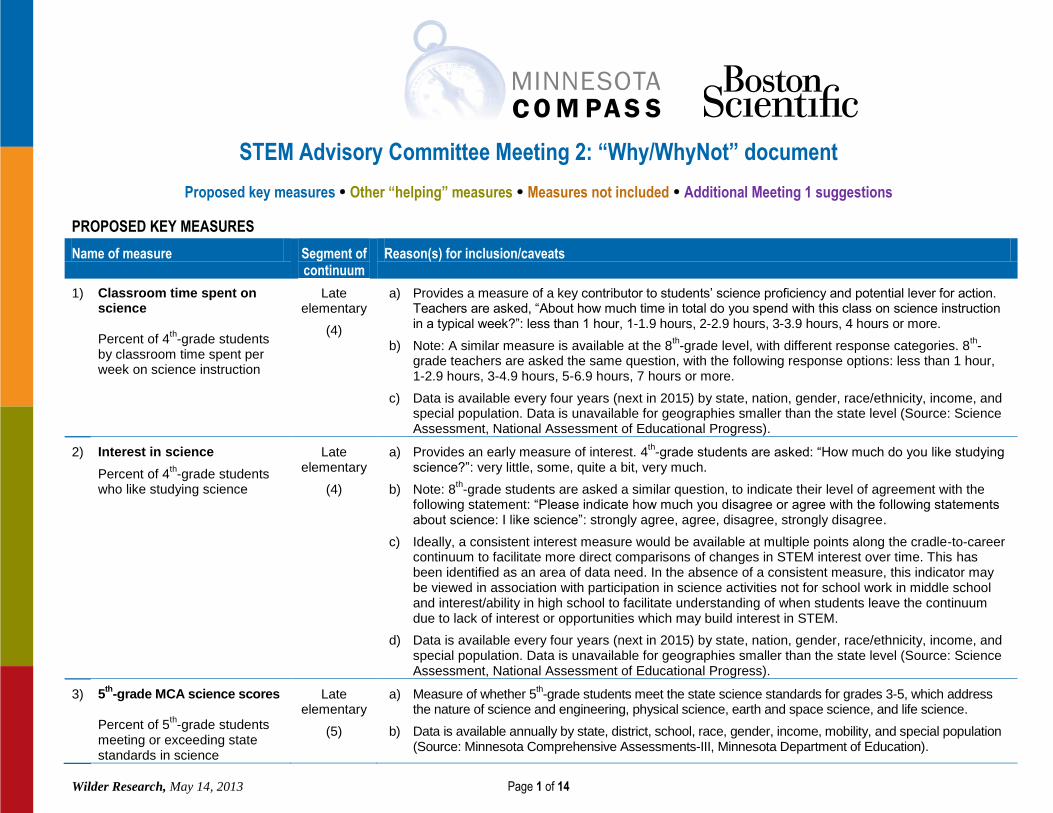
Wilder Research, May 14, 2013 Page 1 of 14 STEM Advisory Committee Meeting 2: “Why/WhyNot” document Proposed key measures Other “helping” measures Measures not included Additional Meeting 1 suggestions PROPOSED KEY MEASURES Name of measure Segment of continuum Reason(s) for inclusion/caveats 1) Classroom time spent on science Percent of 4 th -grade students by classroom time spent per week on science instruction Late elementary (4) a) Provides a measure of a key contributor to students’ science proficiency and potential lever for action. Teachers are asked, “About how much time in total do you spend with this class on science instruction in a typical week?”: less than 1 hour, 1-1.9 hours, 2-2.9 hours, 3-3.9 hours, 4 hours or more. b) Note: A similar measure is available at the 8 th -grade level, with different response categories. 8 th - grade teachers are asked the same question, with the following response options: less than 1 hour, 1-2.9 hours, 3-4.9 hours, 5-6.9 hours, 7 hours or more. c) Data is available every four years (next in 2015) by state, nation, gender, race/ethnicity, income, and special population. Data is unavailable for geographies smaller than the state level (Source: Science Assessment, National Assessment of Educational Progress). 2) Interest in science Percent of 4 th -grade students who like studying science Late elementary (4) a) Provides an early measure of interest. 4 th -grade students are asked: “How much do you like studying science?”: very little, some, quite a bit, very much. b) Note: 8 th -grade students are asked a similar question, to indicate their level of agreement with the following statement: “Please indicate how much you disagree or agree with the following statements about science: I like science”: strongly agree, agree, disagree, strongly disagree. c) Ideally, a consistent interest measure would be available at multiple points along the cradle-to-career continuum to facilitate more direct comparisons of changes in STEM interest over time. This has been identified as an area of data need. In the absence of a consistent measure, this indicator may be viewed in association with participation in science activities not for school work in middle school and interest/ability in high school to facilitate understanding of when students leave the continuum due to lack of interest or opportunities which may build interest in STEM. d) Data is available every four years (next in 2015) by state, nation, gender, race/ethnicity, income, and special population. Data is unavailable for geographies smaller than the state level (Source: Science Assessment, National Assessment of Educational Progress). 3) 5 th -grade MCA science scores Percent of 5 th -grade students meeting or exceeding state standards in science Late elementary (5) a) Measure of whether 5 th -grade students meet the state science standards for grades 3-5, which address the nature of science and engineering, physical science, earth and space science, and life science. b) Data is available annually by state, district, school, race, gender, income, mobility, and special population (Source: Minnesota Comprehensive Assessments-III, Minnesota Department of Education).
Proposed key measures Other “helping” measures Measures not included Additional Meeting 1 suggestions
PROPOSED KEY MEASURES
Name of measure Segment of continuum
Reason(s) for inclusion/caveats
1) Classroom time spent on science Percent of 4
th-grade students
by classroom time spent per week on science instruction
Late elementary
(4)
a) Provides a measure of a key contributor to students’ science proficiency and potential lever for action. Teachers are asked, “About how much time in total do you spend with this class on science instruction in a typical week?”: less than 1 hour, 1-1.9 hours, 2-2.9 hours, 3-3.9 hours, 4 hours or more.
b) Note: A similar measure is available at the 8th-grade level, with different response categories. 8
th-
grade teachers are asked the same question, with the following response options: less than 1 hour, 1-2.9 hours, 3-4.9 hours, 5-6.9 hours, 7 hours or more.
c) Data is available every four years (next in 2015) by state, nation, gender, race/ethnicity, income, and special population. Data is unavailable for geographies smaller than the state level (Source: Science Assessment, National Assessment of Educational Progress).
2) Interest in science
Percent of 4th-grade students
who like studying science
Late elementary
(4)
a) Provides an early measure of interest. 4th-grade students are asked: “How much do you like studying
science?”: very little, some, quite a bit, very much.
b) Note: 8th-grade students are asked a similar question, to indicate their level of agreement with the
following statement: “Please indicate how much you disagree or agree with the following statements about science: I like science”: strongly agree, agree, disagree, strongly disagree.
c) Ideally, a consistent interest measure would be available at multiple points along the cradle-to-career continuum to facilitate more direct comparisons of changes in STEM interest over time. This has been identified as an area of data need. In the absence of a consistent measure, this indicator may be viewed in association with participation in science activities not for school work in middle school and interest/ability in high school to facilitate understanding of when students leave the continuum due to lack of interest or opportunities which may build interest in STEM.
d) Data is available every four years (next in 2015) by state, nation, gender, race/ethnicity, income, and special population. Data is unavailable for geographies smaller than the state level (Source: Science Assessment, National Assessment of Educational Progress).
3) 5th
-grade MCA science scores Percent of 5
th-grade students
meeting or exceeding state standards in science
Late elementary
(5)
a) Measure of whether 5th-grade students meet the state science standards for grades 3-5, which address
the nature of science and engineering, physical science, earth and space science, and life science.
b) Data is available annually by state, district, school, race, gender, income, mobility, and special population (Source: Minnesota Comprehensive Assessments-III, Minnesota Department of Education).
Wilder Research, May 14, 2013 Page 2 of 14
Name of measure Segment of continuum
Reason(s) for inclusion/caveats
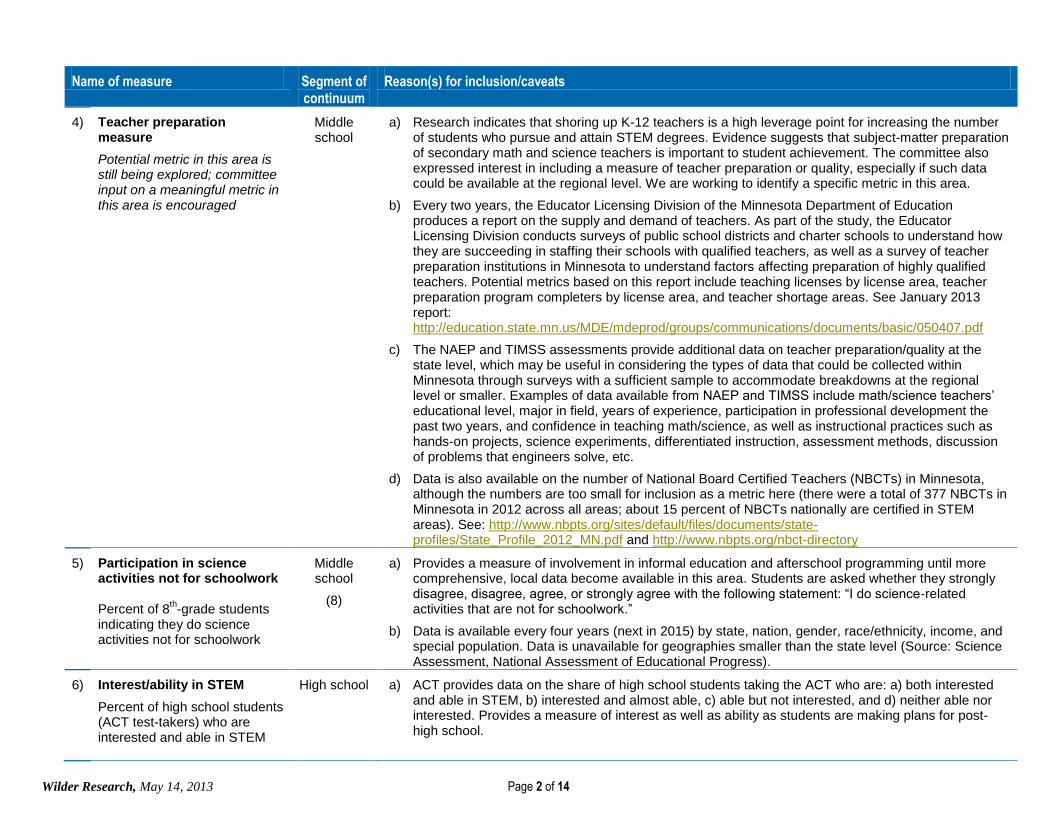
4) Teacher preparation measure
Potential metric in this area is still being explored; committee input on a meaningful metric in this area is encouraged
Middle school
a) Research indicates that shoring up K-12 teachers is a high leverage point for increasing the number of students who pursue and attain STEM degrees. Evidence suggests that subject-matter preparation of secondary math and science teachers is important to student achievement. The committee also expressed interest in including a measure of teacher preparation or quality, especially if such data could be available at the regional level. We are working to identify a specific metric in this area.
b) Every two years, the Educator Licensing Division of the Minnesota Department of Education produces a report on the supply and demand of teachers. As part of the study, the Educator Licensing Division conducts surveys of public school districts and charter schools to understand how they are succeeding in staffing their schools with qualified teachers, as well as a survey of teacher preparation institutions in Minnesota to understand factors affecting preparation of highly qualified teachers. Potential metrics based on this report include teaching licenses by license area, teacher preparation program completers by license area, and teacher shortage areas. See January 2013 report: http://education.state.mn.us/MDE/mdeprod/groups/communications/documents/basic/050407.pdf
c) The NAEP and TIMSS assessments provide additional data on teacher preparation/quality at the state level, which may be useful in considering the types of data that could be collected within Minnesota through surveys with a sufficient sample to accommodate breakdowns at the regional level or smaller. Examples of data available from NAEP and TIMSS include math/science teachers’ educational level, major in field, years of experience, participation in professional development the past two years, and confidence in teaching math/science, as well as instructional practices such as hands-on projects, science experiments, differentiated instruction, assessment methods, discussion of problems that engineers solve, etc.
d) Data is also available on the number of National Board Certified Teachers (NBCTs) in Minnesota, although the numbers are too small for inclusion as a metric here (there were a total of 377 NBCTs in Minnesota in 2012 across all areas; about 15 percent of NBCTs nationally are certified in STEM areas). See: http://www.nbpts.org/sites/default/files/documents/state-profiles/State_Profile_2012_MN.pdf and http://www.nbpts.org/nbct-directory
5) Participation in science activities not for schoolwork Percent of 8
th-grade students
indicating they do science activities not for schoolwork
Middle school
(8)
a) Provides a measure of involvement in informal education and afterschool programming until more comprehensive, local data become available in this area. Students are asked whether they strongly disagree, disagree, agree, or strongly agree with the following statement: “I do science-related activities that are not for schoolwork.”
b) Data is available every four years (next in 2015) by state, nation, gender, race/ethnicity, income, and special population. Data is unavailable for geographies smaller than the state level (Source: Science Assessment, National Assessment of Educational Progress).
6) Interest/ability in STEM
Percent of high school students (ACT test-takers) who are interested and able in STEM
High school a) ACT provides data on the share of high school students taking the ACT who are: a) both interested and able in STEM, b) interested and almost able, c) able but not interested, and d) neither able nor interested. Provides a measure of interest as well as ability as students are making plans for post-high school.
b) In 2012, 74 percent of high school graduates in Minnesota took the ACT. Data are based on ACT scores and self-reported information on interest at ACT registration. “Able” is defined as meeting ACT math and science college readiness benchmarks. “Almost able” reflects meeting one of the two benchmarks. ACT’s college readiness benchmarks are the minimum ACT scores required for students to have a high probability of success in credit-bearing college courses (college algebra, biology, English composition, or social sciences courses). Students who meet a benchmark have approximately a 50 percent chance of earning a B or better and approximately a 75 percent chance of earning a C or better in the corresponding college course or courses. Interest is based on students’ choice of college major and how confident they were in that choice (Source: American College Testing).
c) Data is available annually by gender, race/ethnicity, income, special population, state, region, county, and school district.
7) Postsecondary certificate/degree completion by field and award level Number of students completing a certificate or degree program by STEM field of study
College, career & job
training
a) Provides data on multiple STEM career pathways, including college degree programs and sub-baccalaureate certificates.
b) Data is available by STEM field (e.g., computer and information sciences, engineering and engineering technologies, biological and biomedical sciences, mathematics and statistics, physical sciences, and science technologies), as well as by specific degree program (e.g., aerospace engineering, agricultural engineering, chemical engineering, etc.).
c) Data is available annually by field of study, program, award level, gender, race/ethnicity, state, region, and institution (Source: National Center for Education Statistics).
8) Employment in STEM occupations by age Number of workers by STEM occupation and age group
a) Looking at employment by occupation within age groupings provides a measure of career success, reflecting early-, mid-, and late-career employment. Further stratifying data by gender and race/ ethnicity may provide a measure of how these groups fare in individual STEM occupations over time.
b) Reflects a variety of STEM career pathways, including scientists and technicians.
c) Data is available annually by state, region, county level, occupation, age group, gender, and race/ethnicity. Data originate from the American Community Survey, an ongoing survey of the U.S. Census Bureau (Source: Integrated Public Use Microdata Series).
9) Occupational projections in STEM fields Percent employment change projected in STEM fields
College, career & job
training
a) Provides projections of how many STEM workers will be needed in the coming decade, based on expected job increases and decreases during the projection period. Combined with key measures related to postsecondary certificate/degree completion and employment by occupation, provides a picture of demand- as well as supply-side issues.
b) 10-year forecasts updated every other year. Available by state, six Minnesota regional planning areas, occupation groups, and detailed occupations (Source: Minnesota Department of Employment and Economic Development).
Wilder Research, May 14, 2013 Page 4 of 14
OTHER “HELPING” MEASURES ON MINNESOTA COMPASS
Name of measure Section of Compass
Reason(s) for consideration as a helping measure
1) Kindergarten readiness
Percent of beginning kindergarteners meeting or exceeding school readiness standards
Early childhood
Readiness assessments currently differ across districts; statewide readiness study conducted in Fall 2010 – sample of 12 percent of all elementary schools, with some races/ethnicities and special populations underrepresented, and only available at state level. If more complete data from a statewide readiness assessment become available in the future, this measure may be added.
2) 3rd
-grade reading scores
Percent of 3rd
-grade students meeting or exceeding state standards in reading
Education May be a predictor of future academic success: most students are learning to read through 3rd
grade, but begin “reading to learn” in 4
th grade – to gain information and think critically in all other subject areas.
Viewing reading as a context measure is also consistent with the integrated view of STEM learning in which STEM subjects are taught in an interdisciplinary manner and viewed as enhancing learning in other areas.
See: www.mncompass.org/education/
3) 8th
-grade math scores
Percent of 8th-grade students
meeting or exceeding state standards in math
Education Measure of whether students are meeting state standards in the areas of number and operation, algebra, geometry and measurement, and data analysis and probability. Challenging high school coursework requires a solid foundation in basic skills. Students who end middle school behind in math and science are ill-prepared to engage in more advanced STEM learning as they progress through school.
The September 2012 Minnesota Compass education advisory group provided feedback that 8th-grade math
scores are an indicator of high school preparation, whereas monitoring 11th-grade scores may come “too late”
for educators to develop effective interventions.
See: www.mncompass.org/education/
4) Enrichment activities
Percent of 6th-, 9
th-, and 12
th-
graders participating in enrichment activities three or more days per week
Children & Youth
Measure of share of students who are highly engaged in out-of-school opportunities, including fine arts activities, club/community sports, school sports, community programs, mentoring programs, religious activities, service learning, and tutoring/academic activities. Participation in quality out-of-school time (OST) activities has been associated with better school attendance, grades, test scores, and interpersonal skills, as well as higher aspirations for college and reduced dropout rates. While not STEM-specific, provides a measure of what share of students have access to enrichment activities three times a week or more, a threshold more likely to create positive outcomes.
Note: Measure comes from the Minnesota Student Survey, which was revised and administered to grades 5, 8, 9, and 11 in 2013. This key measure will be revised as needed based on survey changes.
A new National Assessment of Educational Progress (NAEP) Technology and Engineering Literacy assessment is being implemented for the first time to a national sample in 2014. The assessment will provide a measurement of the “T” and “E” in STEM, including how well students can apply their understanding of technology principles to real-life situations. For purposes of the assessment, technology and engineering literacy is defined as “the capacity to use, understand, and evaluate technology as well as to understand technological principles and strategies needed to develop solutions and achieve goals.”
Students are categorized into three achievement levels: basic, proficient, and advanced. Data is available by nation, gender, race/ethnicity, income, and special population. The 2014 assessment will be administered to 8th-grade students. In the future, the assessment may also be administered to students in grades 4 and 12. This may be a good data source to consider in the future, but only national-level results will be available from the 2014 administration (Source: Technology & Engineering Literacy Assessment, National Assessment of Educational Progress).
See also: http://nces.ed.gov/nationsreportcard/tel/
2) Career exploration (e.g., career education and exploration in middle and high school; student understanding of career pathways; what moves individuals from interest to pursuing careers)
There are many factors that may play into a student’s exposure to and pursuit of STEM career pathways, such as the influence of role models, out-of-school experiences, caregivers’ backgrounds, and career information and exposure to various career options. A statewide measure on students’ exposure to and exploration of STEM career pathways has been identified as an area of data need. However, there are some existing data that may be of interest in this area.
The ACT EXPLORE test is designed to help 8th- and 9
th-grade students explore a range of options for their future
and prepare for high school coursework as well as post-high school choices. The test includes a career-exploration component. The ACT PLAN test helps 10
th-grade students measure their academic development, explore career
and training options, and plan for the remainder of high school and beyond.
EXPLORE and PLAN are part of ACT’s Educational Planning and Assessment System (EPAS), a set of assessments designed to provide a longitudinal, systematic approach to educational and career planning, assessment, instructional support, and evaluation. Students are given the EXPLORE assessment in 8
th or 9
th grade,
the PLAN assessment in 10th grade, and the ACT in 11
th or 12
th grade.
Use of these assessments and their results may serve as indicators in this area. EXPLORE and PLAN data are currently provided by some districts. It may be possible that statewide data could be available through special request from ACT. We have sent a request to ACT to inquire about the extent to which these assessments are used in Minnesota.
Additionally, the Minnesota Compass site can provide links to individual studies or initiatives that may shed light on factors that influence pursuit of STEM careers. For example, a proposal submitted by Wilder Research which is currently under consideration by the National Science Foundation would involve a longitudinal study of student STEM pathways in K-12 and beyond.
See also: http://www.act.org/explorestudent/tests/epas.html
3) Science and Engineering Indicators (SEI)
SEI provides indicators on the U.S. and international science and engineering enterprise. SEI is prepared by the National Science Foundation’s National Center for Science and Engineering Statistics (NCSES) under the guidance of the National Science Board.
Data is available at the state level on science and technology education, the employed workforce, finance, and research and development. Data is not available for smaller geographies. The education and workforce key measures proposed here are from data sources providing more detailed breakdowns for Minnesota.
See also: http://www.nsf.gov/statistics/seind12/
4) Advanced coursework in high school (e.g., Advanced Placement (AP), Post-Secondary Enrollment Options (PSEO), College in the Schools)
High school students who take advanced math and science courses are more likely to enroll in college, pursue math and science majors, and complete a bachelor’s degree. Although raised by the STEM advisory committee, this indicator was not suggested as frequently as other recommended indicators. The committee advised the importance of reflecting all students, including those who are not high-achievers, in the indicator framework. Monitoring levels of proficiency and completion of certificates and degrees affords data on a variety of students and STEM pathways.
State-level data on advanced course-taking is available online. The College Board and Science and Engineering Indicators (SEI) provide data on successful completion of AP exams. The Minnesota Office of Higher Education also provides data on AP and PSEO enrollment.
See also: http://www.ohe.state.mn.us/sPagesOHE/dataMenu.cfm; www.collegeboard.com; http://www.nsf.gov/statistics/seind12/
5) Trends in International Mathematics and Science Study (TIMSS)
TIMSS provides data on the mathematics and science achievement of U.S. 4th- and 8
th-grade students compared to
that of students in other countries. Minnesota’s participation in 2011 as a benchmarking state was at the 8th-grade
level. TIMSS also collects data on math and science teacher preparation, student perceptions of math/science, hours per year spent on math/science instruction, and school resources.
Data are available only every 4 years and not for geographies smaller than the state. Provides key information on international comparisons but did not rise to the top of recommendations for indicators for this project.
See also: nces.ed.gov/timss/
6) Minnesota P-20 Statewide Longitudinal Data System (SLEDS)
Minnesota is developing a statewide longitudinal data system that will allow for the matching of student data from pre-kindergarten through completion of postsecondary. SLEDS will facilitate cohort analyses of groups of students over time. SLEDS is currently at an early stage of development, but is something that can be considered in the future.
See also: http://www.ohe.state.mn.us/mPg.cfm?pageID=1935&1534-D83A_1933715A
7) Attendance While a valuable indicator, the proposed key measures were recommended more frequently by the committee. The recent Minnesota Compass education advisory group also recommended removing 9
th-grade attendance as a key
measure in the education section of the site. Attendance data are also available from the Minnesota Department of Education.
See also: http://education.state.mn.us/MDE/Data/index.html
8) Reading Third-grade reading scores are a key measure in the education section of Minnesota Compass and available as a helping measure which can supplement the more STEM-specific measures chosen for this section.
See also: http://www.mncompass.org/education/; http://education.state.mn.us/MDE/Data/index.html
9) “Soft” skills Several recommendations were received related to monitoring “soft skills” or the interpersonal and noncognitive skills that matter to 21
st Century employers, such as teamwork, leadership, mindset, and persistence or “grit.”
Additionally, some research exists on skills needed for success in STEM fields (e.g., engineering). While recognizing the importance of development of skills in other areas, the focus of this work is on identifying a set of measures that are STEM-specific. Inclusion of a measure related to participation in science activities not for schoolwork is in part due to recognition of the role these activities can play in development of noncognitive skills important in STEM.
One table specifically noted the relevance of measures of problem-solving and group work after grade 3. Although they cannot be broken down into smaller geographies within Minnesota, some statewide measures of teamwork, such as the frequency with which students work with others on science projects, find different ways to solve a problem, and do math in small groups, are available at the 4
th- and 8
th-grade level online through the NAEP Data Explorer.
See also: http://nces.ed.gov/nationsreportcard/naepdata/
10) Postsecondary retention/re-entry Research suggests that preventing attrition from STEM undergraduate majors is a key leverage point with potential for substantial return on investment. STEM certificate/degree completion is proposed as a key measure as an indicator of success in these programs. Individuals who return to postsecondary programs and complete a STEM certificate or degree would be reflected in this measure.
11) Connections between formal and informal school day Alignment between in-school and afterschool STEM activities
Initiatives such as the Sprockets Shared Database in Saint Paul will facilitate increased understanding of the ways in which out-of-school time (OST) programs complement formal education, and the extent of students’ involvement in such programs. Currently, a statewide system for tracking involvement in OST activities does not exist. However, proposed key measures include a measure of involvement in science activities not for school work which is available from a national source (NAEP). Data on involvement in extracurricular activities is also available from the Minnesota Student Survey (see helping measures above), but is not STEM-specific.
Additionally, the Minnesota Compass site can provide links to individual studies or initiatives that may shed light on this issue. For example, a proposal submitted by Wilder Research which is currently under consideration by the National Science Foundation would test a new model for aligning informal with formal STEM learning experiences in a school district.
See also: http://sprocketssaintpaul.org/program-providers/shared-data-system
12) Youth development opportunities Initiatives such as the Sprockets Shared Database described above will provide more detailed data on the content and impact of OST opportunities. More detailed, STEM-specific statewide data on OST programming has been identified as a potential data need. However, a proposed key measure which is currently available would provide data on overall involvement in science activities not for schoolwork. Additionally, an existing key measure in the children and youth section of Minnesota Compass provides Minnesota Student Survey data on participation in a variety of enrichment activities (e.g., mentoring programs, service learning), although they are not STEM-specific.
See also: http://www.mncompass.org/childrenyouth/
13) Application of STEM topics Once available, the NAEP Technology and Engineering Literacy assessment (see above) will provide a measure of how well students can apply their understanding of technology principles to real-life situations. The new assessment is being administered for the first time to a national sample in 2014. State-level results are not planned for the 2014 administration. This may be a good data source to consider in the future.
See also: http://nces.ed.gov/nationsreportcard/tel/
14) Transfer of skills In addition to application of skills, students’ ability to transfer STEM skills from one context to another was raised as a possible indicator. This has been identified as a potential data need. Once available at the state level, we may want to review the NAEP Technology and Engineering Literacy assessment for whether it could provide a valuable indicator in this area.
See also: http://nces.ed.gov/nationsreportcard/tel/
15) Experiential learning Experiential learning is reflected within broader measures, including the proposed key measure tracking participation in science activities not for school work as well as the existing helping measure related to involvement in enrichment activities. A statewide measure specifically focused on STEM-specific experiential learning was not identified, however, and has been noted as a potential data need.
16) Anecdotal data Life story information
The focus of this project is on identifying quantitative data in the form of indicators to track over time. However, qualitative data facilitate deep understanding of students’ experiences and can shed light on quantitative data. There may be the possibility to access some qualitative data through report and information links provided on the site, including reports prepared by Wilder Research. Wilder Research studies employ a variety of research methods and very frequently include qualitative as well as quantitative information.
See also: www.wilder.org/Wilder-Research/Research-Areas/
17) Remedial work in STEM
Math remediation in college
A report by Minnesota State Colleges and Universities (MnSCU) and the University of Minnesota found that of all developmental credits taken by 2008 Minnesota public high school graduates attending MnSCU, 50 percent were in math. Almost all taken by those attending University of Minnesota campuses were in math. Data is only available for Minnesota high school graduates who enroll in a public institution of higher education.
While this is a meaningful indicator, it was not among those most frequently recommended by the advisory committee. Completion of STEM certificate and degree programs is proposed here as a measure of postsecondary success.
See also: http://www.mnscu.edu/media/publications/pdf/gettingprepared10.pdf
18) Personal connections to STEM Proposed key measures include interest in science in elementary school, participation in science activities not for schoolwork in middle school, and interest and ability in STEM in high school, which may be indicators of students’ development of personal connections to STEM. However, a statewide measure directly measuring students’ perceptions of their personal connections to STEM was not identified and has been noted as a potential data need.
Although they cannot be broken down into smaller geographies within Minnesota, the TIMSS instrument provides some statewide measures related to personal connections with STEM. Examples include attitudes toward, self-perception of, and perceived value of science (TIMSS).
See also: nces.ed.gov/timss/
19) STEM program opportunities Availability of and variations in STEM program resources is an important indicator of opportunity gaps. A statewide inventory of STEM programs does not currently exist and has been identified as a potential data need. In 2011, Wilder Research conducted a St. Paul-area inventory of 171 STEM programs and organizations. Development of the St. Paul-area inventory was supported by STARBASE Minnesota and is available on STARBASE Minnesota’s website (see below).
Proposed key measures include participation in science activities not for schoolwork, which may serve as a proxy to some extent for understanding program opportunities, although this data is not available for geographies smaller than the state level. Proposed measures also include an indicator of opportunities to learn STEM in school, in the form of instructional time spent on science.
See also: http://www.starbasemn.org/STEM_Directory.pdf
20) Access to technology While access to technology is an important input and lever for action, a key measure related to teacher preparation was proposed as a higher-priority key measure. Studies suggest that teacher quality accounts for variations in student achievement more than any other school-based factor.
The NAEP and TIMSS assessments provide some state-level data on access to technology as well as other school resources related to instruction of science and math (e.g., school science laboratories, computerized science labs, classroom tablet PCs, audiovisual materials for teaching science, school science kits, home computer, etc.).
See also: nces.ed.gov/timss/; nces.ed.gov/nationsreportcard/
21) High school technical education Proposed key measures include an indicator of successful completion of STEM technical and academic degree programs following high school. Measures of availability of technical education courses as well as advanced coursework (e.g., AP, PSEO) in high school would be a meaningful indicator of opportunities at that point in the continuum, but were not cited as frequently as other indicators. Proposed key measures reflect the importance of understanding successful completion of a variety of STEM educational pathways following high school.
Data on high school and postsecondary career and technical education is available from the National Center for Education Statistics’ (NCES) Career/Technical Education (CTE) Statistics system. The Minnesota Department of Education also collects data on CTE programs from districts receiving Carl D. Perkins funds.
See also: nces.ed.gov/surveys/ctes/index.asp
22) Patents The number of patents held by Minnesota companies may indicate the level of research, development, and innovation in those sectors. While an important indicator of innovation, broader workforce indicators were proposed for purposes of this project.
23) Culture of innovation Data on academic and employment cultures supportive of innovation has been identified as a potential data need. The number of patents held by Minnesota companies (see above) would be one way of measuring innovation, however.
24) Availability of and success in STEM coursework (e.g., number of STEM courses; grades in STEM courses; number of schools where courses available)
A number of possible measures of STEM course availability, completion, and success were raised, including availability and completion of specific types of STEM courses (e.g., computer science). An indicator related to classroom time spent on science instruction at the elementary school level was recommended as an early indicator of formal STEM learning opportunities that would apply to all students.
Statewide school-level data on availability of specific STEM courses would be valuable information to those assessing opportunity gaps within formal education, and has been identified as a possible data need.
25) Everyday life measures Caregivers’ background in and comfort with STEM
The committee emphasized the importance of recognizing out-of-school factors that influence students’ opportunities, interests, and abilities in STEM. Examples include access to technology at home and parents’ comfort with STEM subjects. Proposed key measures include a measure of participation in science activities not for school work, in addition to measures of interest. Minnesota Student Survey data on engagement in enrichment activities (not STEM-specific) is also available from the children and youth section of the Minnesota Compass website. TIMSS also provides data on students’ home educational resources to support math/science learning.
See also: http://www.mncompass.org/childrenyouth/; nces.ed.gov/timss/
26) Mentoring and role models Mentors and role models can help students see themselves in STEM and understand and pursue potential STEM career pathways. A data measure related to student exposure to STEM-specific mentorship or role models was not identified and has been noted as a possible data need. The children and youth section of Minnesota Compass provides Minnesota Student Survey data on students’ involvement in extracurricular activities, including mentoring programs (but not STEM-specific).
See also: http://www.mncompass.org/childrenyouth/
27) Growth in math content areas A measure of growth in math content areas from grades 4-8 was suggested by the committee, although was not among the most frequent recommendations. The 8
th-grade math measure currently available through the education
section of Minnesota Compass is recommended for inclusion here. Compass also provides the overall proportion of Minnesota students achieving math standards at each grade level (3-8 and 11). In lieu of growth within specific content areas, this data facilitates monitoring of overall math proficiency by grade level as well as within detailed demographic and geographic breakdowns at the 8
th-grade level. Overall growth in math is available through the
Minnesota Department of Education website.
See also: http://www.mncompass.org/education/; http://education.state.mn.us/MDE/Data/
28) Leadership positions A statewide measure of involvement in leadership positions in high school or postsecondary was not identified and has been noted among potential areas of data need.
29) School funding by STEM area (S, T, E, M)
A data source on school funding by STEM area was not identified and has been noted as a possible area of data need. However, TIMSS provides statewide data on math/science resource shortages at the 8
th-grade level,
availability of computers and resources for conducting science experiments, instructional time spent on math/science, and resources used by math/science teachers.
See also: nces.ed.gov/timss/
30) How skills come together Although a data source specific to how STEM skills come together was not identified, in the future the committee may want to consider inclusion of an indicator from the NAEP Technology and Engineering Literacy assessment as a way of rounding out areas of STEM covered across the indicators as well as providing a measure of application of understanding of technology principles. Understanding how STEM skills come together has been identified as a potential data need.
See also: http://nces.ed.gov/nationsreportcard/tel/
31) Good STEM mindset Proposed key measures include indicators of interest in STEM at multiple points on the continuum. TIMSS also provides statewide data related to students’ STEM mindset, including the proportion of students who like learning math/science, value math/science, and are confident in math/science. Other measures specific to STEM mindset were not identified.
32) Workplace exposure A statewide data measure related to students’ exposure to STEM workplaces was not identified, and has been identified as a potential data need.
33) Lifelong learning The recommended postsecondary education measure would capture completion of formal education programs (certificates and degrees) at any point in an adult’s life, although it is not provided by age and would not capture informal learning opportunities throughout life. A broad measure of lifelong learning was not identified.
34) Layoffs Data on major layoffs in Minnesota is available from the Minnesota Department of Employment and Economic Development website. Occupational projections was proposed as a key measure to provide an indicator of overall need by STEM occupation.
See also: http://www.positivelyminnesota.com/Data_Publications/Data/index.aspx
35) Curricular coherence Sequences of concepts
An indicator/statewide data source in this area was not identified. Although only a point-in-time look, it may be worth noting that TIMSS provides data on the proportion of 8
th-grade students taught the TIMSS science topics (20 topics)
and math topics (19 topics).
See also: nces.ed.gov/timss/
36) STEM integration The committee suggested a variety of measures around STEM integration, such as teacher understanding/comfort with STEM integration, professional development in STEM integration, availability of integrated STEM opportunities for students, and student understanding of the integration of STEM disciplines. A credible statewide measure of STEM integration was not identified; due to the number of recommendations received in this area, this has been identified as an area of data need.
37) Early STEM exploration An indicator/statewide data source on early STEM exploration was not identified. An area of data need may be a consistent measurement of participation in out-of-school STEM experiences as well as interest in STEM at multiple points along the continuum, including at early ages. It would also be valuable to gather information on the specific types of STEM experiences students were exposed to. Early STEM exploration has been identified as a potential data need.
38) Choices students make Influencing personality traits (e.g., self-learning, initiative)
There is interest in greater understanding of students’ choices along the STEM continuum and factors influencing their choices. For example, potential influencers might include other potential metrics raised by the committee, such as students’ initiative, self-learning, and fun, as well as courses, interest, and other factors. Although it is currently at an early stage of development, the SLEDS database will facilitate cohort analyses following students over time and may be something to consider in the future.
Additionally, the Minnesota Compass site can provide links to individual studies or initiatives that may shed light in this area. For example, a proposal submitted by Wilder Research which is currently under consideration by the National Science Foundation would involve a longitudinal study of student STEM pathways.
39) Language acquisition/culture The committee raised language acquisition (vocabulary) and culture as important factors to consider in students’ development and progression in STEM, although not as frequently as other suggested indicators. Although the proposed key measures do not include a measure specific to language acquisition or culture, we will provide breakdowns by limited English proficiency where available. Performance data for identified measures are not readily available by home language at present, although it is possible it could be available by special request in some cases and that this could be explored in the future.
One of the proposed key measures would track the amount of classroom time spent on science instruction at the elementary level. A single measure related to the content of students’ instruction and how they are being instructed did not rise to the top of the recommendations, although there clearly seems to be interest in data related to instruction of integrated STEM and hands-on/experiential learning opportunities. These have been identified as potential areas of data need.
TIMSS and NAEP do provide some statewide data related to content/instruction of science and math (e.g., teaching the TIMSS math/science topics, instructional activities in math class, emphasis on science investigation, resources used by math/science teachers, emphasis on Algebra, use of calculators, etc.).
See also: nces.ed.gov/timss/; nces.ed.gov/nationsreportcard/
ADDITIONAL SUGGESTIONS FROM MEETING 1 (APRIL 2, 2013)
Suggestion Additional thoughts
1) Use systems thinking Based on the committee’s input, a logic model and visual were developed which reflect systems thinking, factoring a variety of in-school and out-of-school factors that influence STEM outcomes. The logic model was developed based on a literature review of STEM cradle-to-career benchmarks. Proposed key measures include system indicators such as teacher preparation, classroom time spent on science, and occupational needs in addition to student and worker outcomes.
2) Go further than early career The cradle-to-career framework has been revised to extend into mid-career, based on advisors’ input regarding the need to navigate multiple career pathways in many cases and issues that can affect mid-career decisions and advancement.
3) Reflect alternate pathways in STEM
The proposed postsecondary certificate/degree-completion measure reflects multiple pathways in STEM, including pursuit of certificates in STEM as well as college degree programs. The proposed employment measure also reflects a variety of STEM occupations.
4) Use both growth and scale scores
The Minnesota Growth calculation is performed based on MCA math and reading accountability assessments, assigning students to a low, medium, or high growth level based on a comparison of individual students’ current-year assessments to previous-year assessments. The science MCA is not included in the growth calculation. Providing growth data on MCA measures did not rise as a priority in the recent Compass education advisory group, but can be considered in the future based on input in this area. Growth in math and reading are available from the Minnesota Department of Education website.
5) Include students who are not high-achievers
Based on committee input, we have also intentionally proposed a variety of key measures to reflect different pathways, competencies, and interest. For example, monitoring various levels of proficiency and completion of certificates and degrees affords data on a variety of students and STEM pathways.
6) Provide breakdowns by language Minnesota Compass currently provides test score data on students with limited English proficiency. Math and science Minnesota Comprehensive Assessment (MCA) results would be provided for this population, as would other key measures where possible. Performance data for identified measures are not readily available by home language at present, although it is possible it could be available by special request in some cases and that this could be explored in the future.
7) Provide breakdowns by gender, race/ethnicity, and region
As a standard practice, Minnesota Compass provides data in these breakdowns where available. The available breakdowns vary by data source, and are described for each proposed key measure above.
8) Include formal and informal measures
Proposed key measures reflect both formal and informal education based on available data. Data needs have also been identified based on the importance of informal education opportunities in STEM and need for additional data in this area.
8) Consider changing measures over time
As a general practice, Minnesota Compass reconvenes advisory groups for each topic area every few years to consider the current measures and any changes that should be made. Consistent with this practice, the intent is that we would also reconvene a STEM advisory group in the future to ensure continued relevancy of the site and indicators.
9) Reflect process and improvement/indicators that are change agents
Proposed key measures include inputs, outputs, and outcomes, recognizing the committee’s interest in monitoring key “levers” for impacting STEM outcomes as well as tracking the outcomes themselves.
10) Consider segments of the continuum
Based on the committee’s input, several changes were made to segments of the continuum. PreK was broadened to “Early childhood”; K-5 was separated into “Early elementary” (K-2) and “Late elementary” (3-5); post-secondary was changed to “College, career, and job training” to reflect multiple pathways; and early career was lengthened to “Early-mid career.”
11) Make connections between indicators
Based on the committee’s input, a logic model was developed to provide a cohesive framework for proposed key measures. The logic model was developed based on a literature review of STEM cradle-to-career benchmarks.
12) Include key measures that are just under the surface
The committee provided feedback that it would be valuable to track more than just a few primary indicators. While maintaining the project’s goal of providing focused information that will allow stakeholders to quickly assess progress on key measures and inform actions, we expanded the number of proposed key measures based on the committee’s input.
13) Provide information and links re: high-impact practices
We plan to conduct a literature review of best practices following the second advisory meeting, and to provide brief summaries and links to original sources on the website. This will enable stakeholders to consider how to act on the data provided by key measures.
14) Reflect technology The committee noted that existing data typically reflect the S, E, and M of STEM and not the T. For this reason, in the future the committee may want to consider adding an indicator from the NAEP Technology and Engineering Literacy assessment, which will be administered to a national sample for the first time in 2014.
15) Capture barriers to success and drop-off points
The proposed key measures are intended shed light on where students drop off the STEM continuum, based on their proficiency, interest, involvement in activities not for schoolwork, and educational and career choices. These data will also be provided by various demographic and geographic breakdowns. Proposed input and output measures (classroom time spent on science, teacher preparation, participation in science activities not for school work, and occupational projections) would provide data on important opportunities (or barriers in their absence) pertinent to success in STEM.
It should be noted, though, that an area of data need identified through this project is a consistent measure that is available at multiple points along the STEM continuum. For example, asking Minnesota students a question related to STEM interest at multiple grade points would facilitate a longitudinal perspective of when students fall off the continuum based on their interest in STEM.
Wilder Research, May 14, 2013 Page 14 of 14
Suggestion Additional thoughts
16) Rely on earlier MCA measures if they are predictors of later scores
The committee advised that key measures should not exclusively reflect standardized tests. One new key measure from the MCAs is proposed here – 5
th-grade science scores – in addition to the 8
th-grade math measure already
available on the Minnesota Compass site. While a variety of measures were proposed based on the committee’s input, we felt it was important to include one measure from the state’s science assessment. The proposed measure reflects the earliest grade level at which the test is given, recognizing that later measures may be viewed as “too late” to take action.
We are not aware of a formal study of early MCA scores predicting later MCA scores, but an analysis by the Human Capital Research Collaborative found that results on the Minnesota School Readiness Study (administered to kindergartners) were predictive of MCA proficiency outcomes at grade 3 in both reading and math.
See also: http://humancapitalrc.org/mn_school_readiness_indicators.pdf
17) Consider predictors of success in adulthood Consider predictors of success as engineers
Due to this project’s focus on choosing a limited number of indicators, the proposed key measures are broader, STEM-specific measures, although it is recognized that there are specific skills and experiences which are important to success in STEM fields (e.g., ability to function on multidisciplinary teams).
Research and guidelines exist which reflect important indicators of success in STEM, and which can provide valuable resources in considering future measurement of specific skills/experiences that are important to successfully pursuing STEM pathways (e.g., Academic Pathways Study of engineering education, student outcomes required by the Engineering Accreditation Commission of ABET for students in engineering degree programs).
See also: http://www.engr.washington.edu/caee/about_APS.html; http://www.abet.org/accreditation-criteria-policies-documents/
18) Reflect academic, technical, and interpersonal skills
Care was taken to propose key measures that reflect the diverse skills and experiences important in STEM, and variety of STEM pathways, within the context of existing data sources. Proposed indicators include measures of proficiency, interest, a variety of college and career pathways, as well as out-of-school time science activities, which may promote important academic, technical, and interpersonal skills.