1 www.communityschools.org www.iel.org Step 6: Decide what data to collect. The data you collect should be aligned with the results you selected in Steps 3 and 4. To establish what data to collect, determine what you need to measure to assess whether or not you are achieving your results. Table D (page 24) lists specific indicators for each result in the LM. Access the research on indicators here, by clicking on the results: http://www.communityschools.org/results/default.aspx . Use Table E (page 24) to decide on indicators that will help you measure the progress your community school is making towards the chosen results. Reading Table D: What you need to know 1. Anticipated Results = Results from the LM 2. Student & Family Indicators = Individual measures for students and families. 3. School, Community, and System Indicators = Measures for the whole school, school system, or community. 4. Data Collection = Where and how can you get the data (i.e. the data source and the collection method)? The numbers listed correspond to specific surveys. A chart listing all of the surveys available appears in the appendix and can also be found here: http://www.communityschools.org/resources/data_collection_instrument_guide.aspx . Evaluation Example: Community Learning Centers‐ Lincoln, Nebraska The Lincoln Community Learning Centers (CLC) used case studies to tell the stories of youth and communities in a more personalized way. They collected data on the students’ activities during their evaluation and met with the students to write case studies. CLC teachers selected two students to follow throughout the year, holding discussions about the students as part of a regular team meeting. The process began in November and the case studies were completed in early May. The CLC case study development protocol and two sample case studies can be found here: http://www.communityschools.org/resources/community_school_evaluation_toolkit_resources.aspx . Contact: Lea Ann Johnson, Lincoln Community Learning Centers, [email protected]
Transcript
1 www.communityschools.org
www.iel.org
Step 6: Decide what data to collect. The data you collect should be aligned with the results you selected in Steps 3 and 4. To establish what data to collect, determine what you need to measure to assess whether or not you are achieving your results. Table D (page 24) lists specific indicators for each result in the LM. Access the research on indicators here, by clicking on the results: http://www.communityschools.org/results/default.aspx. Use Table E (page 24) to decide on indicators that will help you measure the progress your community school is making towards the chosen results. Reading Table D: What you need to know
1. Anticipated Results = Results from the LM 2. Student & Family Indicators = Individual measures for students and families. 3. School, Community, and System Indicators = Measures for the whole school, school
system, or community. 4. Data Collection = Where and how can you get the data (i.e. the data source and the
collection method)? The numbers listed correspond to specific surveys. A chart listing all of the surveys available appears in the appendix and can also be found here: http://www.communityschools.org/resources/data_collection_instrument_guide.aspx.
Evaluation Example: Community Learning Centers‐ Lincoln, Nebraska The Lincoln Community Learning Centers (CLC) used case studies to tell the stories of youth and communities in a more personalized way. They collected data on the students’ activities during their evaluation and met with the students to write case studies. CLC teachers selected two students to follow throughout the year, holding discussions about the students as part of a regular team meeting. The process began in November and the case studies were completed in early May. The CLC case study development protocol and two sample case studies can be found here: http://www.communityschools.org/resources/community_school_evaluation_toolkit_resources.aspx. Contact: Lea Ann Johnson, Lincoln Community Learning Centers, [email protected]
EvaluatLike maas a keystudentmore lik To help involvemthe Shothe ratesResult: results.)
In orderimplemCoffee, fifth gra To answincludintutoringclass, beschool a Evaluatperform
For examcontribu
http://
Contact
tion Exampleany communiy result. The es at risk for fakely they wou
answer part ment so they rt‐term Resus of student pstudents are ac)
r to improve pmented severalhome visits, bade parents, w
wer their evalung: standardizg, absences anehavior, and oand receipt of
tors found thamance:
After‐sch Parent en
mple, increasuted to Carlin
A/www.commu
t: Anne Vor d
: Carlin Sprinity schools, Cessential resuailure, did pauld advance t
of their questcould becomlt: families areparticipation ictively involve
parental invol outreach actbus stop visitwelcome back
uation questized test resulnd tardiness, aoverall academf services such
at the followin
hool academingagement ac
ed parent engn Springs Elem
A PowerPoint unityschools.
der Bruegge, C
www.comw
ngs Elementaarlin Springs’ults‐focused qurticipation in to the next gra
tion school stame more effecte increasingly iin afterschooled in their learn
olvement, the tivities involvs, family librak picnic, Fall F
on they collects, hours spenand teacher amic performah as home vis
ng school acti
c enrichmentctivities
gagement andmentary Scho
presentation org/resources
Carlin Springs
mmunityschoolwww.iel.org
ary School ‐ A’ stakeholdersuestion drivinafter‐school eade‐level in 2
aff implementive partners iinvolved in thel and enrichmning and comm
community sving school staary nights, anFestival, Inter
cted data for bnt by each stuassessments oance. Data wesits.
ivities have h
t
d students’ paool students’ i
of their evalus/community
s Elementary
ls.org
Arlington, Vis identify impng their evaluenrichment a007‐08?”
nted strategiesin their childreir children’s edment activitiesmunity. (See R
school coordinaff, youth, annd middle schrnational Dinn
both result arudent in after‐on homework ere also collec
had significan
articipation inimproved aca
uation can be_school_evalu
School, avord
irginiaproving acadeuation was: “and parent inv
s to increase pren’s educatioducation. Thes – looking at RBLM, page 8
nator, along wnd families. (Ehool transitionner, and conc
reas. The staff‐school enrichcompletion, cted on paren
t impacts on t
n after‐schoolademic skills a
found here: uation_toolki
derb@arlingto
emic perform“Among thosevolvement ma
parent on – focusing ey also lookedthe Short‐ter to find these
with school stE.g. Principal’n meetings focerts.)
f collected dahments and participation nt participatio
their students
l activities botand behavior
it_resources.a
on.k12.va.us 2
mance e ake it
on d at rm
taff, s r
ta
in on at
s’
th .
aspx
3 www.communityschools.org
www.iel.org
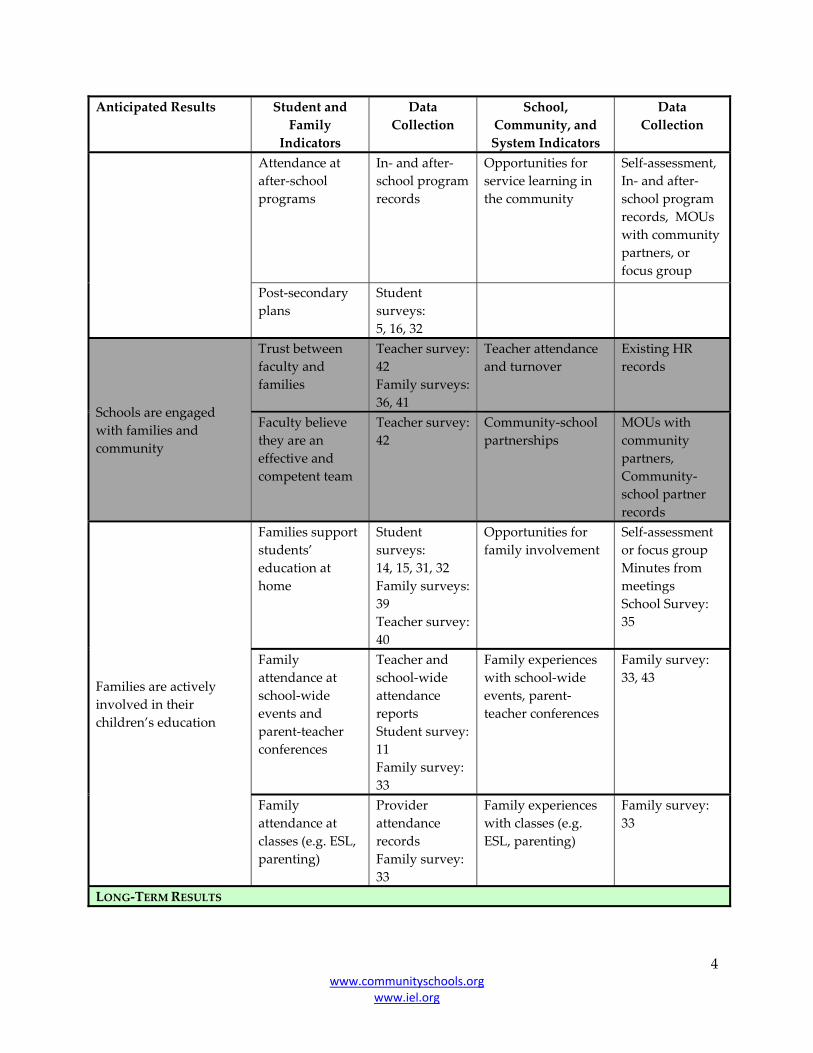
Table E. Recommended Results, Indicators, and Data Collection Strategies for Students, Families, Schools, and Communities
(Note: Each survey can be downloaded at the Evaluation Toolkit’s site: http://www.communityschools.org/resources/community_schools_evaluation_toolkit.aspx)
Anticipated Results Student and Family Indicators
DataCollection
School, Community, and System Indicators
DataCollection
SHORT‐TERM RESULTS Children are ready to enter school
Immunizations Existing elementary school or early childhood program school records (elementary schools)
Availability of early childhood education programs
Self‐assessment or focus groups
Attendance at early childhood education programs
Provider attendance records (or parent report in enrollment forms)
Students attend school consistently
Early chronic absenteeism, tardiness, truancy, attendance rate
Existing school attendance data
System in place to respond to attendance problems
Self‐assessment or focus groups
Students are actively involved in learning and their community
Students feel they belong in school
Student surveys: 7, 14, 15, 20, 29, 32
Availability of in‐school and after‐school programs
In‐ and after‐school program records MOUs with community partners
Students feel empowered
Student surveys: 12,17,20
Opportunities for student leadership
Self‐assessment or focus groups with students Student surveys: 17, 28
Students feel competent
Student surveys: 2, 6, 8, 27
Schools are open to community
Focus groups Student surveys: 5, 19, 24 Teacher survey: 38 School survey: 35
4 www.communityschools.org
www.iel.org
Anticipated Results Student and Family Indicators
DataCollection
School, Community, and System Indicators
DataCollection
Attendance at after‐school programs
In‐ and after‐school program records
Opportunities for service learning in the community
Self‐assessment, In‐ and after‐school program records, MOUs with community partners, or focus group
Post‐secondary plans
Student surveys: 5, 16, 32
Schools are engaged with families and community
Trust between faculty and families
Teacher survey: 42 Family surveys: 36, 41
Teacher attendance and turnover
Existing HR records
Faculty believe they are an effective and competent team
Teacher survey: 42
Community‐school partnerships
MOUs with community partners, Community‐school partner records
Families are actively involved in their children’s education
Students are healthy: physically, socially, and emotionally
Asthma control ER visits Student surveys: 18, 22
Service referrals (including vision, dental, mental health, and others)
Service referral records
Physical fitness Existing physical fitness data Student surveys: 18, 22
Services provided (including vision, dental, mental health, and others)
Service receipt records from partners
Nutritional habits Student surveys: 18, 23, 26
Opportunities for physical activity during school
Self‐assessment or focus group Student surveys: 18, 23, 26
Positive adult relationships
Student surveys: 9, 10, 14, 15, 17, 21
Wellness policy Data on compliance with policy
Positive peer relationships
Student surveys: 3,4, 13, 21
Students live and learn in stable and supportive environments
Staff, families, and students feel safe
Student surveys: 14, 15, 20, 32 Family survey: 36
Schools are clean Self‐assessment
6 www.communityschools.org
www.iel.org
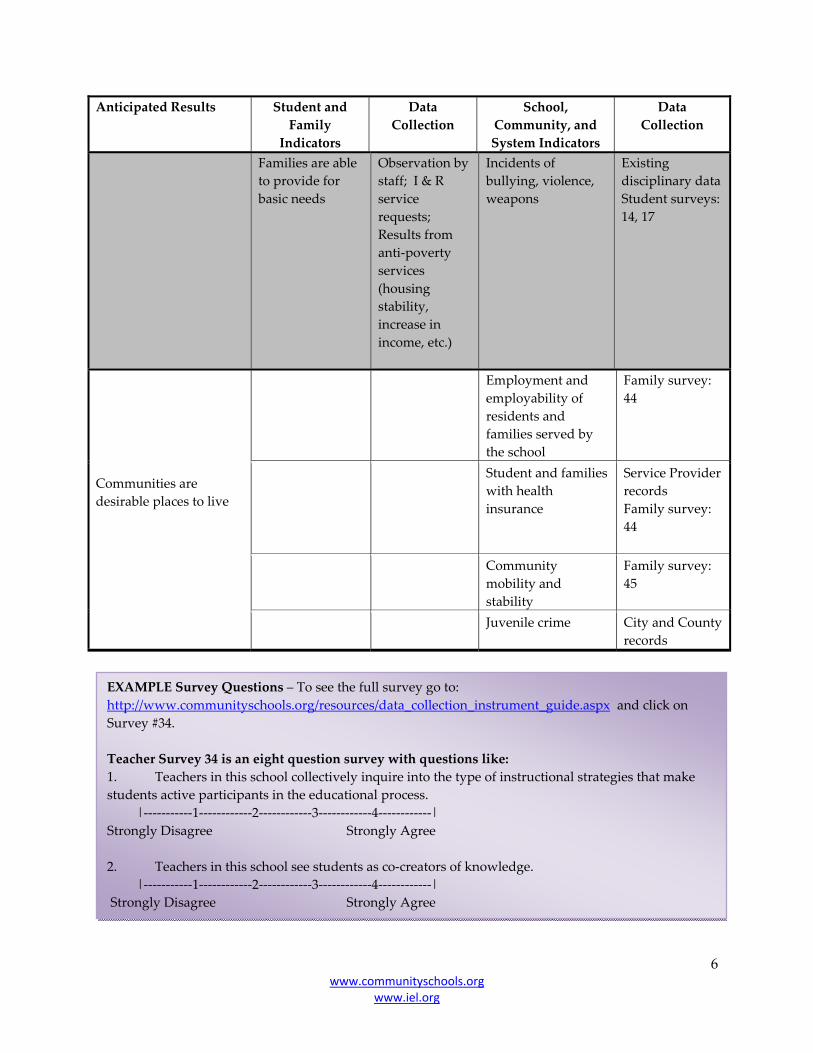
Anticipated Results Student and Family Indicators
DataCollection
School, Community, and System Indicators
DataCollection
Families are able to provide for basic needs
Observation by staff; I & R service requests; Results from anti‐poverty services (housing stability, increase in income, etc.)
Incidents of bullying, violence, weapons
Existing disciplinary data Student surveys: 14, 17
Communities are desirable places to live
Employment and employability of residents and families served by the school
Family survey: 44
Student and families with health insurance
Service Provider records Family survey: 44
Community mobility and stability
Family survey: 45
Juvenile crime City and County records
EXAMPLE Survey Questions – To see the full survey go to: http://www.communityschools.org/resources/data_collection_instrument_guide.aspx and click on Survey #34. Teacher Survey 34 is an eight question survey with questions like: 1. Teachers in this school collectively inquire into the type of instructional strategies that make students active participants in the educational process. |‐‐‐‐‐‐‐‐‐‐‐1‐‐‐‐‐‐‐‐‐‐‐‐2‐‐‐‐‐‐‐‐‐‐‐‐3‐‐‐‐‐‐‐‐‐‐‐‐4‐‐‐‐‐‐‐‐‐‐‐‐| Strongly Disagree Strongly Agree 2. Teachers in this school see students as co‐creators of knowledge. |‐‐‐‐‐‐‐‐‐‐‐1‐‐‐‐‐‐‐‐‐‐‐‐2‐‐‐‐‐‐‐‐‐‐‐‐3‐‐‐‐‐‐‐‐‐‐‐‐4‐‐‐‐‐‐‐‐‐‐‐‐| Strongly Disagree Strongly Agree
7 www.communityschools.org
www.iel.org
A CLOSER LOOK Result: Communities are desirable places to live If you want to focus your evaluation on the community as a whole, you may want to consider the following issues and resources. Community schools play a key role in creating supportive and thriving communities with high‐quality and engaging schools. However, assessing your community school’s role in improving communities and making them more desirable places to live is challenging. There are often many factors (e.g. economic, environmental) beyond the control of the community school. Still, if your community school activities are focused on improving your local community, you may want to consider ways to assess this. An example is the Los Angeles Family and Neighborhood Survey (LAFANS) conducted by the RAND Corporation. The survey includes questionnaires for adults and children and an observation guide to examine the physical and social characteristics of the neighborhood. For more information on the LAFANS, see: http://www.lasurvey.rand.org/