Page 1
8/10/2019 Stephen Few Promise of Bi
http://slidepdf.com/reader/full/stephen-few-promise-of-bi 1/16
Powerful Visual Techniques for Exploring and
Analyzing Quantitative Business Data
Visual and Interactive Analytics
Fulfilling the Promise of Business Intelligence
Page 2
8/10/2019 Stephen Few Promise of Bi
http://slidepdf.com/reader/full/stephen-few-promise-of-bi 2/16
Stephen Few
Principal, Perceptual Edge
About the Author
Stephen Few has 24 years of experience as an IT innovator, consultant, and
educator. Today, as Principal of the consultancy Perceptual Edge, Stephen
focuses on the use of data visualization for analyzing and communicating
quantitative business information.
We supposedly live in an “information economy,” yet businesses, the brokers of
this economy, rarely serve as good models for the effective use of information. Far
too often, business decisions are made without sound thinking to understand the
available information and without clear communication of its message to decision
makers. This problem undermines the ability of businesses to operate effectively,yet it is rarely diagnosed and almost never treated. Stephen is working to raise
consciousness and to provide a treatment plan that addresses the needs of busi-
ness in the language of business. His book, Show Me the Numbers: Designing
Tables and Graphs to Enlighten, is a powerful fitness program designed to target
the data presentation aspects of this problem. His new book due out in January
2006, Information Dashboard Design: The Effective Visual Display of Data, applies
visual design practices specifically to the challenging task of displaying a great
deal of disparate information on a single screen in a way that communicates
clearly and efficiently.
Today, from his office in Berkeley, California, Stephen provides consulting and
training services, writes the data visualization newsletter and Blog for the Business
Intelligence Network (www.B-EYE-NETWORK.com) as well as frequent articles for
DM Review and Intelligent Enterprise, speaks frequently at conferences, and
teaches in the MBA program at the University of California in Berkeley. More
information about his current work can be found at www.perceptualedge.com.
ii
Page 3
8/10/2019 Stephen Few Promise of Bi
http://slidepdf.com/reader/full/stephen-few-promise-of-bi 3/16
The BI industry often loses sight of this clearvision. In many ways, BI is still a fledgling industry,
awkwardly struggling with good intentions to
mature beyond adolescence, past the flexing and
preening of raging hormones, to the responsible
solution provider that it has always strived to
become. The time is right for BI’s rite of passage
into adulthood. Some software companies, like
Spotfire, are showing the way. Some companies
(I’ll resist the temptation to name names) are still
trying to get by on their good looks, flirting with
the sad possibility of never growing up.
The “I” of BI—intelligence—can only be achieved
by fully engaging the half of human-computer
interaction that possesses intelligence: the human
half. BI is only as effective as its ability to support
human intelligence. This requires software that
seamlessly interacts with our brains to support
and extend our cognitive abilities. Unfortunately,
BI software too often gets in the way, interrupting
and undermining the thinking process rather
than complementing and extending it. When BI
software does its job, however, you find yourself
submerged in thoughts about the data, not aboutthe software and the hoops you must jump
through to reach insight.
(Source: A glossary on the Web site www.gartner.com)
Information technology hasn’t delivered what itpromised us. Yes, we live in the information age,
and yes, much has changed—but to what end?
Do you know more today than before? Are you
smarter? Do you make better decisions? We
often still make the same bad decisions, but now
we make them much faster than before, thanks
to technology’s questionable gift of “more and
faster”. This is hardly the better world that we
imagined and hoped for.
For many years I’ve worked in the business
intelligence (BI) industry. It is BI’s mission to help
businesses harness the power of information to
work smarter. Intelligence—”the faculty of under-
standing” (according to the Oxford English
Dictionary)—is the solid ground on which busi-
nesses must build to succeed. Information is the
stuff with which intelligence works to produce the
understanding needed to effect change, but more
data delivered faster can actually lead to less
understanding and even bad decisions if we lack
the skills and tools needed to tame and make
sense of it. The BI industry has helped us build
huge warehouses of data that we can now accessat lightening speeds, but most of us look on with
mouths agape, feeling more overwhelmed than
enlightened.
The Gartner Group coined the term business
intelligence in the mid-1990s and defined it as
follows:
An interactive process for exploring and analyzing
structured and domain-specific information to
discern trends or patterns, thereby deriving
insights and drawing conclusions. The business
intelligence process includes communicatingfindings and effecting change.
An interactive process for
exploring and analyzing
structured and domain-specific
information to discern trends or
patterns, thereby derivinginsights and drawing conclu-
sions. The business intelligence
process includes communicating
findings and effecting change.
Visual and Interactive Analytics
Page 4
8/10/2019 Stephen Few Promise of Bi
http://slidepdf.com/reader/full/stephen-few-promise-of-bi 4/16
2
As a business person trying to get the job done,
your only concern when dealing with data is:
“what does it mean?” so you can move on the
whole point of the matter, which is to decide:“what should I do about it?” That’s it. Did you
know that there are experts who spend all their
time figuring out the most effective ways to make
sense of information to support good decisions?
It’s true. While you’re sitting in your office or
cubicle doing your job, they are sitting in their
offices or cubicles in research laboratories,
most at universities and a few at commercial
enterprises, doing their best to help you. Their
findings get published, but rarely anywhere that
you would ever see.
This is where people like me come in handy.
I try to keep one foot planted firmly in the
business world and the other in the research
world so that I can pass useful information back
and forth between the two. Researchers must
hear what you really need down there in the
trenches of everyday business, and you need
their insights without all that high-fallutin’
academic speak that keeps too many good
ideas trapped in the ivory tower.
I was recently involved in an email discussion
with my friend and colleague, Ben Shneiderman,
of the University of Maryland. Ben is not just any
old academic involved in information visualization
research; he is a prime mover in the field. No one
has done more to further this work and promote
its worth. Ben and I have been exploring ways to
strengthen the bridge between the information
visualization research community and commercial
business software. We realize that if information
visualization sounds too academic, many busi-
ness people will find it alienating. This mustn’t
be, because many of these visual analysistechniques are quite easy to learn and can be
used to do the kinds of data analyses that are
commonly required in business. In an effort to
remove some of the academic stigma, Ben and
I have been playing around with new names for
the application of information visualization in a
practical way to the everyday needs of business,
which is how the term “BizViz” came to be. Ben
suggested “BizViz” along with a few other
names, and this is the one that we both agreed
to use to get your attention and tempt you to trysomething new that we know is good for you.
In this paper I’ll do my best to introduce you—
people who must make sense of information to
solve real business problems—to a few simple
data analysis techniques that you can use to
discover meaning in your data that might
otherwise remain invisible using more traditional
approaches. I’ll use Spotfire DecisionSite, a
popular visual analytics software package,
to illustrate these techniques. All of these
techniques leverage the strength of our mostpowerful sense: vision.
I See
Because vision is our dominant sense, the acts
of seeing and thinking are intimately connected.
It is not an accident that we use expressions
like “I see” to describe the experience of under-
standing. In fact, almost every word we use to
describe understanding, including insight,
illumination, and enlightenment, are visual
metaphors. Of all the sense receptors in the
human body, 70% are located in our eyes. Not
only does vision offer a richer, more nuanced
perception of the world around us than our
other senses, it does so through a significantly
broader bandwidth at much higher speeds
of delivery. Researchers focus primarily on
developing visual methods of exploring and
representing information because this is the
channel that can deliver the richest perception
possible, resulting, when done effectively, in the
richest understanding. To fulfill its promise, BI
software must incorporate visual analysis
methods—not just any visual analysis methods,
but those that actually work.
Page 5
8/10/2019 Stephen Few Promise of Bi
http://slidepdf.com/reader/full/stephen-few-promise-of-bi 5/16
Information visualization—technologies that
support the analysis and communication of
data using visual media and techniques—
should not be seen as separate from BI. As theGartner Group’s definition of BI made clear,
when data visualizations are used to support an
“interactive process for exploring and analyzing
structured and domain-specific information to
discern trends or patterns”, they are doing
precisely what BI is meant to do. When used
effectively, visualization software extends the
reach of traditional BI to new realms of under-
standing—not as one means among many,
but often as the only effective means available.
Information visualization will enable the next
leap in BI’s evolution.
All BI software vendors have recognized the
appeal to their customers of graphical data
displays, but few understand their value; few
understand what works and what doesn’t, let
alone why. Nothing illustrates this more vividly
than the current popularity of dashboards. Like
a feeding frenzy among sharks, vendors sensed
the potential market of dashboards and surged
in with bloodlust to devour as much as possi-
ble, as quickly as possible, without taking the
time to understand it. Rather than steppingback and asking why these single-screen
consolidations of information for rapid monitor-
ing of what’s going on were so appealing, they
assessed the situation superficially and began
to compete with one another in an absurd
display of flash and dazzle. Vendor after vendor
rushed to awkwardly clomp down the fashion
runway to show off their flashy meters, gauges,
and traffic lights while buyers sat mesmerized
by the gaudy spectacle. This will change in time
as this market matures and a critical mass of
unhappy customers rebels against thesesuperficial dashboard displays that fail to
communicate. Dashboards, like other visual
media for communication of information, have
tremendous potential, but only when properly
designed to connect and interact with our eyes
(how we see) and our brains (how we think).
To harness the power of visual analysis and
communication, BI vendors must take the time
to do two things that they often overlook:
1. Explore and think about the useful human
ends that their technology should support
until they clearly, accurately, and fully under-
stand them.
2. Study the research findings that will teach
them how to address these human ends
through the use of technology in ways that
actually work.
In the case of dashboards, this involves focus
on the communication ends that are the
exclusive purpose of dashboards, along with a
study of the rich research literature thatdescribes how visual perception works and how
information displays must be designed to take
advantage of this powerful and efficient channel
of communication. BI vendors need to dig
themselves out from under the overwhelming
demands for features and functions that keep
them frenzied trying to bolt things onto their
products as quickly as possible. They must lift
their heads above the fray long enough to
remember that they are supposed to be the
experts who bring a clear and commanding
vision to the design of BI products. Customers
are responsible for describing their needs—the
business ends that they need to achieve.
Software vendors are responsible for expertly
designing technology that supports these needs
in ways that really work. Given the central goal
of BI to help business people make sense of
information to enable smart decisions, BI
vendors need to be experts in the visual tech-
niques that alone can enable much of the data
discovery and analysis that businesses require.
If you’re one of those folks who consider them-
selves more verbal than visual, and are therefore
uninterested in visual analysis because it doesn’t
speak your language, I’ll let you in on an impor-
tant truth: despite your personal preference for
verbal over visual information displays, some of
the messages that are contained in data are
visual by their very nature, and therefore remain
Page 6
8/10/2019 Stephen Few Promise of Bi
http://slidepdf.com/reader/full/stephen-few-promise-of-bi 6/16
4
hidden or difficult to see at best when presented
verbally (that is, as text, such as in a tabular
display). I’ll illustrate this point very simply. Take
a look at the following table (Figure 1) of time-series sales data for two regions: domestic and
international.
This table does a marvelous job of giving you
precise values and makes it easy to look up a
particular value or even compare individual val-
ues to one another, but there’s a bigger picture
that isn’t obvious in this tabular display. I use
the word “picture” to describe this message in
the data, because it is hard to discern except in
the form of a picture.
Now look at the same exact data (Figure 2)
displayed graphically. Previously veiled aspects
of the data now pop out clearly and immediately,
recognizable and understandable without effort.
Here are a few of the facts that are clearly visible
in this graph:
Domestic sales are trending upwards overall
through the year.
International sales hold reasonably steady
throughout the year, except in the month of
August (vacation month in Europe), when they
dip.
Domestic sales fluctuate quite a bit, and with
a moment’s attention, we see that they fluctu-
ate in a pattern that is cyclical per quarter.
They drop in the first month of each quarter
and then steadily rise to a dramatic peak in
the last month of each quarter.
Even though each of these patterns could havebeen discerned from the table given enough time
and attention, they certainly could not have been
discerned so quickly and easily. Even if you favor
text displays, being verbally oriented like I also
tend to be, you can’t afford to ignore visual
representations when looking for messages that
are contained in the shape of the data.
Even the federal government has recognized the
potential of visual analytics. A new government
program is establishing regional research centers
at universities throughout the country to developvisual techniques and tools for exploring and
making sense of data (see http://nvac.pnl.gov).
Funded primarily by the Department of
Homeland Security, but available for participation
by all government agencies, these research cen-
ters are bringing together academic, commercial,
and government talent to leverage the power
of visual analytics for greater insight by those
who make the decisions that affect our national
interests. Their motto is “detecting the expect-
ed...discovering the unexpected.” I doubt that
this program would exist if the potential benefits
of visual analytics were not beyond question.
Jan Feb Mar Apr May Jun Jul Aug Sep Oct Nov Dec
D om es ti c 1 ,9 83 2 ,3 43 2 ,5 93 2 ,2 83 2 ,5 74 2 ,8 38 2 ,3 82 2 ,6 34 2 ,9 38 2 ,7 39 2 ,9 83 3 ,4 93
International 574 636 673 593 644 679 593 139 599 583 602 690
2005 Sales Revenue
(As of 1/1/2006)
Domestic
International
0
500
1,000
1,500
2,000
2,500
3,000
3,500
4,000
Jan Feb Mar Apr May Jun Jul Aug Sep Oct Nov Dec
U.S. $
Figure 1
Figure 2
Page 7
8/10/2019 Stephen Few Promise of Bi
http://slidepdf.com/reader/full/stephen-few-promise-of-bi 7/16
the late 18th and early 19th centuries that manyof the graphs that we use today were invented
or dramatically improved by a Scottish social
scientist named William Playfair, including bar
charts and pie charts. Over a century passed,
however, before the value of these techniques
was sufficiently recognized for the first university
course in graphing data to be offered, originally in
1913 at Iowa State.
The person who really recognized the power of
visualization as a means to explore and make
sense of data was the Princeton statistics pro-
fessor John Tukey. In 1977, Tukey introduced a
whole new approach to analyzing data called
exploratory data analysis. Later, in 1983, data
visualization guru Edward Tufte, published his
A Brief History of Information Visualization
Figure 3
To fully appreciate what information visualizationis and what it offers, it’s worthwhile to quickly
trace the historical highlights (Figure 3).
The tabular presentation of data has been with
us since the 2nd century, when it was first used
in Egypt to organize astronomical information
and to aid navigation. The representation of
quantitative data in the form of two-dimensional
graphs, however, didn’t arise until much later, in
the 17th century. Rene Descartes, the French
philosopher and mathematician famous for the
words “Cogito ergo sum” (“I think therefore I
am”), invented 2-D graphs using X and Y axes,
not originally for presenting data, but for perform-
ing a type of mathematics based on a system of
coordinates relative to the axes. It wasn’t until
Page 8
8/10/2019 Stephen Few Promise of Bi
http://slidepdf.com/reader/full/stephen-few-promise-of-bi 8/16
6
groundbreaking book The Visual Display of
Quantitative Information, which showed us that
there were effective ways of displaying data
visually and then there were the ways that mostof us were doing it, which did not communicate
very well. One year later, in 1984, while watch-
ing the Super Bowl, Apple introduced us to the
first popular and affordable computer that
emphasized graphics as a mode of interaction
and display, a graphical user interface (GUI) that
was originally developed at Xerox PARC (Palo
Alto Research Center). This paved the way
finally for the use of data visualizations that
were interactive.
Given the availability of affordable computerswith reasonably powerful graphics, a new
research specialty emerged in the academic
world, which was coined “information visualiza-
tion.” In 1999, the book Readings in Information
Visualization: Using Vision to Think, collected
the best of this work into a single volume and
made it accessible for the first time beyond the
walls of academia. This book was co-authored
by Ben Shneiderman, Stuart Card, and Jock
Mackinlay. In it they told us what they meant by
the term information visualization by providing
the following definition:
Information visualization is the use of computer-
support interactive visual representations of
abstract data to amplify cognition.
This definition places information visualization
smack dab in the middle of business intelli-
gence. It’s worthwhile to break it apart to
highlight and clarify each of its components:
Computer-supported: The visualization is
displayed by a computer, usually on a
computer screen.
Interactive: The visualization can be
manipulated directly and simply by the user
in a free-flowing manner, including such
actions as filtering the data and drilling downinto details.
Visual representations: The information is
displayed in visual form using attributes like
the location, length, shape, color, and size of
objects to form a picture of the data and
thereby reveal patterns, trends, and excep-
tions that might not be seen otherwise.
Abstract data: Information such as
quantities, processes, and relationships, as
opposed to visual representations of physical
objects, such as geography (that is, a map) or
the human body (for example, an MRI image). Amplify cognition: These visualizations and
the interactions they enable extend our ability
to think by assisting memory and represent-
ing the information in ways that our brains
can easily comprehend.
This is precisely what we need.
Information visualization is
the use of computer-
support interactive visual
representations of abstract
data to amplify cognition.
Page 9
8/10/2019 Stephen Few Promise of Bi
http://slidepdf.com/reader/full/stephen-few-promise-of-bi 9/16
Information visualization research has produced a
wealth of useful techniques for discovery and
analysis, but a few stand out as especially simple
and effective means to analyze quantitative
business data. I’m going to describe and demon-
strate four techniques that you can use today:
1. Filtering data directly and instantly
2. Extending your view to more dimensions
using multiple comparative graphs
3. Viewing data from multiple complementary
perspectives simultaneously
4. Highlighting subsets of data simultaneouslyand automatically in multiple views
Filtering Data Directlyand Instantly
One of the most common steps that you take
over and over again when examining and trying
to make sense of data is that of filtering.
Whenever you see something interesting, you
need to take a closer look at it without the
distraction of other data, so you filter out the
data that isn’t relevant to your immediate
interest. This is part and parcel of the data
analysis process—nothing new—but the way
that filtering is done with most traditional BI
software is clumsy and tends to interrupt the
free flow of analysis.
Here’s how this process typically goes using
traditional software: (1) you examine your data
in a graph and notice something interesting, (2)
you turn away from the data to construct a
query to filter the data and then you run the
query, (3) you wait for the query to return the
filtered results, (4) you construct a new graph
to view the filtered data, and (5) you turn back
to the data to examine it in its new form. This
fragmented process introduces an annoying
stutter into your thinking process and can act
as a disincentive to inquiry and exploration. It
slows you down and sometimes causes you to
lose your train of thought.
Wouldn’t it be helpful if you could filter the data
in a way that didn’t require you to take your
eyes off of it and allowed you to see the effects
of the filtering process as it’s happening, without
delay? Information visualization researchers
recognized this need several years ago and
have worked hard to provide solutions, which
they call dynamic queries.
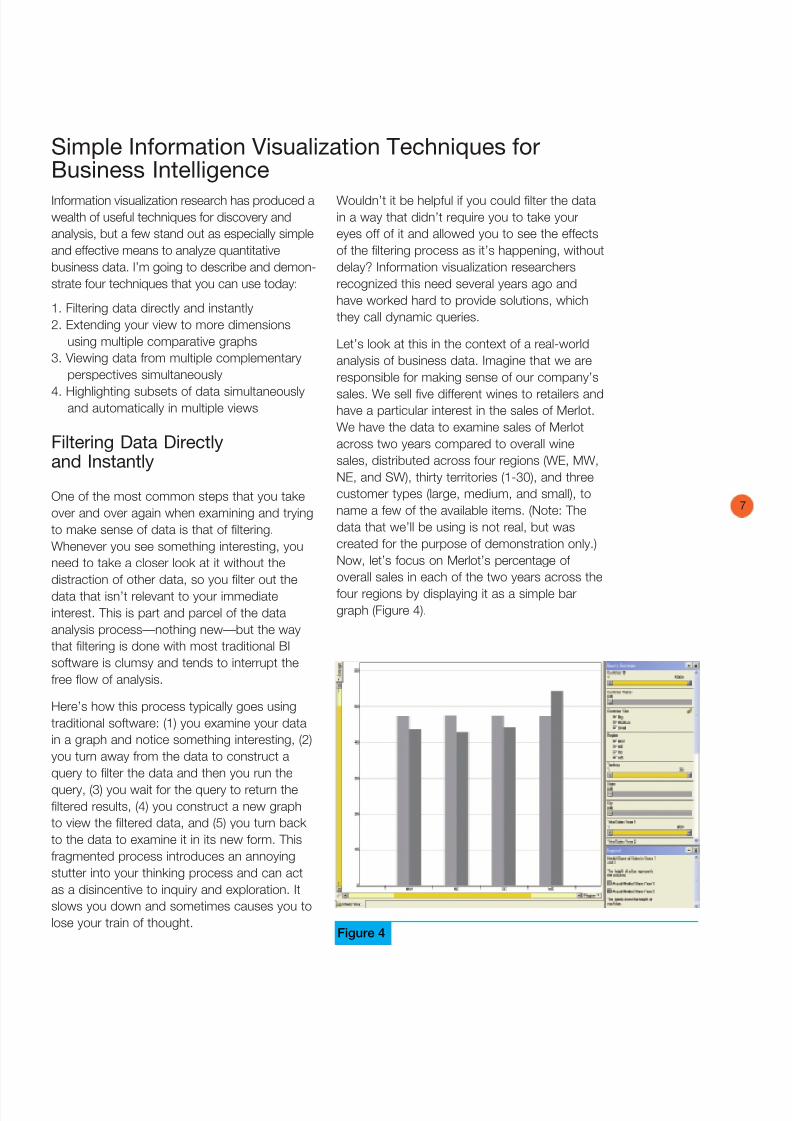
Let’s look at this in the context of a real-world
analysis of business data. Imagine that we are
responsible for making sense of our company’s
sales. We sell five different wines to retailers andhave a particular interest in the sales of Merlot.
We have the data to examine sales of Merlot
across two years compared to overall wine
sales, distributed across four regions (WE, MW,
NE, and SW), thirty territories (1-30), and three
customer types (large, medium, and small), to
name a few of the available items. (Note: The
data that we’ll be using is not real, but was
created for the purpose of demonstration only.)
Now, let’s focus on Merlot’s percentage of
overall sales in each of the two years across the
four regions by displaying it as a simple bar
graph (Figure 4).
Simple Information Visualization Techniques forBusiness Intelligence
Figure 4
Page 10
8/10/2019 Stephen Few Promise of Bi
http://slidepdf.com/reader/full/stephen-few-promise-of-bi 10/16
8
It only takes a second to notice that Merlot’s
share of overall sales has decreased from year
1 to 2 in all but region WE (west). This leads us
to wonder if this pattern holds true for all typesof customers—big, medium, and small. Notice
that to the right of the graph there is a panel
labeled “Query Devices”. This panel includes
simple mechanisms for filtering the data, one for
each column that is available (Customer ID,
Customer Name, Customer Size, etc.). Let’s
focus for now on the query device for the
Customer Size column. Because Customer Size
is a categorical variable—one that consists of a
limited set of discrete rather than continuous
values—the query device is in the form of a
check box for each of the values. Right now,each value is checked, but if we want to quickly
see Merlot’s share of sales for big customers
only, we can easily uncheck medium and small
[highlighted in red below (Figure 5)] to view the
following result:
The general pattern holds true for big customers,
but the decrease of Merlot’s share in the SE
(southeast) region is not as pronounced. What
you couldn’t see, because you’re reading my
explanation of this process rather than doing it
yourself and seeing what happens, is that therewas no delay between making filtering selections
and seeing the results in the graph. For this
same reason you also might not be able to fully
appreciate the fact that this act of data filtering
was very convenient. There was no disconnec-
tion between wondering what the pattern might
look like for big customers alone, filtering the
data, and seeing the result. It involved a fluidinteraction of thought and action.
Let’s pursue this line of investigation further by
filtering out all but the west region to see if all
states in this region display a similar pattern.
Because we’re focusing on the change in
Merlot’s share from year 1 to year 2, we’ll
change the graph to show a single bar per
state that measures the amount of change,
rather than a separate bar for each year. Here’s
what the data looks like now (Figure 6).
Of the four states in the west region, Idaho
stands out as an exception to the pattern of an
increase in Merlot’s share. Now let’s use the
query devices to do something interesting. One
of the measures that is available in our data is
the number of visits that were made by our
sales team to each of the customers in the
second year. Let’s see if there is a relationship
between the number of visits and the fact that
Merlot’s share decreased in Idaho. The querydevice for the number of visits is displayed in
the form of the slider, shown below (Figure 7):
Figure 5
Figure 6
Figure 7
Page 11
8/10/2019 Stephen Few Promise of Bi
http://slidepdf.com/reader/full/stephen-few-promise-of-bi 11/16
This type of slider, with a control at each end,
allows you to easily set the range of values that
you want to see to any range you want. Notice
that the low and high ends of the slider arelabeled with the values 0 and 26, which indi-
cates the entire range of values in the number
of visits measure. To filter the data based on the
number of visits, in most BI software you would
have to define the range, submit the query, and
wait for the results, but with this
slider, we can adjust the range dynamically and
see the results change in the graph as we do
so. For instance, we can adjust the slider to
include only those customers who received one
or more visits, then two or more visits, and so
on, seeing the results of each adjustment in thegraph as we proceed. Nothing much happens
when we adjust the slider from one or more
visits through three or more visits, but look at
the change that occurs below from left to right
when we adjust the slider from four or more
visits to six or more visits (Figure 8):
With five or more visits (middle graph), the
change in Merlot’s share increased a little in
California and Oregon, but with six or more visits
(right graph), Idaho disappeared altogether. In
other words, none of the customers in Idahoreceived more than five visits from the sales
team out of a maximum of 26 visits that some
customers received. Being able to see the data
change in the graph as we’re filtering it caused
this meaningful aspect of the data to leap out.
Dynamic queries, enabled through simple
filtering controls like sliders, offer an enormous
Figure 8
advantage when exploring data. It is so easy to
do, you needn’t take the time to construct fully
formulated queries before pursuing a line of
inquiry, but can approach the process moreimprovisationally, as an effortless series of
thoughts, actions, and observations.
Extending Your View to MoreDimensions Using MultipleComparative Graphs
You might have noticed how helpful it was to
see multiple instances of the same graph all at
once in Figure 8 below, each representing a
different value of the number of sales visits vari-
able. This technique of arranging a consistentseries of the same graph, differing only along a
single variable (in this case, number of visits), all
within eye span so they can be compared to
one another is a powerful way to add another
dimension to the data that would be difficult to
display in a single graph. In 1983, data visuali-
zation guru Edward Tufte called this technique
“small multiples”, but it goes by other names as
well, including a trellis display, which is what
Spotfire calls it. When multiple graphs are
arranged in this way, especially as a full matrix
including multiple columns and rows of graphs,
it looks a bit like a trellis that might be found in
your garden. Very few software vendors make it
easy to arrange graphs in this manner, despite
the value of this technique for analysis and the
fact that it has been around for over 20 years.
You can use this kind of display to see a great
deal of data in a way that causes interesting facts
Page 12
8/10/2019 Stephen Few Promise of Bi
http://slidepdf.com/reader/full/stephen-few-promise-of-bi 12/16
Page 13
8/10/2019 Stephen Few Promise of Bi
http://slidepdf.com/reader/full/stephen-few-promise-of-bi 13/16
1
Remember the table of numbers in Figure 1?
Each of the 24 numbers represents a chunk of
information when held in short-term memory,
which means that only a handful of them canbe considered at any one time. The graph of
the same data in Figure 2, however, represents
the values for each category (domestic and
international sales) as a single line in the
graph—a visual object that we can hold in
short-term memory as a single chunk of
information. This is one of the reasons that
graphs are such a powerful medium for the
analysis of data.
When comparisons need to be made between
different values, sets of values, or views of thedata, they need to be available to our eyes at the
same time. Nothing needs to be held for long in
short-term memory when it is all there before our
eyes and we can quickly swap the chunks that
we need in and out of memory as we’re making
connections and considering what they mean.
Software can support this need by allowing us to
place several different data displays on a single
screen. Let’s look at a rich assortment of per-
spectives on the same set of sales data that
we’ve been exploring (Figure 10).
Starting with the graph in the upper left-hand
corner and working down each column
before moving right to the next, here’s
what we see:
1. Total wines sales (black bars) com-
pared to Merlot sales (gray bars) in
U.S. dollars for this year per region.
2. Percentage change in sales between
last year and this year—total and
Merlot—per region.
3. Merlot’s percentage of total wine
sales per region.
4. Change in Merlot’s percentage of
total sales from last year to this year
per region.
5. Total wine sales this year per customer size
(darkest gray represents big customers,
medium gray represents medium-sized cus-
tomers, and light gray represents small cus-tomers) by region.
6. Merlot sales this year per customer size by
region.
7. Merlot share of total sales this year per
customer size by region.
8. Frequency distribution of sales based on the
number of sales visits that led to each sale
(0-3, 4-7, 8-11, etc.).
9. Scatter plot showing the correlation of the
percentage change in total wine sales from
last year to this year (vertical axis) to the
percentage change in Merlot wine sales fromlast year to this year (horizontal axis).
Each of these graphs provides a different
perspective on our sales. Seen together, they
help us see connections (interesting interac-
tions) between various aspects of sales. Study
these graphs for a few minutes to see what
worthwhile stories they tell you about sales.
Here are a few thought-provoking features of
the data that caught my attention while
examining these graphs:
Figure 10
Page 14
8/10/2019 Stephen Few Promise of Bi
http://slidepdf.com/reader/full/stephen-few-promise-of-bi 14/16
12
1. Merlot sales in the west region represent
around 55% of total sales, the greatest share
of any region, but this is mostly due to a
dramatic increase in Merlot sales in the west.Despite this strong showing in the west,
Merlot’s share of total wine sales actually
went down a little in the midwest and
northeast and increased only slightly in the
southeast. Merlot’s high share of total
sales in the west is strongest among small
customers.
2. Even though the west barely beat the
northeast in overall wine sales this year to
come in third place of the four regions, they
came in a strong second in Merlot sales,
nearly catching up with southeast. In fact,Merlot sales to medium-sized customers in
the west roughly match those in the south-
east.
3. Most sales resulted from between three and
seven visits to a customer and the number
of visits that seems to be required for sales
is fairly consistent between big, medium, and
small customers.
4. While there is a positive correlation between
changes in total wines sales vs. Merlot sales
from last year to this year (that is, as total
wine sales increased or decreased, Merlot
sales tended to do the same), there are a
number of exceptions to this pattern,
especially in the lower right corner where a
disproportionate number of Merlot sales
increases appear relative to decreases in
overall sales.
Many of these discoveries, as well as others
you perhaps made while examining this
collection of complementary graphs, might
have remained invisible using more traditional BI
methods of analysis, and certainly would havebeen much more difficult and time-consuming
to ferret out.
Highlighting Subsets of DataSimultaneously and
Automatically in Multiple Views
This next technique builds on top of the one we
just examined. The revelatory power of multiple
perspectives on the data seen together can be
extended through a technique that information
visualization researchers call brushing. Let’s say
that we are looking at one of the graphs in
Figure 10 and we become interested in a
particular subset of the data, such as those
Merlot sales that decreased since last year even
though overall wines sales increased, as shown
in the upper left quadrant of the scatter plot.
Now imagine that we have a brush that we can
use to paint a rectangle around these particular
data points in the scatter plot to highlight them,
resulting in the following (Figure 11):
Now all the values of overall wine sales that are
greater than zero corresponding to Merlot sales
that are less than zero are highlighted in red.
Simply making them stand out in the scatter
plot, however, is not the point of this exercise.
What we really want to see is how this particular
subset of data behaves in all of the other graphs
on the screen. That’s exactly what brushing does
for us, and it does it automatically. Take a look
now at the full screen and see if it leads you to
any interesting insights (Figure 12).
Figure 11
Page 15
8/10/2019 Stephen Few Promise of Bi
http://slidepdf.com/reader/full/stephen-few-promise-of-bi 15/16
1
One of the first things that I noticed is that these
decreases in Merlot sales that are out of sync
with corresponding increases in overall wine
sales, occurred less often in the west (especiallyseen in upper graph in the left column and the
middle graph in the center column). Relative to
customer size, this pattern also seems to be
disproportionately strong in the southeast (see
the top and middle graphs in the center column).
Now let’s say that we want to see if sales in the
west fall disproportionately in any particular
area of the scatter plot. To see this, we can
brush the west region in any of the graphs in
the left or center columns and see the results
highlighted in every graph, including the scatterplot shown below (Figure 13).
Notice that a disproportionate number of sales
in the west (highlighted in red) appear below the
trend line and in the right half (increases in
Merlot sales) of the graph. This reaffirms ourprevious observation that the west has con-
tributed more than other regions to increases in
Merlot sales, especially when overall wine sales
changed less than the average degree.
Final Word
Even with this simple data set, we could go on
for hours pursuing lines of investigation as
quickly as they come to mind. When the kinds
of analytical functionality that we’ve just exam-
ined are enabled by software in such simple and
efficient ways, the step-by-step process that
begins with observation, then raises a question,
and is followed by manip-
ulation of the data to pur-
sue that question, result-
ing in new observations
and insights, becomes
fluid, without interruption.
When this happens, we
can achieve a state of
awareness and insight thatpsychologist Mihaly
Csikszentmilhalyi (pro-
nounced “chick-sent-me-
high”) calls “flow” and oth-
ers more colloquially call
being “in the zone.” This
can only happen when our
awareness of the software
we are using recedes into
the background and we become fully immersed
in the data and its rich story.
With the right tools you can clear the fog and
learn to analyze data at the speed of thought.
Take advantage of the techniques that informa-
tion visualization researchers have developed to
help you work smarter. Achieve the promise of
business intelligence today.
Figure 13
Figure 12
Page 16
8/10/2019 Stephen Few Promise of Bi
http://slidepdf.com/reader/full/stephen-few-promise-of-bi 16/16
Spotfire® DecisionSite®
Spotfire, Inc.
212 Elm Street
Somerville, MA 02144 U.S.A.
Telephone +1.617.702.1600
Fax +1.617.702.1700
Toll-Free +1.800.245.4211
Spotfire AB
(European Headquarters)
Första Lânggatan 26
SE-413 28 Göteborg, Sweden
Telephone +46.31.704.1500
Fax +46.31.704.1501
Spotfire Japan KK
(Japanese Headquarters)
Kinokuniya Bldg. 7F, 13-5,Hatchobon 4-chrome
Chuo-Ku, Tokyo 104-0032 Japan
Telephone +81.3.5540.7321
Fax +81.3.3552.3166
www.spotfire.com
About Spotfire
For thousands of business users faced with
day-to-day decisions, Spotfire analytics offers the
platinum user experience for visually interacting
with information. Distinguished by its intuitive
ease and analytic power, Spotfire software rapidly
reveals unseen threats and illuminates new
opportunities, creating unprecedented economic
value. Spotfire’s customers include industry
leaders among the Global 2000 that have
deployed Spotfire analytics to gain an information
advantage over their competitors. For more
information, visit http://www.spotfire.com.