38
PROGRAM MANAGER Princess Grace Hospital Monaco Credit: AIA Associés Credit Suisse Engineering & Construction Conference June 6, 2013 Stephen M. Kadenacy Chief Financial Officer

PROGRAM MANAGERPrincess Grace HospitalMonacoCredit: AIA Associés
Credit Suisse Engineering & Construction ConferenceJune 6, 2013
Stephen M. KadenacyChief Financial Officer

Disclosures
Safe HarborExcept for historical information contained herein, this presentation contains “forward-looking statements.” All statements other than statements of historical fact are “forward-looking statements” for purposes of federal and state securities laws, including any projections of earnings, revenue or other financial items; any statements of the plans, strategies and objectives of management for future operations; any statements concerning proposed new services or developments; any statements regarding future economic conditions or performance; any statements of belief; and any statements of assumptions underlying any of the foregoing. Forward-looking statements may include the words “may,” “will,” “estimate,” “intend,” “continue,” “believe,” “expect” or “anticipate” and other similar words.
Although we believe that the expectations reflected in any of our forward-looking statements are reasonable, actual results could differ materially from those projected or assumed in any of our forward-looking statements. Our future financial condition and results of operations, as well as any forward-looking statements, are subject to change and to inherent risks and uncertainties, such as those disclosed in this presentation. Important factors that could cause our actual results, performance and achievements, or industry results to differ materially from estimates or projections contained in forward-looking statements include, among others, the following:
• uncertainties related to appropriations for funding of, or issuing notices to proceed under, government contracts;• our relationships with governmental agencies that may modify, curtail or terminate our contracts;• delays in the completion of the budget process of the U.S. government could delay procurement of our services;• potential adjustments to government contracts which are subject to audits to determine reimbursable contract costs;• adverse results from losses under fixed-price contracts;• limited control over operations run through our joint venture entities;• misconduct by our employees or consultants or our failure to comply with laws or regulations applicable to our business;• current deficits in our defined benefit plans could grow in the future and create additional costs;• exposure to legal, political and economic risks in different countries as well as currency exchange rate fluctuations;• risks related to security in international locations;• failure to successfully execute our merger and acquisition strategy;• the need to retain the continued services of our key technical and management personnel and to identify and hire additional qualified personnel;• uncertainties about security clearances for our employees;• the competitive nature of our business;• our liability and insurance policies may not provide adequate coverage;• unexpected adjustments and cancellations related to our backlog;• dependence on other contractors or subcontractors who could fail to satisfy their obligations;• systems and information technology interruption; • changing client preferences/demands, fiscal position and payment patterns; and• the continuing economic downturn in the U.S. and international markets and tightening of the global credit markets.
Additional factors that could cause actual results to differ materially from our forward-looking statements are set forth in our Quarterly Report on Form 10-Q for the period ended March 31, 2013, and our other filings with the Securities and Exchange Commission. We do not intend, and undertake no obligation, to update any forward-looking statement.
Non-GAAP MeasuresCertain measures contained in these slides and related presentation are not measures calculated in accordance with generally accepted accounting principles (GAAP). They should not be considered a replacement for GAAP results. Non-GAAP financial measures appearing in these slides are identified in the footnotes. A reconciliation of these non-GAAP measures to the most directly comparable GAAP financial measures is available on the Investors section of our Web site at: http://investors.aecom.com.
2 June 6, 2013

Agenda
3
1. AECOM Today
2. Market Opportunities and Outlook
3. Financial Discipline
4. Key Takeaways
5. Appendix
Kingdom Center, Riyadh, Kingdom of Saudi Arabia
June 6, 2013

AECOM Today
Global engineering and construction services – front-end design to construction management, operations and maintenance
• #1 global design firm* with top rankings in key end markets: Facilities; Transportation; Environmental; and Power & Energy.
• Approximately 45,000 employees operating in more than 140 countries.
• $8.2 billion of revenue for the twelve months ended March 31, 2013.
• Diversified end markets, geographies, and funding sources with end to end service offerings.
• Expertise and global reach position AECOM to be the partner of choice on the world’s most challenging and complex infrastructure projects. Involved in 6 of the 20 largest civil infrastructure projects globally.
• Well positioned in key markets with strong secular demand. Annual infrastructure investments in these markets total $4.5 trillion.
Balanced approach to capital allocation with the goal of optimizing returns long term
4
QIPCO Tornado Tower Doha, Qatar
*According to Engineering News-Record
June 6, 2013

AECOM Today — The Global Enterprise
Commercial,Data Centers,
Education,Government,Health Care,Hospitality,Sports and
Entertainment
Facilities
Professional Technical Services (PTS) Management Support Services (MSS)
Leverage global end-to-end service platform and diversification across services, end markets, geographies and funding sources.
Transportation Environmental Power, Energyand Mining
Cyber Support, Contingency Support,
Information Management,International Development,
Linguistics,Logistics and Field Services,Operations and Maintenance,National Security Programs
Aviation,Highways and
Bridges, Freight Rail,
Transit,Ports and
Marine
Chemicals/Pharmaceutical,
Government,Manufacturing,
Water,Wastewater
Power/ElectricUtilities,
Hydropower,Geothermal,T&D, Wind
andSolar, Mining,
Oil & Gas
5 June 6, 2013
OVER 30 MARKET SECTORS140+ COUNTRIES 2 SEGMENTS

Diversified Geographies, End Markets, Funding Sources and Services
6 June 6, 2013
Services
Planning ConsultingArchitecture
and Engineering
Design
Operations and
Maintenance
Program/ Construction Management
Cyber Security/I.T.
Services
Logistics/ Support Services
Notes: Estimated funding sources and end markets based on Q2 FY13 gross revenue. Estimated geographies based on Q2 FY13 net service revenue where work is performed.
Geographies
24%
51%
25%
Americas
Asia-Pacific
EMEA
End Markets
11%10%
28%31%
20%Power,Energy & Mining
Environmental
TransportationFacilities
MSS
Funding Sources
24%
19%
18%
39%
Private
Non-U.S. Government
U.S. State/Local
U.S. Federal

Agenda
7
1. AECOM Today
2. Market Opportunities and Outlook
3. Financial Discipline
4. Key Takeaways
5. Appendix
Kingdom Center, Riyadh, Kingdom of Saudi Arabia
June 6, 2013

AECOM Long-Term Goals and Objectives
1. Increase shareholder value through balanced capital allocation and financial discipline.
2. Increase mix of high-margin technical and construction services.
3. Five-year plan driven predominantly by organic growth, and strategic acquisitions.
4. Increase mix of private sector clients.
5. Increase penetration in top 100 private and multinational clients.
6. Increase revenue and profit from emerging markets in Africa, China, India, the Middle East, Eastern Europe, Latin America and natural-resource-rich economies.
8
Sutong Bridge, Jiangsu, China
Los Angeles International Airport, California, U.S.A.
Cleveland Clinic Rendering, Abu Dhabi, U.A.E.
June 6, 2013

Catalysts for Growth: Strong Industry Fundamentals
175 190235
330 370 385425
490
1990 2000 2008 2015 2020 2025 2030 2035
Demand for Natural Resources(World energy consumption, quadrillion Btus)
OECD Non-OECD
$50 TRILLION
Source: OECD estimate for investment in roads, water, electricity, telecommunications and rail in OECD countries up to 2030
Aging InfrastructureEstimated investment needed in developed countries:
31
4954
1990 2011 2016
Emerging Markets(% of world GDP)
Source: U.S. Energy Information AdministrationSource: International Monetary FundSource: United Nations
0.40.5
0.70.8
0.4
01234567
2010 China India OtherAsia
Africa RoW 2050
Urbanization(Urban population, billions of people)
9
+3 billion people in cities
June 6, 2013

Large and Growing Infrastructure Spend Across All Regions
10
Americas
• Annual Expenditure: $1.1 trillion
• 5-year CAGR: 5%*
Europe, Middle East & Africa
• Annual Expenditure: $1.3 trillion
• 5-year CAGR: 7%*
Asia-Pacific
• Annual Expenditure: $2.1 trillion
• 5-year CAGR: 9%*
*CAGR (2012-2017) expenditures based on entire regions. Sources: Business Monitor, Global Insight and AECOM estimates
June 6, 2013

Agenda
1. AECOM Today
2. Market Opportunities and Outlook
3. Financial Discipline
4. Key Takeaways
5. Appendix
11
Kingdom Center, Riyadh, Kingdom of Saudi Arabia
June 6, 2013

Financial Overview: Track Record and Long-Term Goals
12
Key ObjectivesTrack Record (2006-2012 CAGR1)
1 AECOM’s initial public offering occurred in May 2007. Compound annual growth shown for revenue, EPS, and backlog based on 2006-2012. FY12 results exclude goodwill impairment impact. 2 EBITDA/Net Service Revenue, both are non-GAAP measures. These results are from continuing operations. Cumulative EBITDA margin improvement shown from 2006-2012. 3 Based on earnings per share from continuing operations. 4 Free cash flow (FCF) is defined as cash flow from operations less capital expenditures and is a non-GAAP measure.
EBITDA Margin2
+280 bps
EPS3 +21%
Backlog +22%
Revenue +16%
June 6, 2013
Optimal Balance of Growth, Profitability and Liquidity
Increase EBITDA Margin2
MARGINS
Annual FCF4 equal to or greater than
net income. $1.3-$1.8bn in
cumulative FCF FY2013-FY2017
CASH FLOW
Balanced capital allocation.
At least 50% of FCF returned to
shareholders FY2013-FY2014
CASH FLOW
FY13 Q2 up 31bp YoY, 139 bp QoQ
FY13 YTD FCF $128MM
FY13 YTD invested $238MM to
repurchase 10MM shares

Improve Operating Leverage and Efficiency: Cost Containment
13
Goals
• Cost optimization supports margin improvement.
• Broad-based culture of financial literacy and cost discipline.
ActionsRationalized headcount.
Consolidating real estate footprint.
Rigorous controls drive decline in travel expenses.
Procurement savings through online tools and contract renewals.
June 6, 2013

Improve Operating Leverage and Efficiency: Project Execution
14
Goals• Reduce cost and schedule overruns.
Improve customer satisfaction.
Drive project margin expansion.
Actions• Online project-monitoring tool and standard KPIs
implemented across all geographies.
• Enterprise Project Management Office set up to facilitate consistency of project management practice throughout AECOM.
Consistent global accreditation program and project management training program rolled out.
Created project management career pathway.
KPIs restructured.
June 6, 2013

72%
73%
74%
75%
76%
77%
2009 2010 2011 2012
Utilization
Operating Leverage and Efficiency Drives Higher Utilization
15
Goals• Ability to rapidly adjust resource levels to match realties
of markeplace.
• Drive higher utilization on a consolidated basis.
ActionsRigorous operational plan to combat global recession.
300 basis point improvement in consolidated utilization aided by more optimized project delivery and support processes.
June 6, 2013
*Represents utilization improvement as of 2012

Pathway to Increase in EBITDA Margins
16
Key Drivers
• Operating leverage and efficiency
• Higher-margin business mix
• Topline growth
June 6, 2013

Cash Flow Inflection
17
1 Free cash flow (FCF) is defined as cash flow from operations less capital expenditures and is a non-GAAP measure. Free cash flow conversion is defined as free cash flow as a percentage of net income prior to deduction of noncontrolling interests. FY11 amount excludes deferred compensation plan termination ($90 million) and associated excess tax benefits ($58 million). FY12 amount excludes goodwill impairment impact.
71%
142% 139% 134%
FY11 FY12 Q1 FY13 Q2 FY13
Free CashFlow Conversion1
June 6, 2013
• Significant cash flow conversion. FY13 Q2 – 4th consecutive quarter of FCF in excess of net income.
• Expect $1.3 billion to $1.8 billion in cumulative FCF over the next five years (FY13-FY17).
• Compensation KPIs support increased focus on cash flow.

Balanced Capital Allocation Priorities
Organic and acquisitive investments that enable our strategy and generate attractive long-term returns.
Ample liquidity and strong balance sheet.
Deleverage when appropriate.
Share repurchase.
18
Target to return at least 50% of FCF to shareholders over next two years (FY13-FY14).
June 6, 2013

Organic Investments: Growing with Top Multinational Clients (MNCs)
• Top MNCs continue to accelerate capital expenditures.
Corporate CapEx expected to increase to $1.5 trillion, estimated 10%, or $150bn, is addressable by AECOM.
Trends align with AECOM’s strengths.
• Clients now require consistent delivery across global platform.
• Infrastructure development key to success.
• AECOM investments focused on expanding offering in key core markets.
19
Industrial client: AECOM in 17 countries
Mining client: AECOM in 5 countriesOil & Gas client: AECOM in 21 countries
Note: Each symbol represents a country where AECOM has delivered one or more projects for the specified MNC client.
BKS
June 6, 2013

Recent Acquisitions: Emerging Markets
Targeting emerging markets in Africa, China, India, the Middle East, Eastern Europe, Latin America and natural-resource-rich economies.
• Acquisitions to satisfy one or both of the following criteria:Provide technical capability that can be driven across our global platform orProvide geographic base from which we can expand and offer our global services
• First half of fiscal 2013: Closed on three strategic acquisitions that bolster our presence in Africa, Eastern Europe, the U.K. and Southeast Asia. Acquisitions added construction services and multi-discipline engineering capabilities.
20 June 6, 2013

Share Repurchase
Since August 2011, we have repurchased 22 million shares, or 19% of total outstanding.
As of May 7, 2013, $500 million available for repurchase. Brings total authorized since August 2011 to $1 billion.
Cumulative $1bn in share repurchase authorizations will retire about 30% of AECOM stock.
21
Share repurchase remains current investment priority.
Since FY11, returned ~71% of FCF1 to shareholders.
1 Free cash flow (FCF) is defined as cash flow from operations less capital expenditures and is a non-GAAP measure. Percentage of free cash flow returned to shareholders is defined as share repurchase expenditures divided by free cash flow. FY11 amount excludes deferred compensation plan termination ($90 million) and associated excess tax benefits ($58 million).
June 6, 2013

Fiscal 2013 Outlook – as of May 7,2013
EPS range of $2.40-$2.50.• FY13 EBITDA margin target of 9.5%• Currency translation headwinds• Continued slow conversion of backlogFree cash flow equal to or greater than net income.
22
Guidance assumptions:• $21 million of amortization of acquired intangibles
expense. • $75 million of depreciation expense. • $43 million of interest expense.• 103 million share count reflects purchases through
the end of Q2 FY13.• Effective tax rate of 27% (inclusive of non-controlling
interest deduction).
$1.15
$1.41
$1.70
$2.05
$2.33 $2.30
$2.50
2007 2008 2009 2010 2011 2012 2013E
Diluted EPS*
*From continuing operations. 6-year CAGR based on midpoint of 2013E EPS range.
Note: 2012 results exclude goodwill impairment and related tax benefit. All comparisons are year over year unless noted otherwise.
$2.40-
June 6, 2013

Agenda
23
1. AECOM Today
2. Market Opportunities and Outlook
3. Financial Discipline
4. Key Takeaways
5. Appendix
Kingdom Center, Riyadh, Kingdom of Saudi Arabia
June 6, 2013

Key Takeaways
24
• Attractive market opportunities supported by strong, long-term fundamentals.
• AECOM well positioned to capture these opportunities given our market leadership and client-centric global delivery capabilities.
Organic Growth Opportunities
• Clear path to increased EBITDA margins.
• Free cash flow equal to or in excess of net income.
FinancialDiscipline
• $1.3-$1.8bn in cumulative free cash flow over the next five years. (FY2013-FY2017).
• Capital allocation supports:Organic investments in high-growth markets, expanding business with MNCs, and alternative delivery.Targeted high-return M&A.Current priority remains returning 50% of FCF to shareholders during FY2013-FY2014.
Balanced Capital Allocation
June 6, 2013

Thank You!
25
140+Serving clients in more
than 140 countries
450+Over 450 officesaround the world
45K+Over 45,000 dedicated professionals globally
$8.2bn$8.2 billion in revenue
reported LTM March 2013
Profitable Growth • Operational Excellence • Capital Efficiency
June 6, 2013

Agenda
26
1. AECOM Today
2. Market Opportunities and Outlook
3. Financial Discipline
4. Key Takeaways
5. Appendix
Kingdom Center, Riyadh, Kingdom of Saudi Arabia
June 6, 2013

27
• Careful stewardship of business drives earnings growth despite macroeconomic headwinds.
• Persistent focus on cash and liquidity gives us flexibility to invest in profitable growth opportunities while also returning cash to shareholders.
$17.1 billion in backlog with $2 billion in new wins.
Improved profitability.• Operating and EBITDA margins up year over year and sequentially.
Fourth consecutive quarter of free cash flow in excess of net income.
Disciplined capital allocation.• Repurchased 2 million shares• Acquired new capabilities• Invested in organic growth opportunities
Reaffirm FY13 EPS guidance of $2.40-$2.50.
2 SEGMENTS
140+ COUNTRIES
OVER 30MARKET SECTORS
AECOM Fiscal Year 2013 Second-Quarter Highlights
June 6, 2013

Q2 FY13 Performance
28
(in millions, except EPS, margins, and tax rate)
Q2 Percent Change
Q2 FY12 Q1 FY13 Q2 FY13 Sequential YoY Comments
Gross Revenue $2,011 $2,017 $1,990 (1.4%) (1.1%)
Net Service Revenue(1) $1,290 $1,245 $1,252 0.5% (2.9%) YoY decline driven by mining slowdown in Australia and declines in the Americas.
Op. Income $73 $62 $80 29.9% 9.9%
Op. Income Margin(2) 5.7% 5.0% 6.4% 145bps 75bps Increase driven by improvements in cost and efficiency.
EBITDA Margin(3) 7.9% 6.8% 8.2% 139bps 31bps
Tax Rate(4) 25.5% 25.0% 20.6% (440bps) (490bps) Favorable impact of reenactment of U.S. federal R&D tax credits.
Net Income(5) $49 $38 $54 41.2% 9.8%
Diluted EPS(5) $0.43 $0.36 $0.53 47.2% 23.3%
Diluted Avg. Shares 114.3 105.5 101.8 (3.5%) (10.9%) 2 million shares repurchased in Q2.
Free Cash Flow(6) ($2) $54 $74 35.8% NM 4th consecutive quarter of FCF in excess of net income.
1 Net Service Revenue is a non-GAAP measure. 2 Operating Income/Net Service Revenue (non-GAAP). 3 Both EBITDA and Net Service Revenue are non-GAAP measures. 4 Inclusive of non-controlling interest deduction. 5 Attributable to AECOM. 6 Free cash flow is defined as cash flow from operations less capital expenditures and is a non-GAAP measure. Note: All comparisons are year over year unless noted otherwise.
June 6, 2013

Strong Cash Flow and Balance Sheet
29
(in millions, except Net Debt/EBITDA)
Q2 Percent Change
Q2 FY12 Q1 FY13 Q2 FY13 Sequential YoY Comments
Free Cash Flow(1) ($2) $54 $74 35.8% NM 4th consecutive quarter of FCF in excess of net income.
Cash and Equivalents $466 $591 $628 6.2% 34.8%
Total Debt $1,261 $1,233 $1,291 4.7% 2.4%
Net Debt(2) $795 $642 $663 3.3% (16.6%)
Net Debt/EBITDA(2) 1.6x 1.3x 1.4x 7.7% (12.5%) Below target range of 1.5-2.0x.
1 Free cash flow is defined as cash flow from operations less capital expenditures and is a non-GAAP measure.2 Net Debt and EBITDA are non-GAAP measures. Net Debt = Total Debt less cash and cash equivalents. EBITDA is a trailing 12-month figure.Note: All comparisons are year over year unless noted otherwise.
June 6, 2013

Segment Results — Professional Technical Services (PTS)
30
PTS: Delivers planning, consulting, architecture and engineering design, and program and construction management services to institutional, commercial and public sector clients worldwide.
(in millions, except margin)
Q2 Percent Change
Q2 FY12 Q1 FY13 Q2 FY13 Seq. YoY
Gross Revenue $1,801 $1,771 $1,766 (0.3%) (2.0%)
Net Service Revenue(1) $1,163 $1,094 $1,110 1.5% (4.5%)
Op. Income $91 $74 $96 29.5% 5.9%
Op. Income Margin(2) 7.8% 6.8% 8.7% 187bps 85bps
Highlights:• Year-over-year and sequential improvement in
margins led by improvement in Australia.• Ex Australia — NSR flat, operating income up 28%
and margins up 215 bps.• Improved top and bottom line performance in Australia
in second half of FY13.
1 Net Service Revenue is a non-GAAP measure. 2 Operating Income/Net Service Revenue (non-GAAP).Note: All comparisons are year over year unless noted otherwise.
June 6, 2013

Segment Results — Management Support Services (MSS)
31
MSS: Provides program and facilities management and maintenance, training, logistics, consulting, technical assistance and systems integration services, primarily for agencies of the U.S. government.
(in millions, except margin)
Q2 Percent Change
Q2 FY12 Q1 FY13 Q2 FY13 Sequential YoY
Gross Revenue $210 $246 $224 (9.1%) 6.6%
Net Service Revenue(1) $126 $151 $142 (6.4%) 12.0%
Op. Income $2 $10 $11 18.0% 462.5%
Op. Income Margin(2) 1.6% 6.4% 8.0% 166bps 642bps
Highlights:• Improved growth, profitability and liquidity.• Increase in operating profit on improved project
performance and cost control.• DSOs improved 42 days year over year.• Positioned to double full-year operating income year
over year.
1 Net Service Revenue is a non-GAAP measure. 2 Operating Income/Net Service Revenue (non-GAAP).Note: All comparisons are year over year unless noted otherwise.
June 6, 2013

Healthy Book of Future Business & Revenue Visibility
32
Q2 FY13 Highlights:• $17.1 billion in backlog — flat sequentially. • $2.0 billion of new wins driven by
commercial construction in North America.• Book-to-burn2 of 1.0x.• Backlog = 2.1x last 12 months’ revenues.
$8.4 $9.0 $9.5
$7.6$8.1 $7.6
Q2 FY12 Q1 FY13 Q2 FY13
Contracted Backlog Awarded Backlog
1 Indefinite delivery indefinite quantity (IDIQ) book of business estimate is probability-weighted. IDIQs are a type of contracting vehicle that provides for an indefinite quantity of services during a fixed period of time, most often used for service contracts and engineering services.2 Book-to-burn is defined as the amount of new business divided by the gross revenue recognized during the period.
Backlog ($ billions)
$16.0$17.1 $17.1
Book of Business ($BN) Mar. 2013
Backlog $17
Unconsolidated JV backlog + JV option years 2
IDIQs1 8
Total Book of Business $27
June 6, 2013

Diversified Business Profile
33
DoD O&M18%
Intel/ Sensitive Programs
15%
DoD OCO33%
DoS10%
Other Agencies
24%Oil, Gas & Mining 30%
Commercial Buildings
22%Industrial
12%
Utilities 11%
Sports and Leisure 6%
Health Care 5% NY
32%
CA16%FL
7%TX5%
MA3%
Australia 31%
Canada 27%
Asia 20%
Europe 12%
Middle East &Africa 10%
U.S. Private
21%
Non-U.S. Private
18%Non-U.S.
Government24%
U.S. Federal
18%State/Local19%
Non-U.S. Government Mix
Non-U.S. Private Mix
U.S. Private Mix
U.S. Federal MixState/Local Mix
Diversified Funding Sources
Other2 14%
1 Includes Transit and Aviation. 2 Includes Education, Real Estate Development and Transportation. Sources: Estimated funding sources based on Q2:13 gross revenues.
Commercial Building
37%
Health Care 15%
Utilities 10%
Industrial 9%
Oil, Gas & Mining 6%
Education 6%
Sports and Leisure 3%
Other1 10%
Private 39%
Public 61%
42 Add. States &
Territories 37%
Residential 4%
June 6, 2013

Facilities End Market: 31% of Revenue
World Trade Center — New York, New York, U.S.A.• Key role in the rebuilding efforts at the site, including
construction management of One WTC, the tallest building in New York.
• The company also is providing a variety of services for the site’s office towers 3, 4, and 7, the vehicle security center, transportation hub, retail space and overall WTC district site and streetscape design.
Spartak Football Stadium — Moscow, Russia• Engineering design and project management for the
stadium — the first custom-designed venue for Spartak Moscow since the club’s founding in 1935.
• The stadium played a key role in Russia’s winning bid to host the 2018 FIFA World Cup.
Notes: Estimated end markets based on Q2 FY13 gross revenue.
34 June 6, 2013
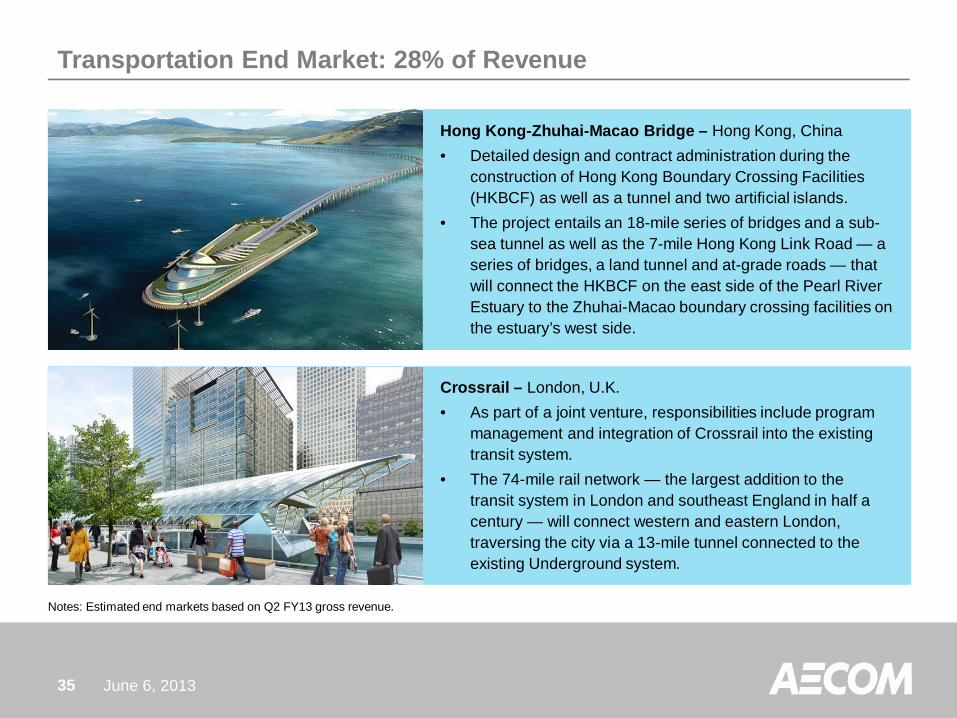
Transportation End Market: 28% of Revenue
Hong Kong-Zhuhai-Macao Bridge – Hong Kong, China• Detailed design and contract administration during the
construction of Hong Kong Boundary Crossing Facilities (HKBCF) as well as a tunnel and two artificial islands.
• The project entails an 18-mile series of bridges and a sub-sea tunnel as well as the 7-mile Hong Kong Link Road — a series of bridges, a land tunnel and at-grade roads — that will connect the HKBCF on the east side of the Pearl River Estuary to the Zhuhai-Macao boundary crossing facilities on the estuary’s west side.
Crossrail – London, U.K.• As part of a joint venture, responsibilities include program
management and integration of Crossrail into the existing transit system.
• The 74-mile rail network — the largest addition to the transit system in London and southeast England in half a century — will connect western and eastern London, traversing the city via a 13-mile tunnel connected to the existing Underground system.
Notes: Estimated end markets based on Q2 FY13 gross revenue.
35 June 6, 2013
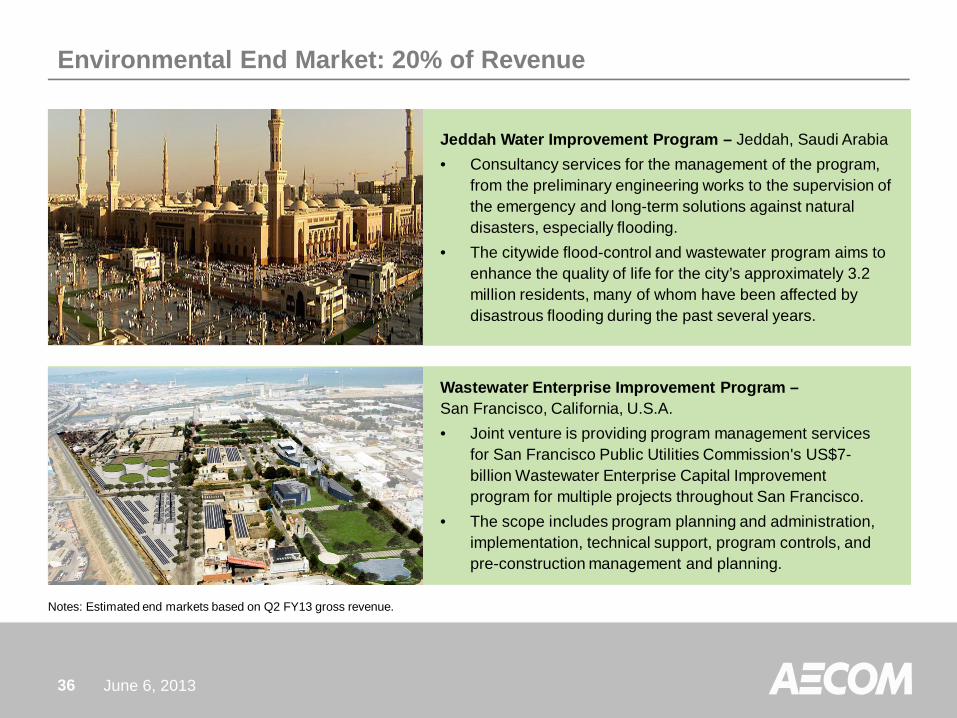
Environmental End Market: 20% of Revenue
Jeddah Water Improvement Program – Jeddah, Saudi Arabia• Consultancy services for the management of the program,
from the preliminary engineering works to the supervision of the emergency and long-term solutions against natural disasters, especially flooding.
• The citywide flood-control and wastewater program aims to enhance the quality of life for the city’s approximately 3.2 million residents, many of whom have been affected by disastrous flooding during the past several years.
Wastewater Enterprise Improvement Program –San Francisco, California, U.S.A.• Joint venture is providing program management services
for San Francisco Public Utilities Commission's US$7-billion Wastewater Enterprise Capital Improvement program for multiple projects throughout San Francisco.
• The scope includes program planning and administration, implementation, technical support, program controls, and pre-construction management and planning.
Notes: Estimated end markets based on Q2 FY13 gross revenue.
36 June 6, 2013

Power, Energy and Mining End Market: 10% of Revenue
Grand Inga Hydroelectric Development –Democratic Republic of Congo• Scope of work includes the preparation of the pre-feasibility
and feasibility reports for the development of hydroelectric facilities and electricity-transmission networks.
• Located on the Congo River, Grand Inga currently is the largest hydroelectric project in the world, with a total potential of nearly 39,000 MW.
PSE&G Northeast Grid Transmission System –New Jersey, U.S.A.• Program management services include: technical
leadership, client interface, administration and project control of licensing and permitting, engineering/design, procurement, construction, public outreach and land/properties management for overhead transmission, underground transmission, substations and associated system improvements.
Notes: Estimated end markets based on Q2 FY13 gross revenue.
37 June 6, 2013

Government Services End Market: 11% of Revenue
Department of Energy’s Nevada Test Site – Nevada, U.S.A.• As a key partner in managing and operating the site, oversee
remote field experiments, multiple laboratory operations, waste management systems, and the design and fabrication of electronic, mechanical and structural systems.
• AECOM’s legacy operations provided initial surveys and recommendations for the site’s original testing facilities built in the 1950s.
United States Air Force Information Network – U.S.A.• Manages the client’s enterprise boundary control, cyber
defense applications, core services and information-assurance-associated applications for 65,000 users.
• This is the first U.S. Air Force operation to develop IPSec tunneling to allow domain controllers to communicate across an entire enterprise network.
Notes: Estimated end markets based on Q2 FY13 gross revenue.
38 June 6, 2013


